Immigrants from Nicaragua Self-Care Disability
COMPARE
Immigrants from Nicaragua
Select to Compare
Self-Care Disability
Immigrants from Nicaragua Self-Care Disability
2.7%
SELF-CARE DISABILITY
0.2/ 100
METRIC RATING
265th/ 347
METRIC RANK
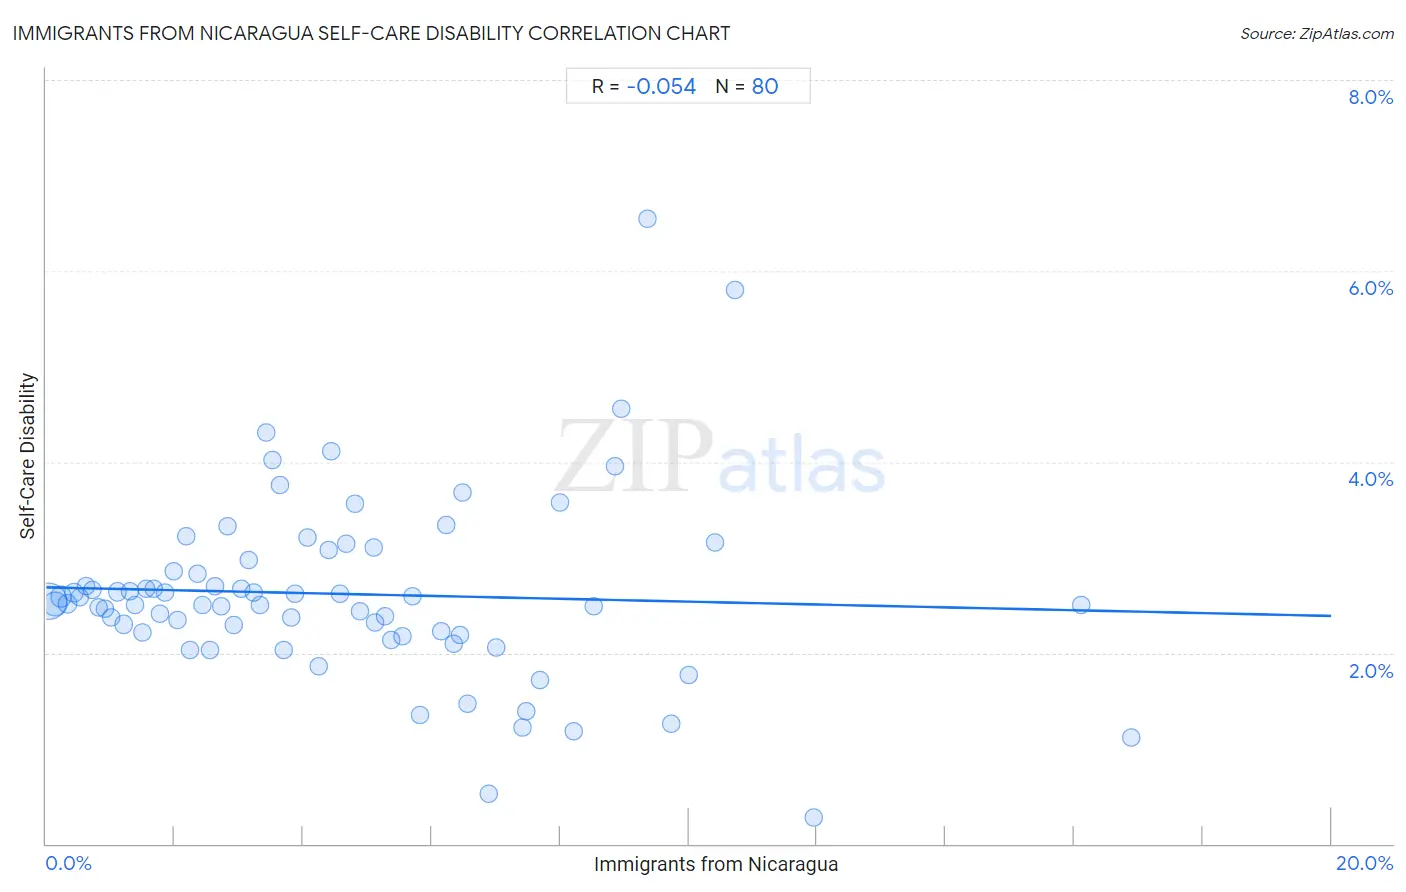
Immigrants from Nicaragua Self-Care Disability Correlation Chart
The statistical analysis conducted on geographies consisting of 236,309,405 people shows a slight negative correlation between the proportion of Immigrants from Nicaragua and percentage of population with self-care disability in the United States with a correlation coefficient (R) of -0.054 and weighted average of 2.7%. On average, for every 1% (one percent) increase in Immigrants from Nicaragua within a typical geography, there is a decrease of 0.015% in percentage of population with self-care disability.
It is essential to understand that the correlation between the percentage of Immigrants from Nicaragua and percentage of population with self-care disability does not imply a direct cause-and-effect relationship. It remains uncertain whether the presence of Immigrants from Nicaragua influences an upward or downward trend in the level of percentage of population with self-care disability within an area, or if Immigrants from Nicaragua simply ended up residing in those areas with higher or lower levels of percentage of population with self-care disability due to other factors.
Demographics Similar to Immigrants from Nicaragua by Self-Care Disability
In terms of self-care disability, the demographic groups most similar to Immigrants from Nicaragua are Immigrants from Cambodia (2.7%, a difference of 0.050%), Immigrants from Iran (2.7%, a difference of 0.16%), Immigrants from Latin America (2.7%, a difference of 0.22%), Yaqui (2.7%, a difference of 0.25%), and Shoshone (2.7%, a difference of 0.29%).
| Demographics | Rating | Rank | Self-Care Disability |
| Nonimmigrants | 0.3 /100 | #258 | Tragic 2.6% |
| Immigrants from Belarus | 0.2 /100 | #259 | Tragic 2.6% |
| Chippewa | 0.2 /100 | #260 | Tragic 2.6% |
| Arapaho | 0.2 /100 | #261 | Tragic 2.6% |
| Shoshone | 0.2 /100 | #262 | Tragic 2.7% |
| Immigrants from Latin America | 0.2 /100 | #263 | Tragic 2.7% |
| Immigrants from Iran | 0.2 /100 | #264 | Tragic 2.7% |
| Immigrants from Nicaragua | 0.2 /100 | #265 | Tragic 2.7% |
| Immigrants from Cambodia | 0.1 /100 | #266 | Tragic 2.7% |
| Yaqui | 0.1 /100 | #267 | Tragic 2.7% |
| Immigrants from Mexico | 0.1 /100 | #268 | Tragic 2.7% |
| U.S. Virgin Islanders | 0.1 /100 | #269 | Tragic 2.7% |
| Immigrants from Micronesia | 0.1 /100 | #270 | Tragic 2.7% |
| Trinidadians and Tobagonians | 0.1 /100 | #271 | Tragic 2.7% |
| Immigrants from Laos | 0.1 /100 | #272 | Tragic 2.7% |
Immigrants from Nicaragua Self-Care Disability Correlation Summary
| Measurement | Immigrants from Nicaragua Data | Self-Care Disability Data |
| Minimum | 0.043% | 0.27% |
| Maximum | 16.9% | 6.5% |
| Range | 16.8% | 6.3% |
| Mean | 4.6% | 2.6% |
| Median | 3.8% | 2.5% |
| Interquartile 25% (IQ1) | 1.9% | 2.2% |
| Interquartile 75% (IQ3) | 6.5% | 2.9% |
| Interquartile Range (IQR) | 4.5% | 0.71% |
| Standard Deviation (Sample) | 3.5% | 0.96% |
| Standard Deviation (Population) | 3.5% | 0.96% |
Correlation Details
| Immigrants from Nicaragua Percentile | Sample Size | Self-Care Disability |
[ 0.0% - 0.5% ] 0.043% | 137,855,092 | 2.5% |
[ 0.0% - 0.5% ] 0.14% | 42,565,621 | 2.5% |
[ 0.0% - 0.5% ] 0.23% | 22,016,134 | 2.6% |
[ 0.0% - 0.5% ] 0.33% | 9,307,241 | 2.5% |
[ 0.0% - 0.5% ] 0.43% | 6,563,063 | 2.6% |
[ 0.5% - 1.0% ] 0.52% | 3,481,172 | 2.6% |
[ 0.5% - 1.0% ] 0.62% | 2,788,859 | 2.7% |
[ 0.5% - 1.0% ] 0.72% | 1,656,770 | 2.7% |
[ 0.5% - 1.0% ] 0.81% | 1,762,520 | 2.5% |
[ 0.5% - 1.0% ] 0.91% | 969,271 | 2.5% |
[ 1.0% - 1.5% ] 1.01% | 680,913 | 2.4% |
[ 1.0% - 1.5% ] 1.12% | 611,167 | 2.6% |
[ 1.0% - 1.5% ] 1.21% | 500,797 | 2.3% |
[ 1.0% - 1.5% ] 1.30% | 498,553 | 2.7% |
[ 1.0% - 1.5% ] 1.38% | 294,776 | 2.5% |
[ 1.0% - 1.5% ] 1.50% | 469,564 | 2.2% |
[ 1.5% - 2.0% ] 1.56% | 264,687 | 2.7% |
[ 1.5% - 2.0% ] 1.68% | 301,897 | 2.7% |
[ 1.5% - 2.0% ] 1.77% | 38,784 | 2.4% |
[ 1.5% - 2.0% ] 1.85% | 215,724 | 2.6% |
[ 1.5% - 2.0% ] 1.98% | 60,301 | 2.9% |
[ 2.0% - 2.5% ] 2.05% | 266,876 | 2.3% |
[ 2.0% - 2.5% ] 2.17% | 29,198 | 3.2% |
[ 2.0% - 2.5% ] 2.23% | 59,190 | 2.0% |
[ 2.0% - 2.5% ] 2.35% | 44,312 | 2.8% |
[ 2.0% - 2.5% ] 2.42% | 248,977 | 2.5% |
[ 2.5% - 3.0% ] 2.55% | 173,321 | 2.0% |
[ 2.5% - 3.0% ] 2.62% | 67,155 | 2.7% |
[ 2.5% - 3.0% ] 2.72% | 55,241 | 2.5% |
[ 2.5% - 3.0% ] 2.82% | 22,823 | 3.3% |
[ 2.5% - 3.0% ] 2.92% | 103,539 | 2.3% |
[ 3.0% - 3.5% ] 3.03% | 142,707 | 2.7% |
[ 3.0% - 3.5% ] 3.16% | 133,929 | 3.0% |
[ 3.0% - 3.5% ] 3.23% | 118,950 | 2.6% |
[ 3.0% - 3.5% ] 3.33% | 21,213 | 2.5% |
[ 3.0% - 3.5% ] 3.43% | 176,909 | 4.3% |
[ 3.5% - 4.0% ] 3.52% | 226,831 | 4.0% |
[ 3.5% - 4.0% ] 3.64% | 4,209 | 3.8% |
[ 3.5% - 4.0% ] 3.69% | 96,536 | 2.0% |
[ 3.5% - 4.0% ] 3.81% | 4,987 | 2.4% |
[ 3.5% - 4.0% ] 3.87% | 80,755 | 2.6% |
[ 4.0% - 4.5% ] 4.06% | 60,592 | 3.2% |
[ 4.0% - 4.5% ] 4.24% | 50,106 | 1.9% |
[ 4.0% - 4.5% ] 4.40% | 44,062 | 3.1% |
[ 4.0% - 4.5% ] 4.44% | 496 | 4.1% |
[ 4.5% - 5.0% ] 4.58% | 63,650 | 2.6% |
[ 4.5% - 5.0% ] 4.67% | 444,748 | 3.1% |
[ 4.5% - 5.0% ] 4.80% | 49,347 | 3.6% |
[ 4.5% - 5.0% ] 4.88% | 105,852 | 2.4% |
[ 5.0% - 5.5% ] 5.09% | 47,065 | 3.1% |
[ 5.0% - 5.5% ] 5.11% | 30,980 | 2.3% |
[ 5.0% - 5.5% ] 5.28% | 45,620 | 2.4% |
[ 5.0% - 5.5% ] 5.36% | 1,604 | 2.1% |
[ 5.5% - 6.0% ] 5.54% | 85,736 | 2.2% |
[ 5.5% - 6.0% ] 5.69% | 14,698 | 2.6% |
[ 5.5% - 6.0% ] 5.83% | 309 | 1.3% |
[ 6.0% - 6.5% ] 6.14% | 5,049 | 2.2% |
[ 6.0% - 6.5% ] 6.22% | 16,776 | 3.3% |
[ 6.0% - 6.5% ] 6.34% | 867 | 2.1% |
[ 6.0% - 6.5% ] 6.44% | 34,335 | 2.2% |
[ 6.0% - 6.5% ] 6.47% | 59,121 | 3.7% |
[ 6.5% - 7.0% ] 6.56% | 457 | 1.5% |
[ 6.5% - 7.0% ] 6.89% | 740 | 0.53% |
[ 6.5% - 7.0% ] 7.00% | 443 | 2.1% |
[ 7.0% - 7.5% ] 7.41% | 297 | 1.2% |
[ 7.0% - 7.5% ] 7.46% | 469 | 1.4% |
[ 7.5% - 8.0% ] 7.68% | 924 | 1.7% |
[ 8.0% - 8.5% ] 8.00% | 475 | 3.6% |
[ 8.0% - 8.5% ] 8.21% | 1,194 | 1.2% |
[ 8.5% - 9.0% ] 8.53% | 40,278 | 2.5% |
[ 8.5% - 9.0% ] 8.86% | 34,742 | 4.0% |
[ 8.5% - 9.0% ] 8.96% | 54,873 | 4.6% |
[ 9.0% - 9.5% ] 9.37% | 630 | 6.5% |
[ 9.5% - 10.0% ] 9.73% | 514 | 1.3% |
[ 9.5% - 10.0% ] 10.00% | 2,041 | 1.8% |
[ 10.0% - 10.5% ] 10.40% | 8,989 | 3.2% |
[ 10.5% - 11.0% ] 10.73% | 289 | 5.8% |
[ 11.5% - 12.0% ] 11.95% | 778 | 0.27% |
[ 16.0% - 16.5% ] 16.11% | 19,399 | 2.5% |
[ 16.5% - 17.0% ] 16.89% | 296 | 1.1% |