Immigrants from Nicaragua Wage/Income Gap
COMPARE
Immigrants from Nicaragua
Select to Compare
Wage/Income Gap
Immigrants from Nicaragua Wage/Income Gap
23.0%
WAGE/INCOME GAP
99.9/ 100
METRIC RATING
79th/ 347
METRIC RANK
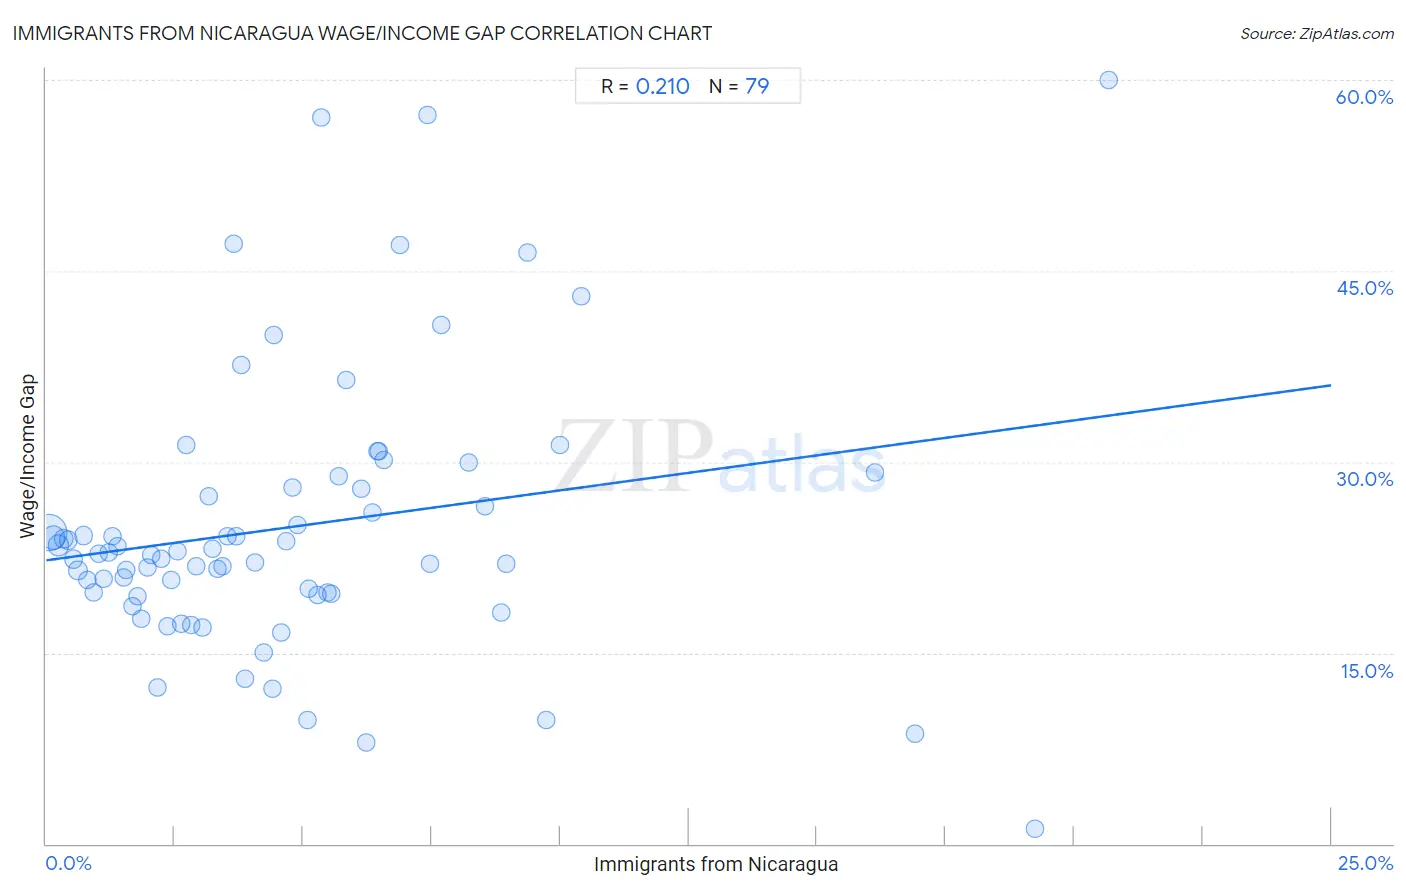
Immigrants from Nicaragua Wage/Income Gap Correlation Chart
The statistical analysis conducted on geographies consisting of 236,266,480 people shows a weak positive correlation between the proportion of Immigrants from Nicaragua and wage/income gap percentage in the United States with a correlation coefficient (R) of 0.210 and weighted average of 23.0%. On average, for every 1% (one percent) increase in Immigrants from Nicaragua within a typical geography, there is an increase of 0.55% in wage/income gap percentage.
It is essential to understand that the correlation between the percentage of Immigrants from Nicaragua and wage/income gap percentage does not imply a direct cause-and-effect relationship. It remains uncertain whether the presence of Immigrants from Nicaragua influences an upward or downward trend in the level of wage/income gap percentage within an area, or if Immigrants from Nicaragua simply ended up residing in those areas with higher or lower levels of wage/income gap percentage due to other factors.
Demographics Similar to Immigrants from Nicaragua by Wage/Income Gap
In terms of wage/income gap, the demographic groups most similar to Immigrants from Nicaragua are Salvadoran (23.0%, a difference of 0.070%), Nigerian (23.0%, a difference of 0.090%), African (22.9%, a difference of 0.19%), Ecuadorian (22.9%, a difference of 0.33%), and Fijian (22.9%, a difference of 0.34%).
| Demographics | Rating | Rank | Wage/Income Gap |
| Sub-Saharan Africans | 99.9 /100 | #72 | Exceptional 22.8% |
| Immigrants from Eastern Africa | 99.9 /100 | #73 | Exceptional 22.8% |
| Immigrants from Burma/Myanmar | 99.9 /100 | #74 | Exceptional 22.8% |
| Fijians | 99.9 /100 | #75 | Exceptional 22.9% |
| Ecuadorians | 99.9 /100 | #76 | Exceptional 22.9% |
| Africans | 99.9 /100 | #77 | Exceptional 22.9% |
| Nigerians | 99.9 /100 | #78 | Exceptional 23.0% |
| Immigrants from Nicaragua | 99.9 /100 | #79 | Exceptional 23.0% |
| Salvadorans | 99.9 /100 | #80 | Exceptional 23.0% |
| Bermudans | 99.8 /100 | #81 | Exceptional 23.1% |
| Central Americans | 99.8 /100 | #82 | Exceptional 23.1% |
| Immigrants from Africa | 99.8 /100 | #83 | Exceptional 23.2% |
| Cubans | 99.7 /100 | #84 | Exceptional 23.3% |
| Immigrants from Cambodia | 99.7 /100 | #85 | Exceptional 23.3% |
| Cheyenne | 99.7 /100 | #86 | Exceptional 23.3% |
Immigrants from Nicaragua Wage/Income Gap Correlation Summary
| Measurement | Immigrants from Nicaragua Data | Wage/Income Gap Data |
| Minimum | 0.043% | 1.2% |
| Maximum | 20.7% | 60.0% |
| Range | 20.6% | 58.8% |
| Mean | 4.7% | 24.9% |
| Median | 3.8% | 22.8% |
| Interquartile 25% (IQ1) | 1.8% | 19.6% |
| Interquartile 75% (IQ3) | 6.3% | 28.0% |
| Interquartile Range (IQR) | 4.5% | 8.4% |
| Standard Deviation (Sample) | 4.1% | 10.8% |
| Standard Deviation (Population) | 4.1% | 10.7% |
Correlation Details
| Immigrants from Nicaragua Percentile | Sample Size | Wage/Income Gap |
[ 0.0% - 0.5% ] 0.043% | 137,854,390 | 24.5% |
[ 0.0% - 0.5% ] 0.14% | 42,568,427 | 24.1% |
[ 0.0% - 0.5% ] 0.23% | 21,999,377 | 23.4% |
[ 0.0% - 0.5% ] 0.33% | 9,307,563 | 24.0% |
[ 0.0% - 0.5% ] 0.43% | 6,559,782 | 23.9% |
[ 0.5% - 1.0% ] 0.52% | 3,482,575 | 22.4% |
[ 0.5% - 1.0% ] 0.62% | 2,787,458 | 21.5% |
[ 0.5% - 1.0% ] 0.72% | 1,656,233 | 24.2% |
[ 0.5% - 1.0% ] 0.81% | 1,760,991 | 20.7% |
[ 0.5% - 1.0% ] 0.91% | 966,046 | 19.7% |
[ 1.0% - 1.5% ] 1.01% | 676,940 | 22.8% |
[ 1.0% - 1.5% ] 1.12% | 605,218 | 20.8% |
[ 1.0% - 1.5% ] 1.21% | 500,038 | 22.9% |
[ 1.0% - 1.5% ] 1.30% | 497,947 | 24.2% |
[ 1.0% - 1.5% ] 1.38% | 294,776 | 23.4% |
[ 1.0% - 1.5% ] 1.50% | 469,287 | 20.9% |
[ 1.5% - 2.0% ] 1.56% | 264,119 | 21.5% |
[ 1.5% - 2.0% ] 1.68% | 300,458 | 18.7% |
[ 1.5% - 2.0% ] 1.77% | 37,155 | 19.5% |
[ 1.5% - 2.0% ] 1.85% | 215,141 | 17.7% |
[ 1.5% - 2.0% ] 1.98% | 60,301 | 21.7% |
[ 2.0% - 2.5% ] 2.05% | 267,160 | 22.7% |
[ 2.0% - 2.5% ] 2.17% | 29,198 | 12.3% |
[ 2.0% - 2.5% ] 2.23% | 59,190 | 22.3% |
[ 2.0% - 2.5% ] 2.35% | 44,312 | 17.1% |
[ 2.0% - 2.5% ] 2.42% | 248,977 | 20.7% |
[ 2.5% - 3.0% ] 2.55% | 173,321 | 23.0% |
[ 2.5% - 3.0% ] 2.62% | 67,641 | 17.3% |
[ 2.5% - 3.0% ] 2.72% | 55,241 | 31.3% |
[ 2.5% - 3.0% ] 2.82% | 22,823 | 17.2% |
[ 2.5% - 3.0% ] 2.92% | 102,570 | 21.8% |
[ 3.0% - 3.5% ] 3.03% | 141,302 | 17.0% |
[ 3.0% - 3.5% ] 3.16% | 133,929 | 27.3% |
[ 3.0% - 3.5% ] 3.23% | 118,950 | 23.2% |
[ 3.0% - 3.5% ] 3.33% | 21,667 | 21.6% |
[ 3.0% - 3.5% ] 3.43% | 176,909 | 21.8% |
[ 3.5% - 4.0% ] 3.52% | 226,831 | 24.2% |
[ 3.5% - 4.0% ] 3.64% | 4,098 | 47.2% |
[ 3.5% - 4.0% ] 3.69% | 96,536 | 24.1% |
[ 3.5% - 4.0% ] 3.79% | 1,690 | 37.6% |
[ 3.5% - 4.0% ] 3.87% | 80,755 | 13.0% |
[ 4.0% - 4.5% ] 4.06% | 60,592 | 22.1% |
[ 4.0% - 4.5% ] 4.24% | 50,106 | 15.0% |
[ 4.0% - 4.5% ] 4.40% | 44,062 | 12.1% |
[ 4.0% - 4.5% ] 4.44% | 496 | 40.0% |
[ 4.5% - 5.0% ] 4.58% | 63,650 | 16.6% |
[ 4.5% - 5.0% ] 4.67% | 444,748 | 23.8% |
[ 4.5% - 5.0% ] 4.80% | 49,347 | 28.0% |
[ 4.5% - 5.0% ] 4.88% | 105,852 | 25.1% |
[ 5.0% - 5.5% ] 5.09% | 47,065 | 9.7% |
[ 5.0% - 5.5% ] 5.11% | 30,980 | 20.0% |
[ 5.0% - 5.5% ] 5.28% | 45,620 | 19.5% |
[ 5.0% - 5.5% ] 5.36% | 1,604 | 57.1% |
[ 5.0% - 5.5% ] 5.47% | 822 | 19.8% |
[ 5.5% - 6.0% ] 5.54% | 85,372 | 19.6% |
[ 5.5% - 6.0% ] 5.69% | 14,698 | 28.8% |
[ 5.5% - 6.0% ] 5.83% | 309 | 36.4% |
[ 6.0% - 6.5% ] 6.14% | 5,049 | 27.8% |
[ 6.0% - 6.5% ] 6.22% | 16,776 | 8.0% |
[ 6.0% - 6.5% ] 6.34% | 867 | 26.0% |
[ 6.0% - 6.5% ] 6.44% | 34,335 | 30.8% |
[ 6.0% - 6.5% ] 6.47% | 59,121 | 30.9% |
[ 6.5% - 7.0% ] 6.56% | 457 | 30.1% |
[ 6.5% - 7.0% ] 6.89% | 740 | 47.1% |
[ 7.0% - 7.5% ] 7.41% | 297 | 57.3% |
[ 7.0% - 7.5% ] 7.46% | 469 | 22.0% |
[ 7.5% - 8.0% ] 7.68% | 924 | 40.8% |
[ 8.0% - 8.5% ] 8.21% | 1,194 | 30.0% |
[ 8.5% - 9.0% ] 8.53% | 40,278 | 26.5% |
[ 8.5% - 9.0% ] 8.86% | 34,742 | 18.2% |
[ 8.5% - 9.0% ] 8.96% | 54,873 | 22.0% |
[ 9.0% - 9.5% ] 9.37% | 630 | 46.5% |
[ 9.5% - 10.0% ] 9.73% | 514 | 9.8% |
[ 9.5% - 10.0% ] 10.00% | 2,041 | 31.4% |
[ 10.0% - 10.5% ] 10.40% | 8,989 | 43.0% |
[ 16.0% - 16.5% ] 16.11% | 19,399 | 29.2% |
[ 16.5% - 17.0% ] 16.89% | 296 | 8.6% |
[ 19.0% - 19.5% ] 19.24% | 1,694 | 1.2% |
[ 20.5% - 21.0% ] 20.67% | 150 | 60.0% |