Immigrants from Nicaragua Disability Age 5 to 17
COMPARE
Immigrants from Nicaragua
Select to Compare
Disability Age 5 to 17
Immigrants from Nicaragua Disability Age 5 to 17
5.2%
DISABILITY | AGE 5 TO 17
99.5/ 100
METRIC RATING
84th/ 347
METRIC RANK
Immigrants from Nicaragua Disability Age 5 to 17 Correlation Chart
The statistical analysis conducted on geographies consisting of 235,611,725 people shows a weak positive correlation between the proportion of Immigrants from Nicaragua and percentage of population with a disability between the ages 5 and 17 in the United States with a correlation coefficient (R) of 0.203 and weighted average of 5.2%. On average, for every 1% (one percent) increase in Immigrants from Nicaragua within a typical geography, there is an increase of 0.22% in percentage of population with a disability between the ages 5 and 17.
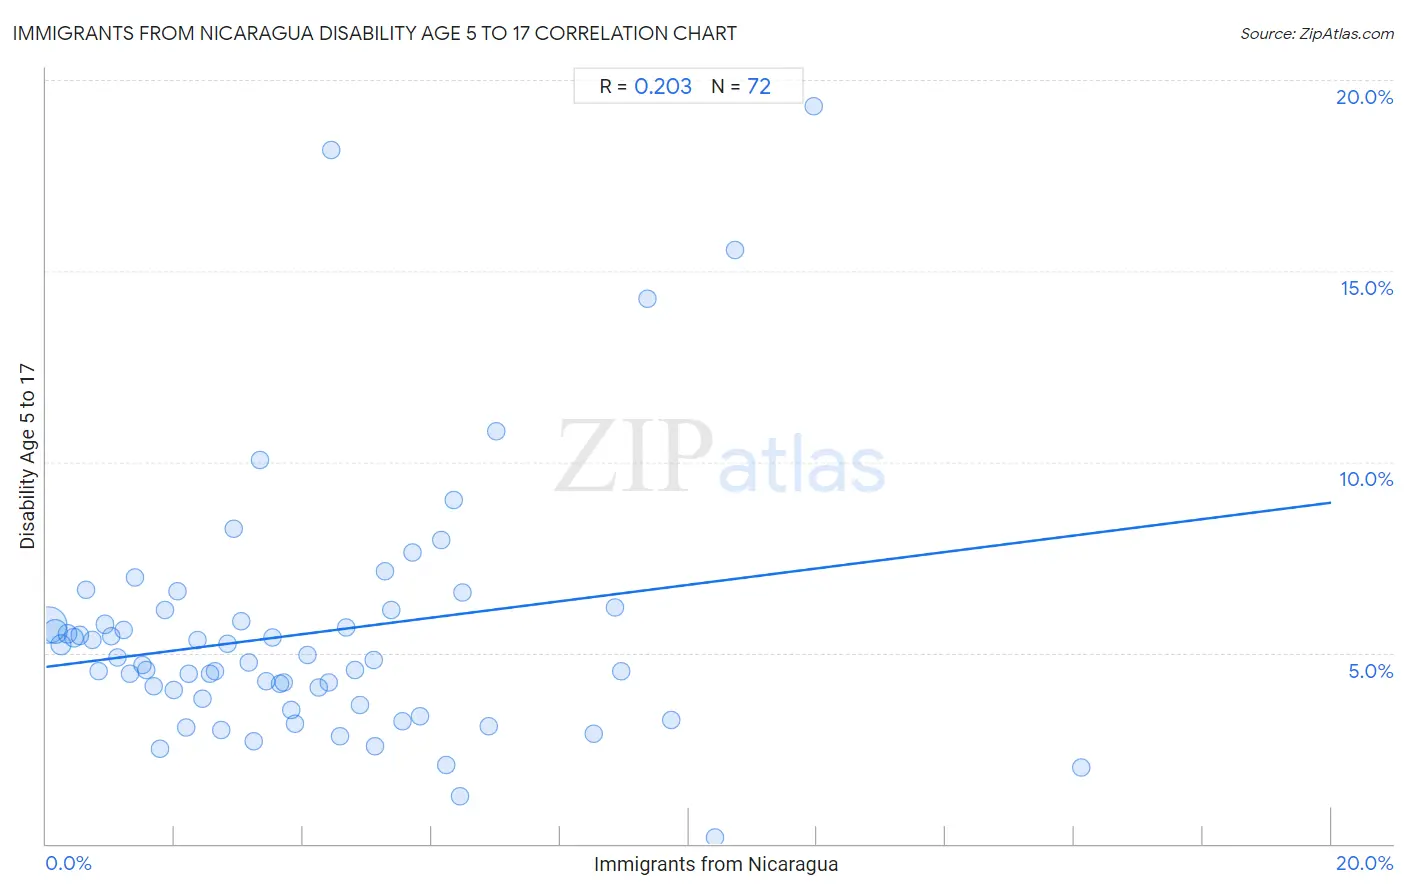
It is essential to understand that the correlation between the percentage of Immigrants from Nicaragua and percentage of population with a disability between the ages 5 and 17 does not imply a direct cause-and-effect relationship. It remains uncertain whether the presence of Immigrants from Nicaragua influences an upward or downward trend in the level of percentage of population with a disability between the ages 5 and 17 within an area, or if Immigrants from Nicaragua simply ended up residing in those areas with higher or lower levels of percentage of population with a disability between the ages 5 and 17 due to other factors.
Demographics Similar to Immigrants from Nicaragua by Disability Age 5 to 17
In terms of disability age 5 to 17, the demographic groups most similar to Immigrants from Nicaragua are Immigrants from France (5.2%, a difference of 0.070%), Bulgarian (5.2%, a difference of 0.070%), Immigrants from St. Vincent and the Grenadines (5.2%, a difference of 0.11%), Eastern European (5.2%, a difference of 0.15%), and Immigrants from Sweden (5.2%, a difference of 0.16%).
| Demographics | Rating | Rank | Disability Age 5 to 17 |
| Immigrants from Kazakhstan | 99.6 /100 | #77 | Exceptional 5.2% |
| Immigrants from Cuba | 99.6 /100 | #78 | Exceptional 5.2% |
| Afghans | 99.6 /100 | #79 | Exceptional 5.2% |
| Sri Lankans | 99.6 /100 | #80 | Exceptional 5.2% |
| Native Hawaiians | 99.6 /100 | #81 | Exceptional 5.2% |
| Immigrants from Sweden | 99.5 /100 | #82 | Exceptional 5.2% |
| Immigrants from France | 99.5 /100 | #83 | Exceptional 5.2% |
| Immigrants from Nicaragua | 99.5 /100 | #84 | Exceptional 5.2% |
| Bulgarians | 99.4 /100 | #85 | Exceptional 5.2% |
| Immigrants from St. Vincent and the Grenadines | 99.4 /100 | #86 | Exceptional 5.2% |
| Eastern Europeans | 99.4 /100 | #87 | Exceptional 5.2% |
| Immigrants from Croatia | 99.4 /100 | #88 | Exceptional 5.2% |
| Immigrants from Spain | 99.4 /100 | #89 | Exceptional 5.2% |
| Immigrants from Kuwait | 99.4 /100 | #90 | Exceptional 5.3% |
| Mongolians | 99.2 /100 | #91 | Exceptional 5.3% |
Immigrants from Nicaragua Disability Age 5 to 17 Correlation Summary
| Measurement | Immigrants from Nicaragua Data | Disability Age 5 to 17 Data |
| Minimum | 0.043% | 0.17% |
| Maximum | 16.1% | 19.3% |
| Range | 16.1% | 19.1% |
| Mean | 4.1% | 5.5% |
| Median | 3.5% | 4.8% |
| Interquartile 25% (IQ1) | 1.7% | 3.7% |
| Interquartile 75% (IQ3) | 5.6% | 6.0% |
| Interquartile Range (IQR) | 3.9% | 2.3% |
| Standard Deviation (Sample) | 3.2% | 3.4% |
| Standard Deviation (Population) | 3.1% | 3.3% |
Correlation Details
| Immigrants from Nicaragua Percentile | Sample Size | Disability Age 5 to 17 |
[ 0.0% - 0.5% ] 0.043% | 137,720,765 | 5.7% |
[ 0.0% - 0.5% ] 0.14% | 42,452,534 | 5.6% |
[ 0.0% - 0.5% ] 0.23% | 21,965,041 | 5.2% |
[ 0.0% - 0.5% ] 0.33% | 9,214,915 | 5.5% |
[ 0.0% - 0.5% ] 0.43% | 6,450,562 | 5.4% |
[ 0.5% - 1.0% ] 0.53% | 3,451,366 | 5.5% |
[ 0.5% - 1.0% ] 0.62% | 2,779,339 | 6.6% |
[ 0.5% - 1.0% ] 0.72% | 1,616,004 | 5.3% |
[ 0.5% - 1.0% ] 0.81% | 1,758,925 | 4.5% |
[ 0.5% - 1.0% ] 0.91% | 959,943 | 5.7% |
[ 1.0% - 1.5% ] 1.01% | 671,395 | 5.4% |
[ 1.0% - 1.5% ] 1.12% | 603,656 | 4.9% |
[ 1.0% - 1.5% ] 1.21% | 486,811 | 5.6% |
[ 1.0% - 1.5% ] 1.30% | 491,931 | 4.5% |
[ 1.0% - 1.5% ] 1.38% | 281,291 | 7.0% |
[ 1.0% - 1.5% ] 1.50% | 469,287 | 4.7% |
[ 1.5% - 2.0% ] 1.56% | 261,025 | 4.6% |
[ 1.5% - 2.0% ] 1.68% | 298,532 | 4.1% |
[ 1.5% - 2.0% ] 1.77% | 37,155 | 2.5% |
[ 1.5% - 2.0% ] 1.84% | 208,037 | 6.1% |
[ 1.5% - 2.0% ] 1.98% | 60,301 | 4.0% |
[ 2.0% - 2.5% ] 2.05% | 267,160 | 6.6% |
[ 2.0% - 2.5% ] 2.17% | 29,198 | 3.1% |
[ 2.0% - 2.5% ] 2.23% | 54,640 | 4.4% |
[ 2.0% - 2.5% ] 2.35% | 41,743 | 5.4% |
[ 2.0% - 2.5% ] 2.42% | 248,977 | 3.8% |
[ 2.5% - 3.0% ] 2.55% | 173,321 | 4.4% |
[ 2.5% - 3.0% ] 2.62% | 64,930 | 4.5% |
[ 2.5% - 3.0% ] 2.72% | 55,241 | 3.0% |
[ 2.5% - 3.0% ] 2.82% | 22,823 | 5.2% |
[ 2.5% - 3.0% ] 2.92% | 104,295 | 8.2% |
[ 3.0% - 3.5% ] 3.03% | 141,302 | 5.8% |
[ 3.0% - 3.5% ] 3.16% | 133,929 | 4.7% |
[ 3.0% - 3.5% ] 3.23% | 118,950 | 2.7% |
[ 3.0% - 3.5% ] 3.33% | 19,994 | 10.0% |
[ 3.0% - 3.5% ] 3.43% | 176,909 | 4.2% |
[ 3.5% - 4.0% ] 3.52% | 226,831 | 5.4% |
[ 3.5% - 4.0% ] 3.64% | 3,080 | 4.2% |
[ 3.5% - 4.0% ] 3.69% | 96,536 | 4.2% |
[ 3.5% - 4.0% ] 3.81% | 4,987 | 3.5% |
[ 3.5% - 4.0% ] 3.87% | 78,900 | 3.1% |
[ 4.0% - 4.5% ] 4.06% | 52,661 | 4.9% |
[ 4.0% - 4.5% ] 4.24% | 50,106 | 4.1% |
[ 4.0% - 4.5% ] 4.40% | 44,062 | 4.2% |
[ 4.0% - 4.5% ] 4.44% | 496 | 18.2% |
[ 4.5% - 5.0% ] 4.58% | 58,421 | 2.8% |
[ 4.5% - 5.0% ] 4.67% | 444,748 | 5.7% |
[ 4.5% - 5.0% ] 4.80% | 49,347 | 4.5% |
[ 4.5% - 5.0% ] 4.88% | 105,852 | 3.6% |
[ 5.0% - 5.5% ] 5.09% | 47,065 | 4.8% |
[ 5.0% - 5.5% ] 5.11% | 30,980 | 2.5% |
[ 5.0% - 5.5% ] 5.28% | 45,620 | 7.1% |
[ 5.0% - 5.5% ] 5.36% | 1,604 | 6.1% |
[ 5.5% - 6.0% ] 5.54% | 85,372 | 3.2% |
[ 5.5% - 6.0% ] 5.69% | 14,698 | 7.6% |
[ 5.5% - 6.0% ] 5.83% | 309 | 3.3% |
[ 6.0% - 6.5% ] 6.14% | 5,049 | 7.9% |
[ 6.0% - 6.5% ] 6.22% | 16,776 | 2.1% |
[ 6.0% - 6.5% ] 6.34% | 867 | 9.0% |
[ 6.0% - 6.5% ] 6.44% | 34,335 | 1.2% |
[ 6.0% - 6.5% ] 6.47% | 59,121 | 6.6% |
[ 6.5% - 7.0% ] 6.89% | 740 | 3.1% |
[ 6.5% - 7.0% ] 7.00% | 443 | 10.8% |
[ 8.5% - 9.0% ] 8.53% | 40,278 | 2.9% |
[ 8.5% - 9.0% ] 8.86% | 34,742 | 6.2% |
[ 8.5% - 9.0% ] 8.96% | 54,873 | 4.5% |
[ 9.0% - 9.5% ] 9.37% | 630 | 14.3% |
[ 9.5% - 10.0% ] 9.73% | 514 | 3.2% |
[ 10.0% - 10.5% ] 10.40% | 8,989 | 0.17% |
[ 10.5% - 11.0% ] 10.73% | 289 | 15.6% |
[ 11.5% - 12.0% ] 11.95% | 778 | 19.3% |
[ 16.0% - 16.5% ] 16.11% | 19,399 | 2.0% |