Immigrants from Kazakhstan Disability Age Under 5
COMPARE
Immigrants from Kazakhstan
Select to Compare
Disability Age Under 5
Immigrants from Kazakhstan Disability Age Under 5
1.1%
DISABILITY | AGE UNDER 5
99.7/ 100
METRIC RATING
51st/ 347
METRIC RANK
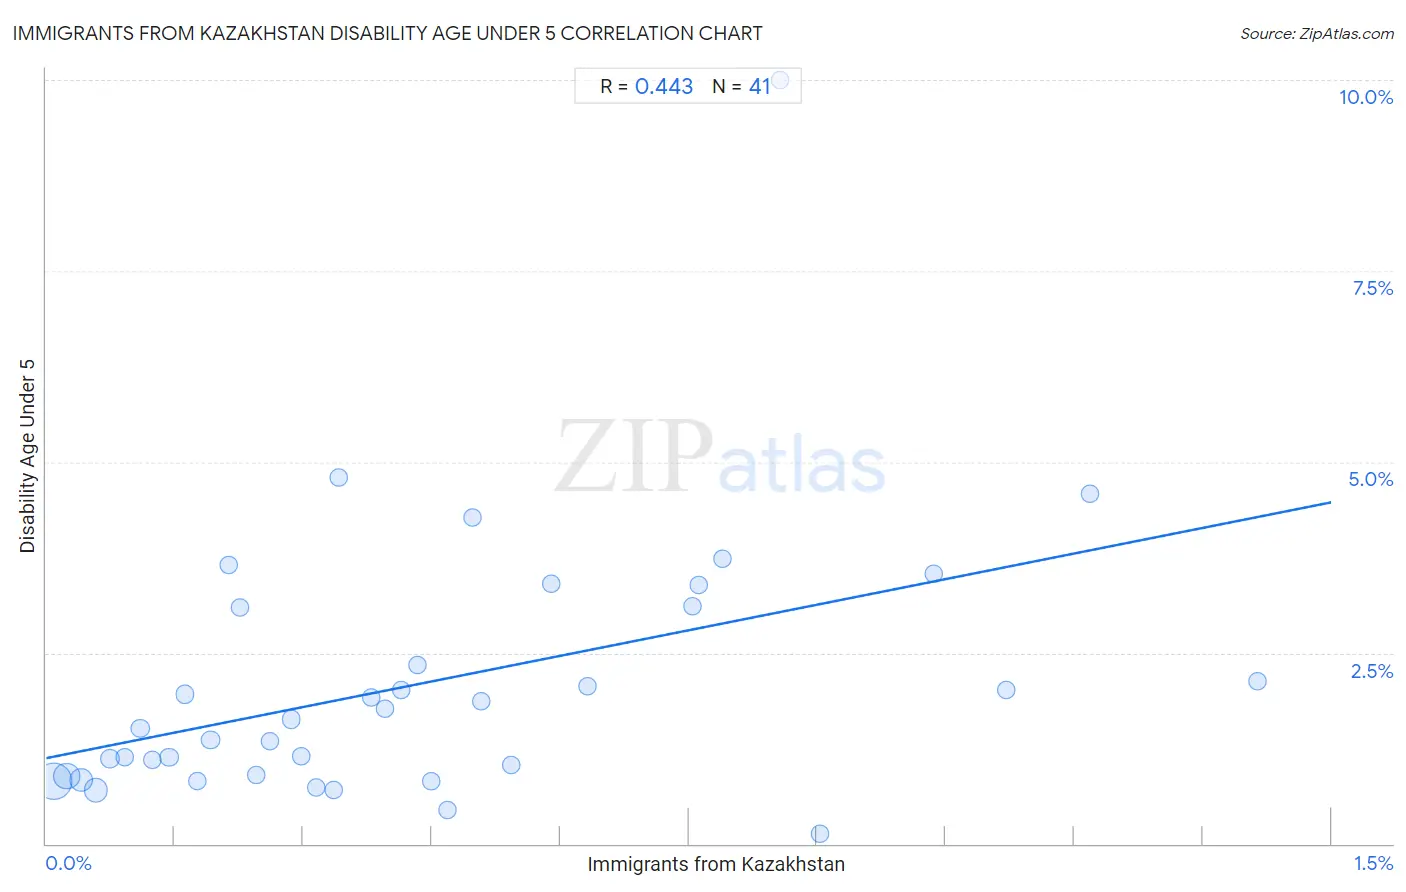
Immigrants from Kazakhstan Disability Age Under 5 Correlation Chart
The statistical analysis conducted on geographies consisting of 91,439,887 people shows a moderate positive correlation between the proportion of Immigrants from Kazakhstan and percentage of population with a disability under the age of 5 in the United States with a correlation coefficient (R) of 0.443 and weighted average of 1.1%. On average, for every 1% (one percent) increase in Immigrants from Kazakhstan within a typical geography, there is an increase of 2.2% in percentage of population with a disability under the age of 5.
It is essential to understand that the correlation between the percentage of Immigrants from Kazakhstan and percentage of population with a disability under the age of 5 does not imply a direct cause-and-effect relationship. It remains uncertain whether the presence of Immigrants from Kazakhstan influences an upward or downward trend in the level of percentage of population with a disability under the age of 5 within an area, or if Immigrants from Kazakhstan simply ended up residing in those areas with higher or lower levels of percentage of population with a disability under the age of 5 due to other factors.
Demographics Similar to Immigrants from Kazakhstan by Disability Age Under 5
In terms of disability age under 5, the demographic groups most similar to Immigrants from Kazakhstan are Immigrants from Japan (1.1%, a difference of 0.19%), Immigrants from Russia (1.1%, a difference of 0.20%), Immigrants from Singapore (1.1%, a difference of 0.41%), Immigrants from Bolivia (1.1%, a difference of 0.42%), and Immigrants from Sweden (1.1%, a difference of 0.63%).
| Demographics | Rating | Rank | Disability Age Under 5 |
| Immigrants from Asia | 99.8 /100 | #44 | Exceptional 1.1% |
| Immigrants from Turkey | 99.8 /100 | #45 | Exceptional 1.1% |
| Immigrants from Congo | 99.8 /100 | #46 | Exceptional 1.1% |
| Immigrants from Sweden | 99.8 /100 | #47 | Exceptional 1.1% |
| Immigrants from Singapore | 99.7 /100 | #48 | Exceptional 1.1% |
| Immigrants from Russia | 99.7 /100 | #49 | Exceptional 1.1% |
| Immigrants from Japan | 99.7 /100 | #50 | Exceptional 1.1% |
| Immigrants from Kazakhstan | 99.7 /100 | #51 | Exceptional 1.1% |
| Immigrants from Bolivia | 99.6 /100 | #52 | Exceptional 1.1% |
| Asians | 99.6 /100 | #53 | Exceptional 1.1% |
| Immigrants from El Salvador | 99.6 /100 | #54 | Exceptional 1.1% |
| Salvadorans | 99.5 /100 | #55 | Exceptional 1.1% |
| Ecuadorians | 99.5 /100 | #56 | Exceptional 1.1% |
| Assyrians/Chaldeans/Syriacs | 99.5 /100 | #57 | Exceptional 1.1% |
| Immigrants from Egypt | 99.4 /100 | #58 | Exceptional 1.1% |
Immigrants from Kazakhstan Disability Age Under 5 Correlation Summary
| Measurement | Immigrants from Kazakhstan Data | Disability Age Under 5 Data |
| Minimum | 0.0082% | 0.14% |
| Maximum | 1.4% | 10.0% |
| Range | 1.4% | 9.9% |
| Mean | 0.44% | 2.1% |
| Median | 0.34% | 1.6% |
| Interquartile 25% (IQ1) | 0.17% | 0.89% |
| Interquartile 75% (IQ3) | 0.61% | 3.1% |
| Interquartile Range (IQR) | 0.44% | 2.2% |
| Standard Deviation (Sample) | 0.35% | 1.8% |
| Standard Deviation (Population) | 0.34% | 1.7% |
Correlation Details
| Immigrants from Kazakhstan Percentile | Sample Size | Disability Age Under 5 |
[ 0.0% - 0.5% ] 0.0082% | 40,486,926 | 0.82% |
[ 0.0% - 0.5% ] 0.024% | 16,898,716 | 0.88% |
[ 0.0% - 0.5% ] 0.040% | 11,017,262 | 0.83% |
[ 0.0% - 0.5% ] 0.058% | 12,641,185 | 0.70% |
[ 0.0% - 0.5% ] 0.075% | 2,874,503 | 1.1% |
[ 0.0% - 0.5% ] 0.091% | 1,217,657 | 1.1% |
[ 0.0% - 0.5% ] 0.11% | 1,705,030 | 1.5% |
[ 0.0% - 0.5% ] 0.12% | 671,755 | 1.1% |
[ 0.0% - 0.5% ] 0.14% | 835,581 | 1.1% |
[ 0.0% - 0.5% ] 0.16% | 365,251 | 2.0% |
[ 0.0% - 0.5% ] 0.18% | 775,472 | 0.82% |
[ 0.0% - 0.5% ] 0.19% | 309,585 | 1.4% |
[ 0.0% - 0.5% ] 0.21% | 102,256 | 3.7% |
[ 0.0% - 0.5% ] 0.23% | 71,984 | 3.1% |
[ 0.0% - 0.5% ] 0.24% | 53,516 | 0.90% |
[ 0.0% - 0.5% ] 0.26% | 259,856 | 1.3% |
[ 0.0% - 0.5% ] 0.29% | 90,080 | 1.6% |
[ 0.0% - 0.5% ] 0.30% | 81,294 | 1.2% |
[ 0.0% - 0.5% ] 0.32% | 94,136 | 0.74% |
[ 0.0% - 0.5% ] 0.34% | 82,432 | 0.70% |
[ 0.0% - 0.5% ] 0.34% | 13,467 | 4.8% |
[ 0.0% - 0.5% ] 0.38% | 55,950 | 1.9% |
[ 0.0% - 0.5% ] 0.40% | 134,265 | 1.8% |
[ 0.0% - 0.5% ] 0.41% | 97,350 | 2.0% |
[ 0.0% - 0.5% ] 0.43% | 76,908 | 2.3% |
[ 0.0% - 0.5% ] 0.45% | 48,799 | 0.82% |
[ 0.0% - 0.5% ] 0.47% | 80,113 | 0.44% |
[ 0.0% - 0.5% ] 0.50% | 21,892 | 4.3% |
[ 0.5% - 1.0% ] 0.51% | 3,548 | 1.9% |
[ 0.5% - 1.0% ] 0.54% | 54,190 | 1.0% |
[ 0.5% - 1.0% ] 0.59% | 40,747 | 3.4% |
[ 0.5% - 1.0% ] 0.63% | 21,542 | 2.1% |
[ 0.5% - 1.0% ] 0.75% | 6,098 | 3.1% |
[ 0.5% - 1.0% ] 0.76% | 17,449 | 3.4% |
[ 0.5% - 1.0% ] 0.79% | 10,256 | 3.7% |
[ 0.5% - 1.0% ] 0.86% | 584 | 10.0% |
[ 0.5% - 1.0% ] 0.90% | 83,069 | 0.14% |
[ 1.0% - 1.5% ] 1.04% | 14,291 | 3.5% |
[ 1.0% - 1.5% ] 1.12% | 10,179 | 2.0% |
[ 1.0% - 1.5% ] 1.22% | 6,648 | 4.6% |
[ 1.0% - 1.5% ] 1.41% | 8,065 | 2.1% |