Immigrants from Kazakhstan Disability Age 5 to 17
COMPARE
Immigrants from Kazakhstan
Select to Compare
Disability Age 5 to 17
Immigrants from Kazakhstan Disability Age 5 to 17
5.2%
DISABILITY | AGE 5 TO 17
99.6/ 100
METRIC RATING
77th/ 347
METRIC RANK
Immigrants from Kazakhstan Disability Age 5 to 17 Correlation Chart
The statistical analysis conducted on geographies consisting of 124,141,808 people shows a slight positive correlation between the proportion of Immigrants from Kazakhstan and percentage of population with a disability between the ages 5 and 17 in the United States with a correlation coefficient (R) of 0.055 and weighted average of 5.2%. On average, for every 1% (one percent) increase in Immigrants from Kazakhstan within a typical geography, there is an increase of 0.24% in percentage of population with a disability between the ages 5 and 17.
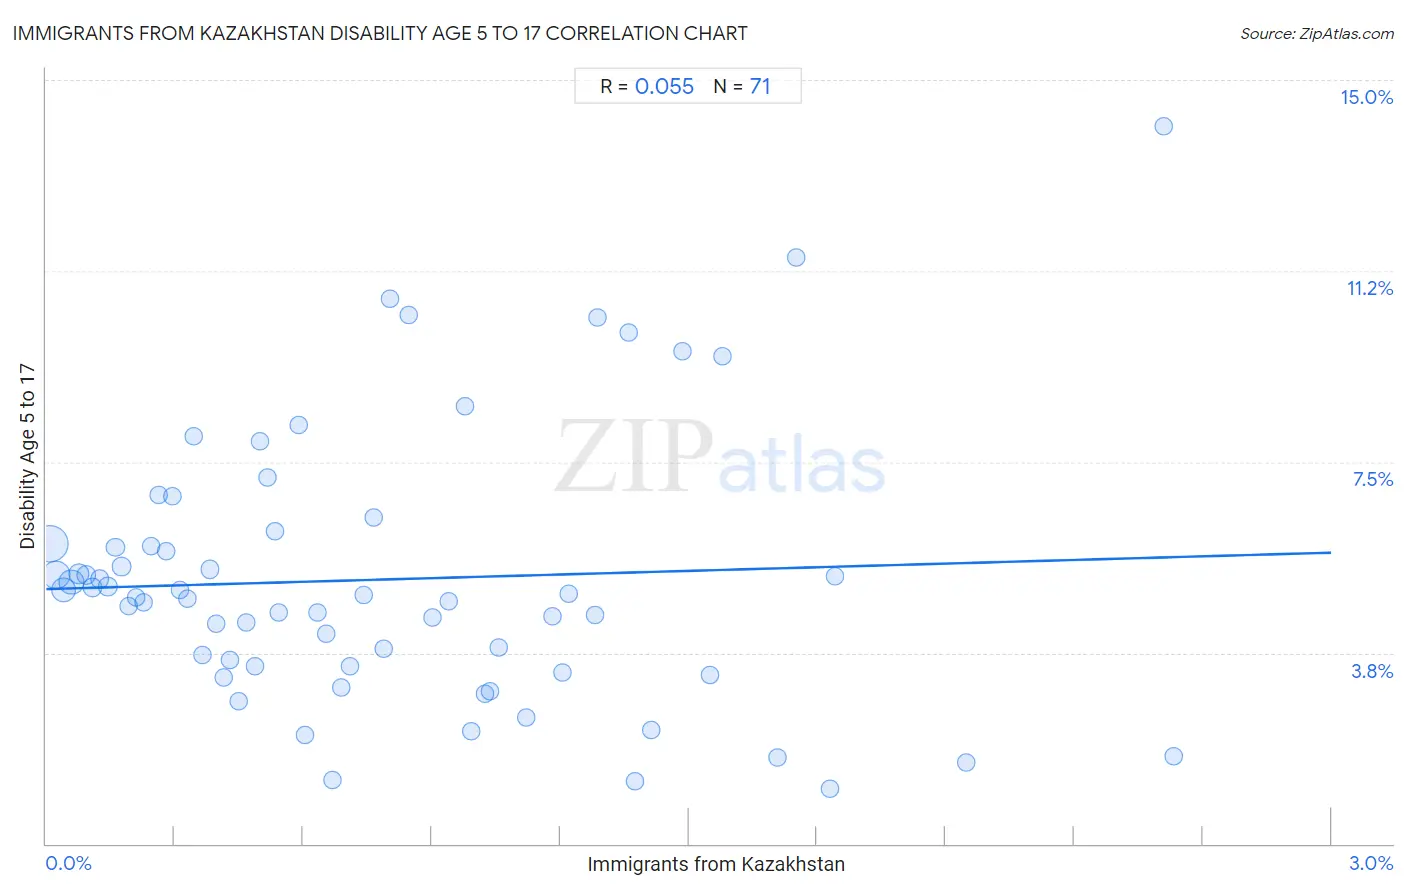
It is essential to understand that the correlation between the percentage of Immigrants from Kazakhstan and percentage of population with a disability between the ages 5 and 17 does not imply a direct cause-and-effect relationship. It remains uncertain whether the presence of Immigrants from Kazakhstan influences an upward or downward trend in the level of percentage of population with a disability between the ages 5 and 17 within an area, or if Immigrants from Kazakhstan simply ended up residing in those areas with higher or lower levels of percentage of population with a disability between the ages 5 and 17 due to other factors.
Demographics Similar to Immigrants from Kazakhstan by Disability Age 5 to 17
In terms of disability age 5 to 17, the demographic groups most similar to Immigrants from Kazakhstan are Immigrants from Cuba (5.2%, a difference of 0.010%), Immigrants from Guyana (5.2%, a difference of 0.030%), Afghan (5.2%, a difference of 0.050%), Immigrants from Moldova (5.2%, a difference of 0.070%), and Sri Lankan (5.2%, a difference of 0.070%).
| Demographics | Rating | Rank | Disability Age 5 to 17 |
| Immigrants from Belgium | 99.7 /100 | #70 | Exceptional 5.2% |
| Jordanians | 99.7 /100 | #71 | Exceptional 5.2% |
| Immigrants from Vietnam | 99.7 /100 | #72 | Exceptional 5.2% |
| Immigrants from Czechoslovakia | 99.7 /100 | #73 | Exceptional 5.2% |
| Immigrants from Romania | 99.7 /100 | #74 | Exceptional 5.2% |
| Immigrants from Moldova | 99.6 /100 | #75 | Exceptional 5.2% |
| Immigrants from Guyana | 99.6 /100 | #76 | Exceptional 5.2% |
| Immigrants from Kazakhstan | 99.6 /100 | #77 | Exceptional 5.2% |
| Immigrants from Cuba | 99.6 /100 | #78 | Exceptional 5.2% |
| Afghans | 99.6 /100 | #79 | Exceptional 5.2% |
| Sri Lankans | 99.6 /100 | #80 | Exceptional 5.2% |
| Native Hawaiians | 99.6 /100 | #81 | Exceptional 5.2% |
| Immigrants from Sweden | 99.5 /100 | #82 | Exceptional 5.2% |
| Immigrants from France | 99.5 /100 | #83 | Exceptional 5.2% |
| Immigrants from Nicaragua | 99.5 /100 | #84 | Exceptional 5.2% |
Immigrants from Kazakhstan Disability Age 5 to 17 Correlation Summary
| Measurement | Immigrants from Kazakhstan Data | Disability Age 5 to 17 Data |
| Minimum | 0.0085% | 1.1% |
| Maximum | 2.6% | 14.1% |
| Range | 2.6% | 13.0% |
| Mean | 0.78% | 5.2% |
| Median | 0.63% | 4.8% |
| Interquartile 25% (IQ1) | 0.29% | 3.5% |
| Interquartile 75% (IQ3) | 1.2% | 5.9% |
| Interquartile Range (IQR) | 0.89% | 2.4% |
| Standard Deviation (Sample) | 0.61% | 2.6% |
| Standard Deviation (Population) | 0.61% | 2.6% |
Correlation Details
| Immigrants from Kazakhstan Percentile | Sample Size | Disability Age 5 to 17 |
[ 0.0% - 0.5% ] 0.0085% | 44,549,186 | 5.9% |
[ 0.0% - 0.5% ] 0.024% | 24,146,891 | 5.3% |
[ 0.0% - 0.5% ] 0.041% | 15,574,964 | 5.0% |
[ 0.0% - 0.5% ] 0.058% | 16,720,548 | 5.1% |
[ 0.0% - 0.5% ] 0.075% | 5,387,266 | 5.3% |
[ 0.0% - 0.5% ] 0.093% | 2,926,667 | 5.3% |
[ 0.0% - 0.5% ] 0.11% | 3,241,172 | 5.0% |
[ 0.0% - 0.5% ] 0.13% | 1,476,223 | 5.2% |
[ 0.0% - 0.5% ] 0.14% | 1,522,347 | 5.1% |
[ 0.0% - 0.5% ] 0.16% | 994,459 | 5.8% |
[ 0.0% - 0.5% ] 0.18% | 1,452,880 | 5.4% |
[ 0.0% - 0.5% ] 0.19% | 688,596 | 4.7% |
[ 0.0% - 0.5% ] 0.21% | 496,400 | 4.8% |
[ 0.0% - 0.5% ] 0.23% | 589,326 | 4.8% |
[ 0.0% - 0.5% ] 0.24% | 430,066 | 5.8% |
[ 0.0% - 0.5% ] 0.26% | 417,135 | 6.8% |
[ 0.0% - 0.5% ] 0.28% | 367,247 | 5.8% |
[ 0.0% - 0.5% ] 0.29% | 307,806 | 6.8% |
[ 0.0% - 0.5% ] 0.31% | 227,979 | 5.0% |
[ 0.0% - 0.5% ] 0.33% | 357,070 | 4.8% |
[ 0.0% - 0.5% ] 0.34% | 45,663 | 8.0% |
[ 0.0% - 0.5% ] 0.36% | 122,602 | 3.7% |
[ 0.0% - 0.5% ] 0.38% | 229,332 | 5.4% |
[ 0.0% - 0.5% ] 0.40% | 211,329 | 4.3% |
[ 0.0% - 0.5% ] 0.41% | 157,286 | 3.3% |
[ 0.0% - 0.5% ] 0.43% | 176,461 | 3.6% |
[ 0.0% - 0.5% ] 0.45% | 144,588 | 2.8% |
[ 0.0% - 0.5% ] 0.47% | 110,486 | 4.3% |
[ 0.0% - 0.5% ] 0.49% | 131,107 | 3.5% |
[ 0.0% - 0.5% ] 0.50% | 21,892 | 7.9% |
[ 0.5% - 1.0% ] 0.52% | 28,846 | 7.2% |
[ 0.5% - 1.0% ] 0.53% | 51,951 | 6.1% |
[ 0.5% - 1.0% ] 0.54% | 55,293 | 4.6% |
[ 0.5% - 1.0% ] 0.59% | 63,599 | 8.2% |
[ 0.5% - 1.0% ] 0.60% | 2,317 | 2.1% |
[ 0.5% - 1.0% ] 0.63% | 57,601 | 4.5% |
[ 0.5% - 1.0% ] 0.65% | 132,297 | 4.1% |
[ 0.5% - 1.0% ] 0.67% | 15,596 | 1.2% |
[ 0.5% - 1.0% ] 0.69% | 39,664 | 3.1% |
[ 0.5% - 1.0% ] 0.71% | 2,543 | 3.5% |
[ 0.5% - 1.0% ] 0.74% | 7,434 | 4.9% |
[ 0.5% - 1.0% ] 0.77% | 28,083 | 6.4% |
[ 0.5% - 1.0% ] 0.79% | 18,675 | 3.8% |
[ 0.5% - 1.0% ] 0.80% | 29,673 | 10.7% |
[ 0.5% - 1.0% ] 0.85% | 4,602 | 10.4% |
[ 0.5% - 1.0% ] 0.90% | 83,069 | 4.4% |
[ 0.5% - 1.0% ] 0.94% | 20,632 | 4.8% |
[ 0.5% - 1.0% ] 0.98% | 37,770 | 8.6% |
[ 0.5% - 1.0% ] 0.99% | 10,583 | 2.2% |
[ 1.0% - 1.5% ] 1.02% | 27,556 | 3.0% |
[ 1.0% - 1.5% ] 1.04% | 14,291 | 3.0% |
[ 1.0% - 1.5% ] 1.06% | 14,216 | 3.8% |
[ 1.0% - 1.5% ] 1.12% | 10,179 | 2.5% |
[ 1.0% - 1.5% ] 1.18% | 6,592 | 4.5% |
[ 1.0% - 1.5% ] 1.20% | 13,778 | 3.4% |
[ 1.0% - 1.5% ] 1.22% | 6,648 | 4.9% |
[ 1.0% - 1.5% ] 1.28% | 38,430 | 4.5% |
[ 1.0% - 1.5% ] 1.29% | 466 | 10.3% |
[ 1.0% - 1.5% ] 1.36% | 8,962 | 10.0% |
[ 1.0% - 1.5% ] 1.38% | 5,162 | 1.2% |
[ 1.0% - 1.5% ] 1.41% | 8,065 | 2.2% |
[ 1.0% - 1.5% ] 1.49% | 202 | 9.7% |
[ 1.5% - 2.0% ] 1.55% | 2,579 | 3.3% |
[ 1.5% - 2.0% ] 1.58% | 25,729 | 9.6% |
[ 1.5% - 2.0% ] 1.71% | 13,696 | 1.7% |
[ 1.5% - 2.0% ] 1.75% | 15,130 | 11.5% |
[ 1.5% - 2.0% ] 1.83% | 3,224 | 1.1% |
[ 1.5% - 2.0% ] 1.84% | 543 | 5.3% |
[ 2.0% - 2.5% ] 2.15% | 2,280 | 1.6% |
[ 2.5% - 3.0% ] 2.61% | 7,662 | 14.1% |
[ 2.5% - 3.0% ] 2.63% | 1,216 | 1.7% |