Immigrants from Kazakhstan Cognitive Disability
COMPARE
Immigrants from Kazakhstan
Select to Compare
Cognitive Disability
Immigrants from Kazakhstan Cognitive Disability
17.1%
COGNITIVE DISABILITY
80.5/ 100
METRIC RATING
153rd/ 347
METRIC RANK
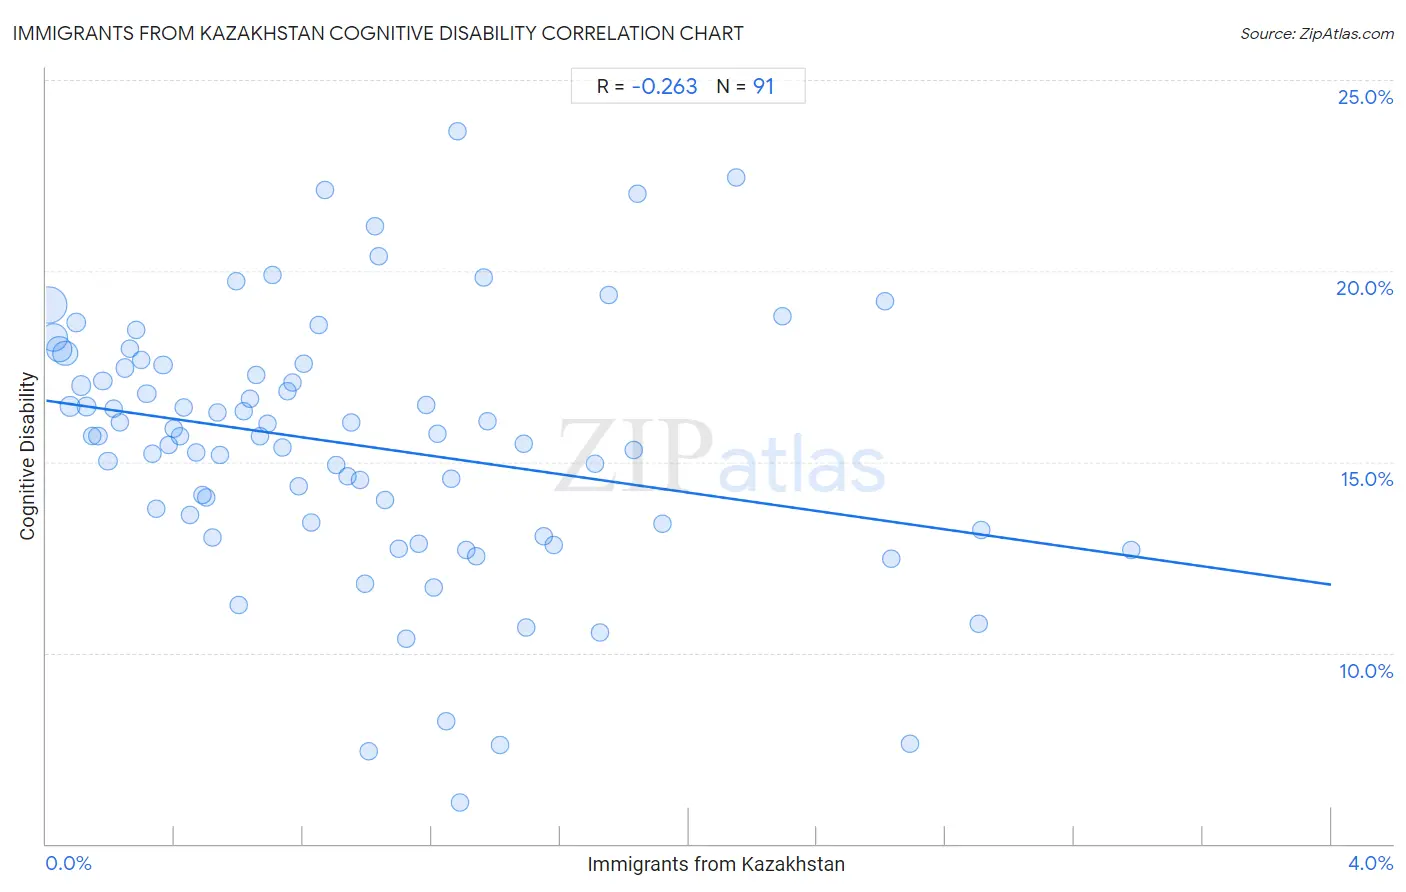
Immigrants from Kazakhstan Cognitive Disability Correlation Chart
The statistical analysis conducted on geographies consisting of 124,443,744 people shows a weak negative correlation between the proportion of Immigrants from Kazakhstan and percentage of population with cognitive disability in the United States with a correlation coefficient (R) of -0.263 and weighted average of 17.1%. On average, for every 1% (one percent) increase in Immigrants from Kazakhstan within a typical geography, there is a decrease of 1.2% in percentage of population with cognitive disability.
It is essential to understand that the correlation between the percentage of Immigrants from Kazakhstan and percentage of population with cognitive disability does not imply a direct cause-and-effect relationship. It remains uncertain whether the presence of Immigrants from Kazakhstan influences an upward or downward trend in the level of percentage of population with cognitive disability within an area, or if Immigrants from Kazakhstan simply ended up residing in those areas with higher or lower levels of percentage of population with cognitive disability due to other factors.
Demographics Similar to Immigrants from Kazakhstan by Cognitive Disability
In terms of cognitive disability, the demographic groups most similar to Immigrants from Kazakhstan are Immigrants from Malaysia (17.1%, a difference of 0.050%), Brazilian (17.1%, a difference of 0.070%), Sri Lankan (17.1%, a difference of 0.070%), Immigrants from Indonesia (17.1%, a difference of 0.10%), and Syrian (17.1%, a difference of 0.12%).
| Demographics | Rating | Rank | Cognitive Disability |
| Costa Ricans | 88.0 /100 | #146 | Excellent 17.0% |
| Scotch-Irish | 85.9 /100 | #147 | Excellent 17.1% |
| French Canadians | 85.7 /100 | #148 | Excellent 17.1% |
| Cypriots | 85.7 /100 | #149 | Excellent 17.1% |
| Basques | 85.5 /100 | #150 | Excellent 17.1% |
| Syrians | 83.0 /100 | #151 | Excellent 17.1% |
| Immigrants from Indonesia | 82.7 /100 | #152 | Excellent 17.1% |
| Immigrants from Kazakhstan | 80.5 /100 | #153 | Excellent 17.1% |
| Immigrants from Malaysia | 79.3 /100 | #154 | Good 17.1% |
| Brazilians | 78.9 /100 | #155 | Good 17.1% |
| Sri Lankans | 78.9 /100 | #156 | Good 17.1% |
| Immigrants from Australia | 76.0 /100 | #157 | Good 17.1% |
| Celtics | 74.1 /100 | #158 | Good 17.1% |
| Immigrants from Latvia | 73.2 /100 | #159 | Good 17.2% |
| Australians | 72.4 /100 | #160 | Good 17.2% |
Immigrants from Kazakhstan Cognitive Disability Correlation Summary
| Measurement | Immigrants from Kazakhstan Data | Cognitive Disability Data |
| Minimum | 0.0085% | 6.1% |
| Maximum | 3.4% | 23.7% |
| Range | 3.4% | 17.6% |
| Mean | 0.95% | 15.5% |
| Median | 0.80% | 15.7% |
| Interquartile 25% (IQ1) | 0.38% | 13.4% |
| Interquartile 75% (IQ3) | 1.3% | 17.5% |
| Interquartile Range (IQR) | 0.93% | 4.2% |
| Standard Deviation (Sample) | 0.74% | 3.4% |
| Standard Deviation (Population) | 0.74% | 3.4% |
Correlation Details
| Immigrants from Kazakhstan Percentile | Sample Size | Cognitive Disability |
[ 0.0% - 0.5% ] 0.0085% | 44,549,186 | 19.1% |
[ 0.0% - 0.5% ] 0.024% | 24,146,891 | 18.3% |
[ 0.0% - 0.5% ] 0.041% | 15,574,964 | 17.9% |
[ 0.0% - 0.5% ] 0.058% | 16,738,616 | 17.8% |
[ 0.0% - 0.5% ] 0.075% | 5,387,266 | 16.4% |
[ 0.0% - 0.5% ] 0.093% | 2,927,688 | 18.6% |
[ 0.0% - 0.5% ] 0.11% | 3,257,380 | 17.0% |
[ 0.0% - 0.5% ] 0.13% | 1,522,056 | 16.4% |
[ 0.0% - 0.5% ] 0.14% | 1,522,347 | 15.7% |
[ 0.0% - 0.5% ] 0.16% | 1,022,316 | 15.7% |
[ 0.0% - 0.5% ] 0.18% | 1,470,864 | 17.1% |
[ 0.0% - 0.5% ] 0.19% | 688,596 | 15.0% |
[ 0.0% - 0.5% ] 0.21% | 511,577 | 16.4% |
[ 0.0% - 0.5% ] 0.23% | 603,347 | 16.0% |
[ 0.0% - 0.5% ] 0.24% | 430,066 | 17.5% |
[ 0.0% - 0.5% ] 0.26% | 419,489 | 18.0% |
[ 0.0% - 0.5% ] 0.28% | 371,115 | 18.4% |
[ 0.0% - 0.5% ] 0.29% | 308,814 | 17.7% |
[ 0.0% - 0.5% ] 0.31% | 240,585 | 16.8% |
[ 0.0% - 0.5% ] 0.33% | 362,414 | 15.2% |
[ 0.0% - 0.5% ] 0.34% | 45,663 | 13.8% |
[ 0.0% - 0.5% ] 0.36% | 122,602 | 17.5% |
[ 0.0% - 0.5% ] 0.38% | 233,312 | 15.4% |
[ 0.0% - 0.5% ] 0.40% | 213,842 | 15.9% |
[ 0.0% - 0.5% ] 0.41% | 158,717 | 15.7% |
[ 0.0% - 0.5% ] 0.43% | 176,461 | 16.4% |
[ 0.0% - 0.5% ] 0.45% | 167,453 | 13.6% |
[ 0.0% - 0.5% ] 0.47% | 110,922 | 15.2% |
[ 0.0% - 0.5% ] 0.49% | 133,795 | 14.1% |
[ 0.0% - 0.5% ] 0.50% | 21,892 | 14.1% |
[ 0.5% - 1.0% ] 0.52% | 28,846 | 13.0% |
[ 0.5% - 1.0% ] 0.53% | 51,951 | 16.3% |
[ 0.5% - 1.0% ] 0.54% | 56,767 | 15.2% |
[ 0.5% - 1.0% ] 0.59% | 63,599 | 19.7% |
[ 0.5% - 1.0% ] 0.60% | 6,664 | 11.2% |
[ 0.5% - 1.0% ] 0.61% | 1,466 | 16.3% |
[ 0.5% - 1.0% ] 0.63% | 60,252 | 16.7% |
[ 0.5% - 1.0% ] 0.65% | 134,010 | 17.3% |
[ 0.5% - 1.0% ] 0.67% | 15,893 | 15.7% |
[ 0.5% - 1.0% ] 0.69% | 49,263 | 16.0% |
[ 0.5% - 1.0% ] 0.71% | 3,827 | 19.9% |
[ 0.5% - 1.0% ] 0.73% | 13,210 | 15.4% |
[ 0.5% - 1.0% ] 0.75% | 9,046 | 16.9% |
[ 0.5% - 1.0% ] 0.77% | 28,083 | 17.1% |
[ 0.5% - 1.0% ] 0.79% | 18,675 | 14.4% |
[ 0.5% - 1.0% ] 0.80% | 29,673 | 17.6% |
[ 0.5% - 1.0% ] 0.83% | 969 | 13.4% |
[ 0.5% - 1.0% ] 0.85% | 4,602 | 18.6% |
[ 0.5% - 1.0% ] 0.87% | 4,383 | 22.1% |
[ 0.5% - 1.0% ] 0.90% | 85,377 | 14.9% |
[ 0.5% - 1.0% ] 0.94% | 24,174 | 14.6% |
[ 0.5% - 1.0% ] 0.95% | 6,952 | 16.0% |
[ 0.5% - 1.0% ] 0.98% | 41,667 | 14.5% |
[ 0.5% - 1.0% ] 0.99% | 10,583 | 11.8% |
[ 1.0% - 1.5% ] 1.01% | 199 | 7.4% |
[ 1.0% - 1.5% ] 1.02% | 30,108 | 21.2% |
[ 1.0% - 1.5% ] 1.04% | 14,291 | 20.4% |
[ 1.0% - 1.5% ] 1.06% | 14,216 | 14.0% |
[ 1.0% - 1.5% ] 1.10% | 2,096 | 12.7% |
[ 1.0% - 1.5% ] 1.12% | 12,863 | 10.4% |
[ 1.0% - 1.5% ] 1.16% | 691 | 12.8% |
[ 1.0% - 1.5% ] 1.18% | 6,592 | 16.5% |
[ 1.0% - 1.5% ] 1.20% | 13,778 | 11.7% |
[ 1.0% - 1.5% ] 1.22% | 6,648 | 15.7% |
[ 1.0% - 1.5% ] 1.24% | 6,914 | 8.2% |
[ 1.0% - 1.5% ] 1.26% | 2,540 | 14.6% |
[ 1.0% - 1.5% ] 1.28% | 38,430 | 23.7% |
[ 1.0% - 1.5% ] 1.29% | 466 | 6.1% |
[ 1.0% - 1.5% ] 1.31% | 611 | 12.7% |
[ 1.0% - 1.5% ] 1.34% | 597 | 12.5% |
[ 1.0% - 1.5% ] 1.36% | 8,962 | 19.8% |
[ 1.0% - 1.5% ] 1.38% | 5,162 | 16.1% |
[ 1.0% - 1.5% ] 1.41% | 8,065 | 7.6% |
[ 1.0% - 1.5% ] 1.49% | 202 | 15.5% |
[ 1.0% - 1.5% ] 1.49% | 3,014 | 10.7% |
[ 1.5% - 2.0% ] 1.55% | 3,424 | 13.1% |
[ 1.5% - 2.0% ] 1.58% | 25,729 | 12.8% |
[ 1.5% - 2.0% ] 1.71% | 13,696 | 15.0% |
[ 1.5% - 2.0% ] 1.72% | 116 | 10.5% |
[ 1.5% - 2.0% ] 1.75% | 15,130 | 19.4% |
[ 1.5% - 2.0% ] 1.83% | 3,224 | 15.3% |
[ 1.5% - 2.0% ] 1.84% | 543 | 22.0% |
[ 1.5% - 2.0% ] 1.92% | 417 | 13.4% |
[ 2.0% - 2.5% ] 2.15% | 2,280 | 22.4% |
[ 2.0% - 2.5% ] 2.29% | 1,397 | 18.8% |
[ 2.5% - 3.0% ] 2.61% | 7,662 | 19.2% |
[ 2.5% - 3.0% ] 2.63% | 1,216 | 12.5% |
[ 2.5% - 3.0% ] 2.69% | 446 | 7.6% |
[ 2.5% - 3.0% ] 2.90% | 792 | 10.8% |
[ 2.5% - 3.0% ] 2.91% | 378 | 13.2% |
[ 3.0% - 3.5% ] 3.38% | 681 | 12.7% |