Immigrants from Eastern Europe Wage/Income Gap

COMPARE

Immigrants from Eastern Europe
Race
Ancestry
AfghanAfricanAlaska NativeAlaskan AthabascanAlbanianAleutAlsatianAmericanApacheArabArapahoArgentineanArmenianAssyrian/Chaldean/SyriacAustralianAustrianBahamianBangladeshiBarbadianBasqueBelgianBelizeanBermudanBhutaneseBlackfeetBolivianBrazilianBritishBritish West IndianBulgarianBurmeseCajunCambodianCanadianCape VerdeanCarpatho RusynCelticCentral AmericanCentral American IndianCherokeeCheyenneChickasawChileanChineseChippewaChoctawColombianColvilleComancheCosta RicanCreeCreekCroatianCrowCubanCypriotCzechCzechoslovakianDanishDelawareDominicanDutchDutch West IndianEastern EuropeanEcuadorianEgyptianEnglishEstonianEthiopianEuropeanFijianFilipinoFinnishFrenchFrench American IndianFrench CanadianGermanGerman RussianGhanaianGreekGuamanian/ChamorroGuatemalanGuyaneseHaitianHmongHonduranHopiHoumaHungarianIcelanderIndian (Asian)IndonesianInupiatIranianIraqiIrishIroquoisIsraeliItalianJamaicanJapaneseJordanianKenyanKiowaKoreanLaotianLatvianLebaneseLiberianLithuanianLumbeeLuxembourgerMacedonianMalaysianMalteseMarshalleseMenomineeMexicanMexican American IndianMongolianMoroccanNative HawaiianNavajoNepaleseNew ZealanderNicaraguanNigerianNorthern EuropeanNorwegianOkinawanOsageOttawaPaiutePakistaniPalestinianPanamanianParaguayanPennsylvania GermanPeruvianPimaPolishPortuguesePotawatomiPuebloPuerto RicanPuget Sound SalishRomanianRussianSalvadoranSamoanScandinavianScotch-IrishScottishSeminoleSenegaleseSerbianShoshoneSierra LeoneanSiouxSlavicSlovakSloveneSomaliSouth AfricanSouth AmericanSouth American IndianSoviet UnionSpaniardSpanishSpanish AmericanSpanish American IndianSri LankanSubsaharan AfricanSudaneseSwedishSwissSyrianTaiwaneseThaiTlingit-HaidaTohono O'OdhamTonganTrinidadian and TobagonianTsimshianTurkishU.S. Virgin IslanderUgandanUkrainianUruguayanUteVenezuelanVietnameseWelshWest IndianYakamaYaquiYugoslavianYumanYup'ikZimbabwean
Immigration
NonimmigrantsImmigrantsAfghanistanAfricaAlbaniaArgentinaArmeniaAsiaAustraliaAustriaBahamasBangladeshBarbadosBelarusBelgiumBelizeBoliviaBosnia and HerzegovinaBrazilBulgariaBurma/MyanmarCabo VerdeCambodiaCameroonCanadaCaribbeanCentral AmericaChileChinaColombiaCongoCosta RicaCroatiaCubaCzechoslovakiaDenmarkDominicaDominican RepublicEastern AfricaEastern AsiaEastern EuropeEcuadorEgyptEl SalvadorEnglandEritreaEthiopiaEuropeFijiFranceGermanyGhanaGreeceGrenadaGuatemalaGuyanaHaitiHondurasHong KongHungaryIndiaIndonesiaIranIraqIrelandIsraelItalyJamaicaJapanJordanKazakhstanKenyaKoreaKuwaitLaosLatin AmericaLatviaLebanonLiberiaLithuaniaMalaysiaMexicoMicronesiaMiddle AfricaMoldovaMoroccoNepalNetherlandsNicaraguaNigeriaNorth AmericaNorth MacedoniaNorthern AfricaNorthern EuropeNorwayOceaniaPakistanPanamaPeruPhilippinesPolandPortugalRomaniaRussiaSaudi ArabiaScotlandSenegalSerbiaSierra LeoneSingaporeSomaliaSouth AfricaSouth AmericaSouth Central AsiaSouth Eastern AsiaSouthern EuropeSpainSri LankaSt. Vincent and the GrenadinesSudanSwedenSwitzerlandSyriaTaiwanThailandTrinidad and TobagoTurkeyUgandaUkraineUruguayUzbekistanVenezuelaVietnamWest IndiesWestern AfricaWestern AsiaWestern EuropeYemenZaireZimbabweAzores
Select to Compare
Race
Ancestry
AfghanAfricanAlaska NativeAlaskan AthabascanAlbanianAleutAlsatianAmericanApacheArabArapahoArgentineanArmenianAssyrian/Chaldean/SyriacAustralianAustrianBahamianBangladeshiBarbadianBasqueBelgianBelizeanBermudanBhutaneseBlackfeetBolivianBrazilianBritishBritish West IndianBulgarianBurmeseCajunCambodianCanadianCape VerdeanCarpatho RusynCelticCentral AmericanCentral American IndianCherokeeCheyenneChickasawChileanChineseChippewaChoctawColombianColvilleComancheCosta RicanCreeCreekCroatianCrowCubanCypriotCzechCzechoslovakianDanishDelawareDominicanDutchDutch West IndianEastern EuropeanEcuadorianEgyptianEnglishEstonianEthiopianEuropeanFijianFilipinoFinnishFrenchFrench American IndianFrench CanadianGermanGerman RussianGhanaianGreekGuamanian/ChamorroGuatemalanGuyaneseHaitianHmongHonduranHopiHoumaHungarianIcelanderIndian (Asian)IndonesianInupiatIranianIraqiIrishIroquoisIsraeliItalianJamaicanJapaneseJordanianKenyanKiowaKoreanLaotianLatvianLebaneseLiberianLithuanianLumbeeLuxembourgerMacedonianMalaysianMalteseMarshalleseMenomineeMexicanMexican American IndianMongolianMoroccanNative HawaiianNavajoNepaleseNew ZealanderNicaraguanNigerianNorthern EuropeanNorwegianOkinawanOsageOttawaPaiutePakistaniPalestinianPanamanianParaguayanPennsylvania GermanPeruvianPimaPolishPortuguesePotawatomiPuebloPuerto RicanPuget Sound SalishRomanianRussianSalvadoranSamoanScandinavianScotch-IrishScottishSeminoleSenegaleseSerbianShoshoneSierra LeoneanSiouxSlavicSlovakSloveneSomaliSouth AfricanSouth AmericanSouth American IndianSoviet UnionSpaniardSpanishSpanish AmericanSpanish American IndianSri LankanSubsaharan AfricanSudaneseSwedishSwissSyrianTaiwaneseThaiTlingit-HaidaTohono O'OdhamTonganTrinidadian and TobagonianTsimshianTurkishU.S. Virgin IslanderUgandanUkrainianUruguayanUteVenezuelanVietnameseWelshWest IndianYakamaYaquiYugoslavianYumanYup'ikZimbabwean
Immigration
NonimmigrantsImmigrantsAfghanistanAfricaAlbaniaArgentinaArmeniaAsiaAustraliaAustriaBahamasBangladeshBarbadosBelarusBelgiumBelizeBoliviaBosnia and HerzegovinaBrazilBulgariaBurma/MyanmarCabo VerdeCambodiaCameroonCanadaCaribbeanCentral AmericaChileChinaColombiaCongoCosta RicaCroatiaCubaCzechoslovakiaDenmarkDominicaDominican RepublicEastern AfricaEastern AsiaEcuadorEgyptEl SalvadorEnglandEritreaEthiopiaEuropeFijiFranceGermanyGhanaGreeceGrenadaGuatemalaGuyanaHaitiHondurasHong KongHungaryIndiaIndonesiaIranIraqIrelandIsraelItalyJamaicaJapanJordanKazakhstanKenyaKoreaKuwaitLaosLatin AmericaLatviaLebanonLiberiaLithuaniaMalaysiaMexicoMicronesiaMiddle AfricaMoldovaMoroccoNepalNetherlandsNicaraguaNigeriaNorth AmericaNorth MacedoniaNorthern AfricaNorthern EuropeNorwayOceaniaPakistanPanamaPeruPhilippinesPolandPortugalRomaniaRussiaSaudi ArabiaScotlandSenegalSerbiaSierra LeoneSingaporeSomaliaSouth AfricaSouth AmericaSouth Central AsiaSouth Eastern AsiaSouthern EuropeSpainSri LankaSt. Vincent and the GrenadinesSudanSwedenSwitzerlandSyriaTaiwanThailandTrinidad and TobagoTurkeyUgandaUkraineUruguayUzbekistanVenezuelaVietnamWest IndiesWestern AfricaWestern AsiaWestern EuropeYemenZaireZimbabweAzores
Wage/Income Gap
Income
Poverty
Unemployment
Labor Participation
Family Structure
Vehicle Availability
Education Level
Disability

Immigrants from Eastern Europe Wage/Income Gap
Poor

26.4%
WAGE/INCOME GAP
19.2/ 100
METRIC RATING
203rd/ 347
METRIC RANK

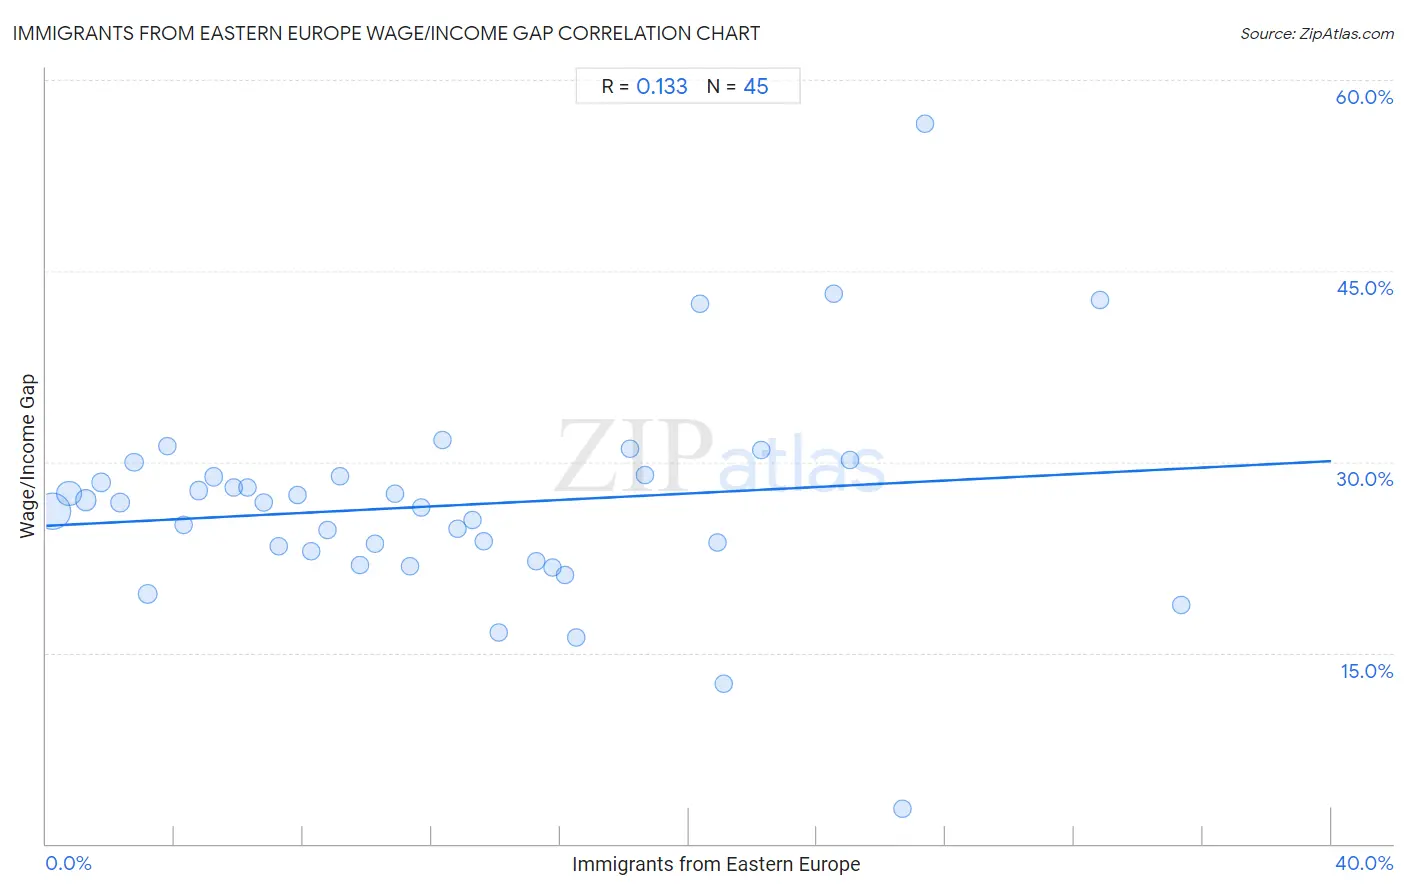
Immigrants from Eastern Europe Wage/Income Gap Correlation Chart

The statistical analysis conducted on geographies consisting of 475,258,963 people shows a poor positive correlation between the proportion of Immigrants from Eastern Europe and wage/income gap percentage in the United States with a correlation coefficient (R) of 0.133 and weighted average of 26.4%. On average, for every 1% (one percent) increase in Immigrants from Eastern Europe within a typical geography, there is an increase of 0.13% in wage/income gap percentage.
Immigrants from Eastern Europe Wage/Income Gap
It is essential to understand that the correlation between the percentage of Immigrants from Eastern Europe and wage/income gap percentage does not imply a direct cause-and-effect relationship. It remains uncertain whether the presence of Immigrants from Eastern Europe influences an upward or downward trend in the level of wage/income gap percentage within an area, or if Immigrants from Eastern Europe simply ended up residing in those areas with higher or lower levels of wage/income gap percentage due to other factors.

Demographics Similar to Immigrants from Eastern Europe by Wage/Income Gap

In terms of wage/income gap, the demographic groups most similar to Immigrants from Eastern Europe are Laotian (26.4%, a difference of 0.0%), Immigrants from Syria (26.4%, a difference of 0.010%), Immigrants from Russia (26.4%, a difference of 0.020%), Delaware (26.3%, a difference of 0.17%), and Dutch West Indian (26.3%, a difference of 0.18%).
DemographicsRating | RankWage/Income Gap
Immigrants from Western Asia
21.7
/100
|
#196
Fair
26.3%
Zimbabweans
21.6
/100
|
#197
Fair
26.3%
Venezuelans
21.5
/100
|
#198
Fair
26.3%
Dutch West Indians
21.0
/100
|
#199
Fair
26.3%
Delaware
20.9
/100
|
#200
Fair
26.3%
Immigrants from Syria
19.3
/100
|
#201
Poor
26.4%
Laotians
19.2
/100
|
#202
Poor
26.4%
Immigrants from Eastern Europe
19.2
/100
|
#203
Poor
26.4%
Immigrants from Russia
19.0
/100
|
#204
Poor
26.4%
Immigrants from Southern Europe
17.3
/100
|
#205
Poor
26.4%
Indians (Asian)
16.5
/100
|
#206
Poor
26.4%
Immigrants from Italy
15.8
/100
|
#207
Poor
26.5%
Egyptians
12.7
/100
|
#208
Poor
26.6%
Immigrants from Kuwait
12.6
/100
|
#209
Poor
26.6%
Arabs
12.3
/100
|
#210
Poor
26.6%

Immigrants from Eastern Europe Wage/Income Gap Correlation Summary

MeasurementImmigrants from Eastern Europe DataWage/Income Gap Data
Minimum0.21%2.8%
Maximum35.3%56.5%
Range35.1%53.8%
Mean12.6%26.6%
Median11.3%26.8%
Interquartile 25% (IQ1)5.5%22.6%
Interquartile 75% (IQ3)18.4%28.9%
Interquartile Range (IQR)12.9%6.3%
Standard Deviation (Sample)8.8%8.4%
Standard Deviation (Population)8.7%8.3%

Correlation Details

Immigrants from Eastern Europe PercentileSample SizeWage/Income Gap
[
0.0%
-
0.5%
]
0.21%
263,085,69326.1%
[
0.5%
-
1.0%
]
0.72%
95,407,73227.5%
[
1.0%
-
1.5%
]
1.23%
47,473,47927.0%
[
1.5%
-
2.0%
]
1.73%
20,461,04428.4%
[
2.0%
-
2.5%
]
2.28%
14,782,73726.8%
[
2.5%
-
3.0%
]
2.74%
6,869,33830.0%
[
3.0%
-
3.5%
]
3.16%
12,428,56719.6%
[
3.5%
-
4.0%
]
3.76%
3,416,32231.3%
[
4.0%
-
4.5%
]
4.27%
2,644,45225.0%
[
4.5%
-
5.0%
]
4.74%
1,661,65427.7%
[
5.0%
-
5.5%
]
5.20%
1,059,39728.8%
[
5.5%
-
6.0%
]
5.82%
777,34127.9%
[
6.0%
-
6.5%
]
6.26%
790,17627.9%
[
6.5%
-
7.0%
]
6.76%
448,63726.8%
[
7.0%
-
7.5%
]
7.23%
402,96223.4%
[
7.5%
-
8.0%
]
7.81%
377,80227.4%
[
8.0%
-
8.5%
]
8.24%
372,71623.0%
[
8.5%
-
9.0%
]
8.75%
32,88424.7%
[
9.0%
-
9.5%
]
9.15%
256,66328.9%
[
9.5%
-
10.0%
]
9.76%
247,61121.9%
[
10.0%
-
10.5%
]
10.24%
354,11123.6%
[
10.5%
-
11.0%
]
10.86%
408,28127.4%
[
11.0%
-
11.5%
]
11.32%
137,96721.8%
[
11.5%
-
12.0%
]
11.66%
163,15726.4%
[
12.0%
-
12.5%
]
12.35%
234,60531.7%
[
12.5%
-
13.0%
]
12.81%
106,91524.7%
[
13.0%
-
13.5%
]
13.25%
78,60625.4%
[
13.5%
-
14.0%
]
13.63%
201,34623.7%
[
14.0%
-
14.5%
]
14.08%
44,52716.6%
[
15.0%
-
15.5%
]
15.27%
22,88622.2%
[
15.5%
-
16.0%
]
15.75%
29,56521.7%
[
16.0%
-
16.5%
]
16.13%
153,19821.1%
[
16.5%
-
17.0%
]
16.52%
66616.2%
[
18.0%
-
18.5%
]
18.18%
65,30831.0%
[
18.5%
-
19.0%
]
18.65%
29,18028.9%
[
20.0%
-
20.5%
]
20.33%
1,86442.4%
[
20.5%
-
21.0%
]
20.89%
15,39323.7%
[
21.0%
-
21.5%
]
21.10%
89112.6%
[
22.0%
-
22.5%
]
22.24%
26,10830.9%
[
24.5%
-
25.0%
]
24.50%
8,94243.2%
[
25.0%
-
25.5%
]
25.01%
23,20030.2%
[
26.5%
-
27.0%
]
26.66%
47,8932.8%
[
27.0%
-
27.5%
]
27.36%
40256.5%
[
32.5%
-
33.0%
]
32.78%
23,67642.7%
[
35.0%
-
35.5%
]
35.35%
83,06918.7%