Immigrants from Eastern Europe Self-Care Disability

COMPARE

Immigrants from Eastern Europe
Race
Ancestry
AfghanAfricanAlaska NativeAlaskan AthabascanAlbanianAleutAlsatianAmericanApacheArabArapahoArgentineanArmenianAssyrian/Chaldean/SyriacAustralianAustrianBahamianBangladeshiBarbadianBasqueBelgianBelizeanBermudanBhutaneseBlackfeetBolivianBrazilianBritishBritish West IndianBulgarianBurmeseCajunCambodianCanadianCape VerdeanCarpatho RusynCelticCentral AmericanCentral American IndianCherokeeCheyenneChickasawChileanChineseChippewaChoctawColombianColvilleComancheCosta RicanCreeCreekCroatianCrowCubanCypriotCzechCzechoslovakianDanishDelawareDominicanDutchDutch West IndianEastern EuropeanEcuadorianEgyptianEnglishEstonianEthiopianEuropeanFijianFilipinoFinnishFrenchFrench American IndianFrench CanadianGermanGerman RussianGhanaianGreekGuamanian/ChamorroGuatemalanGuyaneseHaitianHmongHonduranHopiHoumaHungarianIcelanderIndian (Asian)IndonesianInupiatIranianIraqiIrishIroquoisIsraeliItalianJamaicanJapaneseJordanianKenyanKiowaKoreanLaotianLatvianLebaneseLiberianLithuanianLumbeeLuxembourgerMacedonianMalaysianMalteseMarshalleseMenomineeMexicanMexican American IndianMongolianMoroccanNative HawaiianNavajoNepaleseNew ZealanderNicaraguanNigerianNorthern EuropeanNorwegianOkinawanOsageOttawaPaiutePakistaniPalestinianPanamanianParaguayanPennsylvania GermanPeruvianPimaPolishPortuguesePotawatomiPuebloPuerto RicanPuget Sound SalishRomanianRussianSalvadoranSamoanScandinavianScotch-IrishScottishSeminoleSenegaleseSerbianShoshoneSierra LeoneanSiouxSlavicSlovakSloveneSomaliSouth AfricanSouth AmericanSouth American IndianSoviet UnionSpaniardSpanishSpanish AmericanSpanish American IndianSri LankanSubsaharan AfricanSudaneseSwedishSwissSyrianTaiwaneseThaiTlingit-HaidaTohono O'OdhamTonganTrinidadian and TobagonianTsimshianTurkishU.S. Virgin IslanderUgandanUkrainianUruguayanUteVenezuelanVietnameseWelshWest IndianYakamaYaquiYugoslavianYumanYup'ikZimbabwean
Immigration
NonimmigrantsImmigrantsAfghanistanAfricaAlbaniaArgentinaArmeniaAsiaAustraliaAustriaBahamasBangladeshBarbadosBelarusBelgiumBelizeBoliviaBosnia and HerzegovinaBrazilBulgariaBurma/MyanmarCabo VerdeCambodiaCameroonCanadaCaribbeanCentral AmericaChileChinaColombiaCongoCosta RicaCroatiaCubaCzechoslovakiaDenmarkDominicaDominican RepublicEastern AfricaEastern AsiaEastern EuropeEcuadorEgyptEl SalvadorEnglandEritreaEthiopiaEuropeFijiFranceGermanyGhanaGreeceGrenadaGuatemalaGuyanaHaitiHondurasHong KongHungaryIndiaIndonesiaIranIraqIrelandIsraelItalyJamaicaJapanJordanKazakhstanKenyaKoreaKuwaitLaosLatin AmericaLatviaLebanonLiberiaLithuaniaMalaysiaMexicoMicronesiaMiddle AfricaMoldovaMoroccoNepalNetherlandsNicaraguaNigeriaNorth AmericaNorth MacedoniaNorthern AfricaNorthern EuropeNorwayOceaniaPakistanPanamaPeruPhilippinesPolandPortugalRomaniaRussiaSaudi ArabiaScotlandSenegalSerbiaSierra LeoneSingaporeSomaliaSouth AfricaSouth AmericaSouth Central AsiaSouth Eastern AsiaSouthern EuropeSpainSri LankaSt. Vincent and the GrenadinesSudanSwedenSwitzerlandSyriaTaiwanThailandTrinidad and TobagoTurkeyUgandaUkraineUruguayUzbekistanVenezuelaVietnamWest IndiesWestern AfricaWestern AsiaWestern EuropeYemenZaireZimbabweAzores
Select to Compare
Race
Ancestry
AfghanAfricanAlaska NativeAlaskan AthabascanAlbanianAleutAlsatianAmericanApacheArabArapahoArgentineanArmenianAssyrian/Chaldean/SyriacAustralianAustrianBahamianBangladeshiBarbadianBasqueBelgianBelizeanBermudanBhutaneseBlackfeetBolivianBrazilianBritishBritish West IndianBulgarianBurmeseCajunCambodianCanadianCape VerdeanCarpatho RusynCelticCentral AmericanCentral American IndianCherokeeCheyenneChickasawChileanChineseChippewaChoctawColombianColvilleComancheCosta RicanCreeCreekCroatianCrowCubanCypriotCzechCzechoslovakianDanishDelawareDominicanDutchDutch West IndianEastern EuropeanEcuadorianEgyptianEnglishEstonianEthiopianEuropeanFijianFilipinoFinnishFrenchFrench American IndianFrench CanadianGermanGerman RussianGhanaianGreekGuamanian/ChamorroGuatemalanGuyaneseHaitianHmongHonduranHopiHoumaHungarianIcelanderIndian (Asian)IndonesianInupiatIranianIraqiIrishIroquoisIsraeliItalianJamaicanJapaneseJordanianKenyanKiowaKoreanLaotianLatvianLebaneseLiberianLithuanianLumbeeLuxembourgerMacedonianMalaysianMalteseMarshalleseMenomineeMexicanMexican American IndianMongolianMoroccanNative HawaiianNavajoNepaleseNew ZealanderNicaraguanNigerianNorthern EuropeanNorwegianOkinawanOsageOttawaPaiutePakistaniPalestinianPanamanianParaguayanPennsylvania GermanPeruvianPimaPolishPortuguesePotawatomiPuebloPuerto RicanPuget Sound SalishRomanianRussianSalvadoranSamoanScandinavianScotch-IrishScottishSeminoleSenegaleseSerbianShoshoneSierra LeoneanSiouxSlavicSlovakSloveneSomaliSouth AfricanSouth AmericanSouth American IndianSoviet UnionSpaniardSpanishSpanish AmericanSpanish American IndianSri LankanSubsaharan AfricanSudaneseSwedishSwissSyrianTaiwaneseThaiTlingit-HaidaTohono O'OdhamTonganTrinidadian and TobagonianTsimshianTurkishU.S. Virgin IslanderUgandanUkrainianUruguayanUteVenezuelanVietnameseWelshWest IndianYakamaYaquiYugoslavianYumanYup'ikZimbabwean
Immigration
NonimmigrantsImmigrantsAfghanistanAfricaAlbaniaArgentinaArmeniaAsiaAustraliaAustriaBahamasBangladeshBarbadosBelarusBelgiumBelizeBoliviaBosnia and HerzegovinaBrazilBulgariaBurma/MyanmarCabo VerdeCambodiaCameroonCanadaCaribbeanCentral AmericaChileChinaColombiaCongoCosta RicaCroatiaCubaCzechoslovakiaDenmarkDominicaDominican RepublicEastern AfricaEastern AsiaEcuadorEgyptEl SalvadorEnglandEritreaEthiopiaEuropeFijiFranceGermanyGhanaGreeceGrenadaGuatemalaGuyanaHaitiHondurasHong KongHungaryIndiaIndonesiaIranIraqIrelandIsraelItalyJamaicaJapanJordanKazakhstanKenyaKoreaKuwaitLaosLatin AmericaLatviaLebanonLiberiaLithuaniaMalaysiaMexicoMicronesiaMiddle AfricaMoldovaMoroccoNepalNetherlandsNicaraguaNigeriaNorth AmericaNorth MacedoniaNorthern AfricaNorthern EuropeNorwayOceaniaPakistanPanamaPeruPhilippinesPolandPortugalRomaniaRussiaSaudi ArabiaScotlandSenegalSerbiaSierra LeoneSingaporeSomaliaSouth AfricaSouth AmericaSouth Central AsiaSouth Eastern AsiaSouthern EuropeSpainSri LankaSt. Vincent and the GrenadinesSudanSwedenSwitzerlandSyriaTaiwanThailandTrinidad and TobagoTurkeyUgandaUkraineUruguayUzbekistanVenezuelaVietnamWest IndiesWestern AfricaWestern AsiaWestern EuropeYemenZaireZimbabweAzores
Self-Care Disability
Income
Poverty
Unemployment
Labor Participation
Family Structure
Vehicle Availability
Education Level
Disability

Immigrants from Eastern Europe Self-Care Disability
Fair

2.5%
SELF-CARE DISABILITY
28.0/ 100
METRIC RATING
189th/ 347
METRIC RANK

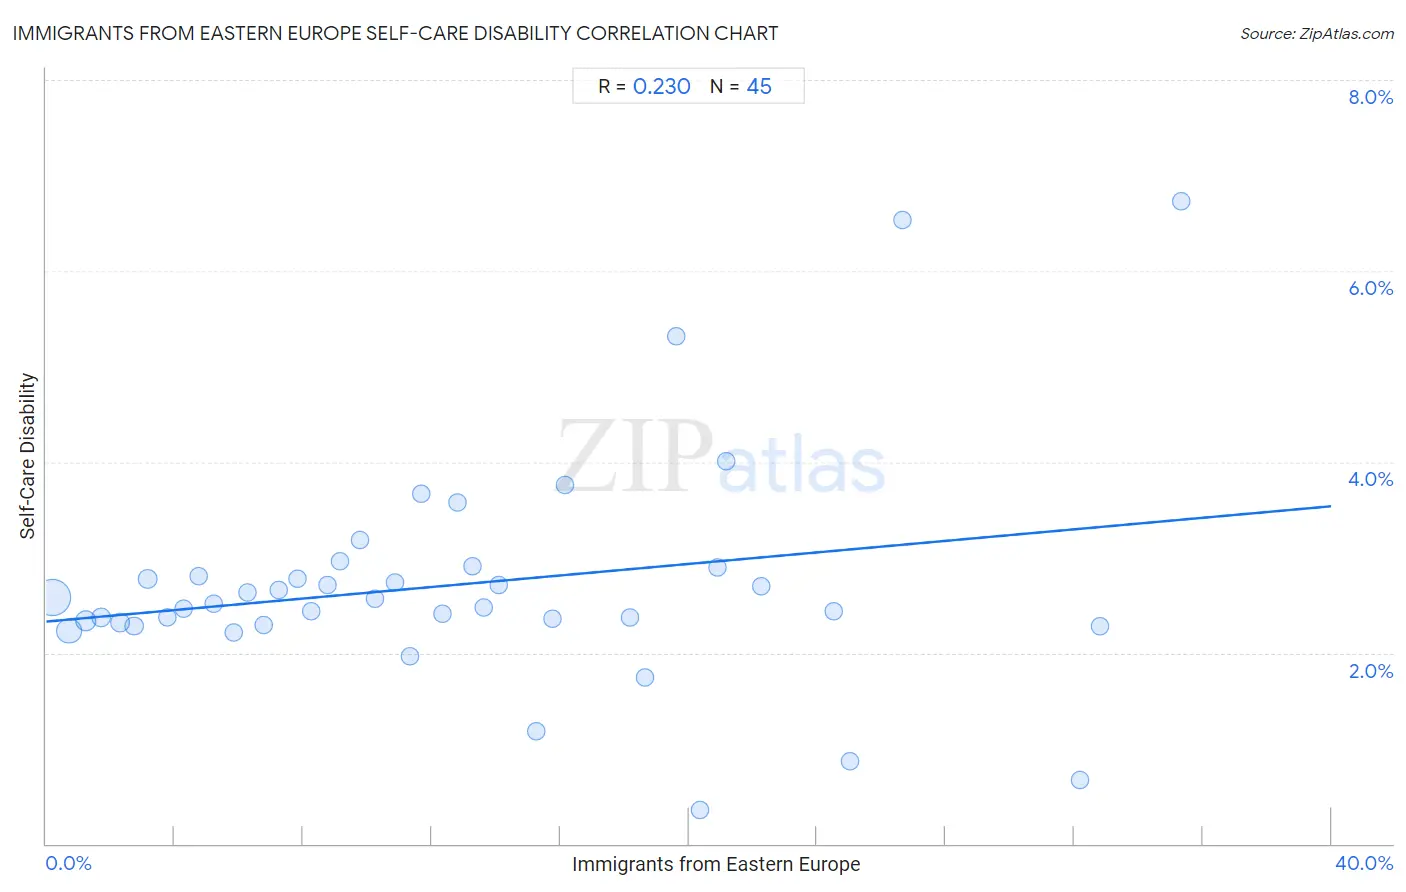
Immigrants from Eastern Europe Self-Care Disability Correlation Chart

The statistical analysis conducted on geographies consisting of 474,965,919 people shows a weak positive correlation between the proportion of Immigrants from Eastern Europe and percentage of population with self-care disability in the United States with a correlation coefficient (R) of 0.230 and weighted average of 2.5%. On average, for every 1% (one percent) increase in Immigrants from Eastern Europe within a typical geography, there is an increase of 0.030% in percentage of population with self-care disability.
Immigrants from Eastern Europe Self-Care Disability
It is essential to understand that the correlation between the percentage of Immigrants from Eastern Europe and percentage of population with self-care disability does not imply a direct cause-and-effect relationship. It remains uncertain whether the presence of Immigrants from Eastern Europe influences an upward or downward trend in the level of percentage of population with self-care disability within an area, or if Immigrants from Eastern Europe simply ended up residing in those areas with higher or lower levels of percentage of population with self-care disability due to other factors.

Demographics Similar to Immigrants from Eastern Europe by Self-Care Disability

In terms of self-care disability, the demographic groups most similar to Immigrants from Eastern Europe are Immigrants from Oceania (2.5%, a difference of 0.010%), Irish (2.5%, a difference of 0.040%), Sioux (2.5%, a difference of 0.21%), Immigrants from El Salvador (2.5%, a difference of 0.28%), and Moroccan (2.5%, a difference of 0.32%).
DemographicsRating | RankSelf-Care Disability
Maltese
37.5
/100
|
#182
Fair
2.5%
Salvadorans
36.4
/100
|
#183
Fair
2.5%
Yugoslavians
36.1
/100
|
#184
Fair
2.5%
Slavs
34.3
/100
|
#185
Fair
2.5%
Immigrants from El Salvador
33.0
/100
|
#186
Fair
2.5%
Irish
28.7
/100
|
#187
Fair
2.5%
Immigrants from Oceania
28.3
/100
|
#188
Fair
2.5%
Immigrants from Eastern Europe
28.0
/100
|
#189
Fair
2.5%
Sioux
24.6
/100
|
#190
Fair
2.5%
Moroccans
22.9
/100
|
#191
Fair
2.5%
Soviet Union
22.2
/100
|
#192
Fair
2.5%
Ukrainians
21.4
/100
|
#193
Fair
2.5%
Immigrants from Germany
17.9
/100
|
#194
Poor
2.5%
Immigrants from Southern Europe
15.6
/100
|
#195
Poor
2.5%
Koreans
15.5
/100
|
#196
Poor
2.5%

Immigrants from Eastern Europe Self-Care Disability Correlation Summary

MeasurementImmigrants from Eastern Europe DataSelf-Care Disability Data
Minimum0.21%0.35%
Maximum35.3%6.7%
Range35.1%6.4%
Mean12.8%2.7%
Median11.3%2.5%
Interquartile 25% (IQ1)5.5%2.3%
Interquartile 75% (IQ3)19.1%2.8%
Interquartile Range (IQR)13.6%0.54%
Standard Deviation (Sample)9.0%1.2%
Standard Deviation (Population)8.9%1.2%

Correlation Details

Immigrants from Eastern Europe PercentileSample SizeSelf-Care Disability
[
0.0%
-
0.5%
]
0.21%
262,902,1572.6%
[
0.5%
-
1.0%
]
0.72%
95,298,1052.2%
[
1.0%
-
1.5%
]
1.23%
47,438,9322.3%
[
1.5%
-
2.0%
]
1.72%
20,445,2112.4%
[
2.0%
-
2.5%
]
2.28%
14,810,1432.3%
[
2.5%
-
3.0%
]
2.74%
6,865,3872.3%
[
3.0%
-
3.5%
]
3.16%
12,425,5122.8%
[
3.5%
-
4.0%
]
3.76%
3,427,9112.4%
[
4.0%
-
4.5%
]
4.27%
2,640,0552.5%
[
4.5%
-
5.0%
]
4.74%
1,666,6002.8%
[
5.0%
-
5.5%
]
5.20%
1,065,6432.5%
[
5.5%
-
6.0%
]
5.82%
777,7042.2%
[
6.0%
-
6.5%
]
6.26%
790,4812.6%
[
6.5%
-
7.0%
]
6.76%
448,5452.3%
[
7.0%
-
7.5%
]
7.23%
406,9832.7%
[
7.5%
-
8.0%
]
7.81%
379,0892.8%
[
8.0%
-
8.5%
]
8.24%
372,1002.4%
[
8.5%
-
9.0%
]
8.75%
32,6662.7%
[
9.0%
-
9.5%
]
9.15%
255,8093.0%
[
9.5%
-
10.0%
]
9.76%
247,8783.2%
[
10.0%
-
10.5%
]
10.24%
354,1112.6%
[
10.5%
-
11.0%
]
10.86%
411,3162.7%
[
11.0%
-
11.5%
]
11.32%
137,5792.0%
[
11.5%
-
12.0%
]
11.66%
163,1573.7%
[
12.0%
-
12.5%
]
12.35%
234,6292.4%
[
12.5%
-
13.0%
]
12.81%
108,5993.6%
[
13.0%
-
13.5%
]
13.25%
78,6062.9%
[
13.5%
-
14.0%
]
13.63%
202,4482.5%
[
14.0%
-
14.5%
]
14.08%
45,3182.7%
[
15.0%
-
15.5%
]
15.26%
21,0641.2%
[
15.5%
-
16.0%
]
15.75%
29,5652.4%
[
16.0%
-
16.5%
]
16.13%
153,1983.8%
[
18.0%
-
18.5%
]
18.18%
65,0702.4%
[
18.5%
-
19.0%
]
18.64%
30,0801.7%
[
19.5%
-
20.0%
]
19.61%
3575.3%
[
20.0%
-
20.5%
]
20.33%
1,8640.35%
[
20.5%
-
21.0%
]
20.89%
15,3302.9%
[
21.0%
-
21.5%
]
21.18%
1,5394.0%
[
22.0%
-
22.5%
]
22.24%
26,4082.7%
[
24.5%
-
25.0%
]
24.50%
8,9422.4%
[
25.0%
-
25.5%
]
25.01%
23,2000.86%
[
26.5%
-
27.0%
]
26.66%
47,8936.5%
[
32.0%
-
32.5%
]
32.16%
1,9900.67%
[
32.5%
-
33.0%
]
32.78%
23,6762.3%
[
35.0%
-
35.5%
]
35.35%
83,0696.7%