Immigrants from Eastern Europe Disability Age 5 to 17
COMPARE
Immigrants from Eastern Europe
Select to Compare
Disability Age 5 to 17
Immigrants from Eastern Europe Disability Age 5 to 17
5.1%
DISABILITY | AGE 5 TO 17
99.9/ 100
METRIC RATING
60th/ 347
METRIC RANK
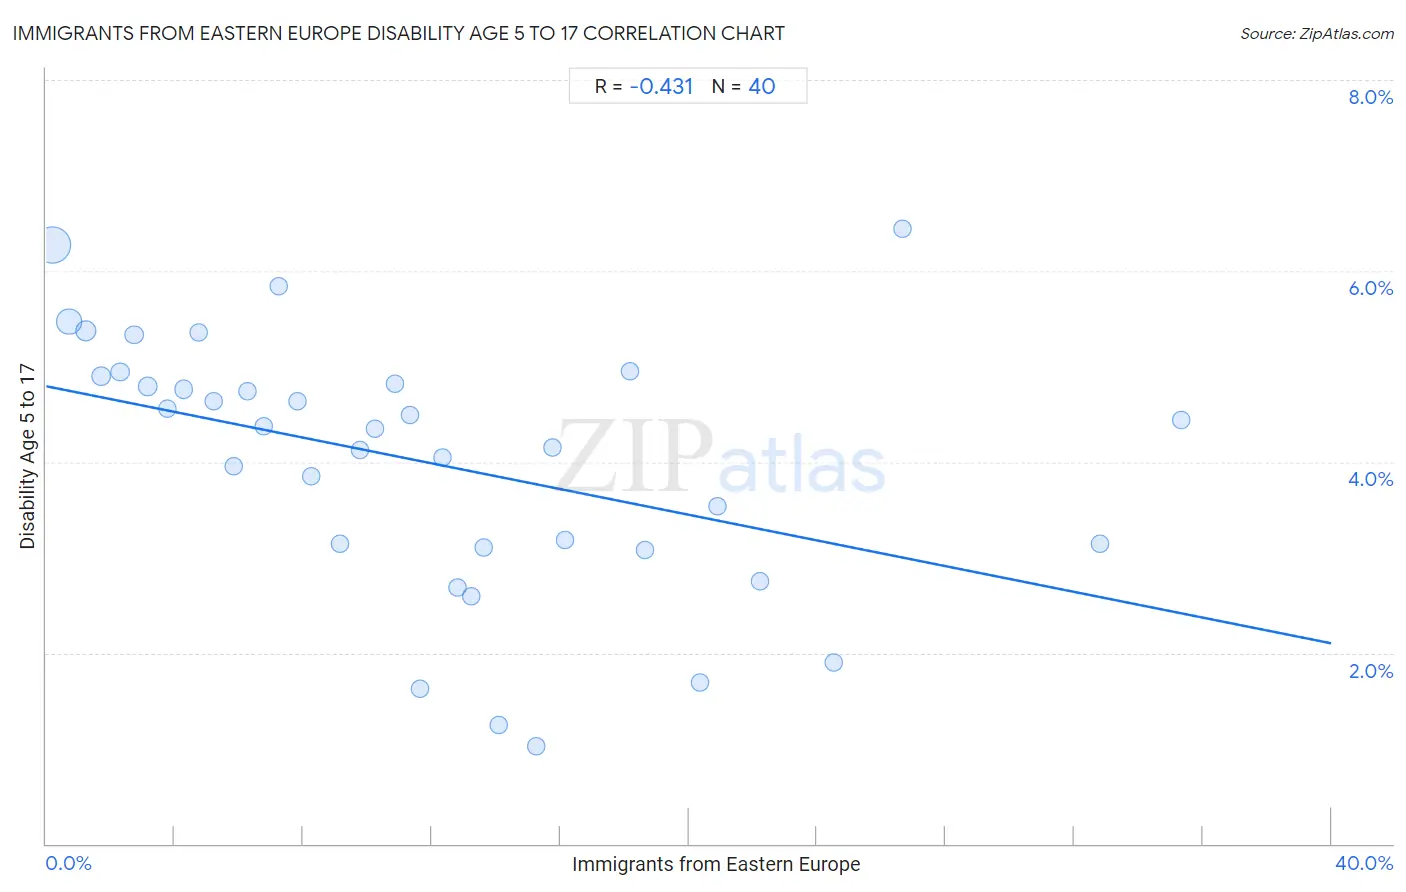
Immigrants from Eastern Europe Disability Age 5 to 17 Correlation Chart
The statistical analysis conducted on geographies consisting of 469,560,483 people shows a moderate negative correlation between the proportion of Immigrants from Eastern Europe and percentage of population with a disability between the ages 5 and 17 in the United States with a correlation coefficient (R) of -0.431 and weighted average of 5.1%. On average, for every 1% (one percent) increase in Immigrants from Eastern Europe within a typical geography, there is a decrease of 0.067% in percentage of population with a disability between the ages 5 and 17.
It is essential to understand that the correlation between the percentage of Immigrants from Eastern Europe and percentage of population with a disability between the ages 5 and 17 does not imply a direct cause-and-effect relationship. It remains uncertain whether the presence of Immigrants from Eastern Europe influences an upward or downward trend in the level of percentage of population with a disability between the ages 5 and 17 within an area, or if Immigrants from Eastern Europe simply ended up residing in those areas with higher or lower levels of percentage of population with a disability between the ages 5 and 17 due to other factors.
Demographics Similar to Immigrants from Eastern Europe by Disability Age 5 to 17
In terms of disability age 5 to 17, the demographic groups most similar to Immigrants from Eastern Europe are Immigrants from North Macedonia (5.1%, a difference of 0.11%), Immigrants from Ukraine (5.1%, a difference of 0.29%), Immigrants from Poland (5.1%, a difference of 0.38%), Immigrants from Switzerland (5.2%, a difference of 0.48%), and Immigrants from Turkey (5.1%, a difference of 0.52%).
| Demographics | Rating | Rank | Disability Age 5 to 17 |
| Immigrants from Lithuania | 99.9 /100 | #53 | Exceptional 5.1% |
| Paraguayans | 99.9 /100 | #54 | Exceptional 5.1% |
| Laotians | 99.9 /100 | #55 | Exceptional 5.1% |
| Immigrants from Turkey | 99.9 /100 | #56 | Exceptional 5.1% |
| Immigrants from Poland | 99.9 /100 | #57 | Exceptional 5.1% |
| Immigrants from Ukraine | 99.9 /100 | #58 | Exceptional 5.1% |
| Immigrants from North Macedonia | 99.9 /100 | #59 | Exceptional 5.1% |
| Immigrants from Eastern Europe | 99.9 /100 | #60 | Exceptional 5.1% |
| Immigrants from Switzerland | 99.8 /100 | #61 | Exceptional 5.2% |
| Immigrants from Ireland | 99.8 /100 | #62 | Exceptional 5.2% |
| Immigrants from Bangladesh | 99.8 /100 | #63 | Exceptional 5.2% |
| Immigrants from South Eastern Asia | 99.8 /100 | #64 | Exceptional 5.2% |
| Immigrants from Greece | 99.8 /100 | #65 | Exceptional 5.2% |
| Palestinians | 99.8 /100 | #66 | Exceptional 5.2% |
| Macedonians | 99.8 /100 | #67 | Exceptional 5.2% |
Immigrants from Eastern Europe Disability Age 5 to 17 Correlation Summary
| Measurement | Immigrants from Eastern Europe Data | Disability Age 5 to 17 Data |
| Minimum | 0.21% | 1.0% |
| Maximum | 35.3% | 6.4% |
| Range | 35.1% | 5.4% |
| Mean | 11.7% | 4.0% |
| Median | 10.5% | 4.4% |
| Interquartile 25% (IQ1) | 5.0% | 3.1% |
| Interquartile 75% (IQ3) | 15.9% | 4.9% |
| Interquartile Range (IQR) | 11.0% | 1.7% |
| Standard Deviation (Sample) | 8.6% | 1.3% |
| Standard Deviation (Population) | 8.5% | 1.3% |
Correlation Details
| Immigrants from Eastern Europe Percentile | Sample Size | Disability Age 5 to 17 |
[ 0.0% - 0.5% ] 0.21% | 260,898,386 | 6.3% |
[ 0.5% - 1.0% ] 0.72% | 94,059,451 | 5.5% |
[ 1.0% - 1.5% ] 1.23% | 46,722,189 | 5.4% |
[ 1.5% - 2.0% ] 1.72% | 20,042,834 | 4.9% |
[ 2.0% - 2.5% ] 2.29% | 14,560,836 | 4.9% |
[ 2.5% - 3.0% ] 2.74% | 6,674,623 | 5.3% |
[ 3.0% - 3.5% ] 3.16% | 12,299,250 | 4.8% |
[ 3.5% - 4.0% ] 3.76% | 3,348,525 | 4.6% |
[ 4.0% - 4.5% ] 4.27% | 2,593,030 | 4.8% |
[ 4.5% - 5.0% ] 4.73% | 1,582,901 | 5.4% |
[ 5.0% - 5.5% ] 5.20% | 1,038,919 | 4.6% |
[ 5.5% - 6.0% ] 5.83% | 729,817 | 4.0% |
[ 6.0% - 6.5% ] 6.26% | 771,404 | 4.7% |
[ 6.5% - 7.0% ] 6.76% | 423,885 | 4.4% |
[ 7.0% - 7.5% ] 7.23% | 391,621 | 5.8% |
[ 7.5% - 8.0% ] 7.81% | 370,698 | 4.6% |
[ 8.0% - 8.5% ] 8.25% | 361,135 | 3.8% |
[ 9.0% - 9.5% ] 9.15% | 255,809 | 3.1% |
[ 9.5% - 10.0% ] 9.76% | 241,177 | 4.1% |
[ 10.0% - 10.5% ] 10.24% | 351,696 | 4.3% |
[ 10.5% - 11.0% ] 10.86% | 406,401 | 4.8% |
[ 11.0% - 11.5% ] 11.33% | 132,192 | 4.5% |
[ 11.5% - 12.0% ] 11.65% | 160,141 | 1.6% |
[ 12.0% - 12.5% ] 12.35% | 232,893 | 4.0% |
[ 12.5% - 13.0% ] 12.81% | 106,517 | 2.7% |
[ 13.0% - 13.5% ] 13.23% | 56,404 | 2.6% |
[ 13.5% - 14.0% ] 13.63% | 201,346 | 3.1% |
[ 14.0% - 14.5% ] 14.07% | 43,382 | 1.2% |
[ 15.0% - 15.5% ] 15.26% | 21,064 | 1.0% |
[ 15.5% - 16.0% ] 15.75% | 29,565 | 4.2% |
[ 16.0% - 16.5% ] 16.13% | 153,198 | 3.2% |
[ 18.0% - 18.5% ] 18.18% | 64,944 | 4.9% |
[ 18.5% - 19.0% ] 18.65% | 29,180 | 3.1% |
[ 20.0% - 20.5% ] 20.33% | 1,864 | 1.7% |
[ 20.5% - 21.0% ] 20.89% | 15,393 | 3.5% |
[ 22.0% - 22.5% ] 22.23% | 24,233 | 2.7% |
[ 24.5% - 25.0% ] 24.50% | 8,942 | 1.9% |
[ 26.5% - 27.0% ] 26.66% | 47,893 | 6.4% |
[ 32.5% - 33.0% ] 32.78% | 23,676 | 3.1% |
[ 35.0% - 35.5% ] 35.35% | 83,069 | 4.4% |