Immigrants from Eastern Asia vs Immigrants from Nigeria Married-Couple Family Poverty
COMPARE
Immigrants from Eastern Asia
Immigrants from Nigeria
Married-Couple Family Poverty
Married-Couple Family Poverty Comparison
Immigrants from Eastern Asia
Immigrants from Nigeria
4.8%
MARRIED-COUPLE FAMILY POVERTY
94.0/ 100
METRIC RATING
119th/ 347
METRIC RANK
5.5%
MARRIED-COUPLE FAMILY POVERTY
11.3/ 100
METRIC RATING
217th/ 347
METRIC RANK
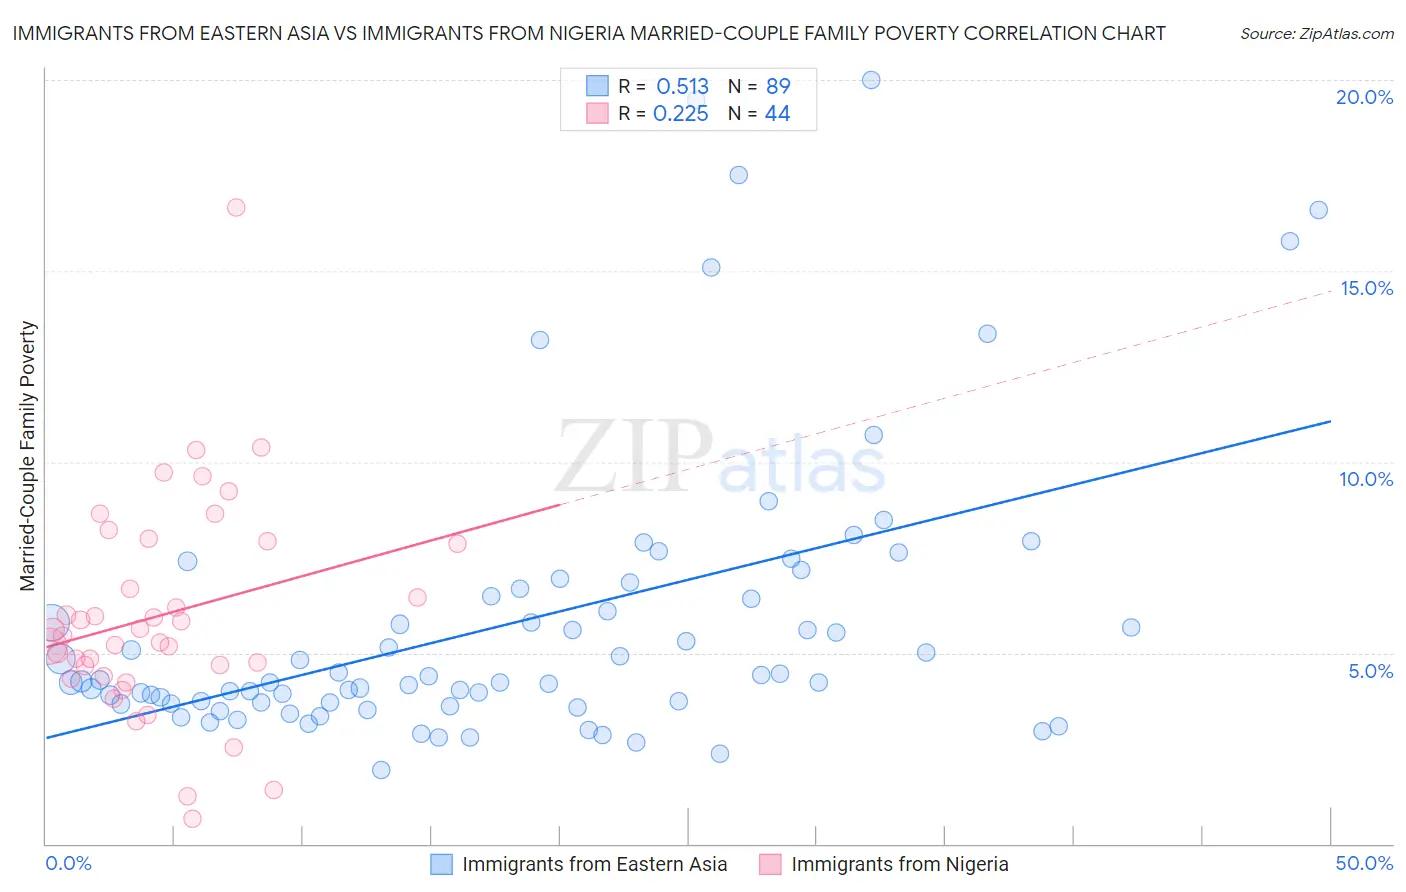
Immigrants from Eastern Asia vs Immigrants from Nigeria Married-Couple Family Poverty Correlation Chart
The statistical analysis conducted on geographies consisting of 492,141,464 people shows a substantial positive correlation between the proportion of Immigrants from Eastern Asia and poverty level among married-couple families in the United States with a correlation coefficient (R) of 0.513 and weighted average of 4.8%. Similarly, the statistical analysis conducted on geographies consisting of 282,008,178 people shows a weak positive correlation between the proportion of Immigrants from Nigeria and poverty level among married-couple families in the United States with a correlation coefficient (R) of 0.225 and weighted average of 5.5%, a difference of 15.2%.
Married-Couple Family Poverty Correlation Summary
| Measurement | Immigrants from Eastern Asia | Immigrants from Nigeria |
| Minimum | 1.9% | 0.65% |
| Maximum | 20.0% | 16.7% |
| Range | 18.1% | 16.0% |
| Mean | 5.8% | 6.0% |
| Median | 4.3% | 5.5% |
| Interquartile 25% (IQ1) | 3.7% | 4.5% |
| Interquartile 75% (IQ3) | 6.6% | 7.9% |
| Interquartile Range (IQR) | 2.9% | 3.4% |
| Standard Deviation (Sample) | 3.8% | 2.8% |
| Standard Deviation (Population) | 3.8% | 2.8% |
Similar Demographics by Married-Couple Family Poverty
Demographics Similar to Immigrants from Eastern Asia by Married-Couple Family Poverty
In terms of married-couple family poverty, the demographic groups most similar to Immigrants from Eastern Asia are Immigrants from Southern Europe (4.8%, a difference of 0.32%), Immigrants from Philippines (4.8%, a difference of 0.37%), Kenyan (4.8%, a difference of 0.39%), Indian (Asian) (4.8%, a difference of 0.42%), and White/Caucasian (4.8%, a difference of 0.46%).
| Demographics | Rating | Rank | Married-Couple Family Poverty |
| Tongans | 95.9 /100 | #112 | Exceptional 4.7% |
| Immigrants | Nepal | 95.9 /100 | #113 | Exceptional 4.7% |
| Immigrants | Indonesia | 95.1 /100 | #114 | Exceptional 4.8% |
| Taiwanese | 94.8 /100 | #115 | Exceptional 4.8% |
| Celtics | 94.8 /100 | #116 | Exceptional 4.8% |
| Kenyans | 94.7 /100 | #117 | Exceptional 4.8% |
| Immigrants | Philippines | 94.6 /100 | #118 | Exceptional 4.8% |
| Immigrants | Eastern Asia | 94.0 /100 | #119 | Exceptional 4.8% |
| Immigrants | Southern Europe | 93.4 /100 | #120 | Exceptional 4.8% |
| Indians (Asian) | 93.2 /100 | #121 | Exceptional 4.8% |
| Whites/Caucasians | 93.1 /100 | #122 | Exceptional 4.8% |
| Jordanians | 93.1 /100 | #123 | Exceptional 4.8% |
| Romanians | 92.5 /100 | #124 | Exceptional 4.8% |
| Immigrants | Bosnia and Herzegovina | 92.5 /100 | #125 | Exceptional 4.8% |
| Immigrants | Asia | 92.3 /100 | #126 | Exceptional 4.8% |
Demographics Similar to Immigrants from Nigeria by Married-Couple Family Poverty
In terms of married-couple family poverty, the demographic groups most similar to Immigrants from Nigeria are Afghan (5.5%, a difference of 0.020%), Potawatomi (5.5%, a difference of 0.29%), Armenian (5.5%, a difference of 0.41%), Japanese (5.6%, a difference of 0.42%), and Iroquois (5.5%, a difference of 0.47%).
| Demographics | Rating | Rank | Married-Couple Family Poverty |
| Immigrants | Micronesia | 14.4 /100 | #210 | Poor 5.5% |
| Nigerians | 14.3 /100 | #211 | Poor 5.5% |
| Immigrants | Thailand | 14.0 /100 | #212 | Poor 5.5% |
| Immigrants | Liberia | 13.3 /100 | #213 | Poor 5.5% |
| Iroquois | 13.1 /100 | #214 | Poor 5.5% |
| Armenians | 12.8 /100 | #215 | Poor 5.5% |
| Potawatomi | 12.4 /100 | #216 | Poor 5.5% |
| Immigrants | Nigeria | 11.3 /100 | #217 | Poor 5.5% |
| Afghans | 11.2 /100 | #218 | Poor 5.5% |
| Japanese | 9.8 /100 | #219 | Tragic 5.6% |
| Colombians | 9.2 /100 | #220 | Tragic 5.6% |
| Panamanians | 9.2 /100 | #221 | Tragic 5.6% |
| Cajuns | 6.9 /100 | #222 | Tragic 5.6% |
| Immigrants | Fiji | 6.7 /100 | #223 | Tragic 5.6% |
| Sudanese | 6.4 /100 | #224 | Tragic 5.6% |