Immigrants from Eastern Asia vs Immigrants from the Azores Married-Couple Family Poverty
COMPARE
Immigrants from Eastern Asia
Immigrants from the Azores
Married-Couple Family Poverty
Married-Couple Family Poverty Comparison
Immigrants from Eastern Asia
Immigrants from the Azores
4.8%
MARRIED-COUPLE FAMILY POVERTY
94.0/ 100
METRIC RATING
119th/ 347
METRIC RANK
5.4%
MARRIED-COUPLE FAMILY POVERTY
27.5/ 100
METRIC RATING
195th/ 347
METRIC RANK
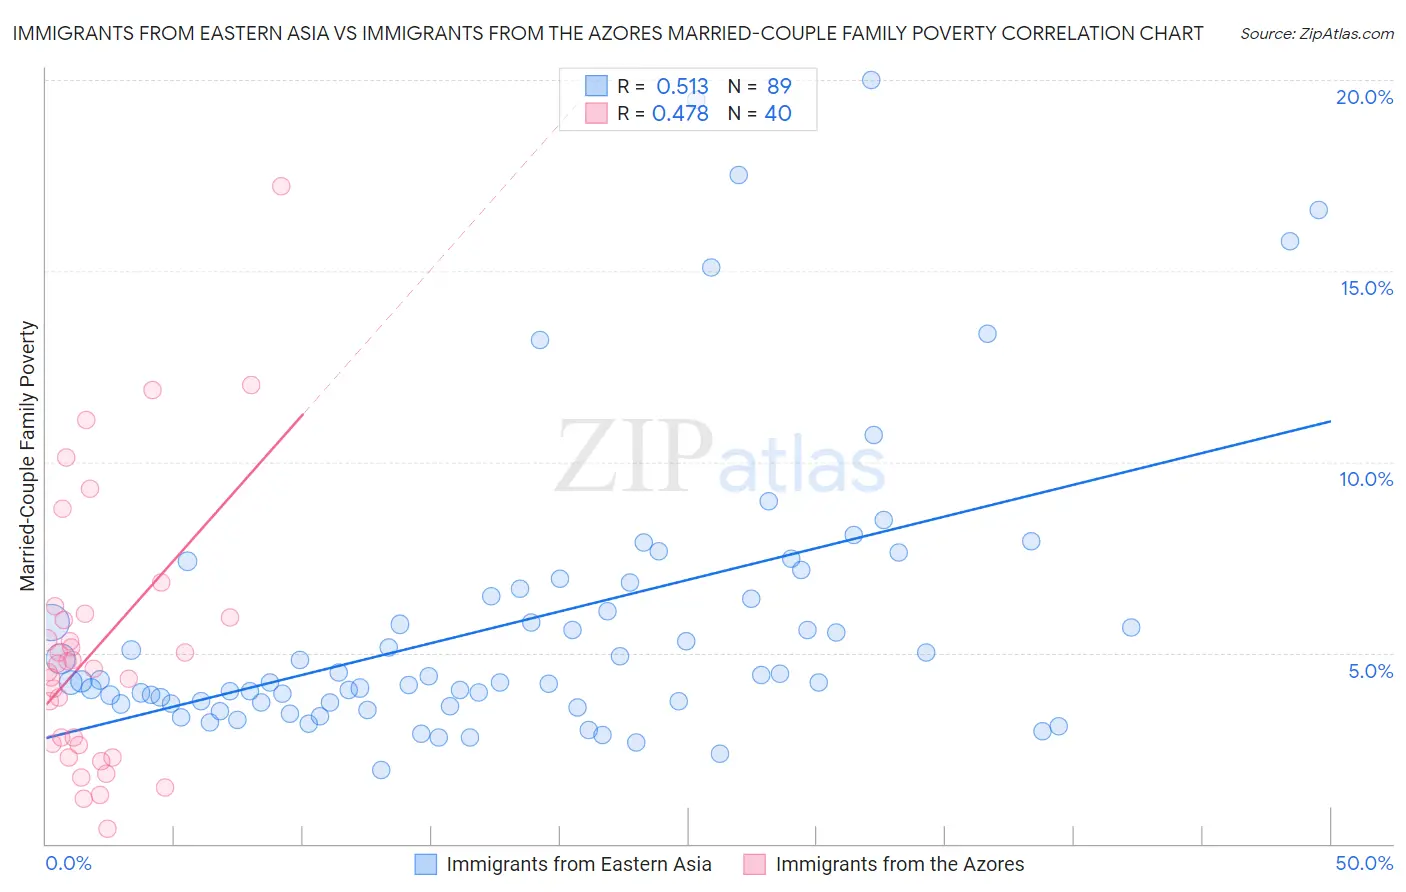
Immigrants from Eastern Asia vs Immigrants from the Azores Married-Couple Family Poverty Correlation Chart
The statistical analysis conducted on geographies consisting of 492,141,464 people shows a substantial positive correlation between the proportion of Immigrants from Eastern Asia and poverty level among married-couple families in the United States with a correlation coefficient (R) of 0.513 and weighted average of 4.8%. Similarly, the statistical analysis conducted on geographies consisting of 46,091,890 people shows a moderate positive correlation between the proportion of Immigrants from the Azores and poverty level among married-couple families in the United States with a correlation coefficient (R) of 0.478 and weighted average of 5.4%, a difference of 11.7%.
Married-Couple Family Poverty Correlation Summary
| Measurement | Immigrants from Eastern Asia | Immigrants from the Azores |
| Minimum | 1.9% | 0.40% |
| Maximum | 20.0% | 17.2% |
| Range | 18.1% | 16.8% |
| Mean | 5.8% | 5.2% |
| Median | 4.3% | 4.6% |
| Interquartile 25% (IQ1) | 3.7% | 2.6% |
| Interquartile 75% (IQ3) | 6.6% | 6.0% |
| Interquartile Range (IQR) | 2.9% | 3.4% |
| Standard Deviation (Sample) | 3.8% | 3.5% |
| Standard Deviation (Population) | 3.8% | 3.5% |
Similar Demographics by Married-Couple Family Poverty
Demographics Similar to Immigrants from Eastern Asia by Married-Couple Family Poverty
In terms of married-couple family poverty, the demographic groups most similar to Immigrants from Eastern Asia are Immigrants from Southern Europe (4.8%, a difference of 0.32%), Immigrants from Philippines (4.8%, a difference of 0.37%), Kenyan (4.8%, a difference of 0.39%), Indian (Asian) (4.8%, a difference of 0.42%), and White/Caucasian (4.8%, a difference of 0.46%).
| Demographics | Rating | Rank | Married-Couple Family Poverty |
| Tongans | 95.9 /100 | #112 | Exceptional 4.7% |
| Immigrants | Nepal | 95.9 /100 | #113 | Exceptional 4.7% |
| Immigrants | Indonesia | 95.1 /100 | #114 | Exceptional 4.8% |
| Taiwanese | 94.8 /100 | #115 | Exceptional 4.8% |
| Celtics | 94.8 /100 | #116 | Exceptional 4.8% |
| Kenyans | 94.7 /100 | #117 | Exceptional 4.8% |
| Immigrants | Philippines | 94.6 /100 | #118 | Exceptional 4.8% |
| Immigrants | Eastern Asia | 94.0 /100 | #119 | Exceptional 4.8% |
| Immigrants | Southern Europe | 93.4 /100 | #120 | Exceptional 4.8% |
| Indians (Asian) | 93.2 /100 | #121 | Exceptional 4.8% |
| Whites/Caucasians | 93.1 /100 | #122 | Exceptional 4.8% |
| Jordanians | 93.1 /100 | #123 | Exceptional 4.8% |
| Romanians | 92.5 /100 | #124 | Exceptional 4.8% |
| Immigrants | Bosnia and Herzegovina | 92.5 /100 | #125 | Exceptional 4.8% |
| Immigrants | Asia | 92.3 /100 | #126 | Exceptional 4.8% |
Demographics Similar to Immigrants from the Azores by Married-Couple Family Poverty
In terms of married-couple family poverty, the demographic groups most similar to Immigrants from the Azores are Spaniard (5.4%, a difference of 0.020%), Immigrants from Israel (5.4%, a difference of 0.040%), Liberian (5.4%, a difference of 0.17%), Immigrants from Belarus (5.4%, a difference of 0.20%), and Malaysian (5.4%, a difference of 0.27%).
| Demographics | Rating | Rank | Married-Couple Family Poverty |
| Israelis | 33.1 /100 | #188 | Fair 5.3% |
| South American Indians | 32.5 /100 | #189 | Fair 5.3% |
| Ugandans | 31.6 /100 | #190 | Fair 5.3% |
| Immigrants | Cabo Verde | 30.9 /100 | #191 | Fair 5.3% |
| Cape Verdeans | 30.7 /100 | #192 | Fair 5.3% |
| Malaysians | 29.5 /100 | #193 | Fair 5.4% |
| Immigrants | Israel | 27.8 /100 | #194 | Fair 5.4% |
| Immigrants | Azores | 27.5 /100 | #195 | Fair 5.4% |
| Spaniards | 27.4 /100 | #196 | Fair 5.4% |
| Liberians | 26.3 /100 | #197 | Fair 5.4% |
| Immigrants | Belarus | 26.2 /100 | #198 | Fair 5.4% |
| Uruguayans | 25.0 /100 | #199 | Fair 5.4% |
| Immigrants | Morocco | 24.3 /100 | #200 | Fair 5.4% |
| Lebanese | 24.1 /100 | #201 | Fair 5.4% |
| Immigrants | Middle Africa | 23.8 /100 | #202 | Fair 5.4% |