Immigrants from Eastern Asia vs Immigrants from Northern Europe Married-Couple Family Poverty
COMPARE
Immigrants from Eastern Asia
Immigrants from Northern Europe
Married-Couple Family Poverty
Married-Couple Family Poverty Comparison
Immigrants from Eastern Asia
Immigrants from Northern Europe
4.8%
MARRIED-COUPLE FAMILY POVERTY
94.0/ 100
METRIC RATING
119th/ 347
METRIC RANK
4.2%
MARRIED-COUPLE FAMILY POVERTY
99.8/ 100
METRIC RATING
39th/ 347
METRIC RANK
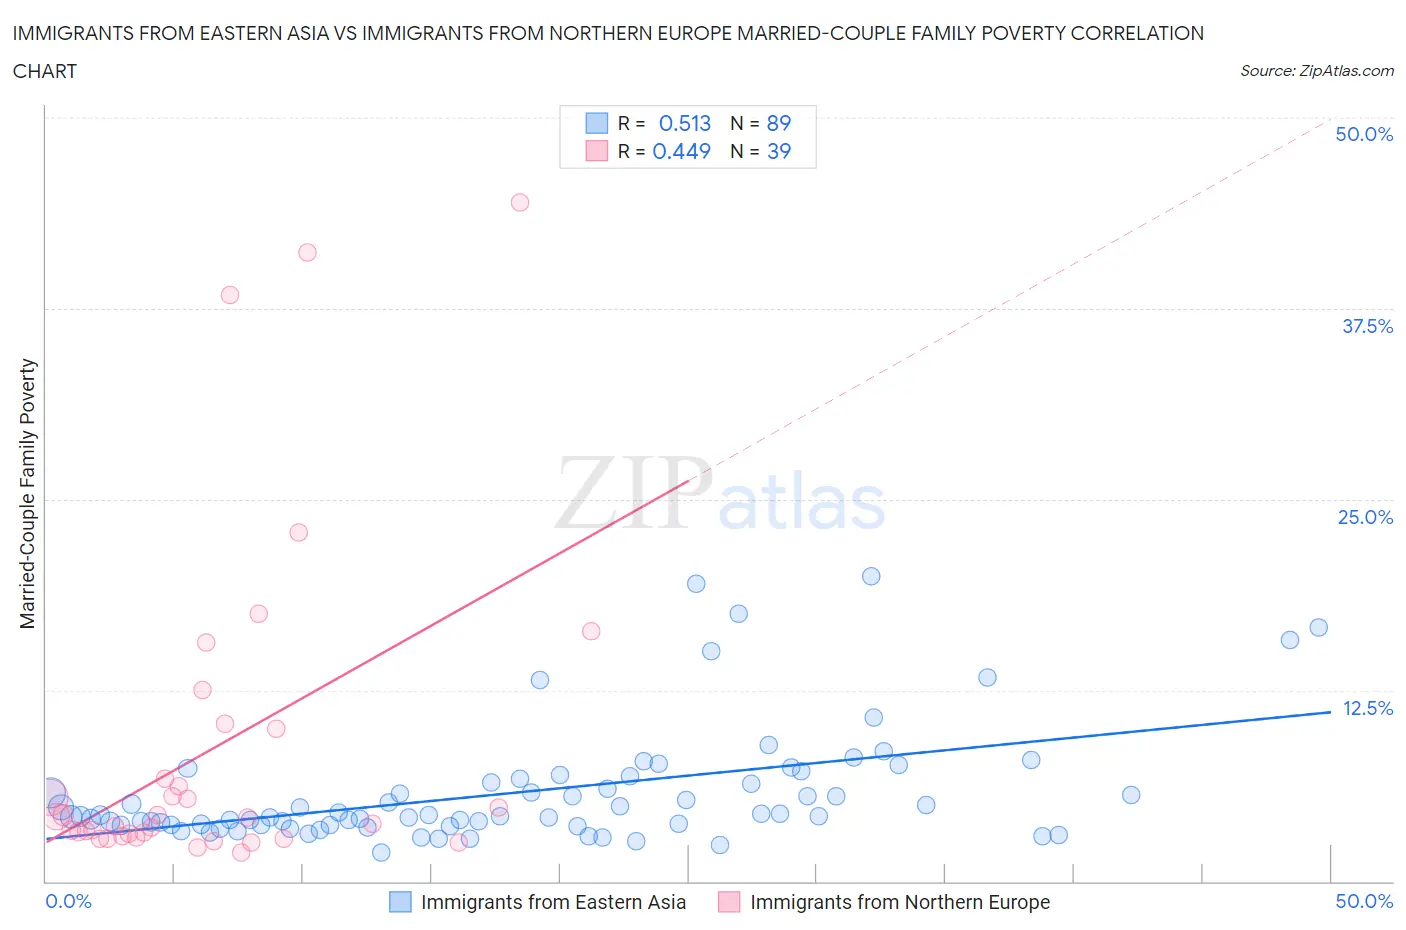
Immigrants from Eastern Asia vs Immigrants from Northern Europe Married-Couple Family Poverty Correlation Chart
The statistical analysis conducted on geographies consisting of 492,141,464 people shows a substantial positive correlation between the proportion of Immigrants from Eastern Asia and poverty level among married-couple families in the United States with a correlation coefficient (R) of 0.513 and weighted average of 4.8%. Similarly, the statistical analysis conducted on geographies consisting of 470,220,521 people shows a moderate positive correlation between the proportion of Immigrants from Northern Europe and poverty level among married-couple families in the United States with a correlation coefficient (R) of 0.449 and weighted average of 4.2%, a difference of 13.3%.
Married-Couple Family Poverty Correlation Summary
| Measurement | Immigrants from Eastern Asia | Immigrants from Northern Europe |
| Minimum | 1.9% | 1.9% |
| Maximum | 20.0% | 44.4% |
| Range | 18.1% | 42.6% |
| Mean | 5.8% | 8.6% |
| Median | 4.3% | 4.2% |
| Interquartile 25% (IQ1) | 3.7% | 3.0% |
| Interquartile 75% (IQ3) | 6.6% | 10.0% |
| Interquartile Range (IQR) | 2.9% | 7.0% |
| Standard Deviation (Sample) | 3.8% | 10.7% |
| Standard Deviation (Population) | 3.8% | 10.6% |
Similar Demographics by Married-Couple Family Poverty
Demographics Similar to Immigrants from Eastern Asia by Married-Couple Family Poverty
In terms of married-couple family poverty, the demographic groups most similar to Immigrants from Eastern Asia are Immigrants from Southern Europe (4.8%, a difference of 0.32%), Immigrants from Philippines (4.8%, a difference of 0.37%), Kenyan (4.8%, a difference of 0.39%), Indian (Asian) (4.8%, a difference of 0.42%), and White/Caucasian (4.8%, a difference of 0.46%).
| Demographics | Rating | Rank | Married-Couple Family Poverty |
| Tongans | 95.9 /100 | #112 | Exceptional 4.7% |
| Immigrants | Nepal | 95.9 /100 | #113 | Exceptional 4.7% |
| Immigrants | Indonesia | 95.1 /100 | #114 | Exceptional 4.8% |
| Taiwanese | 94.8 /100 | #115 | Exceptional 4.8% |
| Celtics | 94.8 /100 | #116 | Exceptional 4.8% |
| Kenyans | 94.7 /100 | #117 | Exceptional 4.8% |
| Immigrants | Philippines | 94.6 /100 | #118 | Exceptional 4.8% |
| Immigrants | Eastern Asia | 94.0 /100 | #119 | Exceptional 4.8% |
| Immigrants | Southern Europe | 93.4 /100 | #120 | Exceptional 4.8% |
| Indians (Asian) | 93.2 /100 | #121 | Exceptional 4.8% |
| Whites/Caucasians | 93.1 /100 | #122 | Exceptional 4.8% |
| Jordanians | 93.1 /100 | #123 | Exceptional 4.8% |
| Romanians | 92.5 /100 | #124 | Exceptional 4.8% |
| Immigrants | Bosnia and Herzegovina | 92.5 /100 | #125 | Exceptional 4.8% |
| Immigrants | Asia | 92.3 /100 | #126 | Exceptional 4.8% |
Demographics Similar to Immigrants from Northern Europe by Married-Couple Family Poverty
In terms of married-couple family poverty, the demographic groups most similar to Immigrants from Northern Europe are Belgian (4.2%, a difference of 0.13%), Iranian (4.2%, a difference of 0.25%), French Canadian (4.2%, a difference of 0.28%), English (4.2%, a difference of 0.32%), and European (4.2%, a difference of 0.35%).
| Demographics | Rating | Rank | Married-Couple Family Poverty |
| Greeks | 99.9 /100 | #32 | Exceptional 4.2% |
| Irish | 99.9 /100 | #33 | Exceptional 4.2% |
| Dutch | 99.9 /100 | #34 | Exceptional 4.2% |
| Europeans | 99.9 /100 | #35 | Exceptional 4.2% |
| English | 99.9 /100 | #36 | Exceptional 4.2% |
| Iranians | 99.9 /100 | #37 | Exceptional 4.2% |
| Belgians | 99.9 /100 | #38 | Exceptional 4.2% |
| Immigrants | Northern Europe | 99.8 /100 | #39 | Exceptional 4.2% |
| French Canadians | 99.8 /100 | #40 | Exceptional 4.2% |
| Northern Europeans | 99.8 /100 | #41 | Exceptional 4.3% |
| Scottish | 99.8 /100 | #42 | Exceptional 4.3% |
| Swiss | 99.8 /100 | #43 | Exceptional 4.3% |
| Immigrants | Japan | 99.8 /100 | #44 | Exceptional 4.3% |
| Serbians | 99.8 /100 | #45 | Exceptional 4.3% |
| British | 99.8 /100 | #46 | Exceptional 4.3% |