Icelander Disability Age 5 to 17

COMPARE

Icelander
Race
Ancestry
AfghanAfricanAlaska NativeAlaskan AthabascanAlbanianAleutAlsatianAmericanApacheArabArapahoArgentineanArmenianAssyrian/Chaldean/SyriacAustralianAustrianBahamianBangladeshiBarbadianBasqueBelgianBelizeanBermudanBhutaneseBlackfeetBolivianBrazilianBritishBritish West IndianBulgarianBurmeseCajunCambodianCanadianCape VerdeanCarpatho RusynCelticCentral AmericanCentral American IndianCherokeeCheyenneChickasawChileanChineseChippewaChoctawColombianColvilleComancheCosta RicanCreeCreekCroatianCrowCubanCypriotCzechCzechoslovakianDanishDelawareDominicanDutchDutch West IndianEastern EuropeanEcuadorianEgyptianEnglishEstonianEthiopianEuropeanFijianFilipinoFinnishFrenchFrench American IndianFrench CanadianGermanGerman RussianGhanaianGreekGuamanian/ChamorroGuatemalanGuyaneseHaitianHmongHonduranHopiHoumaHungarianIcelanderIndian (Asian)IndonesianInupiatIranianIraqiIrishIroquoisIsraeliItalianJamaicanJapaneseJordanianKenyanKiowaKoreanLaotianLatvianLebaneseLiberianLithuanianLumbeeLuxembourgerMacedonianMalaysianMalteseMarshalleseMenomineeMexicanMexican American IndianMongolianMoroccanNative HawaiianNavajoNepaleseNew ZealanderNicaraguanNigerianNorthern EuropeanNorwegianOkinawanOsageOttawaPaiutePakistaniPalestinianPanamanianParaguayanPennsylvania GermanPeruvianPimaPolishPortuguesePotawatomiPuebloPuerto RicanPuget Sound SalishRomanianRussianSalvadoranSamoanScandinavianScotch-IrishScottishSeminoleSenegaleseSerbianShoshoneSierra LeoneanSiouxSlavicSlovakSloveneSomaliSouth AfricanSouth AmericanSouth American IndianSoviet UnionSpaniardSpanishSpanish AmericanSpanish American IndianSri LankanSubsaharan AfricanSudaneseSwedishSwissSyrianTaiwaneseThaiTlingit-HaidaTohono O'OdhamTonganTrinidadian and TobagonianTsimshianTurkishU.S. Virgin IslanderUgandanUkrainianUruguayanUteVenezuelanVietnameseWelshWest IndianYakamaYaquiYugoslavianYumanYup'ikZimbabwean
Immigration
NonimmigrantsImmigrantsAfghanistanAfricaAlbaniaArgentinaArmeniaAsiaAustraliaAustriaBahamasBangladeshBarbadosBelarusBelgiumBelizeBoliviaBosnia and HerzegovinaBrazilBulgariaBurma/MyanmarCabo VerdeCambodiaCameroonCanadaCaribbeanCentral AmericaChileChinaColombiaCongoCosta RicaCroatiaCubaCzechoslovakiaDenmarkDominicaDominican RepublicEastern AfricaEastern AsiaEastern EuropeEcuadorEgyptEl SalvadorEnglandEritreaEthiopiaEuropeFijiFranceGermanyGhanaGreeceGrenadaGuatemalaGuyanaHaitiHondurasHong KongHungaryIndiaIndonesiaIranIraqIrelandIsraelItalyJamaicaJapanJordanKazakhstanKenyaKoreaKuwaitLaosLatin AmericaLatviaLebanonLiberiaLithuaniaMalaysiaMexicoMicronesiaMiddle AfricaMoldovaMoroccoNepalNetherlandsNicaraguaNigeriaNorth AmericaNorth MacedoniaNorthern AfricaNorthern EuropeNorwayOceaniaPakistanPanamaPeruPhilippinesPolandPortugalRomaniaRussiaSaudi ArabiaScotlandSenegalSerbiaSierra LeoneSingaporeSomaliaSouth AfricaSouth AmericaSouth Central AsiaSouth Eastern AsiaSouthern EuropeSpainSri LankaSt. Vincent and the GrenadinesSudanSwedenSwitzerlandSyriaTaiwanThailandTrinidad and TobagoTurkeyUgandaUkraineUruguayUzbekistanVenezuelaVietnamWest IndiesWestern AfricaWestern AsiaWestern EuropeYemenZaireZimbabweAzores
Select to Compare
Race
Ancestry
AfghanAfricanAlaska NativeAlaskan AthabascanAlbanianAleutAlsatianAmericanApacheArabArapahoArgentineanArmenianAssyrian/Chaldean/SyriacAustralianAustrianBahamianBangladeshiBarbadianBasqueBelgianBelizeanBermudanBhutaneseBlackfeetBolivianBrazilianBritishBritish West IndianBulgarianBurmeseCajunCambodianCanadianCape VerdeanCarpatho RusynCelticCentral AmericanCentral American IndianCherokeeCheyenneChickasawChileanChineseChippewaChoctawColombianColvilleComancheCosta RicanCreeCreekCroatianCrowCubanCypriotCzechCzechoslovakianDanishDelawareDominicanDutchDutch West IndianEastern EuropeanEcuadorianEgyptianEnglishEstonianEthiopianEuropeanFijianFilipinoFinnishFrenchFrench American IndianFrench CanadianGermanGerman RussianGhanaianGreekGuamanian/ChamorroGuatemalanGuyaneseHaitianHmongHonduranHopiHoumaHungarianIndian (Asian)IndonesianInupiatIranianIraqiIrishIroquoisIsraeliItalianJamaicanJapaneseJordanianKenyanKiowaKoreanLaotianLatvianLebaneseLiberianLithuanianLumbeeLuxembourgerMacedonianMalaysianMalteseMarshalleseMenomineeMexicanMexican American IndianMongolianMoroccanNative HawaiianNavajoNepaleseNew ZealanderNicaraguanNigerianNorthern EuropeanNorwegianOkinawanOsageOttawaPaiutePakistaniPalestinianPanamanianParaguayanPennsylvania GermanPeruvianPimaPolishPortuguesePotawatomiPuebloPuerto RicanPuget Sound SalishRomanianRussianSalvadoranSamoanScandinavianScotch-IrishScottishSeminoleSenegaleseSerbianShoshoneSierra LeoneanSiouxSlavicSlovakSloveneSomaliSouth AfricanSouth AmericanSouth American IndianSoviet UnionSpaniardSpanishSpanish AmericanSpanish American IndianSri LankanSubsaharan AfricanSudaneseSwedishSwissSyrianTaiwaneseThaiTlingit-HaidaTohono O'OdhamTonganTrinidadian and TobagonianTsimshianTurkishU.S. Virgin IslanderUgandanUkrainianUruguayanUteVenezuelanVietnameseWelshWest IndianYakamaYaquiYugoslavianYumanYup'ikZimbabwean
Immigration
NonimmigrantsImmigrantsAfghanistanAfricaAlbaniaArgentinaArmeniaAsiaAustraliaAustriaBahamasBangladeshBarbadosBelarusBelgiumBelizeBoliviaBosnia and HerzegovinaBrazilBulgariaBurma/MyanmarCabo VerdeCambodiaCameroonCanadaCaribbeanCentral AmericaChileChinaColombiaCongoCosta RicaCroatiaCubaCzechoslovakiaDenmarkDominicaDominican RepublicEastern AfricaEastern AsiaEastern EuropeEcuadorEgyptEl SalvadorEnglandEritreaEthiopiaEuropeFijiFranceGermanyGhanaGreeceGrenadaGuatemalaGuyanaHaitiHondurasHong KongHungaryIndiaIndonesiaIranIraqIrelandIsraelItalyJamaicaJapanJordanKazakhstanKenyaKoreaKuwaitLaosLatin AmericaLatviaLebanonLiberiaLithuaniaMalaysiaMexicoMicronesiaMiddle AfricaMoldovaMoroccoNepalNetherlandsNicaraguaNigeriaNorth AmericaNorth MacedoniaNorthern AfricaNorthern EuropeNorwayOceaniaPakistanPanamaPeruPhilippinesPolandPortugalRomaniaRussiaSaudi ArabiaScotlandSenegalSerbiaSierra LeoneSingaporeSomaliaSouth AfricaSouth AmericaSouth Central AsiaSouth Eastern AsiaSouthern EuropeSpainSri LankaSt. Vincent and the GrenadinesSudanSwedenSwitzerlandSyriaTaiwanThailandTrinidad and TobagoTurkeyUgandaUkraineUruguayUzbekistanVenezuelaVietnamWest IndiesWestern AfricaWestern AsiaWestern EuropeYemenZaireZimbabweAzores
Disability Age 5 to 17
Income
Poverty
Unemployment
Labor Participation
Family Structure
Vehicle Availability
Education Level
Disability

Icelander Disability Age 5 to 17
Poor

5.7%
DISABILITY | AGE 5 TO 17
14.6/ 100
METRIC RATING
200th/ 347
METRIC RANK

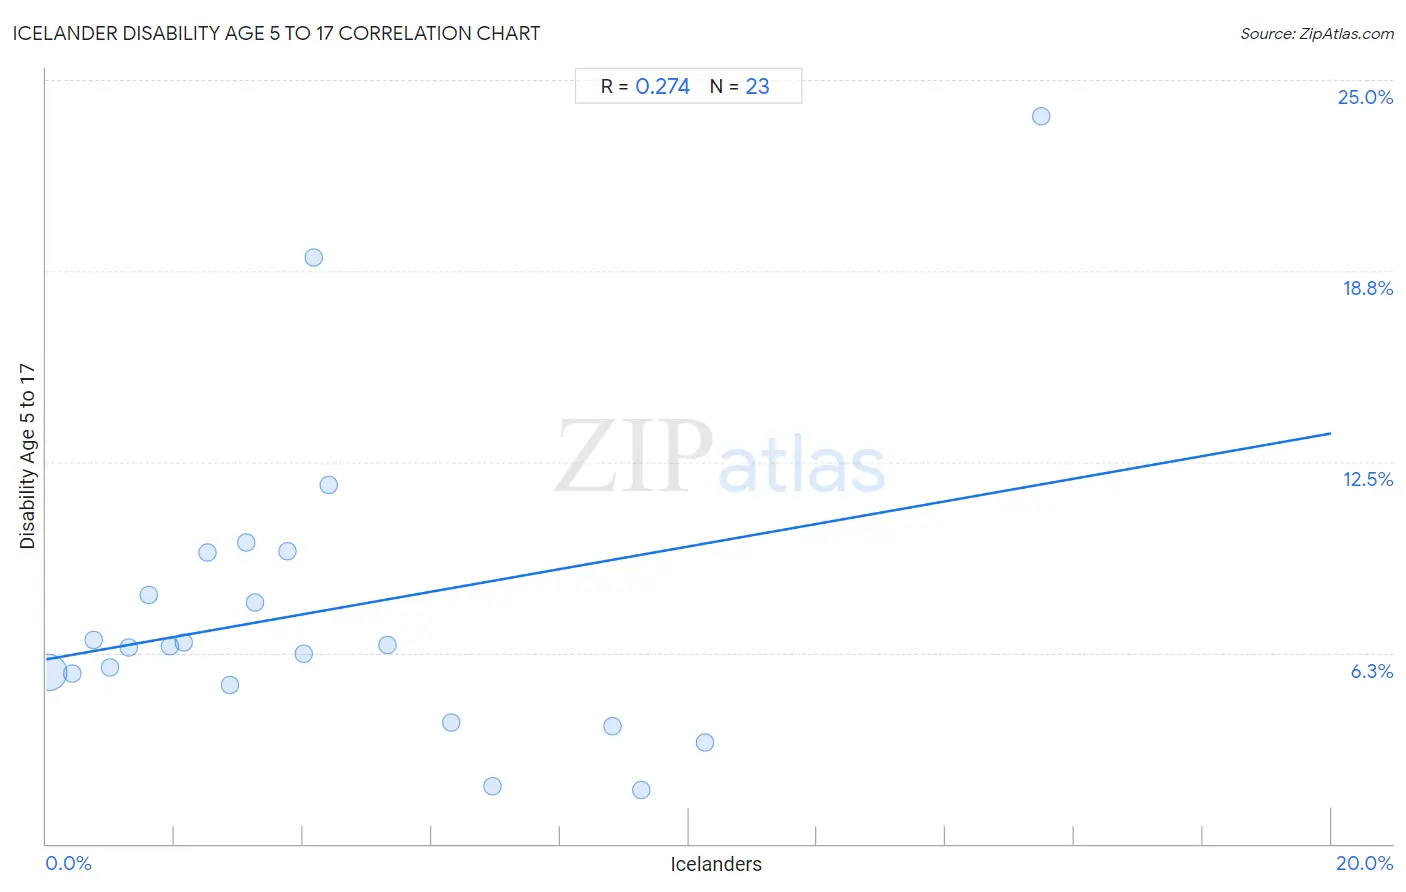
Icelander Disability Age 5 to 17 Correlation Chart

The statistical analysis conducted on geographies consisting of 158,852,183 people shows a weak positive correlation between the proportion of Icelanders and percentage of population with a disability between the ages 5 and 17 in the United States with a correlation coefficient (R) of 0.274 and weighted average of 5.7%. On average, for every 1% (one percent) increase in Icelanders within a typical geography, there is an increase of 0.37% in percentage of population with a disability between the ages 5 and 17.
Icelander Disability Age 5 to 17
It is essential to understand that the correlation between the percentage of Icelanders and percentage of population with a disability between the ages 5 and 17 does not imply a direct cause-and-effect relationship. It remains uncertain whether the presence of Icelanders influences an upward or downward trend in the level of percentage of population with a disability between the ages 5 and 17 within an area, or if Icelanders simply ended up residing in those areas with higher or lower levels of percentage of population with a disability between the ages 5 and 17 due to other factors.

Demographics Similar to Icelanders by Disability Age 5 to 17

In terms of disability age 5 to 17, the demographic groups most similar to Icelanders are Northern European (5.7%, a difference of 0.060%), Basque (5.7%, a difference of 0.090%), Austrian (5.7%, a difference of 0.14%), Spanish American Indian (5.7%, a difference of 0.18%), and Paiute (5.7%, a difference of 0.36%).
DemographicsRating | RankDisability Age 5 to 17
Immigrants from Canada
26.1
/100
|
#193
Fair
5.7%
Croatians
23.6
/100
|
#194
Fair
5.7%
Immigrants from Nigeria
23.4
/100
|
#195
Fair
5.7%
Inupiat
23.3
/100
|
#196
Fair
5.7%
Immigrants from North America
23.1
/100
|
#197
Fair
5.7%
Norwegians
20.9
/100
|
#198
Fair
5.7%
Northern Europeans
15.2
/100
|
#199
Poor
5.7%
Icelanders
14.6
/100
|
#200
Poor
5.7%
Basques
13.7
/100
|
#201
Poor
5.7%
Austrians
13.2
/100
|
#202
Poor
5.7%
Spanish American Indians
12.8
/100
|
#203
Poor
5.7%
Paiute
11.2
/100
|
#204
Poor
5.7%
Trinidadians and Tobagonians
10.8
/100
|
#205
Poor
5.7%
Immigrants from Africa
10.8
/100
|
#206
Poor
5.7%
Moroccans
10.4
/100
|
#207
Poor
5.7%

Icelander Disability Age 5 to 17 Correlation Summary

MeasurementIcelander DataDisability Age 5 to 17 Data
Minimum0.041%1.8%
Maximum15.5%23.8%
Range15.5%22.0%
Mean4.3%7.6%
Median3.3%6.5%
Interquartile 25% (IQ1)1.6%5.2%
Interquartile 75% (IQ3)6.3%9.5%
Interquartile Range (IQR)4.7%4.3%
Standard Deviation (Sample)3.8%5.1%
Standard Deviation (Population)3.7%5.0%

Correlation Details

Icelander PercentileSample SizeDisability Age 5 to 17
[
0.0%
-
0.5%
]
0.041%
154,498,0415.6%
[
0.0%
-
0.5%
]
0.41%
3,158,1285.6%
[
0.5%
-
1.0%
]
0.74%
669,0366.7%
[
0.5%
-
1.0%
]
0.99%
306,1265.8%
[
1.0%
-
1.5%
]
1.29%
97,4226.4%
[
1.5%
-
2.0%
]
1.59%
56,0348.1%
[
1.5%
-
2.0%
]
1.92%
19,2926.5%
[
2.0%
-
2.5%
]
2.15%
13,7736.6%
[
2.5%
-
3.0%
]
2.51%
7,5749.5%
[
2.5%
-
3.0%
]
2.85%
8,5485.2%
[
3.0%
-
3.5%
]
3.11%
3,7249.9%
[
3.0%
-
3.5%
]
3.26%
1,1057.9%
[
3.5%
-
4.0%
]
3.75%
8019.6%
[
4.0%
-
4.5%
]
4.01%
3,7666.2%
[
4.0%
-
4.5%
]
4.17%
1,15119.2%
[
4.0%
-
4.5%
]
4.40%
1,56711.8%
[
5.0%
-
5.5%
]
5.32%
4706.5%
[
6.0%
-
6.5%
]
6.30%
1,2704.0%
[
6.5%
-
7.0%
]
6.95%
5611.9%
[
8.5%
-
9.0%
]
8.81%
1593.8%
[
9.0%
-
9.5%
]
9.26%
1,3601.8%
[
10.0%
-
10.5%
]
10.25%
2,2043.3%
[
15.0%
-
15.5%
]
15.49%
7123.8%