Icelander Receiving Food Stamps
COMPARE
Icelander
Select to Compare
Receiving Food Stamps
Icelander Receiving Food Stamps
10.5%
PUBLIC INCOME | FOOD STAMPS
95.4/ 100
METRIC RATING
113th/ 347
METRIC RANK
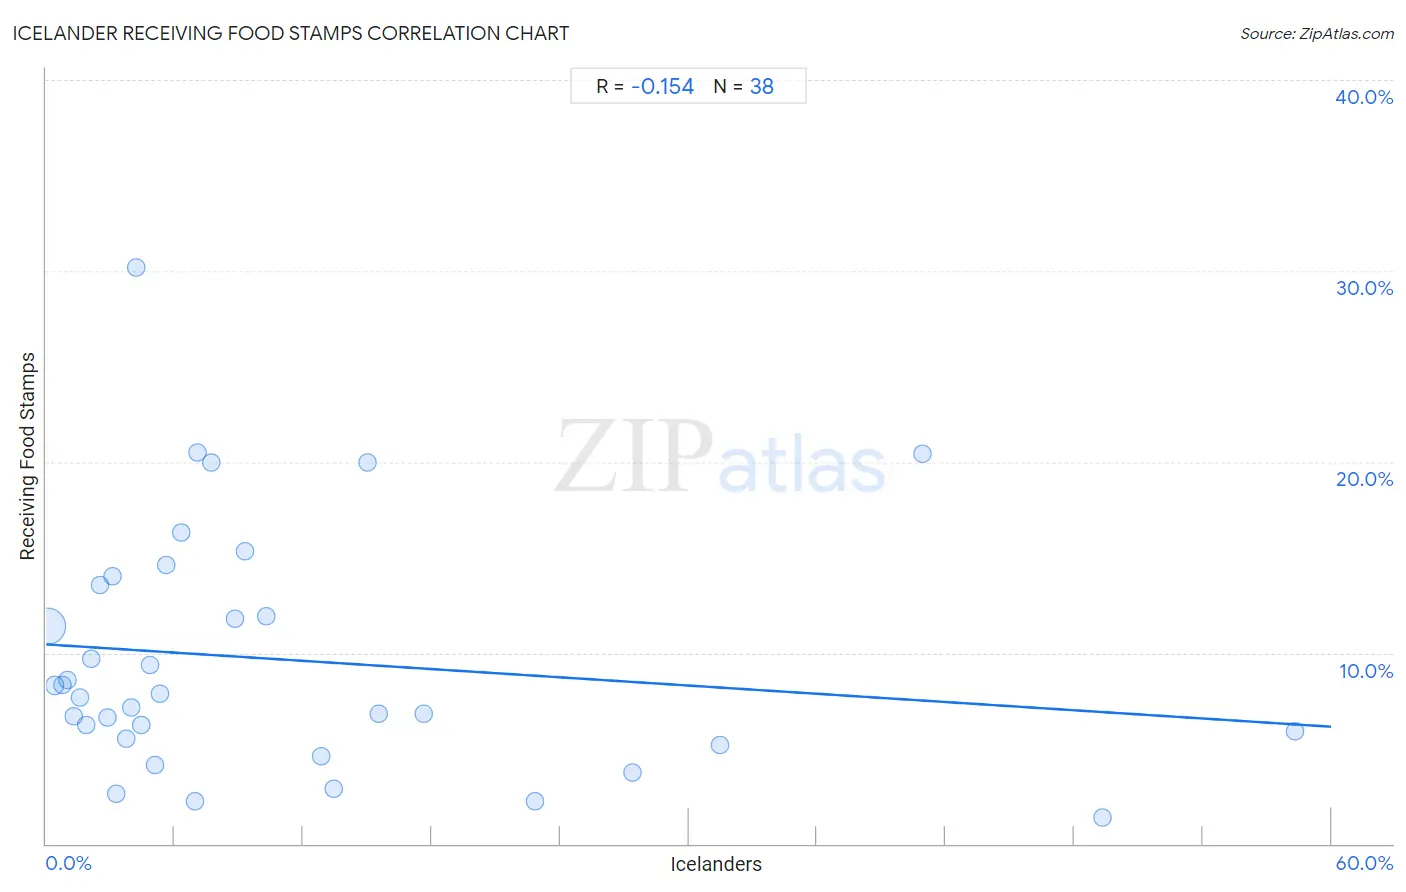
Icelander Receiving Food Stamps Correlation Chart
The statistical analysis conducted on geographies consisting of 159,460,125 people shows a poor negative correlation between the proportion of Icelanders and percentage of population receiving government assistance and/or food stamps in the United States with a correlation coefficient (R) of -0.154 and weighted average of 10.5%. On average, for every 1% (one percent) increase in Icelanders within a typical geography, there is a decrease of 0.072% in percentage of population receiving government assistance and/or food stamps.
It is essential to understand that the correlation between the percentage of Icelanders and percentage of population receiving government assistance and/or food stamps does not imply a direct cause-and-effect relationship. It remains uncertain whether the presence of Icelanders influences an upward or downward trend in the level of percentage of population receiving government assistance and/or food stamps within an area, or if Icelanders simply ended up residing in those areas with higher or lower levels of percentage of population receiving government assistance and/or food stamps due to other factors.
Demographics Similar to Icelanders by Receiving Food Stamps
In terms of receiving food stamps, the demographic groups most similar to Icelanders are Scotch-Irish (10.5%, a difference of 0.30%), Mongolian (10.5%, a difference of 0.38%), Romanian (10.4%, a difference of 0.39%), Immigrants from Saudi Arabia (10.5%, a difference of 0.48%), and Pakistani (10.4%, a difference of 0.49%).
| Demographics | Rating | Rank | Receiving Food Stamps |
| Immigrants from Italy | 96.4 /100 | #106 | Exceptional 10.4% |
| Koreans | 96.3 /100 | #107 | Exceptional 10.4% |
| Carpatho Rusyns | 96.2 /100 | #108 | Exceptional 10.4% |
| Immigrants from Pakistan | 96.2 /100 | #109 | Exceptional 10.4% |
| Pakistanis | 95.9 /100 | #110 | Exceptional 10.4% |
| Romanians | 95.8 /100 | #111 | Exceptional 10.4% |
| Mongolians | 95.8 /100 | #112 | Exceptional 10.5% |
| Icelanders | 95.4 /100 | #113 | Exceptional 10.5% |
| Scotch-Irish | 95.1 /100 | #114 | Exceptional 10.5% |
| Immigrants from Saudi Arabia | 94.9 /100 | #115 | Exceptional 10.5% |
| Canadians | 94.8 /100 | #116 | Exceptional 10.5% |
| Immigrants from Nepal | 94.6 /100 | #117 | Exceptional 10.6% |
| Assyrians/Chaldeans/Syriacs | 94.1 /100 | #118 | Exceptional 10.6% |
| Immigrants from Poland | 93.9 /100 | #119 | Exceptional 10.6% |
| Ethiopians | 93.9 /100 | #120 | Exceptional 10.6% |
Icelander Receiving Food Stamps Correlation Summary
| Measurement | Icelander Data | Receiving Food Stamps Data |
| Minimum | 0.041% | 1.4% |
| Maximum | 58.3% | 30.2% |
| Range | 58.3% | 28.8% |
| Mean | 11.0% | 9.6% |
| Median | 5.5% | 7.8% |
| Interquartile 25% (IQ1) | 2.8% | 5.5% |
| Interquartile 75% (IQ3) | 13.4% | 13.6% |
| Interquartile Range (IQR) | 10.6% | 8.1% |
| Standard Deviation (Sample) | 13.7% | 6.4% |
| Standard Deviation (Population) | 13.5% | 6.3% |
Correlation Details
| Icelander Percentile | Sample Size | Receiving Food Stamps |
[ 0.0% - 0.5% ] 0.041% | 154,940,922 | 11.4% |
[ 0.0% - 0.5% ] 0.41% | 3,233,945 | 8.3% |
[ 0.5% - 1.0% ] 0.74% | 701,072 | 8.3% |
[ 0.5% - 1.0% ] 0.99% | 321,373 | 8.6% |
[ 1.0% - 1.5% ] 1.28% | 93,981 | 6.7% |
[ 1.5% - 2.0% ] 1.59% | 62,396 | 7.6% |
[ 1.5% - 2.0% ] 1.89% | 30,492 | 6.2% |
[ 2.0% - 2.5% ] 2.13% | 23,118 | 9.7% |
[ 2.5% - 3.0% ] 2.51% | 7,699 | 13.6% |
[ 2.5% - 3.0% ] 2.83% | 12,680 | 6.6% |
[ 3.0% - 3.5% ] 3.10% | 6,033 | 14.0% |
[ 3.0% - 3.5% ] 3.26% | 1,135 | 2.6% |
[ 3.5% - 4.0% ] 3.75% | 801 | 5.5% |
[ 3.5% - 4.0% ] 3.98% | 4,369 | 7.1% |
[ 4.0% - 4.5% ] 4.18% | 1,436 | 30.2% |
[ 4.0% - 4.5% ] 4.45% | 2,069 | 6.2% |
[ 4.5% - 5.0% ] 4.82% | 581 | 9.3% |
[ 5.0% - 5.5% ] 5.06% | 158 | 4.1% |
[ 5.0% - 5.5% ] 5.33% | 582 | 7.9% |
[ 5.5% - 6.0% ] 5.60% | 5,711 | 14.6% |
[ 6.0% - 6.5% ] 6.33% | 1,738 | 16.3% |
[ 6.5% - 7.0% ] 6.95% | 561 | 2.2% |
[ 7.0% - 7.5% ] 7.05% | 227 | 20.5% |
[ 7.5% - 8.0% ] 7.69% | 13 | 20.0% |
[ 8.5% - 9.0% ] 8.81% | 159 | 11.8% |
[ 9.0% - 9.5% ] 9.26% | 1,360 | 15.3% |
[ 10.0% - 10.5% ] 10.27% | 2,443 | 11.9% |
[ 12.5% - 13.0% ] 12.82% | 195 | 4.6% |
[ 13.0% - 13.5% ] 13.40% | 209 | 2.9% |
[ 15.0% - 15.5% ] 15.00% | 20 | 20.0% |
[ 15.5% - 16.0% ] 15.51% | 187 | 6.8% |
[ 17.5% - 18.0% ] 17.61% | 352 | 6.8% |
[ 22.5% - 23.0% ] 22.80% | 535 | 2.2% |
[ 27.0% - 27.5% ] 27.37% | 179 | 3.7% |
[ 31.0% - 31.5% ] 31.48% | 953 | 5.2% |
[ 40.5% - 41.0% ] 40.91% | 154 | 20.4% |
[ 49.0% - 49.5% ] 49.34% | 227 | 1.4% |
[ 58.0% - 58.5% ] 58.33% | 60 | 5.9% |