Icelander 4 or more Vehicles in Household
COMPARE
Icelander
Select to Compare
4 or more Vehicles in Household
Icelander 4 or more Vehicles in Household
7.4%
4+ VEHICLES AVAILABLE
99.9/ 100
METRIC RATING
74th/ 347
METRIC RANK
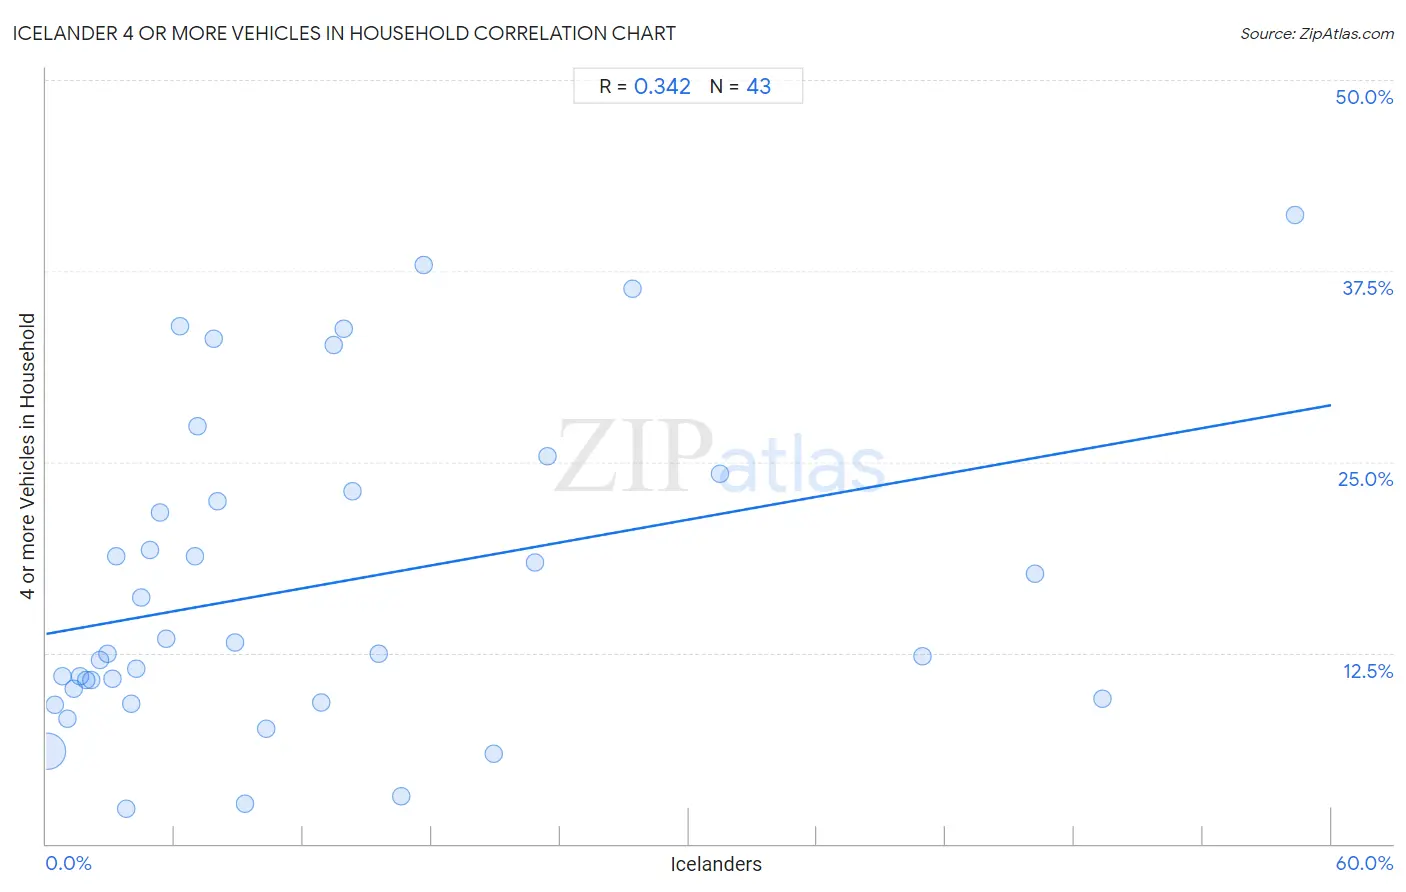
Icelander 4 or more Vehicles in Household Correlation Chart
The statistical analysis conducted on geographies consisting of 159,406,151 people shows a mild positive correlation between the proportion of Icelanders and percentage of households with 4 or more vehicles available in the United States with a correlation coefficient (R) of 0.342 and weighted average of 7.4%. On average, for every 1% (one percent) increase in Icelanders within a typical geography, there is an increase of 0.25% in percentage of households with 4 or more vehicles available.
It is essential to understand that the correlation between the percentage of Icelanders and percentage of households with 4 or more vehicles available does not imply a direct cause-and-effect relationship. It remains uncertain whether the presence of Icelanders influences an upward or downward trend in the level of percentage of households with 4 or more vehicles available within an area, or if Icelanders simply ended up residing in those areas with higher or lower levels of percentage of households with 4 or more vehicles available due to other factors.
Demographics Similar to Icelanders by 4 or more Vehicles in Household
In terms of 4 or more vehicles in household, the demographic groups most similar to Icelanders are Immigrants from Cambodia (7.4%, a difference of 0.0%), Laotian (7.4%, a difference of 0.050%), Apache (7.4%, a difference of 0.22%), White/Caucasian (7.4%, a difference of 0.29%), and Portuguese (7.4%, a difference of 0.30%).
| Demographics | Rating | Rank | 4 or more Vehicles in Household |
| Americans | 99.9 /100 | #67 | Exceptional 7.5% |
| Welsh | 99.9 /100 | #68 | Exceptional 7.5% |
| Germans | 99.9 /100 | #69 | Exceptional 7.5% |
| Scottish | 99.9 /100 | #70 | Exceptional 7.4% |
| Chickasaw | 99.9 /100 | #71 | Exceptional 7.4% |
| Scotch-Irish | 99.9 /100 | #72 | Exceptional 7.4% |
| Portuguese | 99.9 /100 | #73 | Exceptional 7.4% |
| Icelanders | 99.9 /100 | #74 | Exceptional 7.4% |
| Immigrants from Cambodia | 99.9 /100 | #75 | Exceptional 7.4% |
| Laotians | 99.9 /100 | #76 | Exceptional 7.4% |
| Apache | 99.9 /100 | #77 | Exceptional 7.4% |
| Whites/Caucasians | 99.8 /100 | #78 | Exceptional 7.4% |
| Czechs | 99.8 /100 | #79 | Exceptional 7.4% |
| Alaska Natives | 99.8 /100 | #80 | Exceptional 7.3% |
| Finns | 99.8 /100 | #81 | Exceptional 7.3% |
Icelander 4 or more Vehicles in Household Correlation Summary
| Measurement | Icelander Data | 4 or more Vehicles in Household Data |
| Minimum | 0.041% | 2.3% |
| Maximum | 58.3% | 41.2% |
| Range | 58.3% | 38.9% |
| Mean | 12.6% | 16.9% |
| Median | 7.0% | 12.5% |
| Interquartile 25% (IQ1) | 3.1% | 9.5% |
| Interquartile 75% (IQ3) | 16.6% | 23.1% |
| Interquartile Range (IQR) | 13.5% | 13.6% |
| Standard Deviation (Sample) | 14.1% | 10.3% |
| Standard Deviation (Population) | 13.9% | 10.2% |
Correlation Details
| Icelander Percentile | Sample Size | 4 or more Vehicles in Household |
[ 0.0% - 0.5% ] 0.041% | 154,856,189 | 6.1% |
[ 0.0% - 0.5% ] 0.41% | 3,249,610 | 9.1% |
[ 0.5% - 1.0% ] 0.74% | 701,937 | 11.0% |
[ 0.5% - 1.0% ] 0.99% | 322,331 | 8.2% |
[ 1.0% - 1.5% ] 1.29% | 102,819 | 10.2% |
[ 1.5% - 2.0% ] 1.59% | 63,685 | 10.9% |
[ 1.5% - 2.0% ] 1.89% | 30,604 | 10.7% |
[ 2.0% - 2.5% ] 2.13% | 23,390 | 10.7% |
[ 2.5% - 3.0% ] 2.51% | 7,699 | 12.0% |
[ 2.5% - 3.0% ] 2.84% | 12,619 | 12.4% |
[ 3.0% - 3.5% ] 3.12% | 5,519 | 10.8% |
[ 3.0% - 3.5% ] 3.30% | 1,911 | 18.8% |
[ 3.5% - 4.0% ] 3.74% | 882 | 2.3% |
[ 3.5% - 4.0% ] 3.98% | 4,620 | 9.2% |
[ 4.0% - 4.5% ] 4.18% | 1,482 | 11.4% |
[ 4.0% - 4.5% ] 4.45% | 2,113 | 16.1% |
[ 4.5% - 5.0% ] 4.82% | 581 | 19.2% |
[ 5.0% - 5.5% ] 5.33% | 582 | 21.7% |
[ 5.5% - 6.0% ] 5.60% | 5,711 | 13.4% |
[ 6.0% - 6.5% ] 6.25% | 1,889 | 33.9% |
[ 6.5% - 7.0% ] 6.95% | 561 | 18.8% |
[ 7.0% - 7.5% ] 7.05% | 227 | 27.4% |
[ 7.5% - 8.0% ] 7.82% | 1,010 | 33.1% |
[ 7.5% - 8.0% ] 7.97% | 251 | 22.4% |
[ 8.5% - 9.0% ] 8.81% | 159 | 13.2% |
[ 9.0% - 9.5% ] 9.26% | 1,360 | 2.7% |
[ 10.0% - 10.5% ] 10.27% | 2,443 | 7.5% |
[ 12.5% - 13.0% ] 12.82% | 195 | 9.3% |
[ 13.0% - 13.5% ] 13.40% | 209 | 32.7% |
[ 13.5% - 14.0% ] 13.89% | 216 | 33.7% |
[ 14.0% - 14.5% ] 14.29% | 35 | 23.1% |
[ 15.5% - 16.0% ] 15.51% | 187 | 12.5% |
[ 16.5% - 17.0% ] 16.57% | 175 | 3.1% |
[ 17.5% - 18.0% ] 17.61% | 352 | 37.9% |
[ 20.5% - 21.0% ] 20.90% | 244 | 5.9% |
[ 22.5% - 23.0% ] 22.80% | 535 | 18.4% |
[ 23.0% - 23.5% ] 23.39% | 218 | 25.4% |
[ 27.0% - 27.5% ] 27.38% | 168 | 36.4% |
[ 31.0% - 31.5% ] 31.48% | 953 | 24.2% |
[ 40.5% - 41.0% ] 40.91% | 154 | 12.2% |
[ 46.0% - 46.5% ] 46.15% | 39 | 17.6% |
[ 49.0% - 49.5% ] 49.34% | 227 | 9.5% |
[ 58.0% - 58.5% ] 58.33% | 60 | 41.2% |