Haitian College, Under 1 year
COMPARE
Haitian
Select to Compare
College, Under 1 year
Haitian College, Under 1 year
57.8%
COLLEGE, UNDER 1 YEAR
0.0/ 100
METRIC RATING
305th/ 347
METRIC RANK
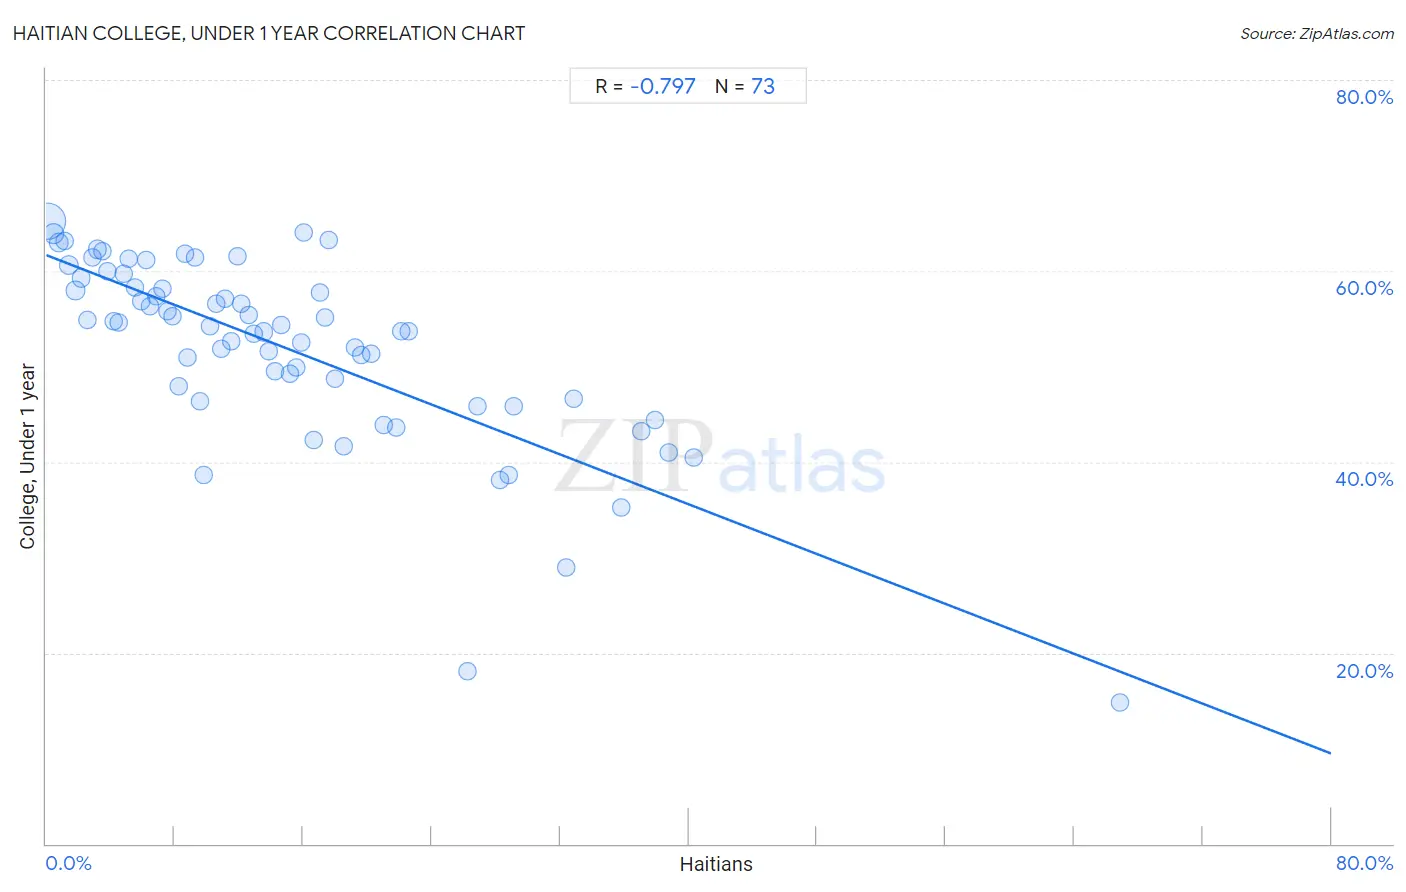
Haitian College, Under 1 year Correlation Chart
The statistical analysis conducted on geographies consisting of 288,016,617 people shows a strong negative correlation between the proportion of Haitians and percentage of population with at least college, under 1 year education in the United States with a correlation coefficient (R) of -0.797 and weighted average of 57.8%. On average, for every 1% (one percent) increase in Haitians within a typical geography, there is a decrease of 0.65% in percentage of population with at least college, under 1 year education.
It is essential to understand that the correlation between the percentage of Haitians and percentage of population with at least college, under 1 year education does not imply a direct cause-and-effect relationship. It remains uncertain whether the presence of Haitians influences an upward or downward trend in the level of percentage of population with at least college, under 1 year education within an area, or if Haitians simply ended up residing in those areas with higher or lower levels of percentage of population with at least college, under 1 year education due to other factors.
Demographics Similar to Haitians by College, Under 1 year
In terms of college, under 1 year, the demographic groups most similar to Haitians are Kiowa (57.8%, a difference of 0.11%), Immigrants from Dominica (57.9%, a difference of 0.12%), Immigrants from Portugal (57.7%, a difference of 0.20%), Fijian (57.7%, a difference of 0.21%), and Central American (57.7%, a difference of 0.21%).
| Demographics | Rating | Rank | College, Under 1 year |
| Immigrants from Ecuador | 0.0 /100 | #298 | Tragic 58.7% |
| Cubans | 0.0 /100 | #299 | Tragic 58.6% |
| Immigrants from Guyana | 0.0 /100 | #300 | Tragic 58.5% |
| Mexican American Indians | 0.0 /100 | #301 | Tragic 58.1% |
| Apache | 0.0 /100 | #302 | Tragic 58.0% |
| Immigrants from Dominica | 0.0 /100 | #303 | Tragic 57.9% |
| Kiowa | 0.0 /100 | #304 | Tragic 57.8% |
| Haitians | 0.0 /100 | #305 | Tragic 57.8% |
| Immigrants from Portugal | 0.0 /100 | #306 | Tragic 57.7% |
| Fijians | 0.0 /100 | #307 | Tragic 57.7% |
| Central Americans | 0.0 /100 | #308 | Tragic 57.7% |
| Immigrants from Nicaragua | 0.0 /100 | #309 | Tragic 57.6% |
| Pueblo | 0.0 /100 | #310 | Tragic 57.4% |
| Cajuns | 0.0 /100 | #311 | Tragic 57.3% |
| Salvadorans | 0.0 /100 | #312 | Tragic 57.3% |
Haitian College, Under 1 year Correlation Summary
| Measurement | Haitian Data | College, Under 1 year Data |
| Minimum | 0.095% | 14.8% |
| Maximum | 66.9% | 65.2% |
| Range | 66.8% | 50.4% |
| Mean | 14.9% | 52.0% |
| Median | 12.2% | 54.3% |
| Interquartile 25% (IQ1) | 6.0% | 46.5% |
| Interquartile 75% (IQ3) | 19.9% | 58.8% |
| Interquartile Range (IQR) | 13.9% | 12.3% |
| Standard Deviation (Sample) | 12.0% | 9.9% |
| Standard Deviation (Population) | 12.0% | 9.8% |
Correlation Details
| Haitian Percentile | Sample Size | College, Under 1 year |
[ 0.0% - 0.5% ] 0.095% | 203,857,439 | 65.2% |
[ 0.0% - 0.5% ] 0.48% | 30,061,415 | 63.9% |
[ 0.5% - 1.0% ] 0.81% | 12,978,305 | 62.9% |
[ 1.0% - 1.5% ] 1.15% | 6,786,031 | 63.1% |
[ 1.0% - 1.5% ] 1.41% | 12,332,607 | 60.6% |
[ 1.5% - 2.0% ] 1.83% | 3,048,663 | 58.0% |
[ 2.0% - 2.5% ] 2.15% | 2,370,698 | 59.3% |
[ 2.5% - 3.0% ] 2.53% | 1,392,816 | 54.9% |
[ 2.5% - 3.0% ] 2.84% | 1,308,309 | 61.4% |
[ 3.0% - 3.5% ] 3.16% | 2,350,954 | 62.3% |
[ 3.5% - 4.0% ] 3.52% | 904,461 | 62.0% |
[ 3.5% - 4.0% ] 3.82% | 958,850 | 60.0% |
[ 4.0% - 4.5% ] 4.21% | 334,511 | 54.7% |
[ 4.5% - 5.0% ] 4.53% | 764,205 | 54.6% |
[ 4.5% - 5.0% ] 4.85% | 307,720 | 59.7% |
[ 5.0% - 5.5% ] 5.12% | 757,520 | 61.3% |
[ 5.5% - 6.0% ] 5.50% | 415,158 | 58.3% |
[ 5.5% - 6.0% ] 5.88% | 490,287 | 56.8% |
[ 6.0% - 6.5% ] 6.22% | 706,532 | 61.1% |
[ 6.0% - 6.5% ] 6.47% | 160,947 | 56.3% |
[ 6.5% - 7.0% ] 6.84% | 404,412 | 57.4% |
[ 7.0% - 7.5% ] 7.20% | 215,788 | 58.1% |
[ 7.5% - 8.0% ] 7.51% | 450,380 | 55.8% |
[ 7.5% - 8.0% ] 7.85% | 174,274 | 55.3% |
[ 8.0% - 8.5% ] 8.21% | 576,836 | 47.9% |
[ 8.5% - 9.0% ] 8.60% | 207,256 | 61.8% |
[ 8.5% - 9.0% ] 8.81% | 118,037 | 50.9% |
[ 9.0% - 9.5% ] 9.29% | 188,944 | 61.4% |
[ 9.5% - 10.0% ] 9.57% | 79,212 | 46.4% |
[ 9.5% - 10.0% ] 9.81% | 53,626 | 38.6% |
[ 10.0% - 10.5% ] 10.18% | 375,633 | 54.3% |
[ 10.5% - 11.0% ] 10.62% | 34,935 | 56.6% |
[ 10.5% - 11.0% ] 10.88% | 45,801 | 51.8% |
[ 11.0% - 11.5% ] 11.13% | 72,397 | 57.1% |
[ 11.5% - 12.0% ] 11.55% | 32,311 | 52.7% |
[ 11.5% - 12.0% ] 11.92% | 208,772 | 61.5% |
[ 12.0% - 12.5% ] 12.16% | 153,991 | 56.5% |
[ 12.5% - 13.0% ] 12.62% | 98,037 | 55.3% |
[ 12.5% - 13.0% ] 12.90% | 179,860 | 53.4% |
[ 13.5% - 14.0% ] 13.50% | 232,750 | 53.6% |
[ 13.5% - 14.0% ] 13.85% | 180,853 | 51.6% |
[ 14.0% - 14.5% ] 14.26% | 94,219 | 49.5% |
[ 14.5% - 15.0% ] 14.61% | 103,341 | 54.3% |
[ 15.0% - 15.5% ] 15.19% | 144,317 | 49.2% |
[ 15.5% - 16.0% ] 15.59% | 207,337 | 49.9% |
[ 15.5% - 16.0% ] 15.86% | 33,709 | 52.6% |
[ 16.0% - 16.5% ] 16.07% | 26,814 | 64.1% |
[ 16.5% - 17.0% ] 16.65% | 14,597 | 42.3% |
[ 17.0% - 17.5% ] 17.04% | 118,661 | 57.7% |
[ 17.0% - 17.5% ] 17.33% | 62,604 | 55.1% |
[ 17.5% - 18.0% ] 17.57% | 86,232 | 63.3% |
[ 17.5% - 18.0% ] 17.94% | 37,320 | 48.7% |
[ 18.5% - 19.0% ] 18.53% | 64,176 | 41.6% |
[ 19.0% - 19.5% ] 19.19% | 10,946 | 52.0% |
[ 19.5% - 20.0% ] 19.62% | 70,810 | 51.2% |
[ 20.0% - 20.5% ] 20.25% | 326 | 51.4% |
[ 21.0% - 21.5% ] 21.04% | 62,232 | 43.9% |
[ 21.5% - 22.0% ] 21.79% | 83,221 | 43.6% |
[ 22.0% - 22.5% ] 22.08% | 40,276 | 53.7% |
[ 22.5% - 23.0% ] 22.54% | 43,269 | 53.7% |
[ 26.0% - 26.5% ] 26.24% | 6,196 | 18.1% |
[ 26.5% - 27.0% ] 26.83% | 35,914 | 45.8% |
[ 28.0% - 28.5% ] 28.25% | 31,807 | 38.1% |
[ 28.5% - 29.0% ] 28.78% | 24,792 | 38.6% |
[ 29.0% - 29.5% ] 29.13% | 1,775 | 45.9% |
[ 32.0% - 32.5% ] 32.36% | 445 | 28.9% |
[ 32.5% - 33.0% ] 32.84% | 48,326 | 46.6% |
[ 35.5% - 36.0% ] 35.77% | 17,163 | 35.2% |
[ 37.0% - 37.5% ] 37.04% | 52,824 | 43.2% |
[ 37.5% - 38.0% ] 37.88% | 59,854 | 44.3% |
[ 38.5% - 39.0% ] 38.75% | 2,867 | 40.9% |
[ 40.0% - 40.5% ] 40.35% | 58,183 | 40.4% |
[ 66.5% - 67.0% ] 66.85% | 531 | 14.8% |