Haitian vs Immigrants from Eastern Europe Married-Couple Family Poverty
COMPARE
Haitian
Immigrants from Eastern Europe
Married-Couple Family Poverty
Married-Couple Family Poverty Comparison
Haitians
Immigrants from Eastern Europe
6.8%
MARRIED-COUPLE FAMILY POVERTY
0.0/ 100
METRIC RATING
305th/ 347
METRIC RANK
4.9%
MARRIED-COUPLE FAMILY POVERTY
90.5/ 100
METRIC RATING
131st/ 347
METRIC RANK
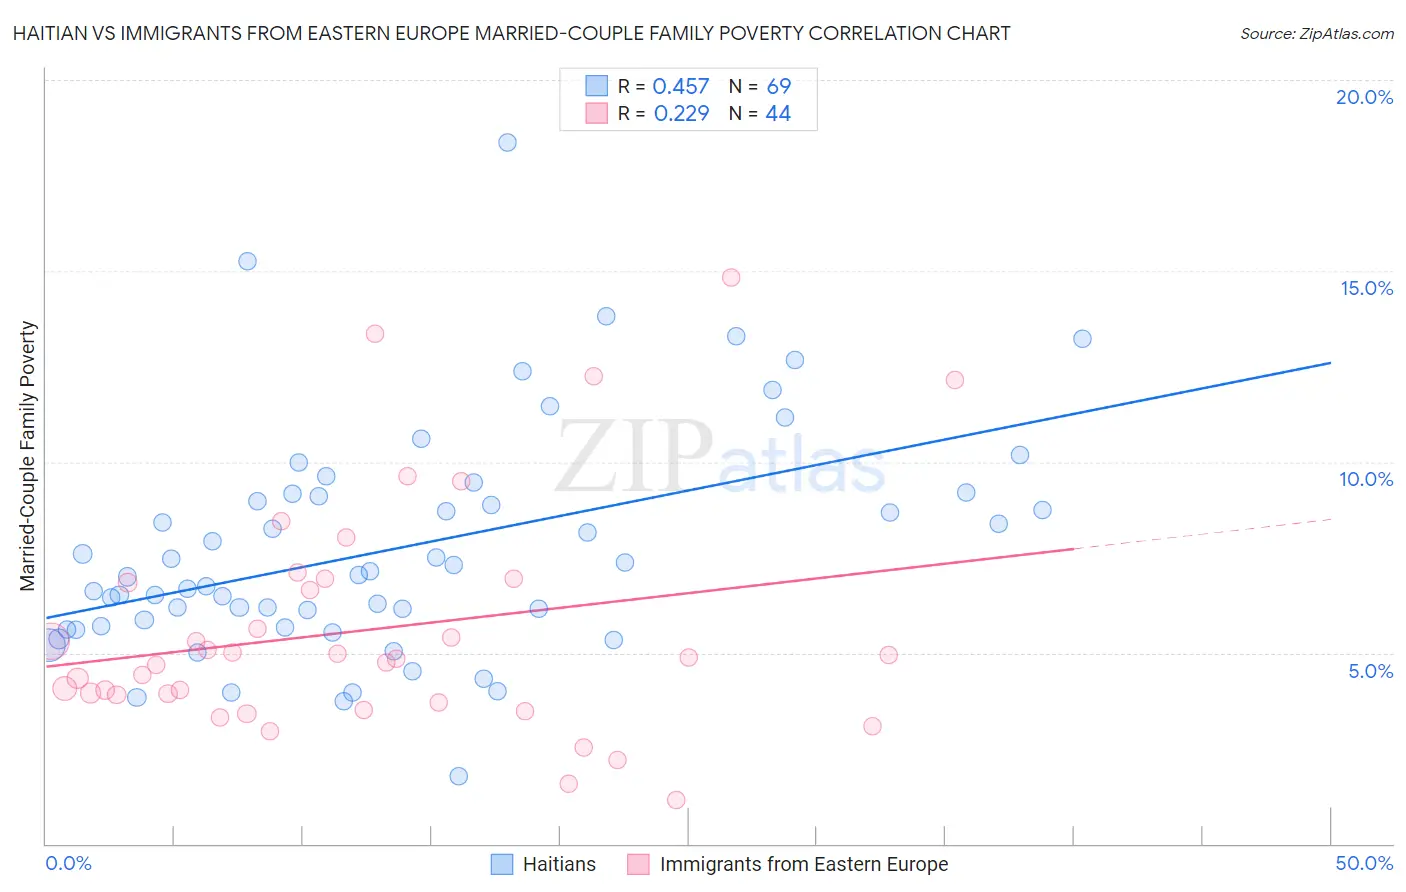
Haitian vs Immigrants from Eastern Europe Married-Couple Family Poverty Correlation Chart
The statistical analysis conducted on geographies consisting of 285,930,838 people shows a moderate positive correlation between the proportion of Haitians and poverty level among married-couple families in the United States with a correlation coefficient (R) of 0.457 and weighted average of 6.8%. Similarly, the statistical analysis conducted on geographies consisting of 468,584,745 people shows a weak positive correlation between the proportion of Immigrants from Eastern Europe and poverty level among married-couple families in the United States with a correlation coefficient (R) of 0.229 and weighted average of 4.9%, a difference of 39.5%.
Married-Couple Family Poverty Correlation Summary
| Measurement | Haitian | Immigrants from Eastern Europe |
| Minimum | 1.8% | 1.2% |
| Maximum | 18.4% | 14.8% |
| Range | 16.6% | 13.7% |
| Mean | 7.7% | 5.6% |
| Median | 7.0% | 4.9% |
| Interquartile 25% (IQ1) | 5.7% | 3.8% |
| Interquartile 75% (IQ3) | 9.1% | 6.9% |
| Interquartile Range (IQR) | 3.4% | 3.1% |
| Standard Deviation (Sample) | 3.0% | 3.1% |
| Standard Deviation (Population) | 3.0% | 3.0% |
Similar Demographics by Married-Couple Family Poverty
Demographics Similar to Haitians by Married-Couple Family Poverty
In terms of married-couple family poverty, the demographic groups most similar to Haitians are Cuban (6.8%, a difference of 0.10%), Immigrants from El Salvador (6.8%, a difference of 0.55%), Immigrants from Ecuador (6.7%, a difference of 0.83%), Central American (6.7%, a difference of 0.97%), and Immigrants from Belize (6.7%, a difference of 1.6%).
| Demographics | Rating | Rank | Married-Couple Family Poverty |
| Immigrants | Guyana | 0.0 /100 | #298 | Tragic 6.7% |
| Nicaraguans | 0.0 /100 | #299 | Tragic 6.7% |
| Immigrants | Belize | 0.0 /100 | #300 | Tragic 6.7% |
| Central Americans | 0.0 /100 | #301 | Tragic 6.7% |
| Immigrants | Ecuador | 0.0 /100 | #302 | Tragic 6.7% |
| Immigrants | El Salvador | 0.0 /100 | #303 | Tragic 6.8% |
| Cubans | 0.0 /100 | #304 | Tragic 6.8% |
| Haitians | 0.0 /100 | #305 | Tragic 6.8% |
| Immigrants | Haiti | 0.0 /100 | #306 | Tragic 7.0% |
| Guatemalans | 0.0 /100 | #307 | Tragic 7.0% |
| Spanish American Indians | 0.0 /100 | #308 | Tragic 7.1% |
| Hopi | 0.0 /100 | #309 | Tragic 7.1% |
| Immigrants | Nicaragua | 0.0 /100 | #310 | Tragic 7.1% |
| Immigrants | Dominica | 0.0 /100 | #311 | Tragic 7.1% |
| Immigrants | Armenia | 0.0 /100 | #312 | Tragic 7.1% |
Demographics Similar to Immigrants from Eastern Europe by Married-Couple Family Poverty
In terms of married-couple family poverty, the demographic groups most similar to Immigrants from Eastern Europe are Puget Sound Salish (4.9%, a difference of 0.010%), Soviet Union (4.9%, a difference of 0.070%), Immigrants from Pakistan (4.9%, a difference of 0.080%), Immigrants from Kenya (4.9%, a difference of 0.090%), and Samoan (4.9%, a difference of 0.090%).
| Demographics | Rating | Rank | Married-Couple Family Poverty |
| Romanians | 92.5 /100 | #124 | Exceptional 4.8% |
| Immigrants | Bosnia and Herzegovina | 92.5 /100 | #125 | Exceptional 4.8% |
| Immigrants | Asia | 92.3 /100 | #126 | Exceptional 4.8% |
| Egyptians | 92.0 /100 | #127 | Exceptional 4.8% |
| Palestinians | 91.2 /100 | #128 | Exceptional 4.9% |
| Immigrants | Pakistan | 90.7 /100 | #129 | Exceptional 4.9% |
| Soviet Union | 90.7 /100 | #130 | Exceptional 4.9% |
| Immigrants | Eastern Europe | 90.5 /100 | #131 | Exceptional 4.9% |
| Puget Sound Salish | 90.4 /100 | #132 | Exceptional 4.9% |
| Immigrants | Kenya | 90.2 /100 | #133 | Exceptional 4.9% |
| Samoans | 90.2 /100 | #134 | Exceptional 4.9% |
| Assyrians/Chaldeans/Syriacs | 89.4 /100 | #135 | Excellent 4.9% |
| Immigrants | Hungary | 88.7 /100 | #136 | Excellent 4.9% |
| Guamanians/Chamorros | 86.5 /100 | #137 | Excellent 4.9% |
| Chileans | 86.0 /100 | #138 | Excellent 4.9% |