Haitian vs Okinawan Married-Couple Family Poverty
COMPARE
Haitian
Okinawan
Married-Couple Family Poverty
Married-Couple Family Poverty Comparison
Haitians
Okinawans
6.8%
MARRIED-COUPLE FAMILY POVERTY
0.0/ 100
METRIC RATING
305th/ 347
METRIC RANK
4.4%
MARRIED-COUPLE FAMILY POVERTY
99.6/ 100
METRIC RATING
61st/ 347
METRIC RANK
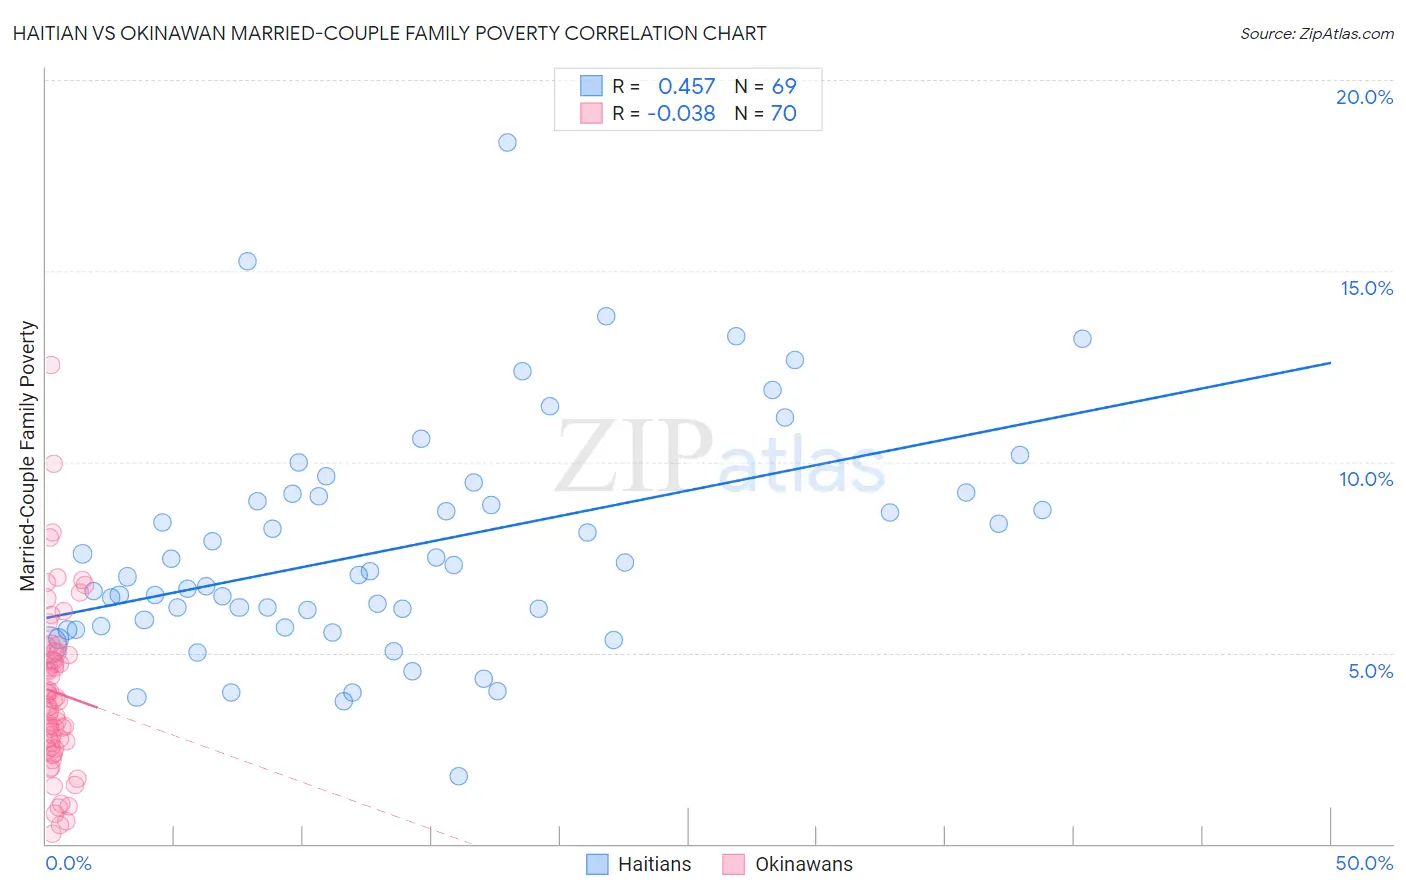
Haitian vs Okinawan Married-Couple Family Poverty Correlation Chart
The statistical analysis conducted on geographies consisting of 285,930,838 people shows a moderate positive correlation between the proportion of Haitians and poverty level among married-couple families in the United States with a correlation coefficient (R) of 0.457 and weighted average of 6.8%. Similarly, the statistical analysis conducted on geographies consisting of 73,604,889 people shows no correlation between the proportion of Okinawans and poverty level among married-couple families in the United States with a correlation coefficient (R) of -0.038 and weighted average of 4.4%, a difference of 55.3%.
Married-Couple Family Poverty Correlation Summary
| Measurement | Haitian | Okinawan |
| Minimum | 1.8% | 0.25% |
| Maximum | 18.4% | 12.5% |
| Range | 16.6% | 12.3% |
| Mean | 7.7% | 4.0% |
| Median | 7.0% | 3.7% |
| Interquartile 25% (IQ1) | 5.7% | 2.5% |
| Interquartile 75% (IQ3) | 9.1% | 5.0% |
| Interquartile Range (IQR) | 3.4% | 2.5% |
| Standard Deviation (Sample) | 3.0% | 2.2% |
| Standard Deviation (Population) | 3.0% | 2.2% |
Similar Demographics by Married-Couple Family Poverty
Demographics Similar to Haitians by Married-Couple Family Poverty
In terms of married-couple family poverty, the demographic groups most similar to Haitians are Cuban (6.8%, a difference of 0.10%), Immigrants from El Salvador (6.8%, a difference of 0.55%), Immigrants from Ecuador (6.7%, a difference of 0.83%), Central American (6.7%, a difference of 0.97%), and Immigrants from Belize (6.7%, a difference of 1.6%).
| Demographics | Rating | Rank | Married-Couple Family Poverty |
| Immigrants | Guyana | 0.0 /100 | #298 | Tragic 6.7% |
| Nicaraguans | 0.0 /100 | #299 | Tragic 6.7% |
| Immigrants | Belize | 0.0 /100 | #300 | Tragic 6.7% |
| Central Americans | 0.0 /100 | #301 | Tragic 6.7% |
| Immigrants | Ecuador | 0.0 /100 | #302 | Tragic 6.7% |
| Immigrants | El Salvador | 0.0 /100 | #303 | Tragic 6.8% |
| Cubans | 0.0 /100 | #304 | Tragic 6.8% |
| Haitians | 0.0 /100 | #305 | Tragic 6.8% |
| Immigrants | Haiti | 0.0 /100 | #306 | Tragic 7.0% |
| Guatemalans | 0.0 /100 | #307 | Tragic 7.0% |
| Spanish American Indians | 0.0 /100 | #308 | Tragic 7.1% |
| Hopi | 0.0 /100 | #309 | Tragic 7.1% |
| Immigrants | Nicaragua | 0.0 /100 | #310 | Tragic 7.1% |
| Immigrants | Dominica | 0.0 /100 | #311 | Tragic 7.1% |
| Immigrants | Armenia | 0.0 /100 | #312 | Tragic 7.1% |
Demographics Similar to Okinawans by Married-Couple Family Poverty
In terms of married-couple family poverty, the demographic groups most similar to Okinawans are Immigrants from Australia (4.4%, a difference of 0.010%), Tlingit-Haida (4.4%, a difference of 0.11%), Immigrants from Sweden (4.4%, a difference of 0.18%), Immigrants from Sri Lanka (4.4%, a difference of 0.37%), and Czechoslovakian (4.4%, a difference of 0.73%).
| Demographics | Rating | Rank | Married-Couple Family Poverty |
| Austrians | 99.7 /100 | #54 | Exceptional 4.3% |
| French | 99.7 /100 | #55 | Exceptional 4.3% |
| Immigrants | Zimbabwe | 99.7 /100 | #56 | Exceptional 4.3% |
| Immigrants | Netherlands | 99.7 /100 | #57 | Exceptional 4.3% |
| Czechoslovakians | 99.7 /100 | #58 | Exceptional 4.4% |
| Immigrants | Sweden | 99.6 /100 | #59 | Exceptional 4.4% |
| Tlingit-Haida | 99.6 /100 | #60 | Exceptional 4.4% |
| Okinawans | 99.6 /100 | #61 | Exceptional 4.4% |
| Immigrants | Australia | 99.6 /100 | #62 | Exceptional 4.4% |
| Immigrants | Sri Lanka | 99.6 /100 | #63 | Exceptional 4.4% |
| Immigrants | Bulgaria | 99.5 /100 | #64 | Exceptional 4.4% |
| Macedonians | 99.4 /100 | #65 | Exceptional 4.4% |
| Immigrants | Serbia | 99.4 /100 | #66 | Exceptional 4.4% |
| Immigrants | Canada | 99.4 /100 | #67 | Exceptional 4.4% |
| Slavs | 99.4 /100 | #68 | Exceptional 4.4% |