Czech College, Under 1 year
COMPARE
Czech
Select to Compare
College, Under 1 year
Czech College, Under 1 year
67.1%
COLLEGE, UNDER 1 YEAR
90.8/ 100
METRIC RATING
127th/ 347
METRIC RANK
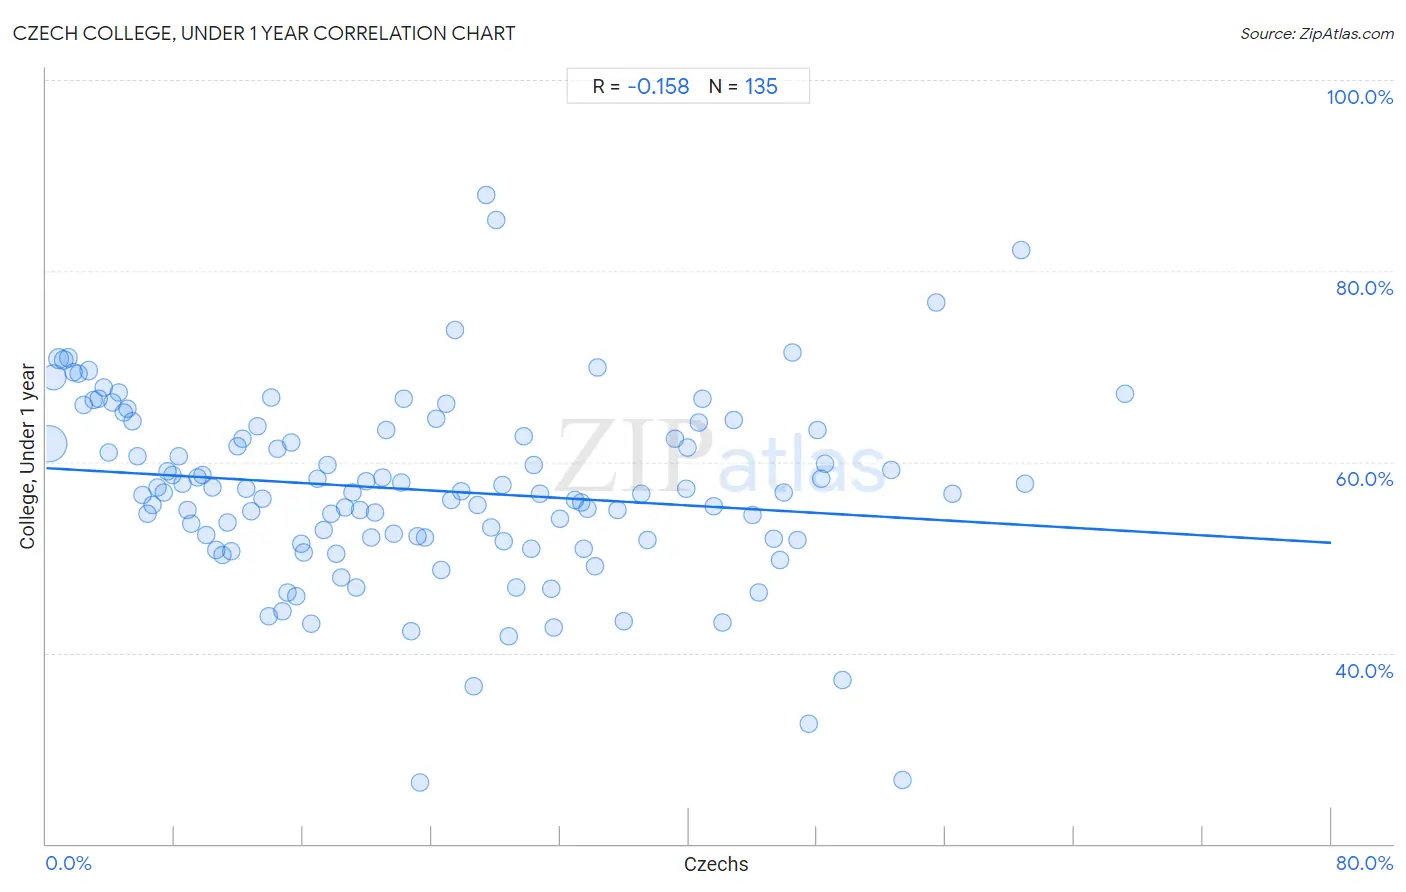
Czech College, Under 1 year Correlation Chart
The statistical analysis conducted on geographies consisting of 484,811,480 people shows a poor negative correlation between the proportion of Czechs and percentage of population with at least college, under 1 year education in the United States with a correlation coefficient (R) of -0.158 and weighted average of 67.1%. On average, for every 1% (one percent) increase in Czechs within a typical geography, there is a decrease of 0.098% in percentage of population with at least college, under 1 year education.
It is essential to understand that the correlation between the percentage of Czechs and percentage of population with at least college, under 1 year education does not imply a direct cause-and-effect relationship. It remains uncertain whether the presence of Czechs influences an upward or downward trend in the level of percentage of population with at least college, under 1 year education within an area, or if Czechs simply ended up residing in those areas with higher or lower levels of percentage of population with at least college, under 1 year education due to other factors.
Demographics Similar to Czechs by College, Under 1 year
In terms of college, under 1 year, the demographic groups most similar to Czechs are Scottish (67.0%, a difference of 0.070%), Alsatian (67.1%, a difference of 0.080%), Italian (67.2%, a difference of 0.14%), Immigrants from Eastern Africa (67.0%, a difference of 0.15%), and Immigrants from Syria (66.9%, a difference of 0.21%).
| Demographics | Rating | Rank | College, Under 1 year |
| Serbians | 93.9 /100 | #120 | Exceptional 67.4% |
| Slovenes | 93.3 /100 | #121 | Exceptional 67.3% |
| Immigrants from Jordan | 92.8 /100 | #122 | Exceptional 67.3% |
| Immigrants from Northern Africa | 92.7 /100 | #123 | Exceptional 67.2% |
| Arabs | 92.6 /100 | #124 | Exceptional 67.2% |
| Italians | 91.8 /100 | #125 | Exceptional 67.2% |
| Alsatians | 91.3 /100 | #126 | Exceptional 67.1% |
| Czechs | 90.8 /100 | #127 | Exceptional 67.1% |
| Scottish | 90.2 /100 | #128 | Exceptional 67.0% |
| Immigrants from Eastern Africa | 89.5 /100 | #129 | Excellent 67.0% |
| Immigrants from Syria | 89.0 /100 | #130 | Excellent 66.9% |
| Finns | 88.6 /100 | #131 | Excellent 66.9% |
| Poles | 88.4 /100 | #132 | Excellent 66.9% |
| Immigrants from Brazil | 88.3 /100 | #133 | Excellent 66.9% |
| Iraqis | 88.0 /100 | #134 | Excellent 66.8% |
Czech College, Under 1 year Correlation Summary
| Measurement | Czech Data | College, Under 1 year Data |
| Minimum | 0.15% | 26.5% |
| Maximum | 67.2% | 88.0% |
| Range | 67.0% | 61.5% |
| Mean | 23.4% | 57.1% |
| Median | 20.9% | 56.8% |
| Interquartile 25% (IQ1) | 10.4% | 51.8% |
| Interquartile 75% (IQ3) | 33.7% | 63.3% |
| Interquartile Range (IQR) | 23.4% | 11.5% |
| Standard Deviation (Sample) | 15.8% | 9.8% |
| Standard Deviation (Population) | 15.7% | 9.8% |
Correlation Details
| Czech Percentile | Sample Size | College, Under 1 year |
[ 0.0% - 0.5% ] 0.15% | 277,969,863 | 61.9% |
[ 0.0% - 0.5% ] 0.43% | 116,021,184 | 68.9% |
[ 0.5% - 1.0% ] 0.75% | 39,383,602 | 70.8% |
[ 1.0% - 1.5% ] 1.06% | 19,159,305 | 70.7% |
[ 1.0% - 1.5% ] 1.38% | 10,713,103 | 70.9% |
[ 1.5% - 2.0% ] 1.69% | 6,491,877 | 69.4% |
[ 2.0% - 2.5% ] 2.01% | 4,104,908 | 69.2% |
[ 2.0% - 2.5% ] 2.30% | 2,188,686 | 65.9% |
[ 2.5% - 3.0% ] 2.61% | 1,655,299 | 69.6% |
[ 2.5% - 3.0% ] 2.93% | 1,162,096 | 66.4% |
[ 3.0% - 3.5% ] 3.23% | 1,303,257 | 66.6% |
[ 3.5% - 4.0% ] 3.55% | 605,336 | 67.8% |
[ 3.5% - 4.0% ] 3.88% | 433,167 | 60.9% |
[ 4.0% - 4.5% ] 4.14% | 616,541 | 66.2% |
[ 4.0% - 4.5% ] 4.49% | 629,310 | 67.3% |
[ 4.5% - 5.0% ] 4.79% | 460,109 | 65.2% |
[ 5.0% - 5.5% ] 5.06% | 314,309 | 65.6% |
[ 5.0% - 5.5% ] 5.36% | 274,282 | 64.2% |
[ 5.5% - 6.0% ] 5.66% | 90,444 | 60.6% |
[ 5.5% - 6.0% ] 6.00% | 99,397 | 56.5% |
[ 6.0% - 6.5% ] 6.30% | 77,111 | 54.6% |
[ 6.5% - 7.0% ] 6.62% | 130,377 | 55.5% |
[ 6.5% - 7.0% ] 6.96% | 68,832 | 57.3% |
[ 7.0% - 7.5% ] 7.31% | 77,693 | 56.8% |
[ 7.5% - 8.0% ] 7.55% | 78,524 | 59.0% |
[ 7.5% - 8.0% ] 7.85% | 71,162 | 58.7% |
[ 8.0% - 8.5% ] 8.23% | 65,486 | 60.6% |
[ 8.0% - 8.5% ] 8.47% | 48,540 | 57.7% |
[ 8.5% - 9.0% ] 8.81% | 32,062 | 55.0% |
[ 9.0% - 9.5% ] 9.06% | 14,760 | 53.5% |
[ 9.0% - 9.5% ] 9.41% | 14,846 | 58.4% |
[ 9.5% - 10.0% ] 9.70% | 24,377 | 58.6% |
[ 9.5% - 10.0% ] 9.98% | 21,970 | 52.3% |
[ 10.0% - 10.5% ] 10.35% | 28,249 | 57.3% |
[ 10.5% - 11.0% ] 10.61% | 12,693 | 50.8% |
[ 10.5% - 11.0% ] 10.97% | 35,527 | 50.3% |
[ 11.0% - 11.5% ] 11.26% | 32,150 | 53.7% |
[ 11.5% - 12.0% ] 11.55% | 10,620 | 50.7% |
[ 11.5% - 12.0% ] 11.87% | 7,077 | 61.6% |
[ 12.0% - 12.5% ] 12.20% | 16,224 | 62.4% |
[ 12.0% - 12.5% ] 12.44% | 11,901 | 57.2% |
[ 12.5% - 13.0% ] 12.77% | 9,798 | 54.8% |
[ 13.0% - 13.5% ] 13.12% | 5,837 | 63.7% |
[ 13.0% - 13.5% ] 13.49% | 13,530 | 56.1% |
[ 13.5% - 14.0% ] 13.86% | 2,251 | 43.8% |
[ 13.5% - 14.0% ] 13.99% | 26,728 | 66.8% |
[ 14.0% - 14.5% ] 14.41% | 10,427 | 61.4% |
[ 14.5% - 15.0% ] 14.72% | 6,332 | 44.3% |
[ 15.0% - 15.5% ] 15.05% | 12,715 | 46.3% |
[ 15.0% - 15.5% ] 15.26% | 3,991 | 62.0% |
[ 15.5% - 16.0% ] 15.60% | 20,101 | 45.9% |
[ 15.5% - 16.0% ] 15.86% | 4,060 | 51.4% |
[ 16.0% - 16.5% ] 16.06% | 965 | 50.5% |
[ 16.0% - 16.5% ] 16.50% | 1,600 | 43.1% |
[ 16.5% - 17.0% ] 16.87% | 5,051 | 58.2% |
[ 17.0% - 17.5% ] 17.26% | 5,688 | 52.9% |
[ 17.5% - 18.0% ] 17.50% | 3,285 | 59.6% |
[ 17.5% - 18.0% ] 17.72% | 7,265 | 54.6% |
[ 18.0% - 18.5% ] 18.04% | 7,688 | 50.4% |
[ 18.0% - 18.5% ] 18.33% | 6,613 | 47.8% |
[ 18.5% - 19.0% ] 18.62% | 1,391 | 55.2% |
[ 19.0% - 19.5% ] 19.07% | 367 | 56.7% |
[ 19.0% - 19.5% ] 19.30% | 2,243 | 46.9% |
[ 19.5% - 20.0% ] 19.56% | 2,086 | 55.0% |
[ 19.5% - 20.0% ] 19.94% | 356 | 58.0% |
[ 20.0% - 20.5% ] 20.23% | 2,027 | 52.0% |
[ 20.0% - 20.5% ] 20.49% | 7,247 | 54.7% |
[ 20.5% - 21.0% ] 20.91% | 2,004 | 58.4% |
[ 21.0% - 21.5% ] 21.16% | 7,901 | 63.3% |
[ 21.5% - 22.0% ] 21.66% | 2,105 | 52.4% |
[ 22.0% - 22.5% ] 22.08% | 874 | 57.8% |
[ 22.0% - 22.5% ] 22.28% | 7,132 | 66.6% |
[ 22.5% - 23.0% ] 22.72% | 471 | 42.3% |
[ 23.0% - 23.5% ] 23.08% | 1,352 | 52.2% |
[ 23.0% - 23.5% ] 23.29% | 73 | 26.5% |
[ 23.5% - 24.0% ] 23.55% | 9,075 | 52.1% |
[ 24.0% - 24.5% ] 24.26% | 878 | 64.6% |
[ 24.5% - 25.0% ] 24.62% | 1,653 | 48.6% |
[ 24.5% - 25.0% ] 24.91% | 562 | 66.1% |
[ 25.0% - 25.5% ] 25.22% | 4,037 | 56.0% |
[ 25.0% - 25.5% ] 25.41% | 181 | 73.8% |
[ 25.5% - 26.0% ] 25.83% | 1,738 | 56.9% |
[ 26.5% - 27.0% ] 26.59% | 425 | 36.5% |
[ 26.5% - 27.0% ] 26.89% | 212 | 55.5% |
[ 27.0% - 27.5% ] 27.41% | 343 | 88.0% |
[ 27.5% - 28.0% ] 27.72% | 2,244 | 53.2% |
[ 28.0% - 28.5% ] 28.05% | 82 | 85.4% |
[ 28.0% - 28.5% ] 28.39% | 560 | 57.6% |
[ 28.5% - 29.0% ] 28.51% | 7,766 | 51.7% |
[ 28.5% - 29.0% ] 28.81% | 236 | 41.7% |
[ 29.0% - 29.5% ] 29.29% | 99 | 46.8% |
[ 29.5% - 30.0% ] 29.76% | 1,929 | 62.7% |
[ 30.0% - 30.5% ] 30.19% | 5,088 | 50.9% |
[ 30.0% - 30.5% ] 30.38% | 609 | 59.6% |
[ 30.5% - 31.0% ] 30.72% | 1,618 | 56.7% |
[ 31.0% - 31.5% ] 31.44% | 776 | 46.8% |
[ 31.5% - 32.0% ] 31.58% | 361 | 42.6% |
[ 31.5% - 32.0% ] 31.95% | 169 | 54.0% |
[ 32.5% - 33.0% ] 32.94% | 513 | 56.0% |
[ 33.0% - 33.5% ] 33.33% | 183 | 55.7% |
[ 33.0% - 33.5% ] 33.48% | 1,643 | 50.9% |
[ 33.5% - 34.0% ] 33.71% | 5,443 | 55.1% |
[ 34.0% - 34.5% ] 34.17% | 120 | 49.1% |
[ 34.0% - 34.5% ] 34.31% | 204 | 69.9% |
[ 35.5% - 36.0% ] 35.60% | 663 | 55.0% |
[ 35.5% - 36.0% ] 35.97% | 620 | 43.3% |
[ 37.0% - 37.5% ] 37.03% | 1,345 | 56.6% |
[ 37.0% - 37.5% ] 37.45% | 275 | 51.8% |
[ 39.0% - 39.5% ] 39.14% | 350 | 62.4% |
[ 39.5% - 40.0% ] 39.83% | 118 | 57.1% |
[ 39.5% - 40.0% ] 39.95% | 2,095 | 61.5% |
[ 40.5% - 41.0% ] 40.59% | 2,237 | 64.2% |
[ 40.5% - 41.0% ] 40.87% | 115 | 66.7% |
[ 41.5% - 42.0% ] 41.56% | 77 | 55.4% |
[ 42.0% - 42.5% ] 42.07% | 290 | 43.2% |
[ 42.5% - 43.0% ] 42.83% | 635 | 64.4% |
[ 43.5% - 44.0% ] 43.97% | 630 | 54.5% |
[ 44.0% - 44.5% ] 44.36% | 133 | 46.4% |
[ 45.0% - 45.5% ] 45.29% | 616 | 52.0% |
[ 45.5% - 46.0% ] 45.66% | 679 | 49.7% |
[ 45.5% - 46.0% ] 45.90% | 427 | 56.8% |
[ 46.0% - 46.5% ] 46.43% | 28 | 71.4% |
[ 46.5% - 47.0% ] 46.81% | 376 | 51.8% |
[ 47.0% - 47.5% ] 47.46% | 118 | 32.6% |
[ 48.0% - 48.5% ] 48.05% | 745 | 63.3% |
[ 48.0% - 48.5% ] 48.25% | 342 | 58.3% |
[ 48.0% - 48.5% ] 48.49% | 365 | 59.8% |
[ 49.5% - 50.0% ] 49.54% | 109 | 37.2% |
[ 52.5% - 53.0% ] 52.57% | 272 | 59.2% |
[ 53.0% - 53.5% ] 53.33% | 30 | 26.7% |
[ 55.0% - 55.5% ] 55.38% | 251 | 76.7% |
[ 56.0% - 56.5% ] 56.39% | 454 | 56.7% |
[ 60.5% - 61.0% ] 60.71% | 56 | 82.1% |
[ 60.5% - 61.0% ] 60.90% | 335 | 57.7% |
[ 67.0% - 67.5% ] 67.15% | 137 | 67.2% |