Czech vs Iroquois Married-Couple Family Poverty
COMPARE
Czech
Iroquois
Married-Couple Family Poverty
Married-Couple Family Poverty Comparison
Czechs
Iroquois
4.0%
MARRIED-COUPLE FAMILY POVERTY
100.0/ 100
METRIC RATING
13th/ 347
METRIC RANK
5.5%
MARRIED-COUPLE FAMILY POVERTY
13.1/ 100
METRIC RATING
214th/ 347
METRIC RANK
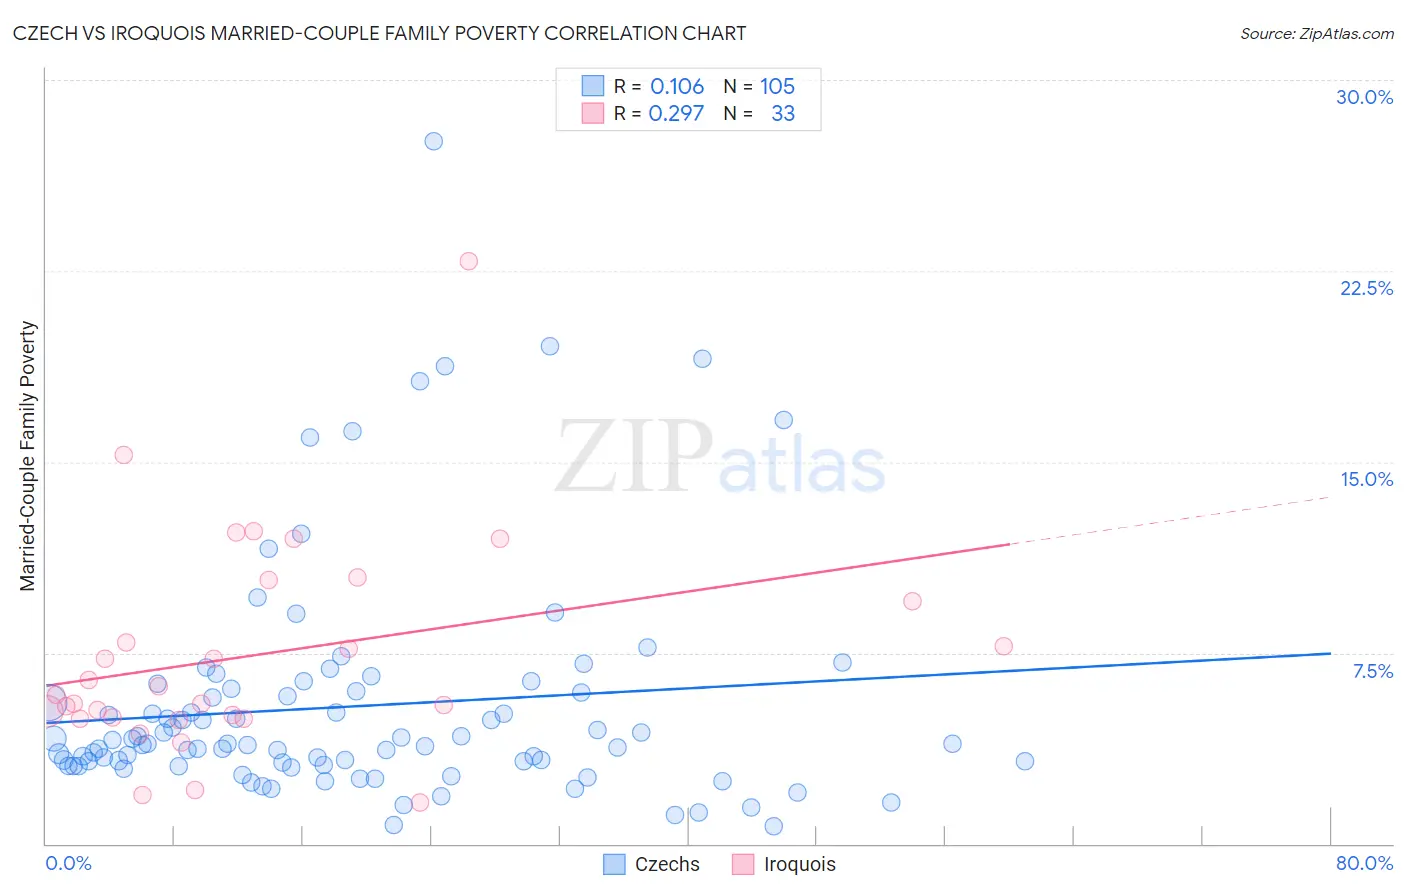
Czech vs Iroquois Married-Couple Family Poverty Correlation Chart
The statistical analysis conducted on geographies consisting of 476,498,804 people shows a poor positive correlation between the proportion of Czechs and poverty level among married-couple families in the United States with a correlation coefficient (R) of 0.106 and weighted average of 4.0%. Similarly, the statistical analysis conducted on geographies consisting of 206,259,155 people shows a weak positive correlation between the proportion of Iroquois and poverty level among married-couple families in the United States with a correlation coefficient (R) of 0.297 and weighted average of 5.5%, a difference of 36.9%.
Married-Couple Family Poverty Correlation Summary
| Measurement | Czech | Iroquois |
| Minimum | 0.69% | 1.6% |
| Maximum | 27.6% | 22.9% |
| Range | 26.9% | 21.3% |
| Mean | 5.4% | 7.4% |
| Median | 3.9% | 5.9% |
| Interquartile 25% (IQ1) | 3.1% | 4.9% |
| Interquartile 75% (IQ3) | 6.0% | 9.9% |
| Interquartile Range (IQR) | 2.9% | 5.0% |
| Standard Deviation (Sample) | 4.5% | 4.3% |
| Standard Deviation (Population) | 4.5% | 4.2% |
Similar Demographics by Married-Couple Family Poverty
Demographics Similar to Czechs by Married-Couple Family Poverty
In terms of married-couple family poverty, the demographic groups most similar to Czechs are Slovak (4.0%, a difference of 0.040%), Polish (4.0%, a difference of 0.070%), German (4.0%, a difference of 0.34%), Filipino (4.0%, a difference of 0.37%), and Italian (4.0%, a difference of 0.38%).
| Demographics | Rating | Rank | Married-Couple Family Poverty |
| Luxembourgers | 100.0 /100 | #6 | Exceptional 3.9% |
| Latvians | 100.0 /100 | #7 | Exceptional 3.9% |
| Thais | 100.0 /100 | #8 | Exceptional 3.9% |
| Croatians | 100.0 /100 | #9 | Exceptional 3.9% |
| Carpatho Rusyns | 100.0 /100 | #10 | Exceptional 3.9% |
| Lithuanians | 100.0 /100 | #11 | Exceptional 4.0% |
| Bulgarians | 100.0 /100 | #12 | Exceptional 4.0% |
| Czechs | 100.0 /100 | #13 | Exceptional 4.0% |
| Slovaks | 100.0 /100 | #14 | Exceptional 4.0% |
| Poles | 100.0 /100 | #15 | Exceptional 4.0% |
| Germans | 100.0 /100 | #16 | Exceptional 4.0% |
| Filipinos | 100.0 /100 | #17 | Exceptional 4.0% |
| Italians | 100.0 /100 | #18 | Exceptional 4.0% |
| Immigrants | Ireland | 99.9 /100 | #19 | Exceptional 4.1% |
| Maltese | 99.9 /100 | #20 | Exceptional 4.1% |
Demographics Similar to Iroquois by Married-Couple Family Poverty
In terms of married-couple family poverty, the demographic groups most similar to Iroquois are Immigrants from Liberia (5.5%, a difference of 0.040%), Armenian (5.5%, a difference of 0.060%), Potawatomi (5.5%, a difference of 0.18%), Immigrants from Thailand (5.5%, a difference of 0.22%), and Nigerian (5.5%, a difference of 0.29%).
| Demographics | Rating | Rank | Married-Couple Family Poverty |
| Immigrants | Africa | 17.6 /100 | #207 | Poor 5.5% |
| French American Indians | 16.1 /100 | #208 | Poor 5.5% |
| Immigrants | Syria | 15.4 /100 | #209 | Poor 5.5% |
| Immigrants | Micronesia | 14.4 /100 | #210 | Poor 5.5% |
| Nigerians | 14.3 /100 | #211 | Poor 5.5% |
| Immigrants | Thailand | 14.0 /100 | #212 | Poor 5.5% |
| Immigrants | Liberia | 13.3 /100 | #213 | Poor 5.5% |
| Iroquois | 13.1 /100 | #214 | Poor 5.5% |
| Armenians | 12.8 /100 | #215 | Poor 5.5% |
| Potawatomi | 12.4 /100 | #216 | Poor 5.5% |
| Immigrants | Nigeria | 11.3 /100 | #217 | Poor 5.5% |
| Afghans | 11.2 /100 | #218 | Poor 5.5% |
| Japanese | 9.8 /100 | #219 | Tragic 5.6% |
| Colombians | 9.2 /100 | #220 | Tragic 5.6% |
| Panamanians | 9.2 /100 | #221 | Tragic 5.6% |