Cypriot vs Lumbee Married-Couple Family Poverty
COMPARE
Cypriot
Lumbee
Married-Couple Family Poverty
Married-Couple Family Poverty Comparison
Cypriots
Lumbee
4.1%
MARRIED-COUPLE FAMILY POVERTY
99.9/ 100
METRIC RATING
26th/ 347
METRIC RANK
8.3%
MARRIED-COUPLE FAMILY POVERTY
0.0/ 100
METRIC RATING
333rd/ 347
METRIC RANK
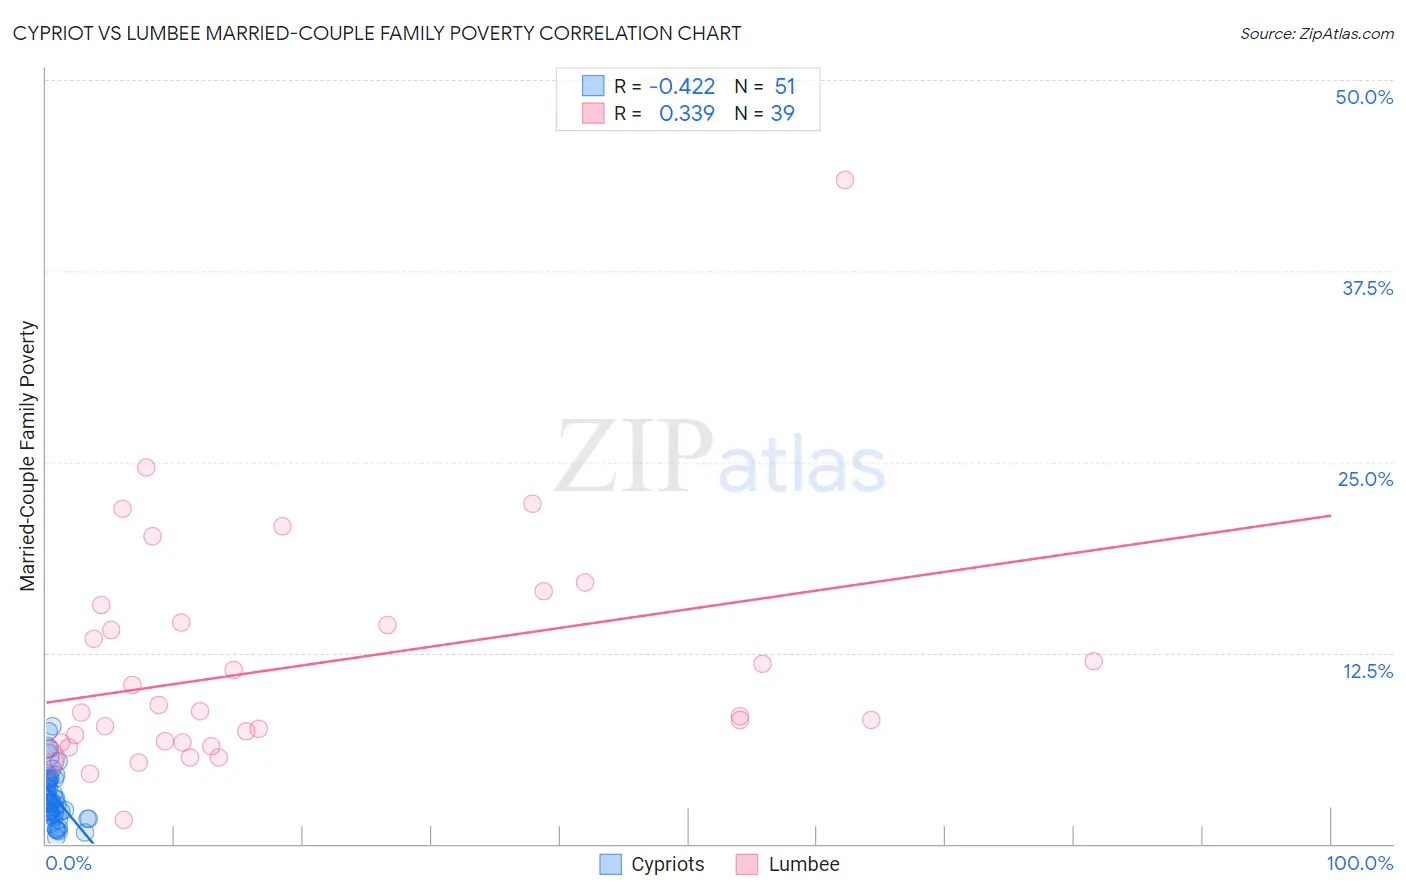
Cypriot vs Lumbee Married-Couple Family Poverty Correlation Chart
The statistical analysis conducted on geographies consisting of 61,691,047 people shows a moderate negative correlation between the proportion of Cypriots and poverty level among married-couple families in the United States with a correlation coefficient (R) of -0.422 and weighted average of 4.1%. Similarly, the statistical analysis conducted on geographies consisting of 92,019,006 people shows a mild positive correlation between the proportion of Lumbee and poverty level among married-couple families in the United States with a correlation coefficient (R) of 0.339 and weighted average of 8.3%, a difference of 101.5%.
Married-Couple Family Poverty Correlation Summary
| Measurement | Cypriot | Lumbee |
| Minimum | 0.39% | 1.5% |
| Maximum | 7.7% | 43.5% |
| Range | 7.3% | 41.9% |
| Mean | 3.1% | 11.6% |
| Median | 2.7% | 8.6% |
| Interquartile 25% (IQ1) | 1.9% | 6.6% |
| Interquartile 75% (IQ3) | 4.2% | 14.5% |
| Interquartile Range (IQR) | 2.4% | 7.9% |
| Standard Deviation (Sample) | 1.7% | 7.7% |
| Standard Deviation (Population) | 1.7% | 7.6% |
Similar Demographics by Married-Couple Family Poverty
Demographics Similar to Cypriots by Married-Couple Family Poverty
In terms of married-couple family poverty, the demographic groups most similar to Cypriots are Danish (4.1%, a difference of 0.11%), Scandinavian (4.1%, a difference of 0.22%), Immigrants from Scotland (4.2%, a difference of 0.26%), Immigrants from Taiwan (4.1%, a difference of 0.27%), and Finnish (4.2%, a difference of 0.50%).
| Demographics | Rating | Rank | Married-Couple Family Poverty |
| Immigrants | Ireland | 99.9 /100 | #19 | Exceptional 4.1% |
| Maltese | 99.9 /100 | #20 | Exceptional 4.1% |
| Zimbabweans | 99.9 /100 | #21 | Exceptional 4.1% |
| Immigrants | Singapore | 99.9 /100 | #22 | Exceptional 4.1% |
| Bhutanese | 99.9 /100 | #23 | Exceptional 4.1% |
| Eastern Europeans | 99.9 /100 | #24 | Exceptional 4.1% |
| Immigrants | Taiwan | 99.9 /100 | #25 | Exceptional 4.1% |
| Cypriots | 99.9 /100 | #26 | Exceptional 4.1% |
| Danes | 99.9 /100 | #27 | Exceptional 4.1% |
| Scandinavians | 99.9 /100 | #28 | Exceptional 4.1% |
| Immigrants | Scotland | 99.9 /100 | #29 | Exceptional 4.2% |
| Finns | 99.9 /100 | #30 | Exceptional 4.2% |
| Estonians | 99.9 /100 | #31 | Exceptional 4.2% |
| Greeks | 99.9 /100 | #32 | Exceptional 4.2% |
| Irish | 99.9 /100 | #33 | Exceptional 4.2% |
Demographics Similar to Lumbee by Married-Couple Family Poverty
In terms of married-couple family poverty, the demographic groups most similar to Lumbee are Dominican (8.3%, a difference of 0.47%), Central American Indian (8.3%, a difference of 0.53%), Paiute (8.3%, a difference of 0.59%), Immigrants from Dominican Republic (8.4%, a difference of 0.68%), and Native/Alaskan (8.2%, a difference of 1.9%).
| Demographics | Rating | Rank | Married-Couple Family Poverty |
| Immigrants | Bangladesh | 0.0 /100 | #326 | Tragic 7.5% |
| Hispanics or Latinos | 0.0 /100 | #327 | Tragic 7.5% |
| Immigrants | Mexico | 0.0 /100 | #328 | Tragic 7.6% |
| Natives/Alaskans | 0.0 /100 | #329 | Tragic 8.2% |
| Paiute | 0.0 /100 | #330 | Tragic 8.3% |
| Central American Indians | 0.0 /100 | #331 | Tragic 8.3% |
| Dominicans | 0.0 /100 | #332 | Tragic 8.3% |
| Lumbee | 0.0 /100 | #333 | Tragic 8.3% |
| Immigrants | Dominican Republic | 0.0 /100 | #334 | Tragic 8.4% |
| Sioux | 0.0 /100 | #335 | Tragic 8.7% |
| Apache | 0.0 /100 | #336 | Tragic 9.0% |
| Yakama | 0.0 /100 | #337 | Tragic 9.0% |
| Cheyenne | 0.0 /100 | #338 | Tragic 9.4% |
| Crow | 0.0 /100 | #339 | Tragic 9.6% |
| Yuman | 0.0 /100 | #340 | Tragic 9.7% |