Albanian 3 or more Vehicles in Household
COMPARE
Albanian
Select to Compare
3 or more Vehicles in Household
Albanian 3 or more Vehicles in Household
15.8%
3+ VEHICLES AVAILABLE
0.0/ 100
METRIC RATING
311th/ 347
METRIC RANK
Albanian 3 or more Vehicles in Household Correlation Chart
The statistical analysis conducted on geographies consisting of 193,117,321 people shows a poor positive correlation between the proportion of Albanians and percentage of households with 3 or more vehicles available in the United States with a correlation coefficient (R) of 0.145 and weighted average of 15.8%. On average, for every 1% (one percent) increase in Albanians within a typical geography, there is an increase of 0.19% in percentage of households with 3 or more vehicles available.
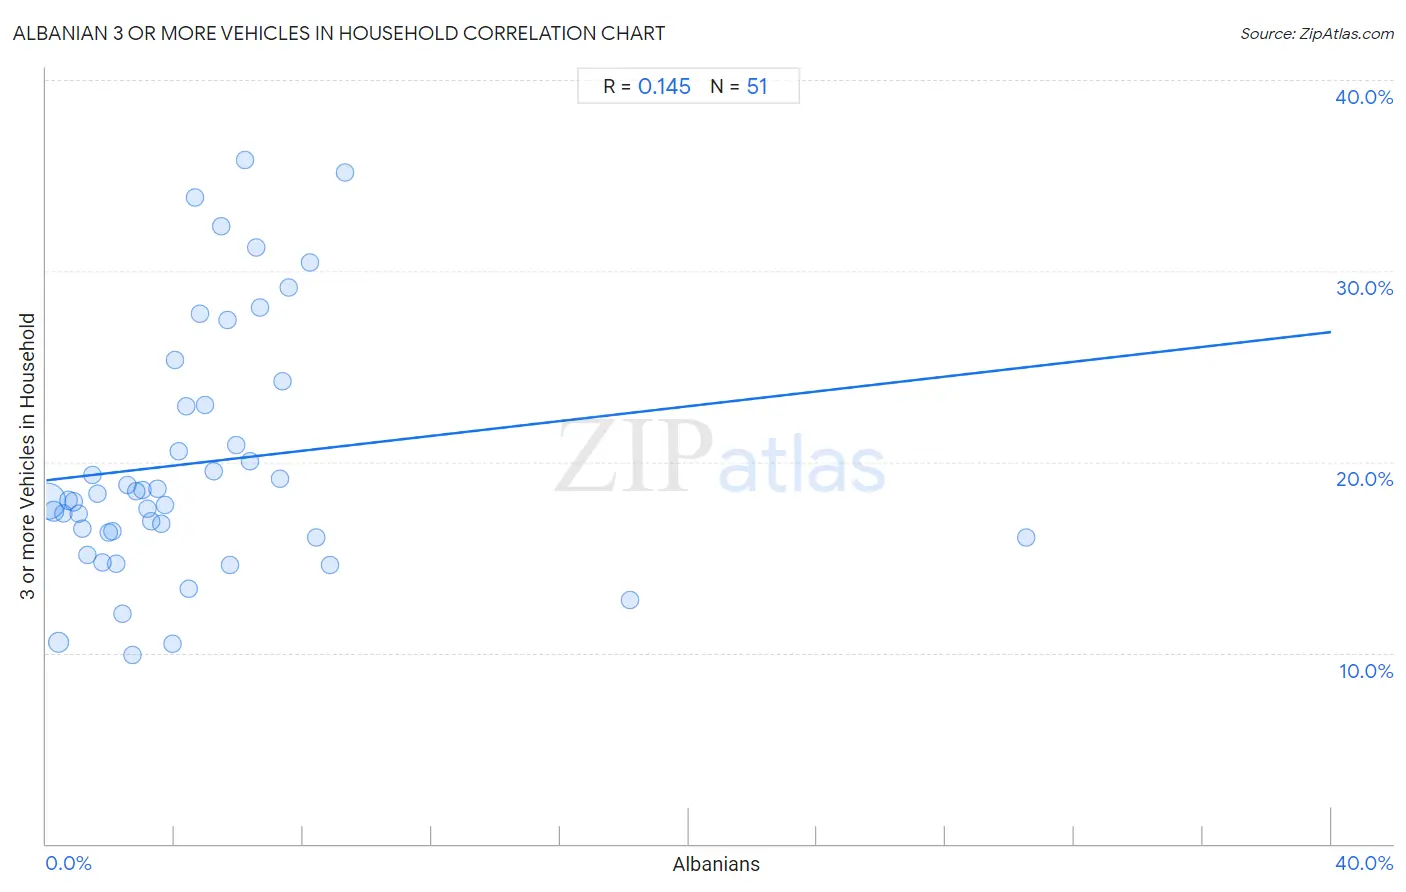
It is essential to understand that the correlation between the percentage of Albanians and percentage of households with 3 or more vehicles available does not imply a direct cause-and-effect relationship. It remains uncertain whether the presence of Albanians influences an upward or downward trend in the level of percentage of households with 3 or more vehicles available within an area, or if Albanians simply ended up residing in those areas with higher or lower levels of percentage of households with 3 or more vehicles available due to other factors.
Demographics Similar to Albanians by 3 or more Vehicles in Household
In terms of 3 or more vehicles in household, the demographic groups most similar to Albanians are Moroccan (15.9%, a difference of 0.50%), Immigrants from Somalia (15.9%, a difference of 0.74%), Puerto Rican (15.6%, a difference of 1.1%), Immigrants from Israel (15.6%, a difference of 1.2%), and Houma (16.1%, a difference of 1.7%).
| Demographics | Rating | Rank | 3 or more Vehicles in Household |
| Ghanaians | 0.0 /100 | #304 | Tragic 16.4% |
| Immigrants from Morocco | 0.0 /100 | #305 | Tragic 16.3% |
| Somalis | 0.0 /100 | #306 | Tragic 16.2% |
| Immigrants from Ghana | 0.0 /100 | #307 | Tragic 16.2% |
| Houma | 0.0 /100 | #308 | Tragic 16.1% |
| Immigrants from Somalia | 0.0 /100 | #309 | Tragic 15.9% |
| Moroccans | 0.0 /100 | #310 | Tragic 15.9% |
| Albanians | 0.0 /100 | #311 | Tragic 15.8% |
| Puerto Ricans | 0.0 /100 | #312 | Tragic 15.6% |
| Immigrants from Israel | 0.0 /100 | #313 | Tragic 15.6% |
| Immigrants from Belarus | 0.0 /100 | #314 | Tragic 15.5% |
| Haitians | 0.0 /100 | #315 | Tragic 15.5% |
| U.S. Virgin Islanders | 0.0 /100 | #316 | Tragic 15.4% |
| Jamaicans | 0.0 /100 | #317 | Tragic 15.2% |
| Immigrants from Haiti | 0.0 /100 | #318 | Tragic 15.2% |
Albanian 3 or more Vehicles in Household Correlation Summary
| Measurement | Albanian Data | 3 or more Vehicles in Household Data |
| Minimum | 0.043% | 9.9% |
| Maximum | 30.5% | 35.8% |
| Range | 30.5% | 25.9% |
| Mean | 4.7% | 20.0% |
| Median | 3.9% | 18.0% |
| Interquartile 25% (IQ1) | 1.9% | 16.1% |
| Interquartile 75% (IQ3) | 6.2% | 23.0% |
| Interquartile Range (IQR) | 4.2% | 6.9% |
| Standard Deviation (Sample) | 4.8% | 6.5% |
| Standard Deviation (Population) | 4.8% | 6.4% |
Correlation Details
| Albanian Percentile | Sample Size | 3 or more Vehicles in Household |
[ 0.0% - 0.5% ] 0.043% | 136,044,971 | 18.0% |
[ 0.0% - 0.5% ] 0.21% | 18,103,247 | 17.4% |
[ 0.0% - 0.5% ] 0.40% | 20,171,888 | 10.5% |
[ 0.5% - 1.0% ] 0.53% | 5,077,732 | 17.3% |
[ 0.5% - 1.0% ] 0.68% | 3,436,439 | 18.0% |
[ 0.5% - 1.0% ] 0.84% | 1,714,873 | 17.9% |
[ 0.5% - 1.0% ] 1.00% | 1,351,109 | 17.3% |
[ 1.0% - 1.5% ] 1.14% | 1,352,390 | 16.5% |
[ 1.0% - 1.5% ] 1.30% | 1,034,168 | 15.1% |
[ 1.0% - 1.5% ] 1.44% | 585,678 | 19.3% |
[ 1.5% - 2.0% ] 1.60% | 477,249 | 18.3% |
[ 1.5% - 2.0% ] 1.75% | 740,270 | 14.7% |
[ 1.5% - 2.0% ] 1.95% | 412,933 | 16.3% |
[ 2.0% - 2.5% ] 2.08% | 225,004 | 16.4% |
[ 2.0% - 2.5% ] 2.18% | 496,877 | 14.7% |
[ 2.0% - 2.5% ] 2.36% | 280,740 | 12.0% |
[ 2.5% - 3.0% ] 2.53% | 442,934 | 18.8% |
[ 2.5% - 3.0% ] 2.69% | 151,151 | 9.9% |
[ 2.5% - 3.0% ] 2.80% | 198,768 | 18.5% |
[ 3.0% - 3.5% ] 3.01% | 140,821 | 18.5% |
[ 3.0% - 3.5% ] 3.17% | 84,041 | 17.6% |
[ 3.0% - 3.5% ] 3.26% | 53,740 | 16.9% |
[ 3.0% - 3.5% ] 3.45% | 99,883 | 18.6% |
[ 3.5% - 4.0% ] 3.59% | 96,803 | 16.8% |
[ 3.5% - 4.0% ] 3.71% | 85,575 | 17.7% |
[ 3.5% - 4.0% ] 3.93% | 74,335 | 10.5% |
[ 4.0% - 4.5% ] 4.03% | 8,966 | 25.4% |
[ 4.0% - 4.5% ] 4.13% | 7,948 | 20.5% |
[ 4.0% - 4.5% ] 4.34% | 13,777 | 22.9% |
[ 4.0% - 4.5% ] 4.43% | 33,894 | 13.4% |
[ 4.5% - 5.0% ] 4.63% | 5,338 | 33.8% |
[ 4.5% - 5.0% ] 4.80% | 2,937 | 27.8% |
[ 4.5% - 5.0% ] 4.93% | 30,413 | 23.0% |
[ 5.0% - 5.5% ] 5.20% | 173 | 19.5% |
[ 5.0% - 5.5% ] 5.47% | 2,415 | 32.3% |
[ 5.5% - 6.0% ] 5.63% | 1,350 | 27.4% |
[ 5.5% - 6.0% ] 5.72% | 41,328 | 14.6% |
[ 5.5% - 6.0% ] 5.92% | 7,337 | 20.9% |
[ 6.0% - 6.5% ] 6.17% | 3,304 | 35.8% |
[ 6.0% - 6.5% ] 6.32% | 3,700 | 20.0% |
[ 6.5% - 7.0% ] 6.53% | 383 | 31.2% |
[ 6.5% - 7.0% ] 6.64% | 2,047 | 28.1% |
[ 7.0% - 7.5% ] 7.28% | 2,336 | 19.1% |
[ 7.0% - 7.5% ] 7.37% | 1,656 | 24.2% |
[ 7.5% - 8.0% ] 7.54% | 2,017 | 29.1% |
[ 8.0% - 8.5% ] 8.19% | 891 | 30.4% |
[ 8.0% - 8.5% ] 8.41% | 2,353 | 16.0% |
[ 8.5% - 9.0% ] 8.82% | 6,653 | 14.6% |
[ 9.0% - 9.5% ] 9.30% | 1,409 | 35.1% |
[ 18.0% - 18.5% ] 18.16% | 936 | 12.8% |
[ 30.0% - 30.5% ] 30.50% | 141 | 16.1% |