Albanian vs Sri Lankan Married-Couple Family Poverty
COMPARE
Albanian
Sri Lankan
Married-Couple Family Poverty
Married-Couple Family Poverty Comparison
Albanians
Sri Lankans
5.0%
MARRIED-COUPLE FAMILY POVERTY
77.2/ 100
METRIC RATING
152nd/ 347
METRIC RANK
5.1%
MARRIED-COUPLE FAMILY POVERTY
72.2/ 100
METRIC RATING
156th/ 347
METRIC RANK
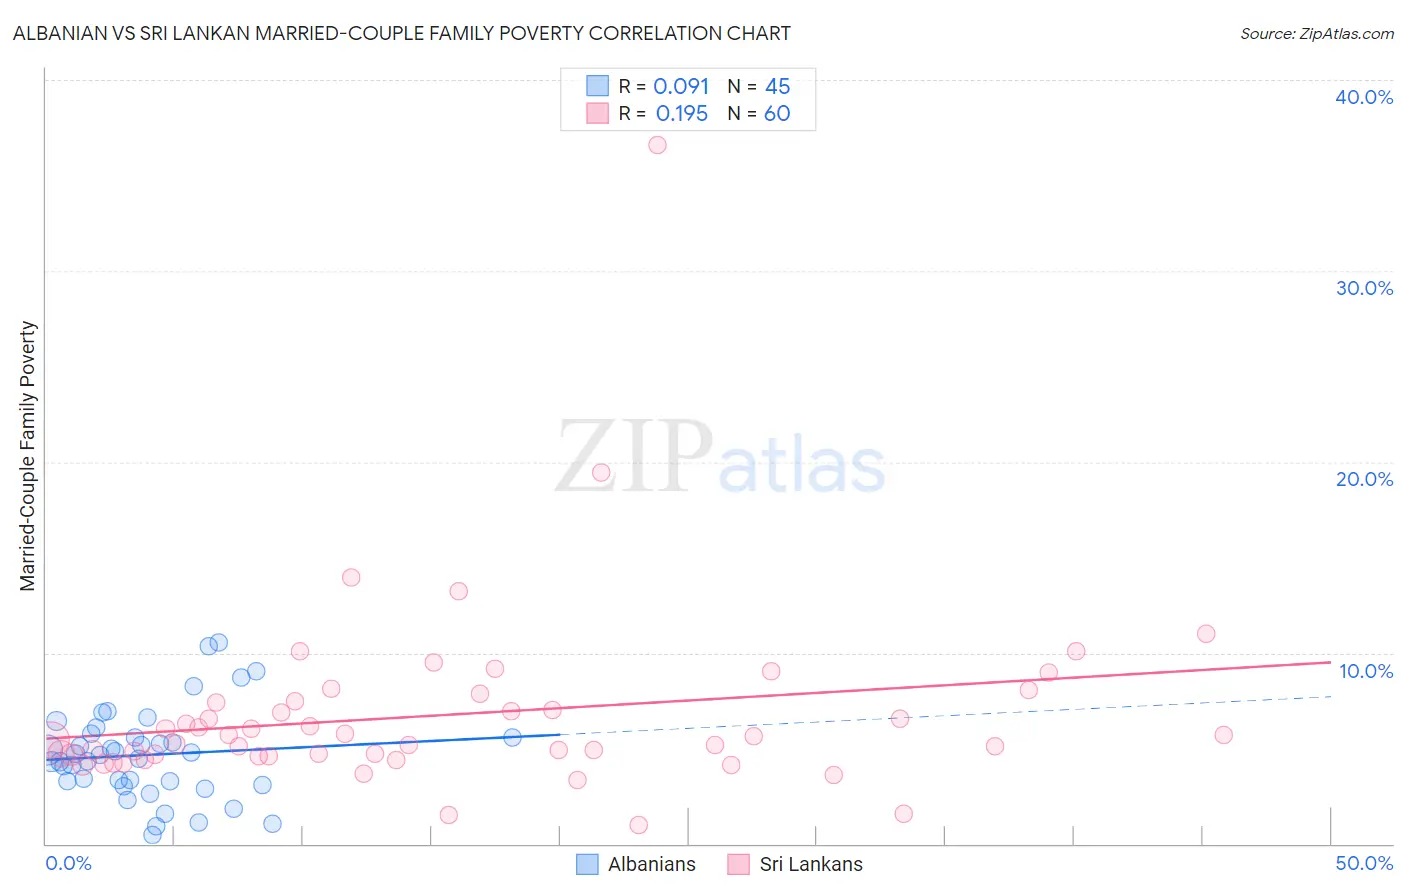
Albanian vs Sri Lankan Married-Couple Family Poverty Correlation Chart
The statistical analysis conducted on geographies consisting of 191,950,147 people shows a slight positive correlation between the proportion of Albanians and poverty level among married-couple families in the United States with a correlation coefficient (R) of 0.091 and weighted average of 5.0%. Similarly, the statistical analysis conducted on geographies consisting of 436,204,277 people shows a poor positive correlation between the proportion of Sri Lankans and poverty level among married-couple families in the United States with a correlation coefficient (R) of 0.195 and weighted average of 5.1%, a difference of 0.80%.
Married-Couple Family Poverty Correlation Summary
| Measurement | Albanian | Sri Lankan |
| Minimum | 0.48% | 0.96% |
| Maximum | 10.5% | 36.6% |
| Range | 10.0% | 35.6% |
| Mean | 4.7% | 6.8% |
| Median | 4.7% | 5.5% |
| Interquartile 25% (IQ1) | 3.2% | 4.6% |
| Interquartile 75% (IQ3) | 5.7% | 7.4% |
| Interquartile Range (IQR) | 2.5% | 2.8% |
| Standard Deviation (Sample) | 2.3% | 4.9% |
| Standard Deviation (Population) | 2.3% | 4.9% |
Demographics Similar to Albanians and Sri Lankans by Married-Couple Family Poverty
In terms of married-couple family poverty, the demographic groups most similar to Albanians are Immigrants from Cameroon (5.0%, a difference of 0.010%), Immigrants from Kuwait (5.0%, a difference of 0.15%), Brazilian (5.0%, a difference of 0.19%), Immigrants from Oceania (5.0%, a difference of 0.24%), and Immigrants from Russia (5.0%, a difference of 0.26%). Similarly, the demographic groups most similar to Sri Lankans are Immigrants from Ethiopia (5.1%, a difference of 0.040%), Argentinean (5.1%, a difference of 0.22%), Delaware (5.1%, a difference of 0.23%), Immigrants from South Eastern Asia (5.1%, a difference of 0.27%), and Immigrants from Saudi Arabia (5.1%, a difference of 0.27%).
| Demographics | Rating | Rank | Married-Couple Family Poverty |
| Hmong | 83.2 /100 | #144 | Excellent 5.0% |
| Immigrants | Spain | 79.9 /100 | #145 | Good 5.0% |
| Mongolians | 79.8 /100 | #146 | Good 5.0% |
| Syrians | 78.7 /100 | #147 | Good 5.0% |
| Immigrants | Russia | 78.7 /100 | #148 | Good 5.0% |
| Immigrants | Oceania | 78.6 /100 | #149 | Good 5.0% |
| Brazilians | 78.3 /100 | #150 | Good 5.0% |
| Immigrants | Cameroon | 77.3 /100 | #151 | Good 5.0% |
| Albanians | 77.2 /100 | #152 | Good 5.0% |
| Immigrants | Kuwait | 76.3 /100 | #153 | Good 5.0% |
| Delaware | 73.7 /100 | #154 | Good 5.1% |
| Immigrants | Ethiopia | 72.4 /100 | #155 | Good 5.1% |
| Sri Lankans | 72.2 /100 | #156 | Good 5.1% |
| Argentineans | 70.7 /100 | #157 | Good 5.1% |
| Immigrants | South Eastern Asia | 70.4 /100 | #158 | Good 5.1% |
| Immigrants | Saudi Arabia | 70.3 /100 | #159 | Good 5.1% |
| Pennsylvania Germans | 68.5 /100 | #160 | Good 5.1% |
| Ethiopians | 68.1 /100 | #161 | Good 5.1% |
| Immigrants | Jordan | 66.5 /100 | #162 | Good 5.1% |
| Sierra Leoneans | 64.1 /100 | #163 | Good 5.1% |
| Hawaiians | 62.3 /100 | #164 | Good 5.1% |