Albanian Disability Age 5 to 17
COMPARE
Albanian
Select to Compare
Disability Age 5 to 17
Albanian Disability Age 5 to 17
5.5%
DISABILITY | AGE 5 TO 17
83.7/ 100
METRIC RATING
146th/ 347
METRIC RANK
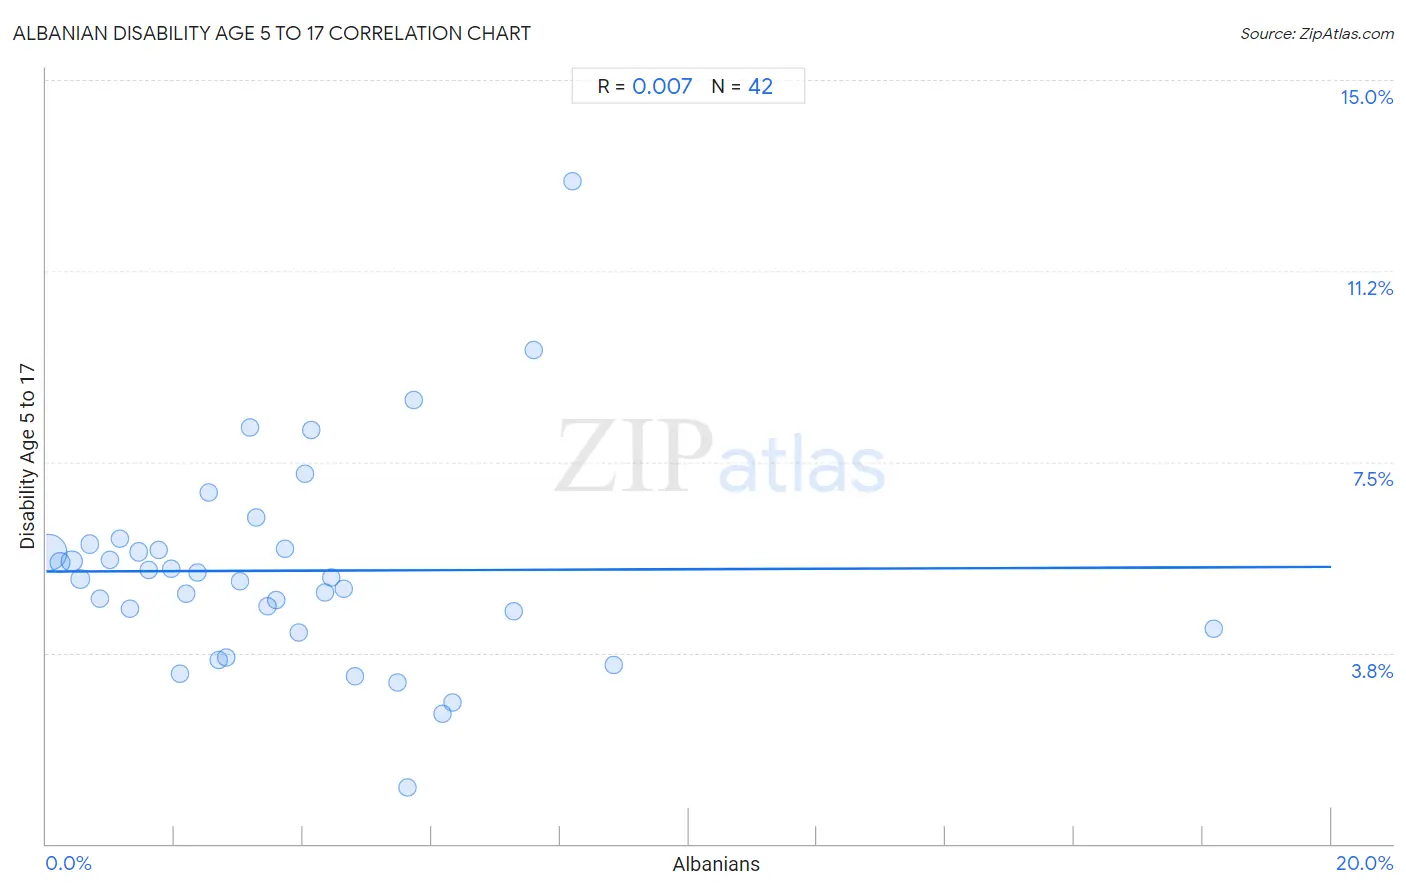
Albanian Disability Age 5 to 17 Correlation Chart
The statistical analysis conducted on geographies consisting of 192,377,953 people shows no correlation between the proportion of Albanians and percentage of population with a disability between the ages 5 and 17 in the United States with a correlation coefficient (R) of 0.007 and weighted average of 5.5%. On average, for every 1% (one percent) increase in Albanians within a typical geography, there is an increase of 0.0045% in percentage of population with a disability between the ages 5 and 17.
It is essential to understand that the correlation between the percentage of Albanians and percentage of population with a disability between the ages 5 and 17 does not imply a direct cause-and-effect relationship. It remains uncertain whether the presence of Albanians influences an upward or downward trend in the level of percentage of population with a disability between the ages 5 and 17 within an area, or if Albanians simply ended up residing in those areas with higher or lower levels of percentage of population with a disability between the ages 5 and 17 due to other factors.
Demographics Similar to Albanians by Disability Age 5 to 17
In terms of disability age 5 to 17, the demographic groups most similar to Albanians are Immigrants from Albania (5.5%, a difference of 0.060%), Samoan (5.5%, a difference of 0.16%), Central American (5.5%, a difference of 0.19%), Guatemalan (5.5%, a difference of 0.19%), and Estonian (5.5%, a difference of 0.26%).
| Demographics | Rating | Rank | Disability Age 5 to 17 |
| Belizeans | 90.8 /100 | #139 | Exceptional 5.4% |
| Immigrants from Netherlands | 90.5 /100 | #140 | Exceptional 5.4% |
| South American Indians | 89.3 /100 | #141 | Excellent 5.5% |
| Colombians | 88.0 /100 | #142 | Excellent 5.5% |
| Immigrants from Hungary | 87.9 /100 | #143 | Excellent 5.5% |
| Pakistanis | 87.3 /100 | #144 | Excellent 5.5% |
| Immigrants from Guatemala | 86.6 /100 | #145 | Excellent 5.5% |
| Albanians | 83.7 /100 | #146 | Excellent 5.5% |
| Immigrants from Albania | 83.1 /100 | #147 | Excellent 5.5% |
| Samoans | 81.9 /100 | #148 | Excellent 5.5% |
| Central Americans | 81.6 /100 | #149 | Excellent 5.5% |
| Guatemalans | 81.5 /100 | #150 | Excellent 5.5% |
| Estonians | 80.8 /100 | #151 | Excellent 5.5% |
| Ute | 80.6 /100 | #152 | Excellent 5.5% |
| Ecuadorians | 79.7 /100 | #153 | Good 5.5% |
Albanian Disability Age 5 to 17 Correlation Summary
| Measurement | Albanian Data | Disability Age 5 to 17 Data |
| Minimum | 0.043% | 1.1% |
| Maximum | 18.2% | 13.0% |
| Range | 18.1% | 11.9% |
| Mean | 3.7% | 5.4% |
| Median | 3.2% | 5.2% |
| Interquartile 25% (IQ1) | 1.6% | 4.2% |
| Interquartile 75% (IQ3) | 4.8% | 5.8% |
| Interquartile Range (IQR) | 3.2% | 1.6% |
| Standard Deviation (Sample) | 3.2% | 2.1% |
| Standard Deviation (Population) | 3.2% | 2.0% |
Correlation Details
| Albanian Percentile | Sample Size | Disability Age 5 to 17 |
[ 0.0% - 0.5% ] 0.043% | 135,890,478 | 5.7% |
[ 0.0% - 0.5% ] 0.21% | 17,942,148 | 5.5% |
[ 0.0% - 0.5% ] 0.40% | 20,092,711 | 5.6% |
[ 0.5% - 1.0% ] 0.53% | 5,030,293 | 5.2% |
[ 0.5% - 1.0% ] 0.68% | 3,387,400 | 5.9% |
[ 0.5% - 1.0% ] 0.84% | 1,686,346 | 4.8% |
[ 0.5% - 1.0% ] 1.00% | 1,331,741 | 5.6% |
[ 1.0% - 1.5% ] 1.14% | 1,328,904 | 6.0% |
[ 1.0% - 1.5% ] 1.30% | 1,010,592 | 4.6% |
[ 1.0% - 1.5% ] 1.44% | 584,472 | 5.7% |
[ 1.5% - 2.0% ] 1.60% | 448,802 | 5.4% |
[ 1.5% - 2.0% ] 1.75% | 727,470 | 5.8% |
[ 1.5% - 2.0% ] 1.95% | 406,951 | 5.4% |
[ 2.0% - 2.5% ] 2.08% | 204,417 | 3.3% |
[ 2.0% - 2.5% ] 2.18% | 496,877 | 4.9% |
[ 2.0% - 2.5% ] 2.36% | 274,402 | 5.3% |
[ 2.5% - 3.0% ] 2.53% | 435,274 | 6.9% |
[ 2.5% - 3.0% ] 2.69% | 150,546 | 3.6% |
[ 2.5% - 3.0% ] 2.80% | 198,768 | 3.7% |
[ 3.0% - 3.5% ] 3.01% | 134,940 | 5.1% |
[ 3.0% - 3.5% ] 3.17% | 80,392 | 8.2% |
[ 3.0% - 3.5% ] 3.27% | 48,898 | 6.4% |
[ 3.0% - 3.5% ] 3.45% | 99,883 | 4.7% |
[ 3.5% - 4.0% ] 3.59% | 96,803 | 4.8% |
[ 3.5% - 4.0% ] 3.71% | 80,916 | 5.8% |
[ 3.5% - 4.0% ] 3.93% | 72,972 | 4.2% |
[ 4.0% - 4.5% ] 4.03% | 8,966 | 7.3% |
[ 4.0% - 4.5% ] 4.13% | 7,948 | 8.1% |
[ 4.0% - 4.5% ] 4.34% | 13,777 | 4.9% |
[ 4.0% - 4.5% ] 4.43% | 32,438 | 5.2% |
[ 4.5% - 5.0% ] 4.63% | 5,209 | 5.0% |
[ 4.5% - 5.0% ] 4.80% | 2,937 | 3.3% |
[ 5.0% - 5.5% ] 5.47% | 2,415 | 3.2% |
[ 5.5% - 6.0% ] 5.63% | 1,350 | 1.1% |
[ 5.5% - 6.0% ] 5.72% | 41,328 | 8.7% |
[ 6.0% - 6.5% ] 6.17% | 3,304 | 2.5% |
[ 6.0% - 6.5% ] 6.32% | 3,700 | 2.8% |
[ 7.0% - 7.5% ] 7.28% | 2,336 | 4.6% |
[ 7.5% - 8.0% ] 7.59% | 369 | 9.7% |
[ 8.0% - 8.5% ] 8.19% | 891 | 13.0% |
[ 8.5% - 9.0% ] 8.82% | 6,653 | 3.5% |
[ 18.0% - 18.5% ] 18.16% | 936 | 4.2% |