Jordan Valley, OR Map & Demographics
Jordan Valley Map
Jordan Valley Overview
$25,031
PER CAPITA INCOME
$63,750
AVG FAMILY INCOME
$54,875
AVG HOUSEHOLD INCOME
0.27
INEQUALITY / GINI INDEX
164
TOTAL POPULATION
108
MALE POPULATION
56
FEMALE POPULATION
192.86
MALES / 100 FEMALES
51.85
FEMALES / 100 MALES
49.0
MEDIAN AGE
3.4
AVG FAMILY SIZE
2.8
AVG HOUSEHOLD SIZE
81
LABOR FORCE [ PEOPLE ]
50.9%
PERCENT IN LABOR FORCE
4.9%
UNEMPLOYMENT RATE
Jordan Valley Zip Codes
Jordan Valley Area Codes
Income in Jordan Valley
Income Overview in Jordan Valley
Per Capita Income in Jordan Valley is $25,031, while median incomes of families and households are $63,750 and $54,875 respectively.
| Characteristic | Number | Measure |
| Per Capita Income | 164 | $25,031 |
| Median Family Income | 40 | $63,750 |
| Mean Family Income | 40 | $58,475 |
| Median Household Income | 57 | $54,875 |
| Mean Household Income | 57 | $59,082 |
| Income Deficit | 40 | $0 |
| Wage / Income Gap (%) | 164 | 0.00% |
| Wage / Income Gap ($) | 164 | 100.00¢ per $1 |
| Gini / Inequality Index | 164 | 0.27 |
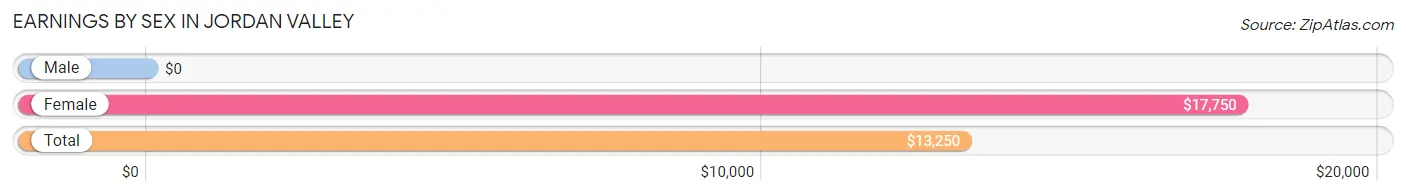
Earnings by Sex in Jordan Valley
| Sex | Number | Average Earnings |
| Male | 87 (70.2%) | $0 |
| Female | 37 (29.8%) | $17,750 |
| Total | 124 (100.0%) | $13,250 |
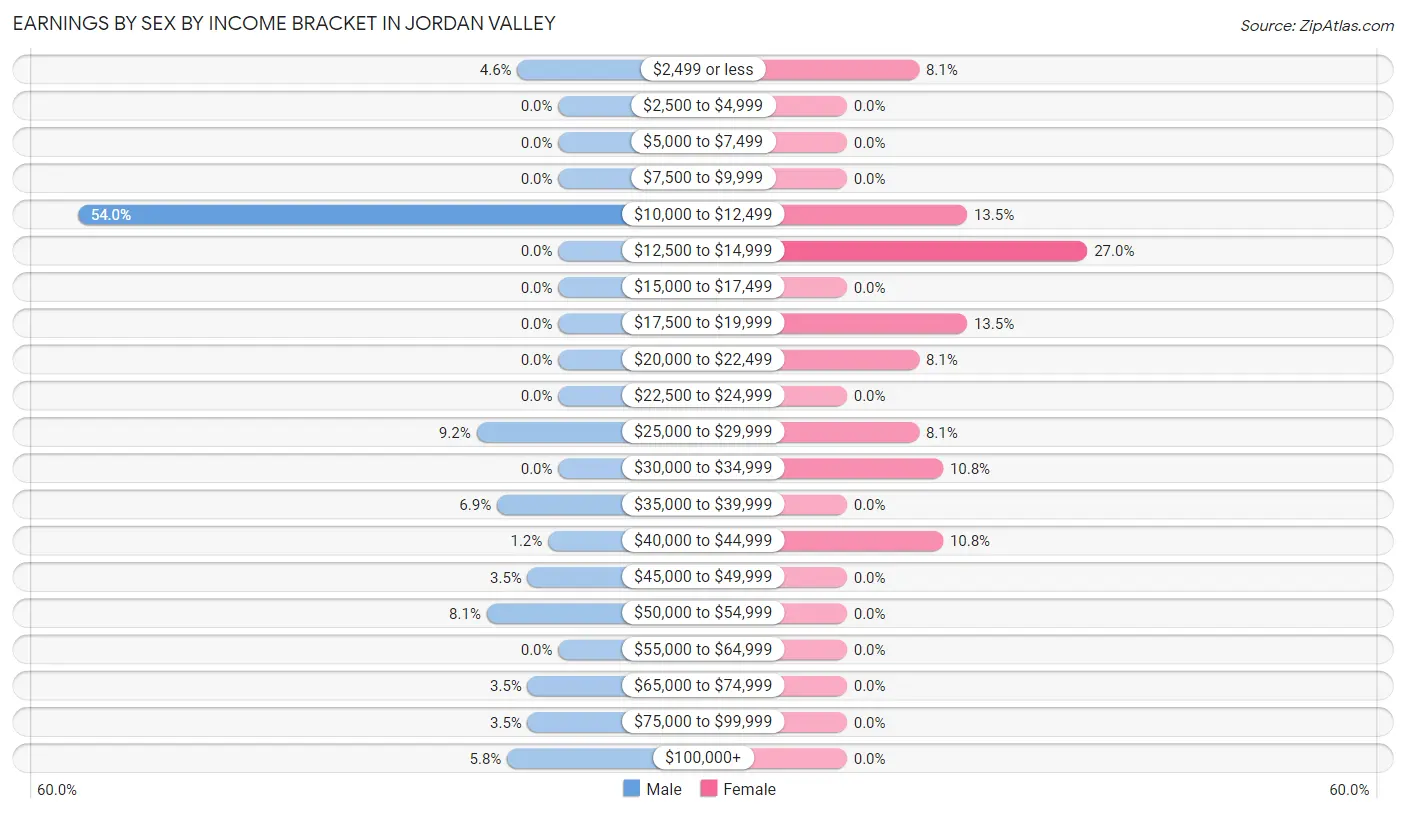
Earnings by Sex by Income Bracket in Jordan Valley
The most common earnings brackets in Jordan Valley are $10,000 to $12,499 for men (47 | 54.0%) and $12,500 to $14,999 for women (10 | 27.0%).
| Income | Male | Female |
| $2,499 or less | 4 (4.6%) | 3 (8.1%) |
| $2,500 to $4,999 | 0 (0.0%) | 0 (0.0%) |
| $5,000 to $7,499 | 0 (0.0%) | 0 (0.0%) |
| $7,500 to $9,999 | 0 (0.0%) | 0 (0.0%) |
| $10,000 to $12,499 | 47 (54.0%) | 5 (13.5%) |
| $12,500 to $14,999 | 0 (0.0%) | 10 (27.0%) |
| $15,000 to $17,499 | 0 (0.0%) | 0 (0.0%) |
| $17,500 to $19,999 | 0 (0.0%) | 5 (13.5%) |
| $20,000 to $22,499 | 0 (0.0%) | 3 (8.1%) |
| $22,500 to $24,999 | 0 (0.0%) | 0 (0.0%) |
| $25,000 to $29,999 | 8 (9.2%) | 3 (8.1%) |
| $30,000 to $34,999 | 0 (0.0%) | 4 (10.8%) |
| $35,000 to $39,999 | 6 (6.9%) | 0 (0.0%) |
| $40,000 to $44,999 | 1 (1.1%) | 4 (10.8%) |
| $45,000 to $49,999 | 3 (3.5%) | 0 (0.0%) |
| $50,000 to $54,999 | 7 (8.1%) | 0 (0.0%) |
| $55,000 to $64,999 | 0 (0.0%) | 0 (0.0%) |
| $65,000 to $74,999 | 3 (3.5%) | 0 (0.0%) |
| $75,000 to $99,999 | 3 (3.5%) | 0 (0.0%) |
| $100,000+ | 5 (5.8%) | 0 (0.0%) |
| Total | 87 (100.0%) | 37 (100.0%) |
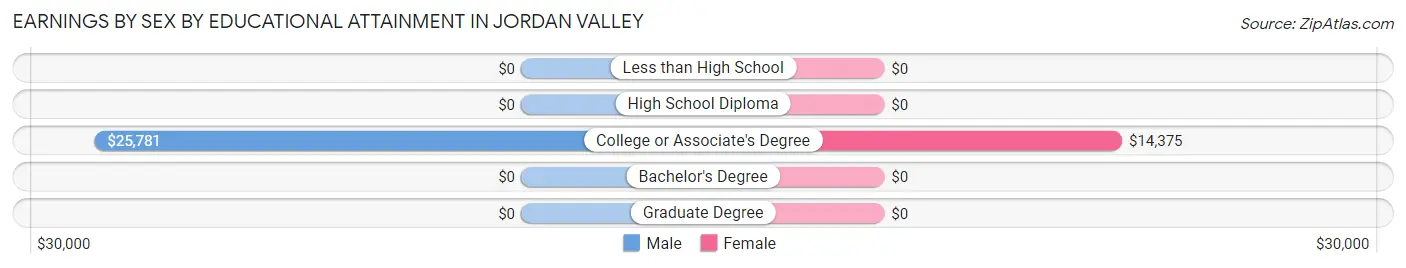
Earnings by Sex by Educational Attainment in Jordan Valley
| Educational Attainment | Male Income | Female Income |
| Less than High School | - | - |
| High School Diploma | - | - |
| College or Associate's Degree | $25,781 | $14,375 |
| Bachelor's Degree | - | - |
| Graduate Degree | - | - |
| Total | - | - |
Family Income in Jordan Valley
Family Income Brackets in Jordan Valley
According to the Jordan Valley family income data, there are 24 families falling into the $50,000 to $74,999 income range, which is the most common income bracket and makes up 60.0% of all families.
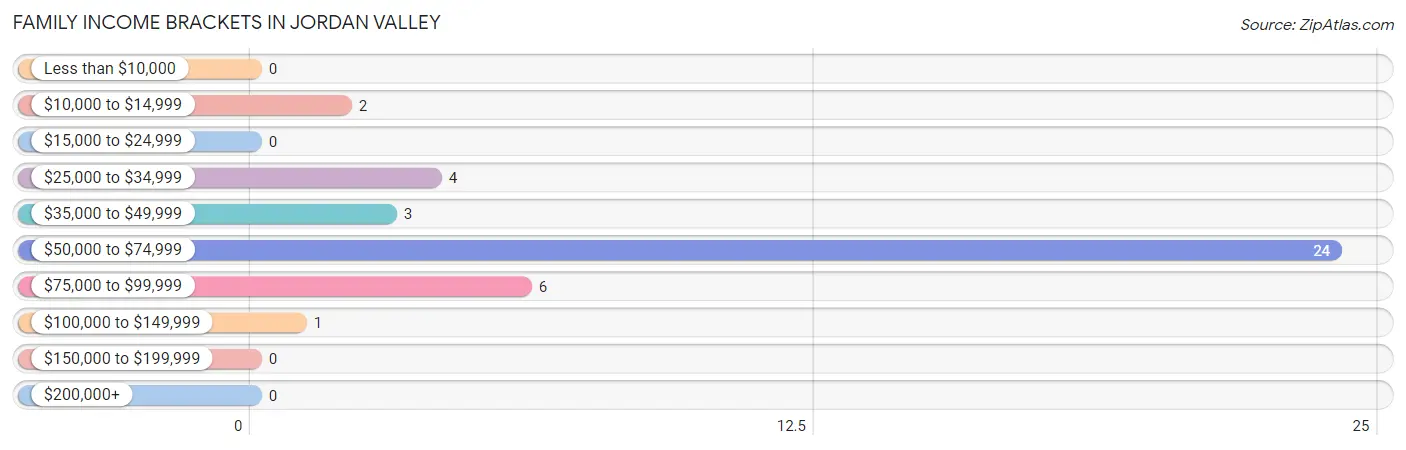
| Income Bracket | # Families | % Families |
| Less than $10,000 | 0 | 0.0% |
| $10,000 to $14,999 | 2 | 5.0% |
| $15,000 to $24,999 | 0 | 0.0% |
| $25,000 to $34,999 | 4 | 10.0% |
| $35,000 to $49,999 | 3 | 7.5% |
| $50,000 to $74,999 | 24 | 60.0% |
| $75,000 to $99,999 | 6 | 15.0% |
| $100,000 to $149,999 | 1 | 2.5% |
| $150,000 to $199,999 | 0 | 0.0% |
| $200,000+ | 0 | 0.0% |
Family Income by Famaliy Size in Jordan Valley
2-person families (27 | 67.5%) account for the highest median family income in Jordan Valley with $53,958 per family, while 2-person families (27 | 67.5%) have the highest median income of $26,979 per family member.
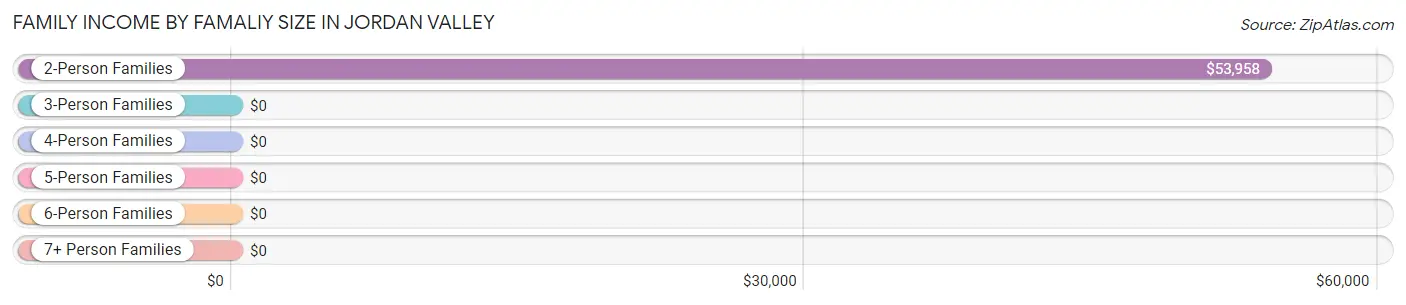
| Income Bracket | # Families | Median Income |
| 2-Person Families | 27 (67.5%) | $53,958 |
| 3-Person Families | 8 (20.0%) | $0 |
| 4-Person Families | 5 (12.5%) | $0 |
| 5-Person Families | 0 (0.0%) | $0 |
| 6-Person Families | 0 (0.0%) | $0 |
| 7+ Person Families | 0 (0.0%) | $0 |
| Total | 40 (100.0%) | $63,750 |
Family Income by Number of Earners in Jordan Valley
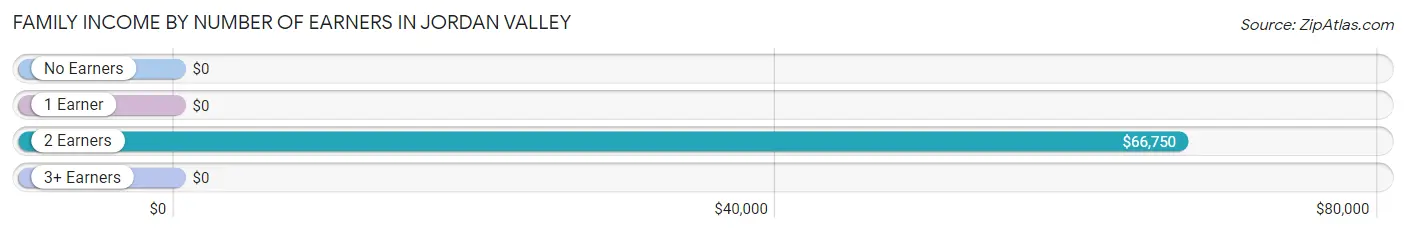
| Number of Earners | # Families | Median Income |
| No Earners | 0 (0.0%) | $0 |
| 1 Earner | 7 (17.5%) | $0 |
| 2 Earners | 33 (82.5%) | $66,750 |
| 3+ Earners | 0 (0.0%) | $0 |
| Total | 40 (100.0%) | $63,750 |
Household Income in Jordan Valley
Household Income Brackets in Jordan Valley
With 28 households falling in the category, the $50,000 to $74,999 income range is the most frequent in Jordan Valley, accounting for 49.1% of all households.
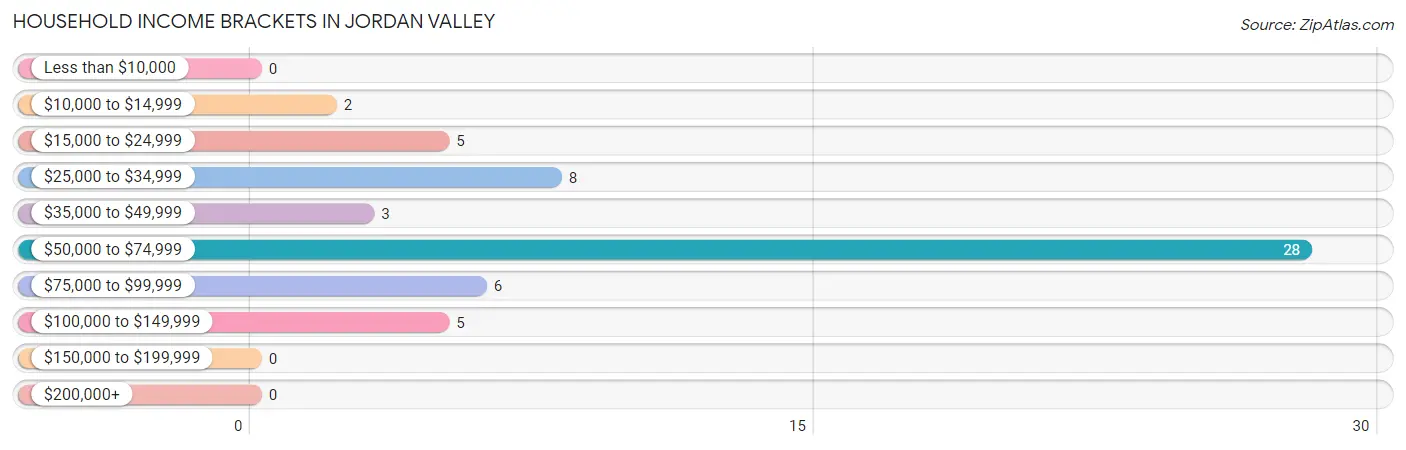
| Income Bracket | # Households | % Households |
| Less than $10,000 | 0 | 0.0% |
| $10,000 to $14,999 | 2 | 3.5% |
| $15,000 to $24,999 | 5 | 8.8% |
| $25,000 to $34,999 | 8 | 14.0% |
| $35,000 to $49,999 | 3 | 5.3% |
| $50,000 to $74,999 | 28 | 49.1% |
| $75,000 to $99,999 | 6 | 10.5% |
| $100,000 to $149,999 | 5 | 8.8% |
| $150,000 to $199,999 | 0 | 0.0% |
| $200,000+ | 0 | 0.0% |
Household Income by Householder Age in Jordan Valley
The median household income in Jordan Valley is $54,875, with the highest median household income of $66,500 found in the 45 to 64 years age bracket for the primary householder. A total of 26 households (45.6%) fall into this category.
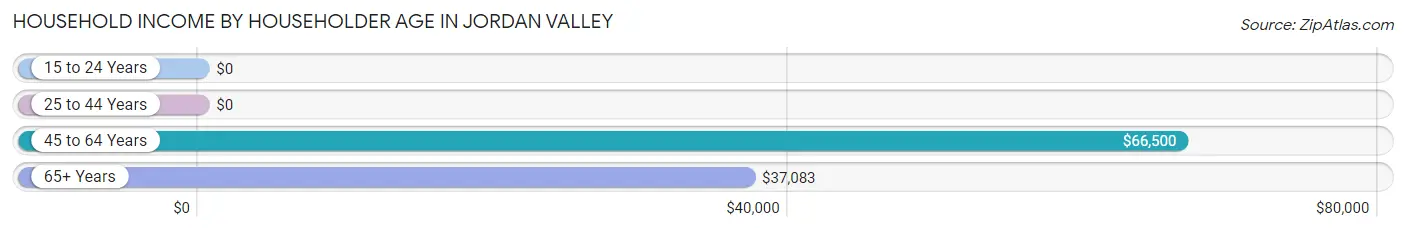
| Income Bracket | # Households | Median Income |
| 15 to 24 Years | 0 (0.0%) | $0 |
| 25 to 44 Years | 4 (7.0%) | $0 |
| 45 to 64 Years | 26 (45.6%) | $66,500 |
| 65+ Years | 27 (47.4%) | $37,083 |
| Total | 57 (100.0%) | $54,875 |
Poverty in Jordan Valley
Income Below Poverty by Sex and Age in Jordan Valley
With 7.4% poverty level for males and 3.6% for females among the residents of Jordan Valley, 6 to 11 year old males and 65 to 74 year old females are the most vulnerable to poverty, with 1 males (100.0%) and 2 females (20.0%) in their respective age groups living below the poverty level.
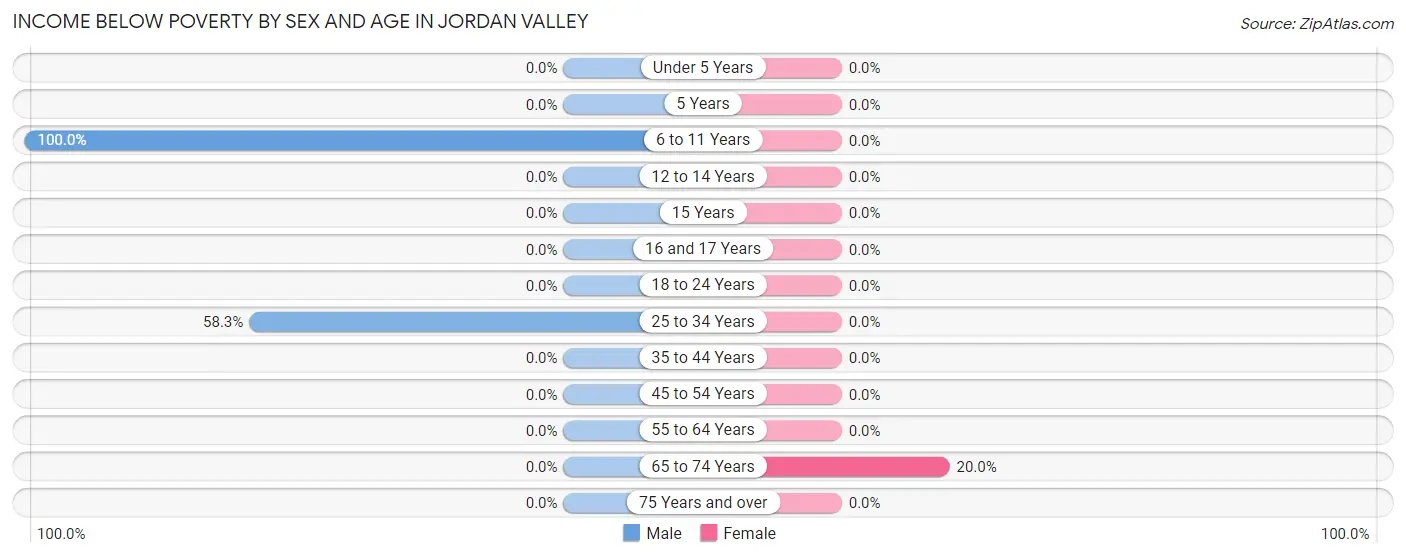
| Age Bracket | Male | Female |
| Under 5 Years | 0 (0.0%) | 0 (0.0%) |
| 5 Years | 0 (0.0%) | 0 (0.0%) |
| 6 to 11 Years | 1 (100.0%) | 0 (0.0%) |
| 12 to 14 Years | 0 (0.0%) | 0 (0.0%) |
| 15 Years | 0 (0.0%) | 0 (0.0%) |
| 16 and 17 Years | 0 (0.0%) | 0 (0.0%) |
| 18 to 24 Years | 0 (0.0%) | 0 (0.0%) |
| 25 to 34 Years | 7 (58.3%) | 0 (0.0%) |
| 35 to 44 Years | 0 (0.0%) | 0 (0.0%) |
| 45 to 54 Years | 0 (0.0%) | 0 (0.0%) |
| 55 to 64 Years | 0 (0.0%) | 0 (0.0%) |
| 65 to 74 Years | 0 (0.0%) | 2 (20.0%) |
| 75 Years and over | 0 (0.0%) | 0 (0.0%) |
| Total | 8 (7.4%) | 2 (3.6%) |
Income Above Poverty by Sex and Age in Jordan Valley
According to the poverty statistics in Jordan Valley, males aged 16 and 17 years and females aged 12 to 14 years are the age groups that are most secure financially, with 100.0% of males and 100.0% of females in these age groups living above the poverty line.
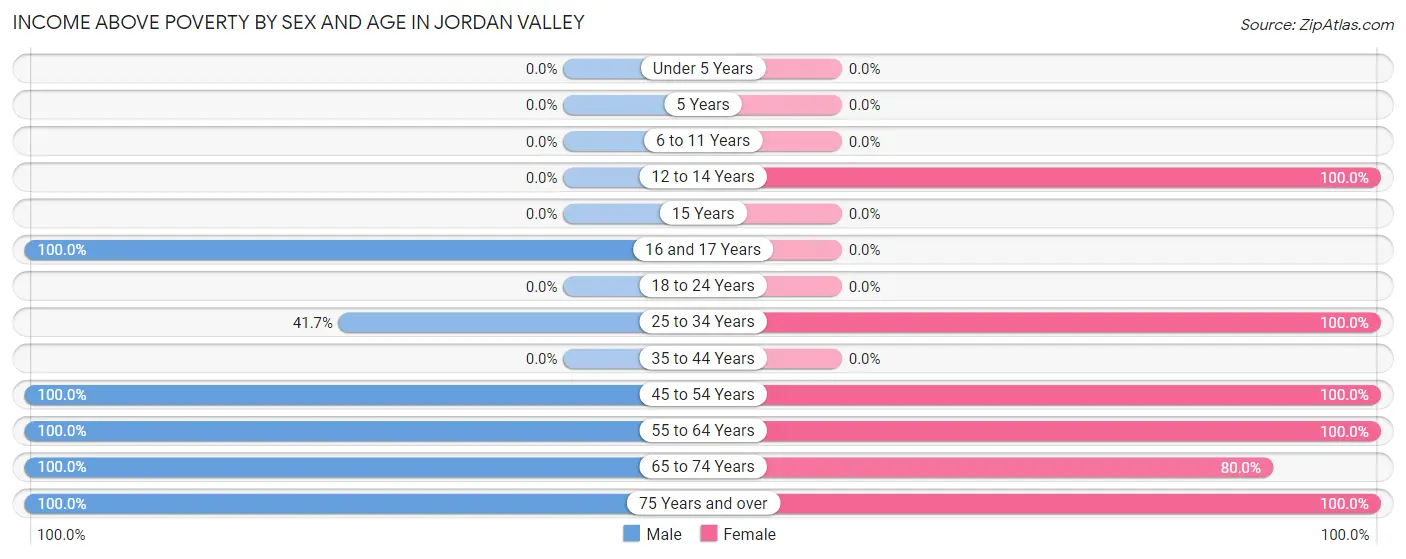
| Age Bracket | Male | Female |
| Under 5 Years | 0 (0.0%) | 0 (0.0%) |
| 5 Years | 0 (0.0%) | 0 (0.0%) |
| 6 to 11 Years | 0 (0.0%) | 0 (0.0%) |
| 12 to 14 Years | 0 (0.0%) | 4 (100.0%) |
| 15 Years | 0 (0.0%) | 0 (0.0%) |
| 16 and 17 Years | 4 (100.0%) | 0 (0.0%) |
| 18 to 24 Years | 0 (0.0%) | 0 (0.0%) |
| 25 to 34 Years | 5 (41.7%) | 4 (100.0%) |
| 35 to 44 Years | 0 (0.0%) | 0 (0.0%) |
| 45 to 54 Years | 63 (100.0%) | 14 (100.0%) |
| 55 to 64 Years | 14 (100.0%) | 16 (100.0%) |
| 65 to 74 Years | 3 (100.0%) | 8 (80.0%) |
| 75 Years and over | 11 (100.0%) | 8 (100.0%) |
| Total | 100 (92.6%) | 54 (96.4%) |
Income Below Poverty Among Married-Couple Families in Jordan Valley
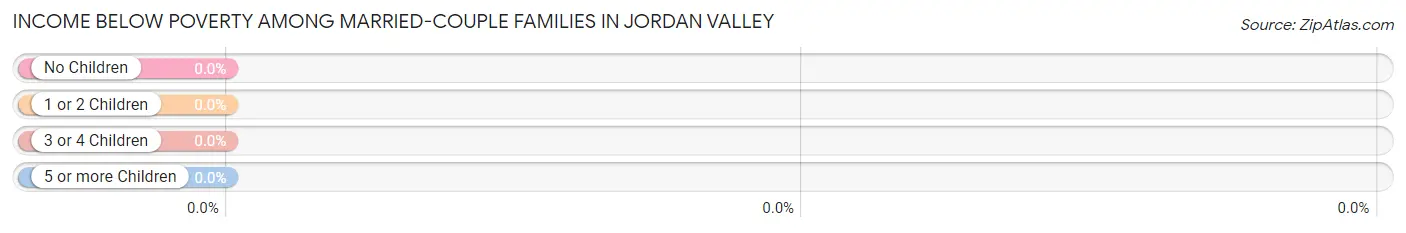
| Children | Above Poverty | Below Poverty |
| No Children | 28 (100.0%) | 0 (0.0%) |
| 1 or 2 Children | 5 (100.0%) | 0 (0.0%) |
| 3 or 4 Children | 0 (0.0%) | 0 (0.0%) |
| 5 or more Children | 0 (0.0%) | 0 (0.0%) |
| Total | 33 (100.0%) | 0 (0.0%) |
Income Below Poverty Among Single-Parent Households in Jordan Valley
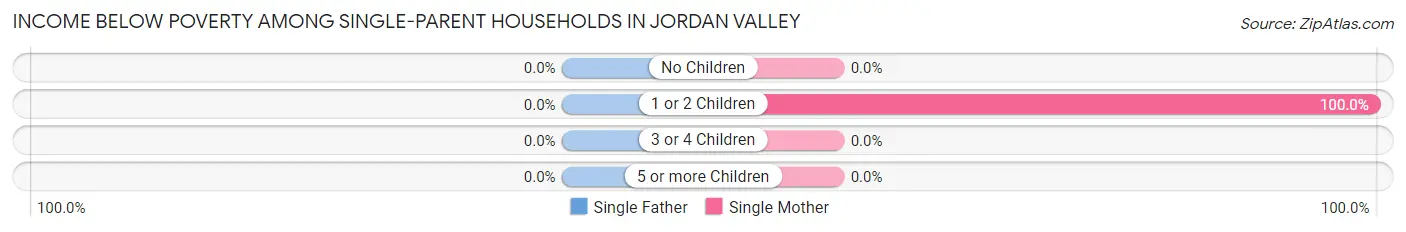
| Children | Single Father | Single Mother |
| No Children | 0 (0.0%) | 0 (0.0%) |
| 1 or 2 Children | 0 (0.0%) | 2 (100.0%) |
| 3 or 4 Children | 0 (0.0%) | 0 (0.0%) |
| 5 or more Children | 0 (0.0%) | 0 (0.0%) |
| Total | 0 (0.0%) | 2 (33.3%) |
Income Below Poverty Among Married-Couple vs Single-Parent Households in Jordan Valley
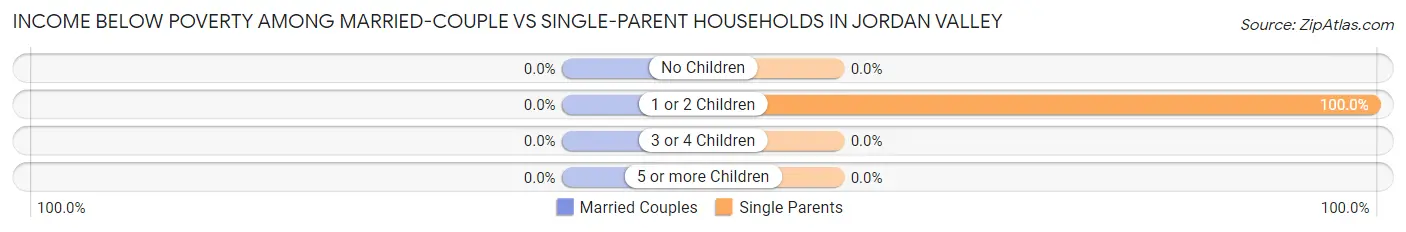
| Children | Married-Couple Families | Single-Parent Households |
| No Children | 0 (0.0%) | 0 (0.0%) |
| 1 or 2 Children | 0 (0.0%) | 2 (100.0%) |
| 3 or 4 Children | 0 (0.0%) | 0 (0.0%) |
| 5 or more Children | 0 (0.0%) | 0 (0.0%) |
| Total | 0 (0.0%) | 2 (28.6%) |
Race in Jordan Valley
The most populous races in Jordan Valley are White / Caucasian (160 | 97.6%), Hispanic or Latino (4 | 2.4%), and Two or more Races (4 | 2.4%).
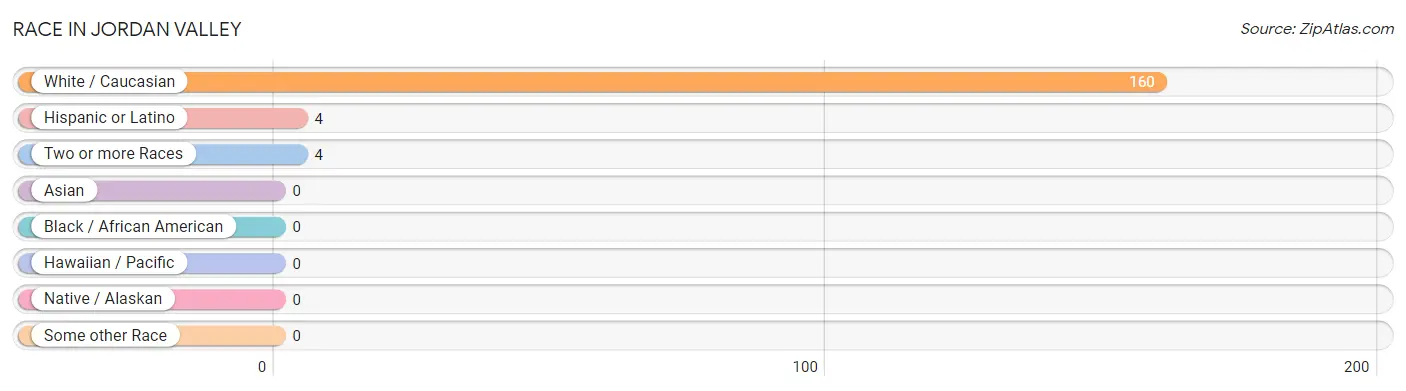
| Race | # Population | % Population |
| Asian | 0 | 0.0% |
| Black / African American | 0 | 0.0% |
| Hawaiian / Pacific | 0 | 0.0% |
| Hispanic or Latino | 4 | 2.4% |
| Native / Alaskan | 0 | 0.0% |
| White / Caucasian | 160 | 97.6% |
| Two or more Races | 4 | 2.4% |
| Some other Race | 0 | 0.0% |
| Total | 164 | 100.0% |
Ancestry in Jordan Valley
The most populous ancestries reported in Jordan Valley are German (18 | 11.0%), Irish (11 | 6.7%), Norwegian (7 | 4.3%), Basque (5 | 3.0%), and Dutch (4 | 2.4%), together accounting for 27.4% of all Jordan Valley residents.
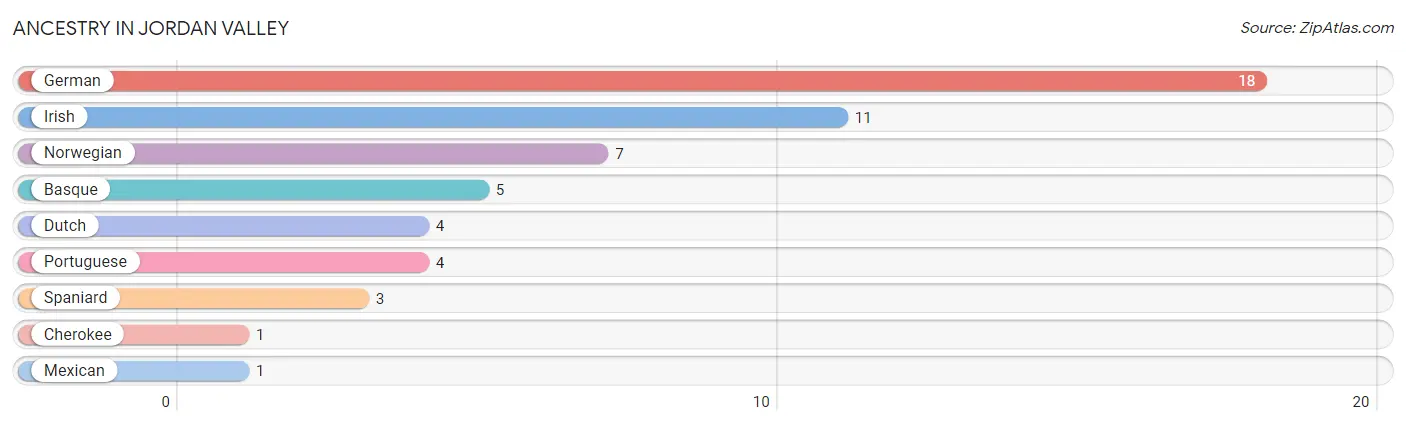
| Ancestry | # Population | % Population |
| Basque | 5 | 3.0% |
| Cherokee | 1 | 0.6% |
| Dutch | 4 | 2.4% |
| German | 18 | 11.0% |
| Irish | 11 | 6.7% |
| Mexican | 1 | 0.6% |
| Norwegian | 7 | 4.3% |
| Portuguese | 4 | 2.4% |
| Spaniard | 3 | 1.8% | View All 9 Rows |
Immigrants in Jordan Valley

| Immigration Origin | # Population | % Population | View All 0 Rows |
Sex and Age in Jordan Valley
Sex and Age in Jordan Valley
The most populous age groups in Jordan Valley are 45 to 49 Years (44 | 40.7%) for men and 45 to 49 Years (14 | 25.0%) for women.
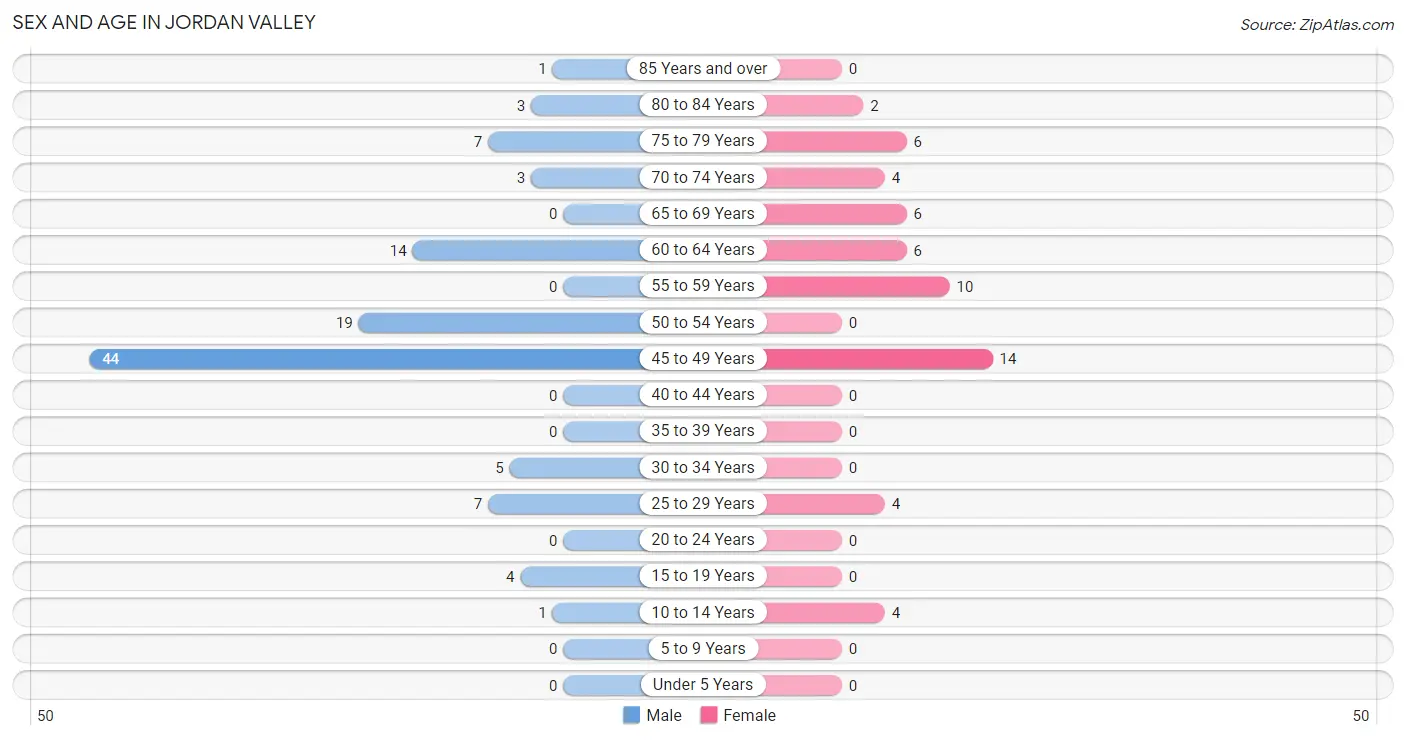
| Age Bracket | Male | Female |
| Under 5 Years | 0 (0.0%) | 0 (0.0%) |
| 5 to 9 Years | 0 (0.0%) | 0 (0.0%) |
| 10 to 14 Years | 1 (0.9%) | 4 (7.1%) |
| 15 to 19 Years | 4 (3.7%) | 0 (0.0%) |
| 20 to 24 Years | 0 (0.0%) | 0 (0.0%) |
| 25 to 29 Years | 7 (6.5%) | 4 (7.1%) |
| 30 to 34 Years | 5 (4.6%) | 0 (0.0%) |
| 35 to 39 Years | 0 (0.0%) | 0 (0.0%) |
| 40 to 44 Years | 0 (0.0%) | 0 (0.0%) |
| 45 to 49 Years | 44 (40.7%) | 14 (25.0%) |
| 50 to 54 Years | 19 (17.6%) | 0 (0.0%) |
| 55 to 59 Years | 0 (0.0%) | 10 (17.9%) |
| 60 to 64 Years | 14 (13.0%) | 6 (10.7%) |
| 65 to 69 Years | 0 (0.0%) | 6 (10.7%) |
| 70 to 74 Years | 3 (2.8%) | 4 (7.1%) |
| 75 to 79 Years | 7 (6.5%) | 6 (10.7%) |
| 80 to 84 Years | 3 (2.8%) | 2 (3.6%) |
| 85 Years and over | 1 (0.9%) | 0 (0.0%) |
| Total | 108 (100.0%) | 56 (100.0%) |
Families and Households in Jordan Valley
Median Family Size in Jordan Valley
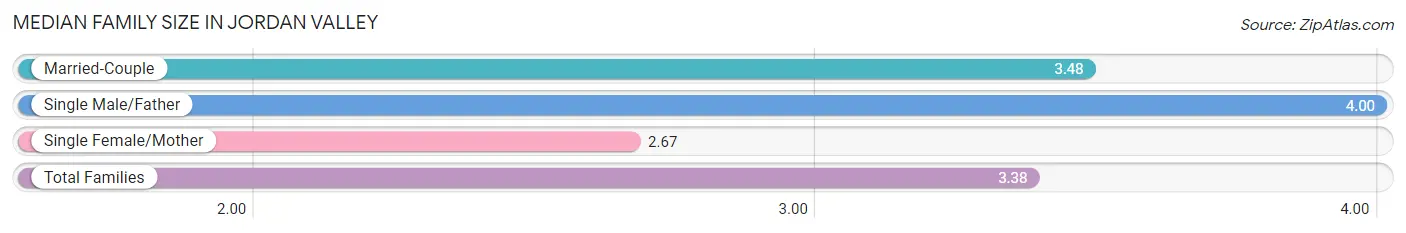
The median family size in Jordan Valley is 3.38 persons per family, with single male/father families (1 | 2.5%) accounting for the largest median family size of 4 persons per family. On the other hand, single female/mother families (6 | 15.0%) represent the smallest median family size with 2.67 persons per family.
| Family Type | # Families | Family Size |
| Married-Couple | 33 (82.5%) | 3.48 |
| Single Male/Father | 1 (2.5%) | 4.00 |
| Single Female/Mother | 6 (15.0%) | 2.67 |
| Total Families | 40 (100.0%) | 3.38 |
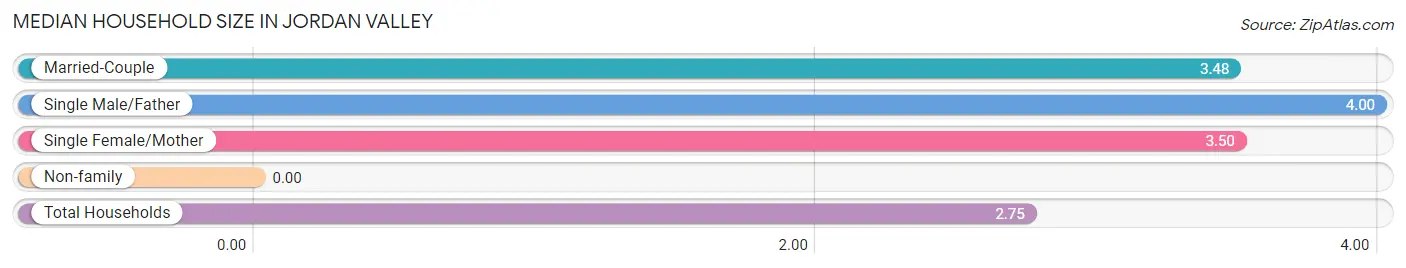
Median Household Size in Jordan Valley
| Household Type | # Households | Household Size |
| Married-Couple | 33 (57.9%) | 3.48 |
| Single Male/Father | 1 (1.8%) | 4.00 |
| Single Female/Mother | 6 (10.5%) | 3.50 |
| Non-family | 17 (29.8%) | - |
| Total Households | 57 (100.0%) | 2.75 |
Household Size by Marriage Status in Jordan Valley
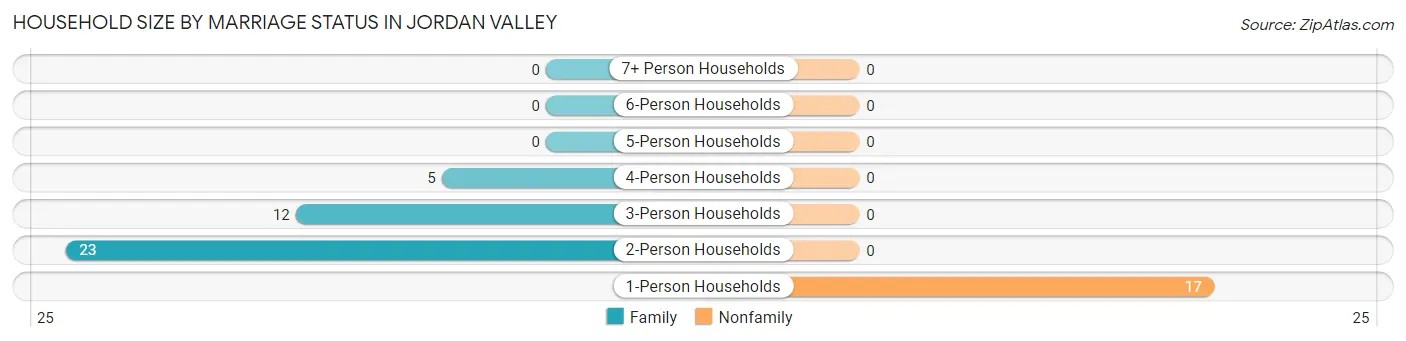
Out of a total of 57 households in Jordan Valley, 40 (70.2%) are family households, while 17 (29.8%) are nonfamily households. The most numerous type of family households are 2-person households, comprising 23, and the most common type of nonfamily households are 1-person households, comprising 17.
| Household Size | Family Households | Nonfamily Households |
| 1-Person Households | - | 17 (29.8%) |
| 2-Person Households | 23 (40.4%) | 0 (0.0%) |
| 3-Person Households | 12 (21.0%) | 0 (0.0%) |
| 4-Person Households | 5 (8.8%) | 0 (0.0%) |
| 5-Person Households | 0 (0.0%) | 0 (0.0%) |
| 6-Person Households | 0 (0.0%) | 0 (0.0%) |
| 7+ Person Households | 0 (0.0%) | 0 (0.0%) |
| Total | 40 (70.2%) | 17 (29.8%) |
Female Fertility in Jordan Valley
Fertility by Age in Jordan Valley
| Age Bracket | Women with Births | Births / 1,000 Women |
| 15 to 19 years | 0 (0.0%) | 0.0 |
| 20 to 34 years | 0 (0.0%) | 0.0 |
| 35 to 50 years | 0 (0.0%) | 0.0 |
| Total | 0 (0.0%) | 0.0 |
Fertility by Age by Marriage Status in Jordan Valley
| Age Bracket | Married | Unmarried |
| 15 to 19 years | 0 (0.0%) | 0 (0.0%) |
| 20 to 34 years | 0 (0.0%) | 0 (0.0%) |
| 35 to 50 years | 0 (0.0%) | 0 (0.0%) |
| Total | 0 (0.0%) | 0 (0.0%) |
Fertility by Education in Jordan Valley
| Educational Attainment | Women with Births | Births / 1,000 Women |
| Less than High School | 0 (0.0%) | 0.0 |
| High School Diploma | 0 (0.0%) | 0.0 |
| College or Associate's Degree | 0 (0.0%) | 0.0 |
| Bachelor's Degree | 0 (0.0%) | 0.0 |
| Graduate Degree | 0 (0.0%) | 0.0 |
| Total | 0 (0.0%) | 0.0 |
Fertility by Education by Marriage Status in Jordan Valley
| Educational Attainment | Married | Unmarried |
| Less than High School | 0 (0.0%) | 0 (0.0%) |
| High School Diploma | 0 (0.0%) | 0 (0.0%) |
| College or Associate's Degree | 0 (0.0%) | 0 (0.0%) |
| Bachelor's Degree | 0 (0.0%) | 0 (0.0%) |
| Graduate Degree | 0 (0.0%) | 0 (0.0%) |
| Total | 0 (0.0%) | 0 (0.0%) |
Employment Characteristics in Jordan Valley
Employment by Class of Employer in Jordan Valley
Among the 77 employed individuals in Jordan Valley, private company employees (61 | 79.2%), local government employees (9 | 11.7%), and state government employees (4 | 5.2%) make up the most common classes of employment.
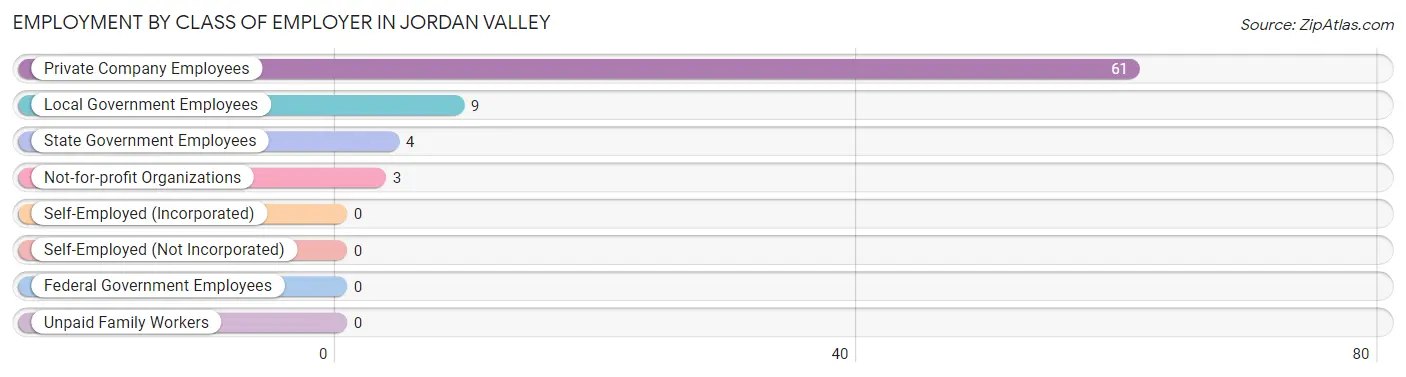
| Employer Class | # Employees | % Employees |
| Private Company Employees | 61 | 79.2% |
| Self-Employed (Incorporated) | 0 | 0.0% |
| Self-Employed (Not Incorporated) | 0 | 0.0% |
| Not-for-profit Organizations | 3 | 3.9% |
| Local Government Employees | 9 | 11.7% |
| State Government Employees | 4 | 5.2% |
| Federal Government Employees | 0 | 0.0% |
| Unpaid Family Workers | 0 | 0.0% |
| Total | 77 | 100.0% |
Employment Status by Age in Jordan Valley
According to the labor force statistics for Jordan Valley, out of the total population over 16 years of age (159), 50.9% or 81 individuals are in the labor force, with 4.9% or 4 of them unemployed. The age group with the highest labor force participation rate is 16 to 19 years, with 100.0% or 4 individuals in the labor force. Within the labor force, the 16 to 19 years age range has the highest percentage of unemployed individuals, with 100.0% or 4 of them being unemployed.
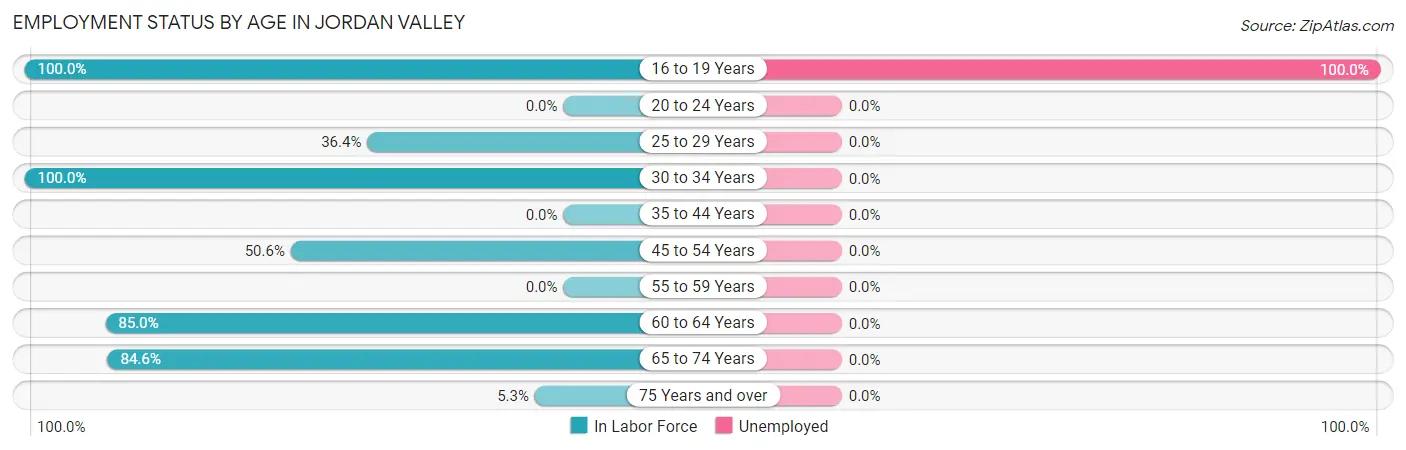
| Age Bracket | In Labor Force | Unemployed |
| 16 to 19 Years | 4 (100.0%) | 4 (100.0%) |
| 20 to 24 Years | 0 (0.0%) | 0 (0.0%) |
| 25 to 29 Years | 4 (36.4%) | 0 (0.0%) |
| 30 to 34 Years | 5 (100.0%) | 0 (0.0%) |
| 35 to 44 Years | 0 (0.0%) | 0 (0.0%) |
| 45 to 54 Years | 39 (50.6%) | 0 (0.0%) |
| 55 to 59 Years | 0 (0.0%) | 0 (0.0%) |
| 60 to 64 Years | 17 (85.0%) | 0 (0.0%) |
| 65 to 74 Years | 11 (84.6%) | 0 (0.0%) |
| 75 Years and over | 1 (5.3%) | 0 (0.0%) |
| Total | 81 (50.9%) | 4 (4.9%) |
Employment Status by Educational Attainment in Jordan Valley
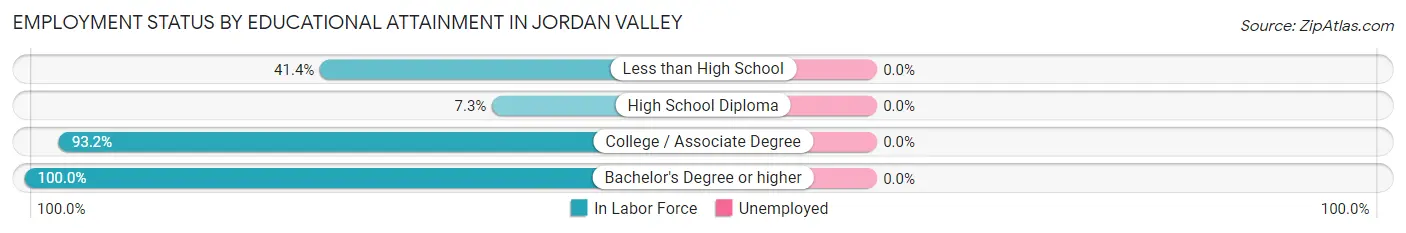
| Educational Attainment | In Labor Force | Unemployed |
| Less than High School | 12 (41.4%) | 0 (0.0%) |
| High School Diploma | 3 (7.3%) | 0 (0.0%) |
| College / Associate Degree | 41 (93.2%) | 0 (0.0%) |
| Bachelor's Degree or higher | 9 (100.0%) | 0 (0.0%) |
| Total | 65 (52.8%) | 0 (0.0%) |
Employment Occupations by Sex in Jordan Valley
Management, Business, Science and Arts Occupations
The most common Management, Business, Science and Arts occupations in Jordan Valley are Management (11 | 14.3%), Community & Social Service (8 | 10.4%), Education Instruction & Library (8 | 10.4%), Computers, Engineering & Science (4 | 5.2%), and Life, Physical & Social Science (4 | 5.2%).
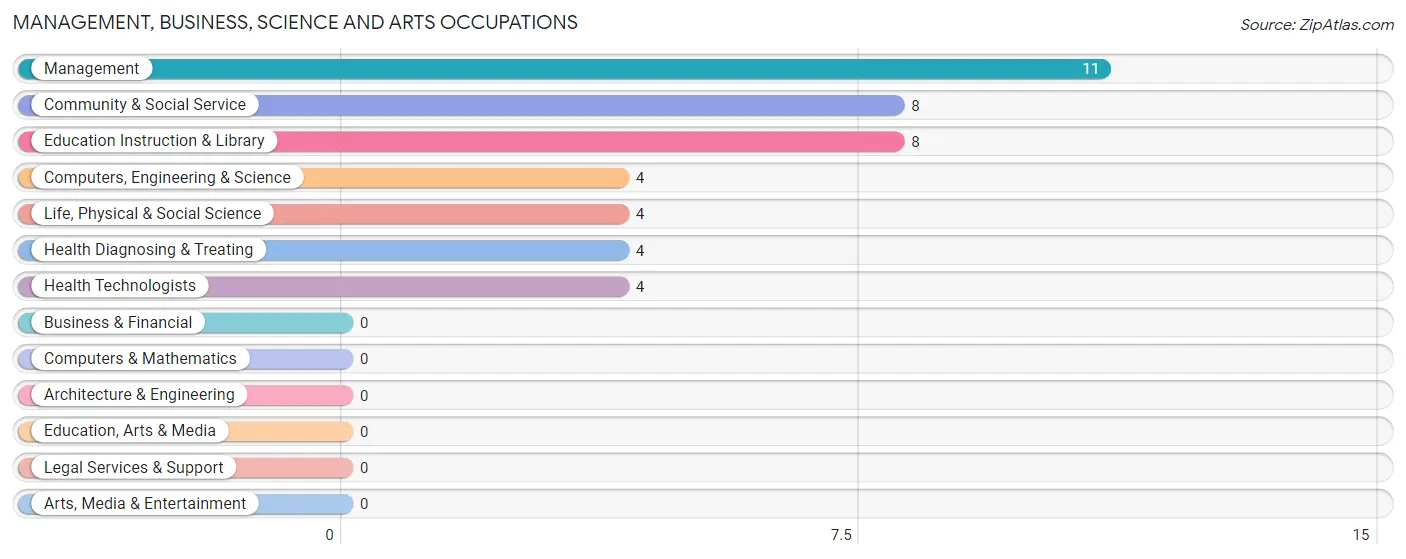
Management, Business, Science and Arts Occupations by Sex
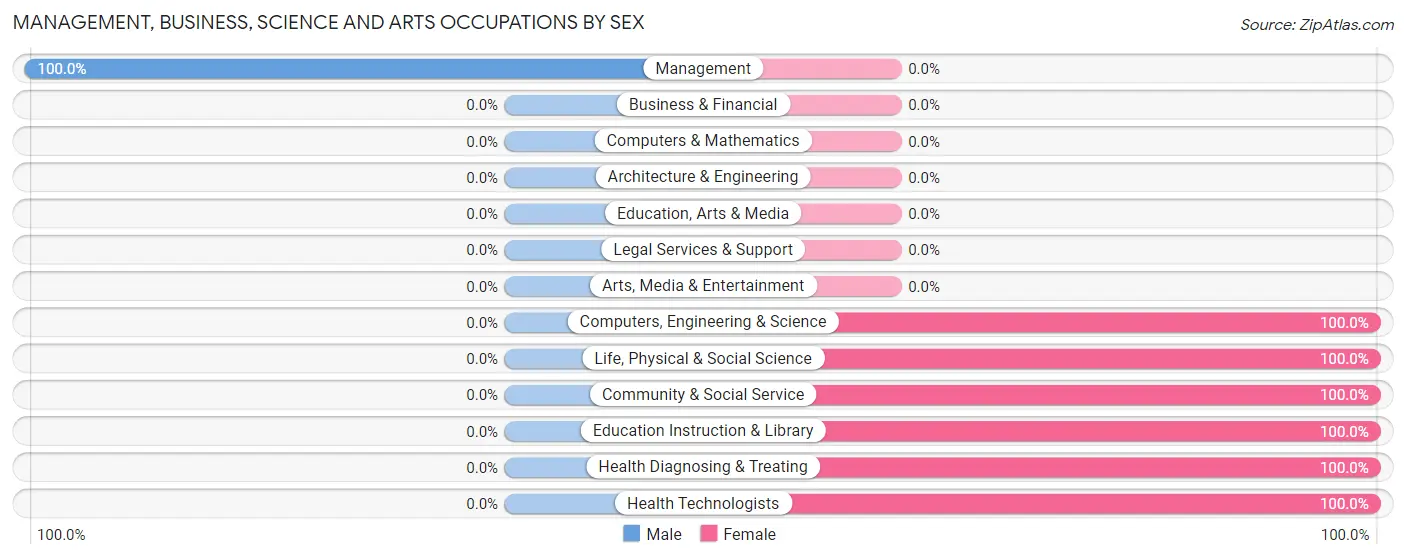
| Occupation | Male | Female |
| Management | 11 (100.0%) | 0 (0.0%) |
| Business & Financial | 0 (0.0%) | 0 (0.0%) |
| Computers, Engineering & Science | 0 (0.0%) | 4 (100.0%) |
| Computers & Mathematics | 0 (0.0%) | 0 (0.0%) |
| Architecture & Engineering | 0 (0.0%) | 0 (0.0%) |
| Life, Physical & Social Science | 0 (0.0%) | 4 (100.0%) |
| Community & Social Service | 0 (0.0%) | 8 (100.0%) |
| Education, Arts & Media | 0 (0.0%) | 0 (0.0%) |
| Legal Services & Support | 0 (0.0%) | 0 (0.0%) |
| Education Instruction & Library | 0 (0.0%) | 8 (100.0%) |
| Arts, Media & Entertainment | 0 (0.0%) | 0 (0.0%) |
| Health Diagnosing & Treating | 0 (0.0%) | 4 (100.0%) |
| Health Technologists | 0 (0.0%) | 4 (100.0%) |
| Total (Category) | 11 (40.7%) | 16 (59.3%) |
| Total (Overall) | 45 (58.4%) | 32 (41.6%) |
Services Occupations
The most common Services occupations in Jordan Valley are , and Cleaning & Maintenance (5 | 6.5%).
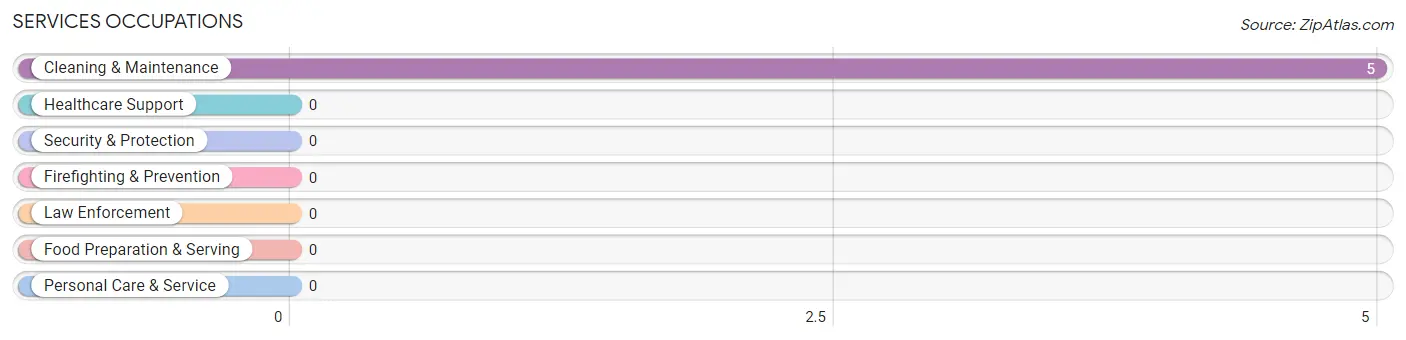
Services Occupations by Sex
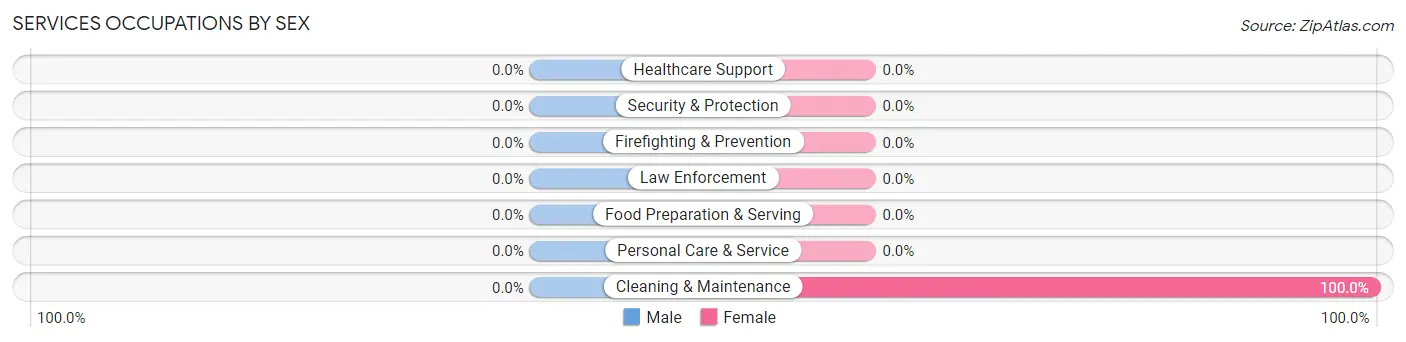
| Occupation | Male | Female |
| Healthcare Support | 0 (0.0%) | 0 (0.0%) |
| Security & Protection | 0 (0.0%) | 0 (0.0%) |
| Firefighting & Prevention | 0 (0.0%) | 0 (0.0%) |
| Law Enforcement | 0 (0.0%) | 0 (0.0%) |
| Food Preparation & Serving | 0 (0.0%) | 0 (0.0%) |
| Cleaning & Maintenance | 0 (0.0%) | 5 (100.0%) |
| Personal Care & Service | 0 (0.0%) | 0 (0.0%) |
| Total (Category) | 0 (0.0%) | 5 (100.0%) |
| Total (Overall) | 45 (58.4%) | 32 (41.6%) |
Sales and Office Occupations
The most common Sales and Office occupations in Jordan Valley are , and Office & Administration (11 | 14.3%).
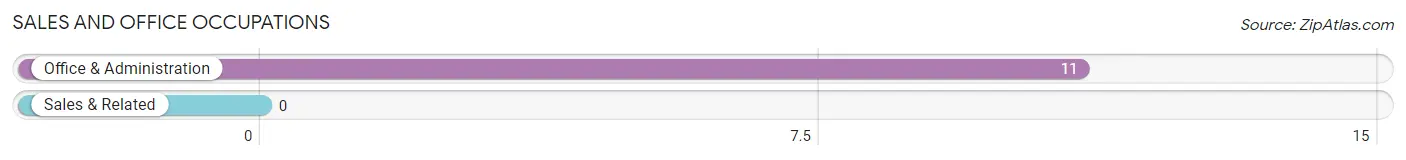
Sales and Office Occupations by Sex
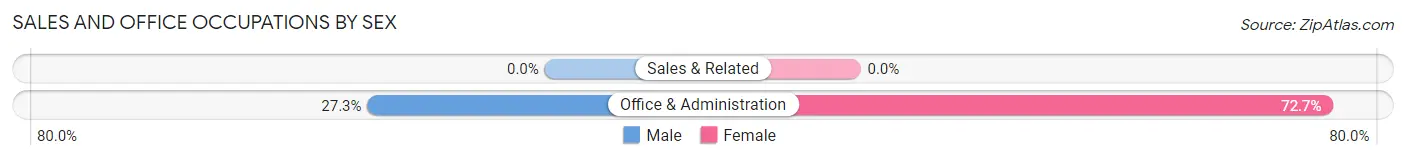
| Occupation | Male | Female |
| Sales & Related | 0 (0.0%) | 0 (0.0%) |
| Office & Administration | 3 (27.3%) | 8 (72.7%) |
| Total (Category) | 3 (27.3%) | 8 (72.7%) |
| Total (Overall) | 45 (58.4%) | 32 (41.6%) |
Natural Resources, Construction and Maintenance Occupations
The most common Natural Resources, Construction and Maintenance occupations in Jordan Valley are , and Construction & Extraction (9 | 11.7%).
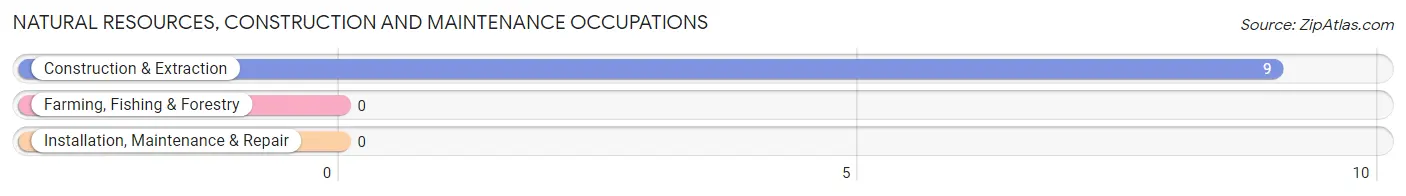
Natural Resources, Construction and Maintenance Occupations by Sex
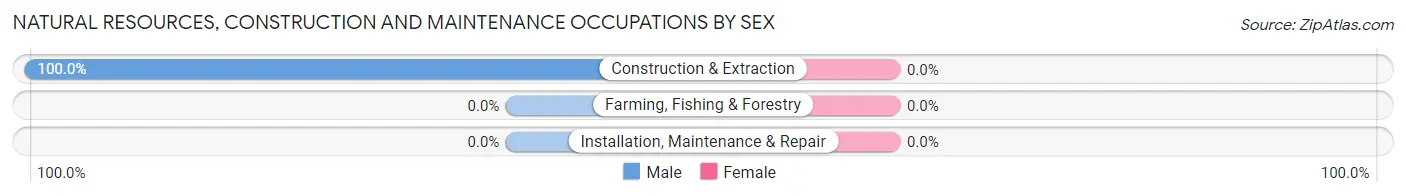
| Occupation | Male | Female |
| Farming, Fishing & Forestry | 0 (0.0%) | 0 (0.0%) |
| Construction & Extraction | 9 (100.0%) | 0 (0.0%) |
| Installation, Maintenance & Repair | 0 (0.0%) | 0 (0.0%) |
| Total (Category) | 9 (100.0%) | 0 (0.0%) |
| Total (Overall) | 45 (58.4%) | 32 (41.6%) |
Production, Transportation and Moving Occupations
The most common Production, Transportation and Moving occupations in Jordan Valley are Transportation (15 | 19.5%), Production (7 | 9.1%), and Material Moving (3 | 3.9%).
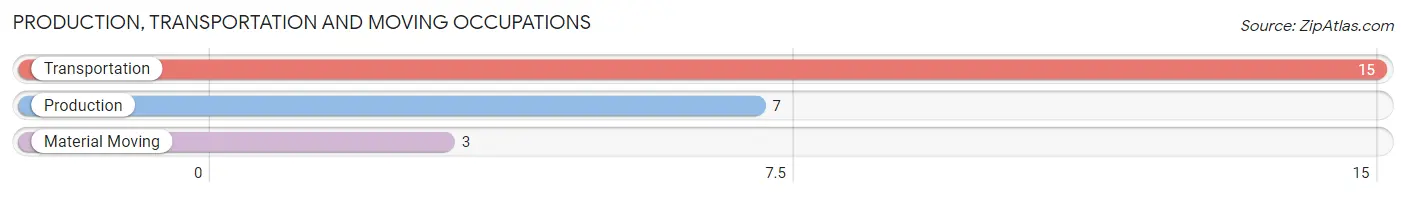
Production, Transportation and Moving Occupations by Sex
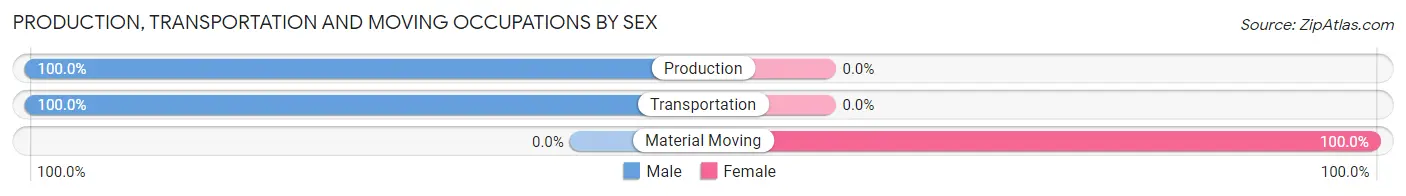
| Occupation | Male | Female |
| Production | 7 (100.0%) | 0 (0.0%) |
| Transportation | 15 (100.0%) | 0 (0.0%) |
| Material Moving | 0 (0.0%) | 3 (100.0%) |
| Total (Category) | 22 (88.0%) | 3 (12.0%) |
| Total (Overall) | 45 (58.4%) | 32 (41.6%) |
Employment Industries by Sex in Jordan Valley
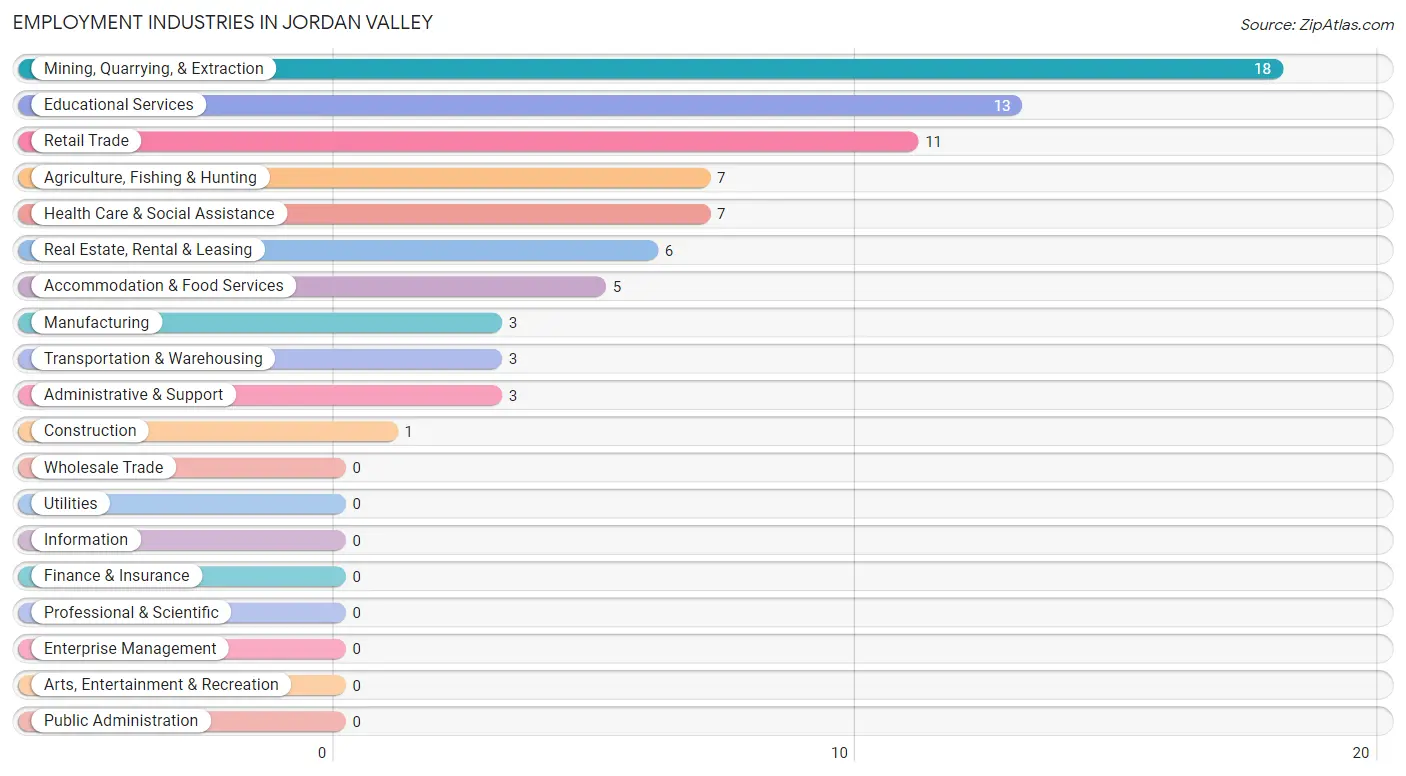
Employment Industries in Jordan Valley
The major employment industries in Jordan Valley include Mining, Quarrying, & Extraction (18 | 23.4%), Educational Services (13 | 16.9%), Retail Trade (11 | 14.3%), Agriculture, Fishing & Hunting (7 | 9.1%), and Health Care & Social Assistance (7 | 9.1%).
Employment Industries by Sex in Jordan Valley
The Jordan Valley industries that see more men than women are Agriculture, Fishing & Hunting (100.0%), Construction (100.0%), and Transportation & Warehousing (100.0%), whereas the industries that tend to have a higher number of women are Manufacturing (100.0%), Educational Services (100.0%), and Accommodation & Food Services (100.0%).
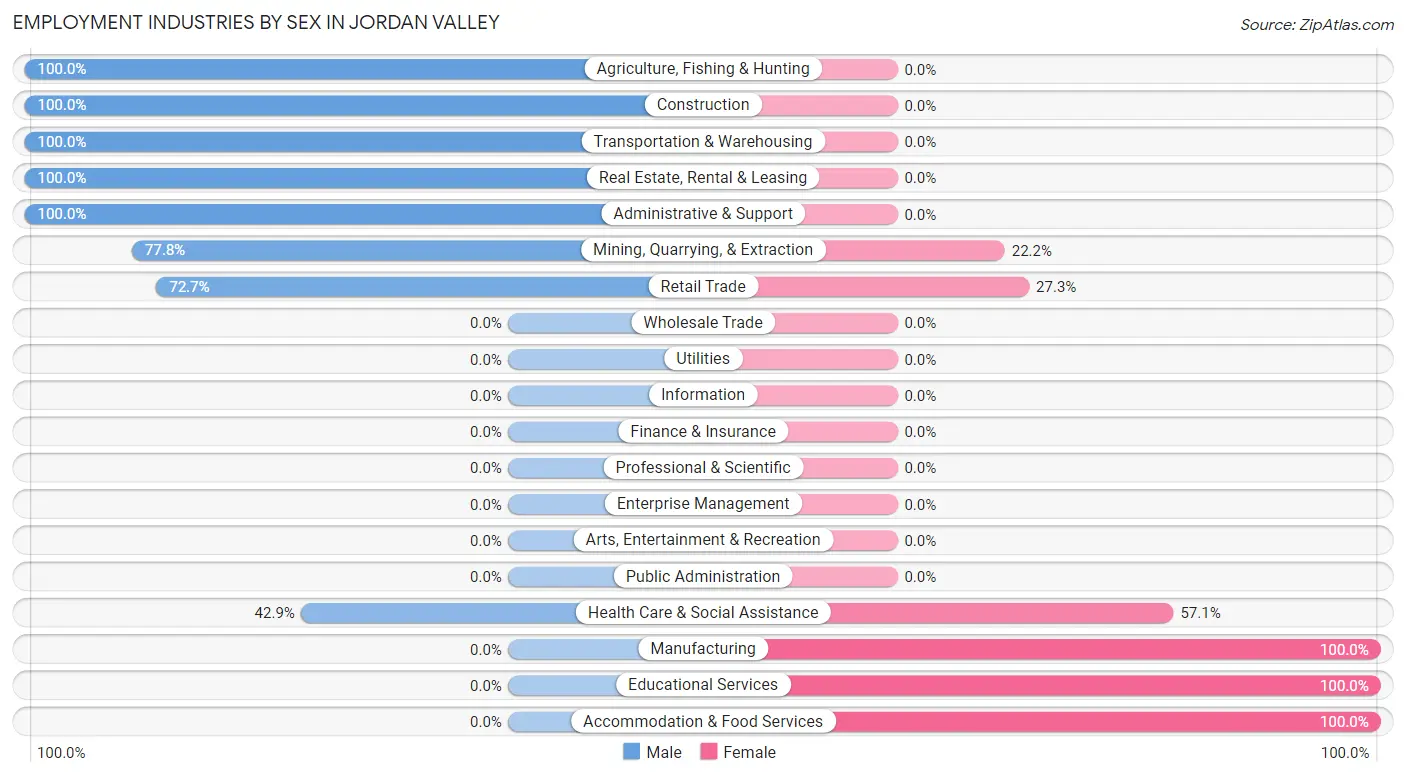
| Industry | Male | Female |
| Agriculture, Fishing & Hunting | 7 (100.0%) | 0 (0.0%) |
| Mining, Quarrying, & Extraction | 14 (77.8%) | 4 (22.2%) |
| Construction | 1 (100.0%) | 0 (0.0%) |
| Manufacturing | 0 (0.0%) | 3 (100.0%) |
| Wholesale Trade | 0 (0.0%) | 0 (0.0%) |
| Retail Trade | 8 (72.7%) | 3 (27.3%) |
| Transportation & Warehousing | 3 (100.0%) | 0 (0.0%) |
| Utilities | 0 (0.0%) | 0 (0.0%) |
| Information | 0 (0.0%) | 0 (0.0%) |
| Finance & Insurance | 0 (0.0%) | 0 (0.0%) |
| Real Estate, Rental & Leasing | 6 (100.0%) | 0 (0.0%) |
| Professional & Scientific | 0 (0.0%) | 0 (0.0%) |
| Enterprise Management | 0 (0.0%) | 0 (0.0%) |
| Administrative & Support | 3 (100.0%) | 0 (0.0%) |
| Educational Services | 0 (0.0%) | 13 (100.0%) |
| Health Care & Social Assistance | 3 (42.9%) | 4 (57.1%) |
| Arts, Entertainment & Recreation | 0 (0.0%) | 0 (0.0%) |
| Accommodation & Food Services | 0 (0.0%) | 5 (100.0%) |
| Public Administration | 0 (0.0%) | 0 (0.0%) |
| Total | 45 (58.4%) | 32 (41.6%) |
Education in Jordan Valley
School Enrollment in Jordan Valley
The most common levels of schooling among the 9 students in Jordan Valley are middle school (5 | 55.6%), and high school (4 | 44.4%).
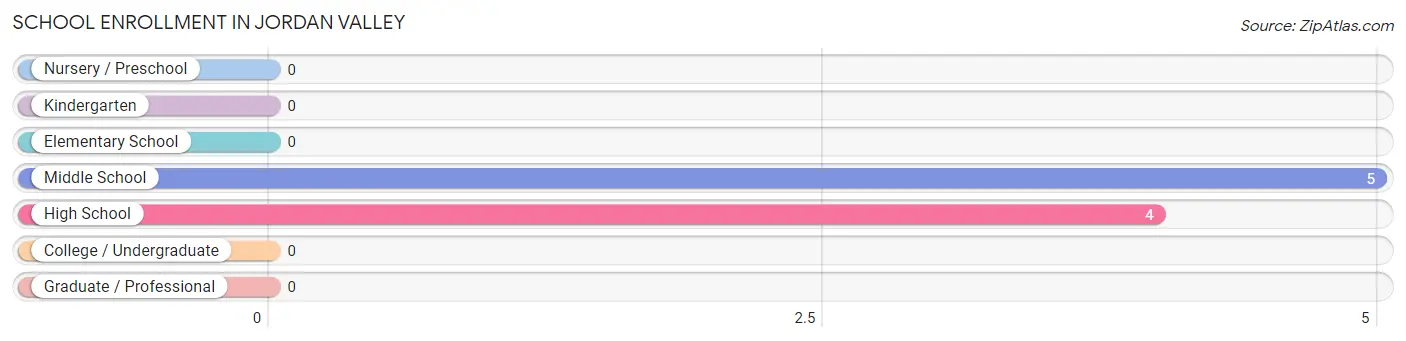
| School Level | # Students | % Students |
| Nursery / Preschool | 0 | 0.0% |
| Kindergarten | 0 | 0.0% |
| Elementary School | 0 | 0.0% |
| Middle School | 5 | 55.6% |
| High School | 4 | 44.4% |
| College / Undergraduate | 0 | 0.0% |
| Graduate / Professional | 0 | 0.0% |
| Total | 9 | 100.0% |
School Enrollment by Age by Funding Source in Jordan Valley
Out of a total of 9 students who are enrolled in schools in Jordan Valley, 4 (44.4%) attend a private institution, while the remaining 5 (55.6%) are enrolled in public schools. The age group of 15 to 17 year olds has the highest likelihood of being enrolled in private schools, with 4 (100.0% in the age bracket) enrolled. Conversely, the age group of 10 to 14 year olds has the lowest likelihood of being enrolled in a private school, with 5 (100.0% in the age bracket) attending a public institution.
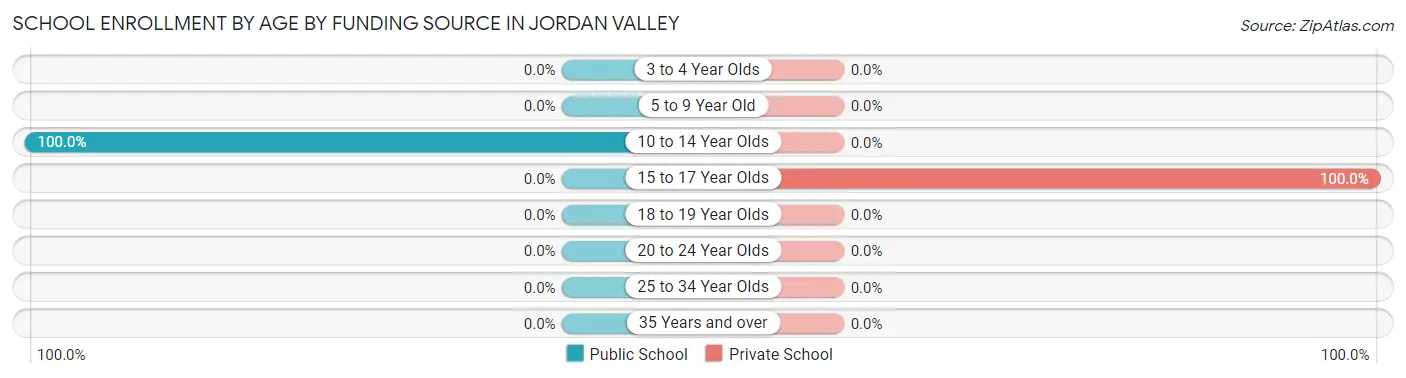
| Age Bracket | Public School | Private School |
| 3 to 4 Year Olds | 0 (0.0%) | 0 (0.0%) |
| 5 to 9 Year Old | 0 (0.0%) | 0 (0.0%) |
| 10 to 14 Year Olds | 5 (100.0%) | 0 (0.0%) |
| 15 to 17 Year Olds | 0 (0.0%) | 4 (100.0%) |
| 18 to 19 Year Olds | 0 (0.0%) | 0 (0.0%) |
| 20 to 24 Year Olds | 0 (0.0%) | 0 (0.0%) |
| 25 to 34 Year Olds | 0 (0.0%) | 0 (0.0%) |
| 35 Years and over | 0 (0.0%) | 0 (0.0%) |
| Total | 5 (55.6%) | 4 (44.4%) |
Educational Attainment by Field of Study in Jordan Valley
Education (8 | 50.0%), arts & humanities (5 | 31.2%), and bio, nature & agricultural (3 | 18.8%) are the most common fields of study among 16 individuals in Jordan Valley who have obtained a bachelor's degree or higher.
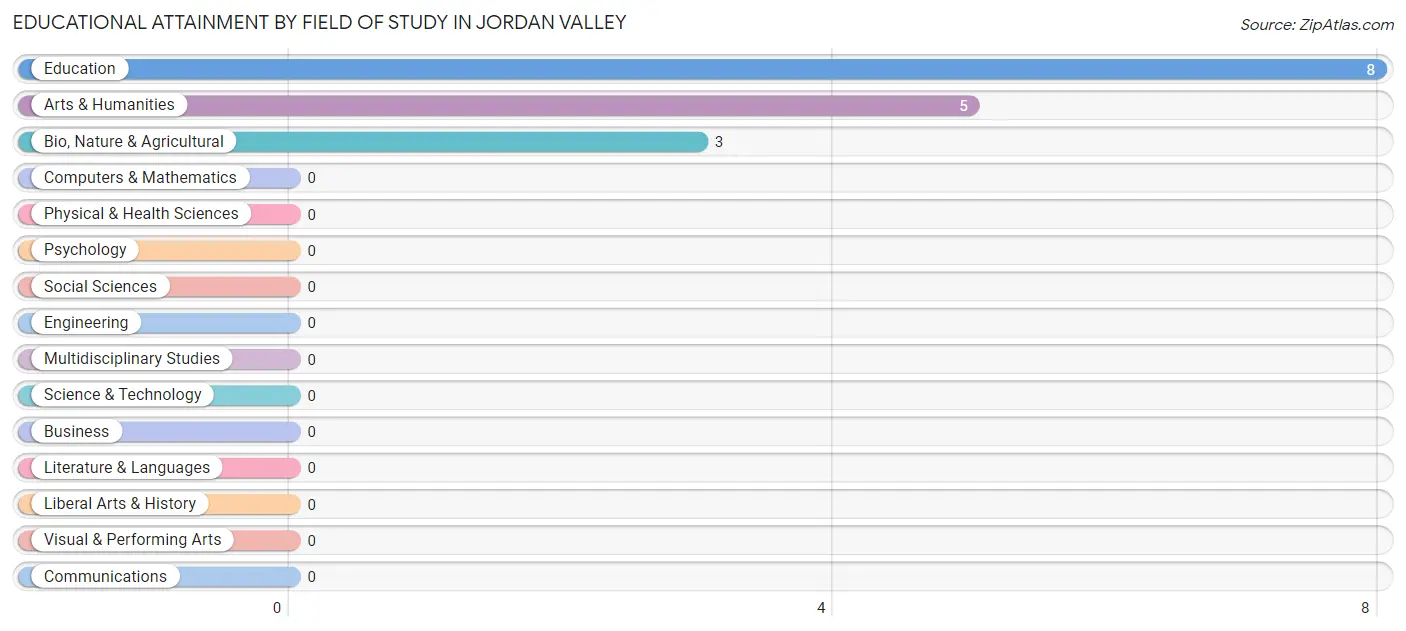
| Field of Study | # Graduates | % Graduates |
| Computers & Mathematics | 0 | 0.0% |
| Bio, Nature & Agricultural | 3 | 18.8% |
| Physical & Health Sciences | 0 | 0.0% |
| Psychology | 0 | 0.0% |
| Social Sciences | 0 | 0.0% |
| Engineering | 0 | 0.0% |
| Multidisciplinary Studies | 0 | 0.0% |
| Science & Technology | 0 | 0.0% |
| Business | 0 | 0.0% |
| Education | 8 | 50.0% |
| Literature & Languages | 0 | 0.0% |
| Liberal Arts & History | 0 | 0.0% |
| Visual & Performing Arts | 0 | 0.0% |
| Communications | 0 | 0.0% |
| Arts & Humanities | 5 | 31.2% |
| Total | 16 | 100.0% |
Transportation & Commute in Jordan Valley
Vehicle Availability by Sex in Jordan Valley
The most prevalent vehicle ownership categories in Jordan Valley are males with 2 vehicles (29, accounting for 64.4%) and females with 2 vehicles (7, making up 90.6%).
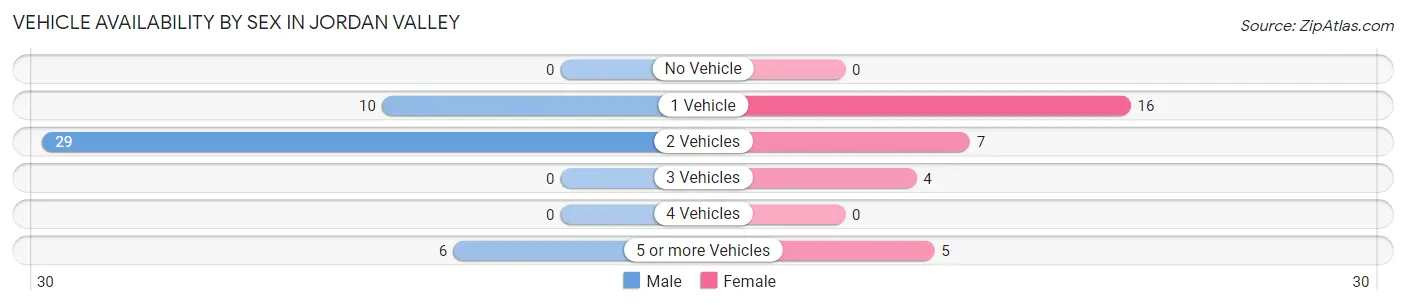
| Vehicles Available | Male | Female |
| No Vehicle | 0 (0.0%) | 0 (0.0%) |
| 1 Vehicle | 10 (22.2%) | 16 (50.0%) |
| 2 Vehicles | 29 (64.4%) | 7 (21.9%) |
| 3 Vehicles | 0 (0.0%) | 4 (12.5%) |
| 4 Vehicles | 0 (0.0%) | 0 (0.0%) |
| 5 or more Vehicles | 6 (13.3%) | 5 (15.6%) |
| Total | 45 (100.0%) | 32 (100.0%) |
Commute Time in Jordan Valley
The most frequently occuring commute durations in Jordan Valley are 45 to 59 minutes (22 commuters, 28.6%), less than 5 minutes (20 commuters, 26.0%), and 5 to 9 minutes (17 commuters, 22.1%).
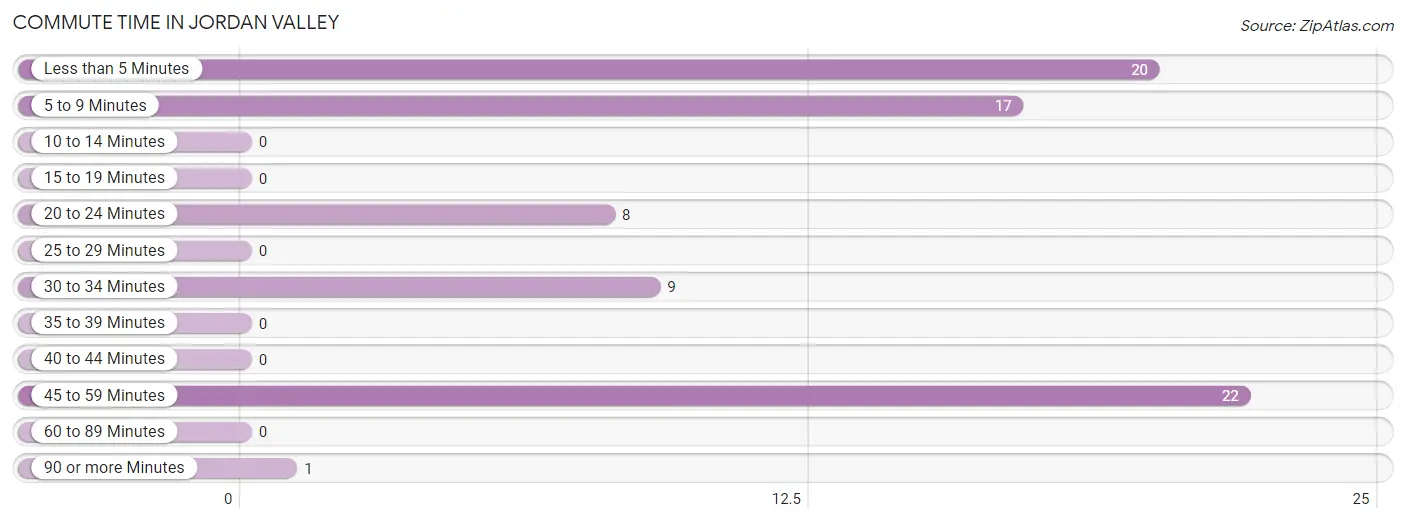
| Commute Time | # Commuters | % Commuters |
| Less than 5 Minutes | 20 | 26.0% |
| 5 to 9 Minutes | 17 | 22.1% |
| 10 to 14 Minutes | 0 | 0.0% |
| 15 to 19 Minutes | 0 | 0.0% |
| 20 to 24 Minutes | 8 | 10.4% |
| 25 to 29 Minutes | 0 | 0.0% |
| 30 to 34 Minutes | 9 | 11.7% |
| 35 to 39 Minutes | 0 | 0.0% |
| 40 to 44 Minutes | 0 | 0.0% |
| 45 to 59 Minutes | 22 | 28.6% |
| 60 to 89 Minutes | 0 | 0.0% |
| 90 or more Minutes | 1 | 1.3% |
Commute Time by Sex in Jordan Valley
The most common commute times in Jordan Valley are 45 to 59 minutes (14 commuters, 31.1%) for males and less than 5 minutes (17 commuters, 53.1%) for females.
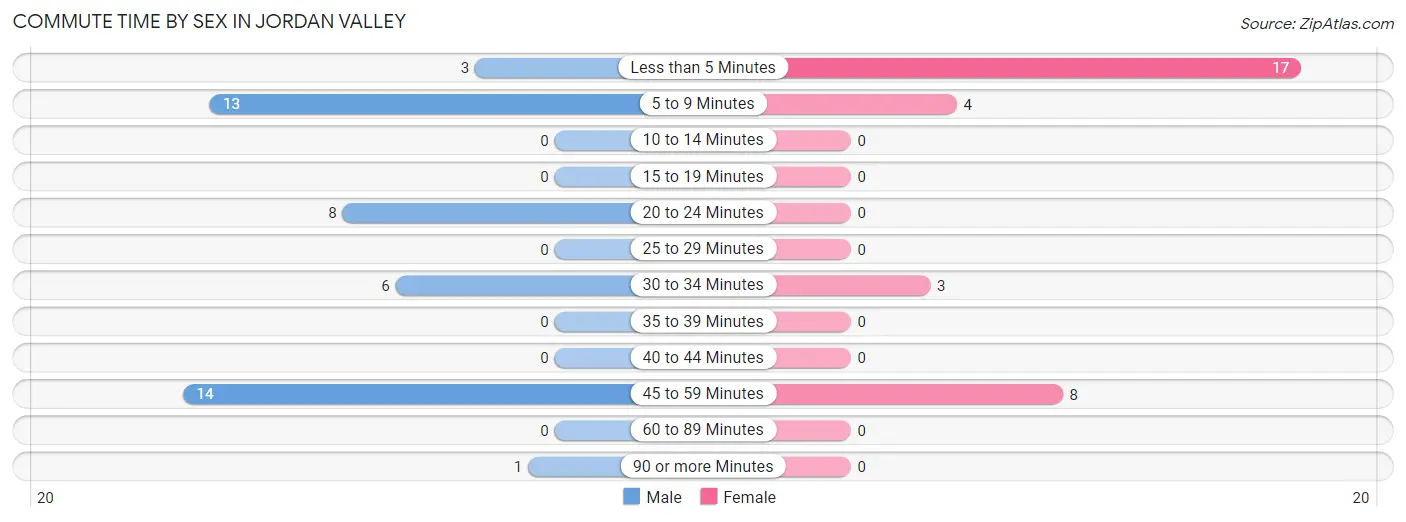
| Commute Time | Male | Female |
| Less than 5 Minutes | 3 (6.7%) | 17 (53.1%) |
| 5 to 9 Minutes | 13 (28.9%) | 4 (12.5%) |
| 10 to 14 Minutes | 0 (0.0%) | 0 (0.0%) |
| 15 to 19 Minutes | 0 (0.0%) | 0 (0.0%) |
| 20 to 24 Minutes | 8 (17.8%) | 0 (0.0%) |
| 25 to 29 Minutes | 0 (0.0%) | 0 (0.0%) |
| 30 to 34 Minutes | 6 (13.3%) | 3 (9.4%) |
| 35 to 39 Minutes | 0 (0.0%) | 0 (0.0%) |
| 40 to 44 Minutes | 0 (0.0%) | 0 (0.0%) |
| 45 to 59 Minutes | 14 (31.1%) | 8 (25.0%) |
| 60 to 89 Minutes | 0 (0.0%) | 0 (0.0%) |
| 90 or more Minutes | 1 (2.2%) | 0 (0.0%) |
Time of Departure to Work by Sex in Jordan Valley
The most frequent times of departure to work in Jordan Valley are 5:00 AM to 5:29 AM (12, 26.7%) for males and 7:30 AM to 7:59 AM (12, 37.5%) for females.
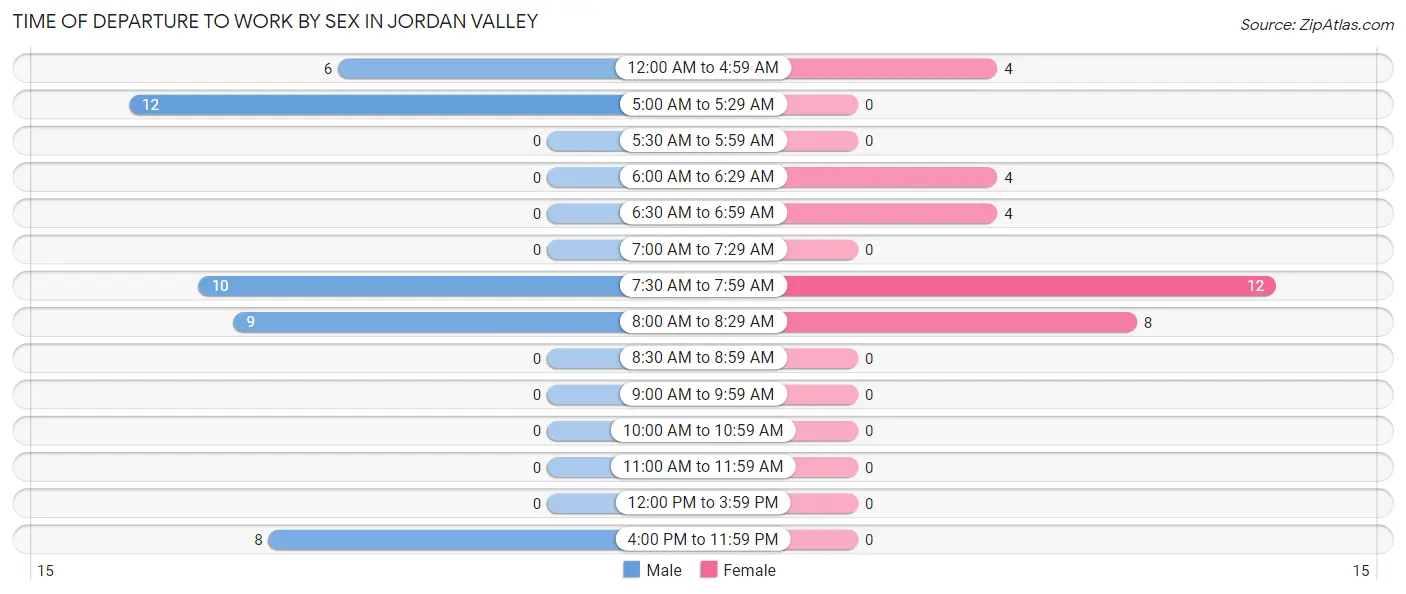
| Time of Departure | Male | Female |
| 12:00 AM to 4:59 AM | 6 (13.3%) | 4 (12.5%) |
| 5:00 AM to 5:29 AM | 12 (26.7%) | 0 (0.0%) |
| 5:30 AM to 5:59 AM | 0 (0.0%) | 0 (0.0%) |
| 6:00 AM to 6:29 AM | 0 (0.0%) | 4 (12.5%) |
| 6:30 AM to 6:59 AM | 0 (0.0%) | 4 (12.5%) |
| 7:00 AM to 7:29 AM | 0 (0.0%) | 0 (0.0%) |
| 7:30 AM to 7:59 AM | 10 (22.2%) | 12 (37.5%) |
| 8:00 AM to 8:29 AM | 9 (20.0%) | 8 (25.0%) |
| 8:30 AM to 8:59 AM | 0 (0.0%) | 0 (0.0%) |
| 9:00 AM to 9:59 AM | 0 (0.0%) | 0 (0.0%) |
| 10:00 AM to 10:59 AM | 0 (0.0%) | 0 (0.0%) |
| 11:00 AM to 11:59 AM | 0 (0.0%) | 0 (0.0%) |
| 12:00 PM to 3:59 PM | 0 (0.0%) | 0 (0.0%) |
| 4:00 PM to 11:59 PM | 8 (17.8%) | 0 (0.0%) |
| Total | 45 (100.0%) | 32 (100.0%) |
Housing Occupancy in Jordan Valley
Occupancy by Ownership in Jordan Valley
Of the total 57 dwellings in Jordan Valley, owner-occupied units account for 30 (52.6%), while renter-occupied units make up 27 (47.4%).
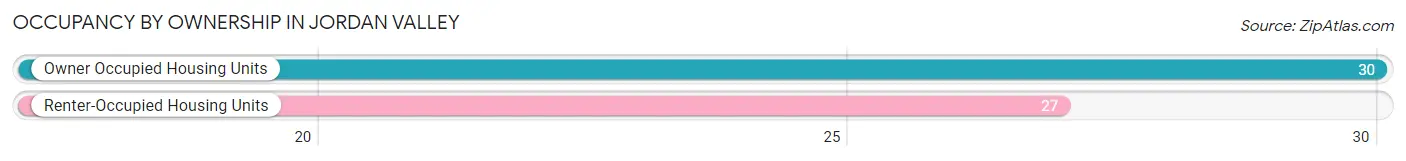
| Occupancy | # Housing Units | % Housing Units |
| Owner Occupied Housing Units | 30 | 52.6% |
| Renter-Occupied Housing Units | 27 | 47.4% |
| Total Occupied Housing Units | 57 | 100.0% |
Occupancy by Household Size in Jordan Valley
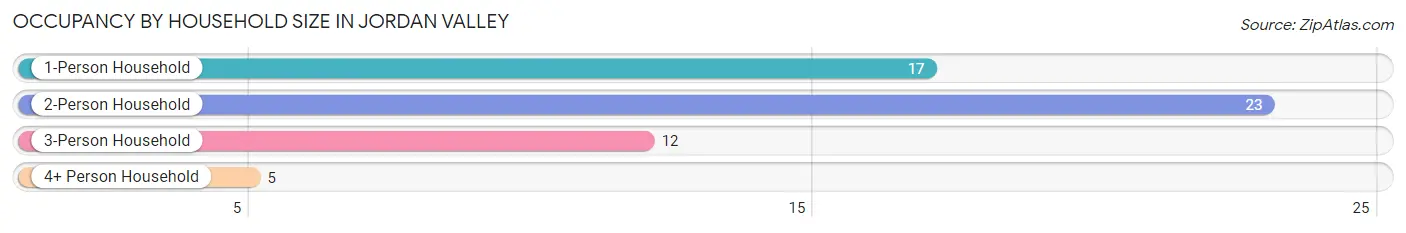
| Household Size | # Housing Units | % Housing Units |
| 1-Person Household | 17 | 29.8% |
| 2-Person Household | 23 | 40.4% |
| 3-Person Household | 12 | 21.0% |
| 4+ Person Household | 5 | 8.8% |
| Total Housing Units | 57 | 100.0% |
Occupancy by Ownership by Household Size in Jordan Valley
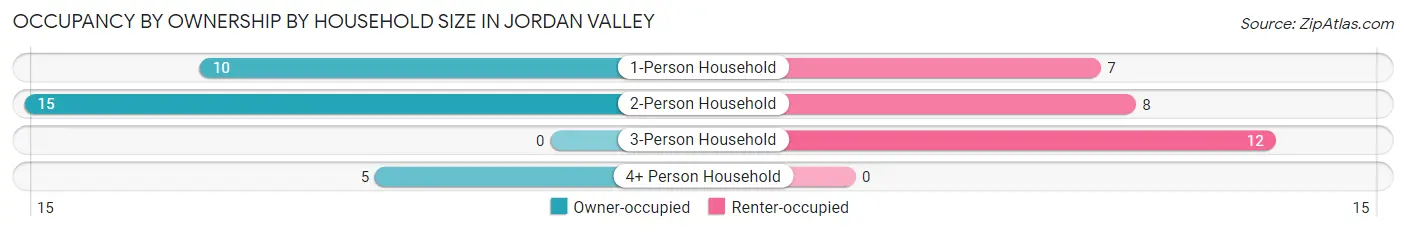
| Household Size | Owner-occupied | Renter-occupied |
| 1-Person Household | 10 (58.8%) | 7 (41.2%) |
| 2-Person Household | 15 (65.2%) | 8 (34.8%) |
| 3-Person Household | 0 (0.0%) | 12 (100.0%) |
| 4+ Person Household | 5 (100.0%) | 0 (0.0%) |
| Total Housing Units | 30 (52.6%) | 27 (47.4%) |
Occupancy by Educational Attainment in Jordan Valley
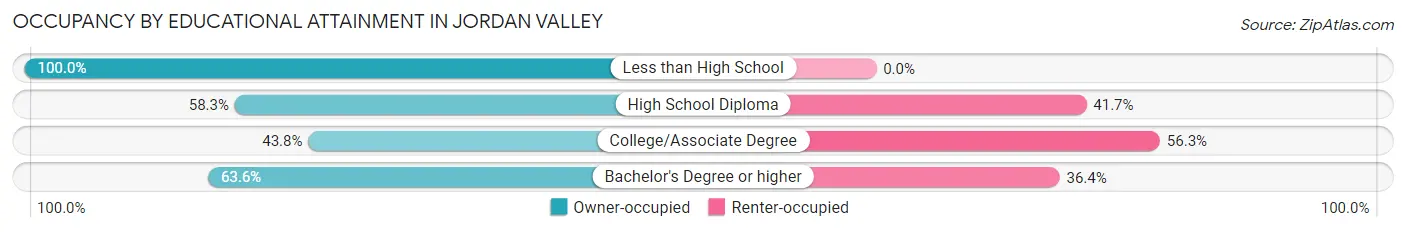
| Household Size | Owner-occupied | Renter-occupied |
| Less than High School | 2 (100.0%) | 0 (0.0%) |
| High School Diploma | 7 (58.3%) | 5 (41.7%) |
| College/Associate Degree | 14 (43.8%) | 18 (56.2%) |
| Bachelor's Degree or higher | 7 (63.6%) | 4 (36.4%) |
Occupancy by Age of Householder in Jordan Valley
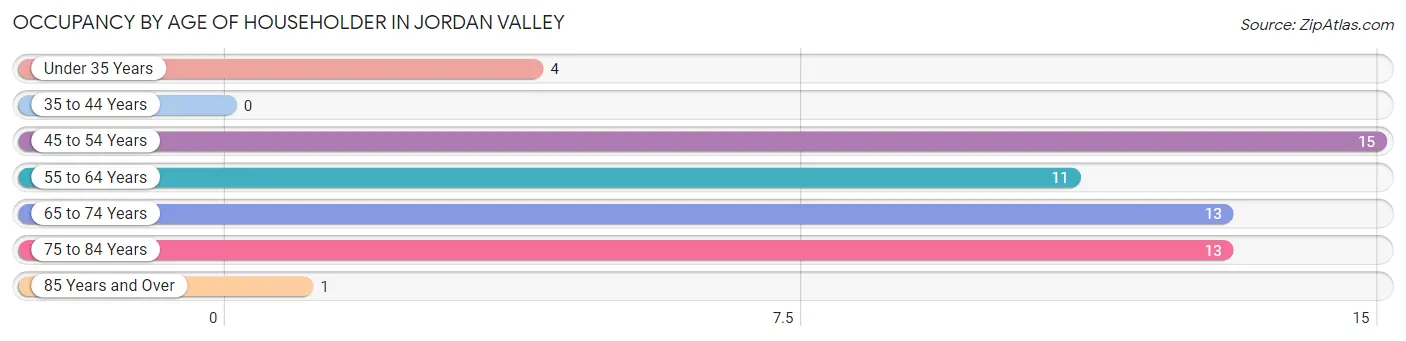
| Age Bracket | # Households | % Households |
| Under 35 Years | 4 | 7.0% |
| 35 to 44 Years | 0 | 0.0% |
| 45 to 54 Years | 15 | 26.3% |
| 55 to 64 Years | 11 | 19.3% |
| 65 to 74 Years | 13 | 22.8% |
| 75 to 84 Years | 13 | 22.8% |
| 85 Years and Over | 1 | 1.8% |
| Total | 57 | 100.0% |
Housing Finances in Jordan Valley
Median Income by Occupancy in Jordan Valley
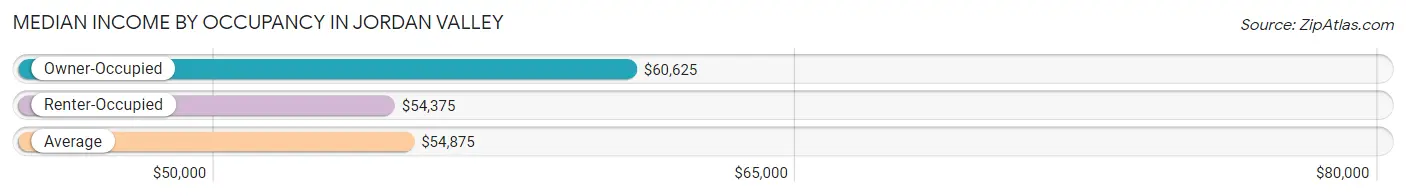
| Occupancy Type | # Households | Median Income |
| Owner-Occupied | 30 (52.6%) | $60,625 |
| Renter-Occupied | 27 (47.4%) | $54,375 |
| Average | 57 (100.0%) | $54,875 |
Occupancy by Householder Income Bracket in Jordan Valley
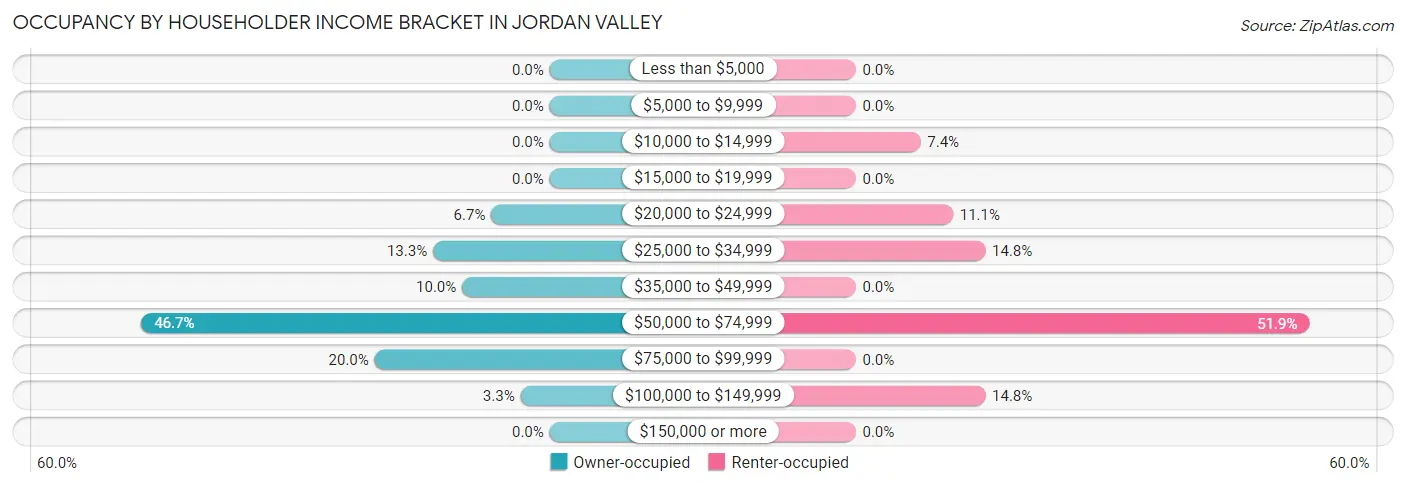
| Income Bracket | Owner-occupied | Renter-occupied |
| Less than $5,000 | 0 (0.0%) | 0 (0.0%) |
| $5,000 to $9,999 | 0 (0.0%) | 0 (0.0%) |
| $10,000 to $14,999 | 0 (0.0%) | 2 (7.4%) |
| $15,000 to $19,999 | 0 (0.0%) | 0 (0.0%) |
| $20,000 to $24,999 | 2 (6.7%) | 3 (11.1%) |
| $25,000 to $34,999 | 4 (13.3%) | 4 (14.8%) |
| $35,000 to $49,999 | 3 (10.0%) | 0 (0.0%) |
| $50,000 to $74,999 | 14 (46.7%) | 14 (51.8%) |
| $75,000 to $99,999 | 6 (20.0%) | 0 (0.0%) |
| $100,000 to $149,999 | 1 (3.3%) | 4 (14.8%) |
| $150,000 or more | 0 (0.0%) | 0 (0.0%) |
| Total | 30 (100.0%) | 27 (100.0%) |
Monthly Housing Cost Tiers in Jordan Valley
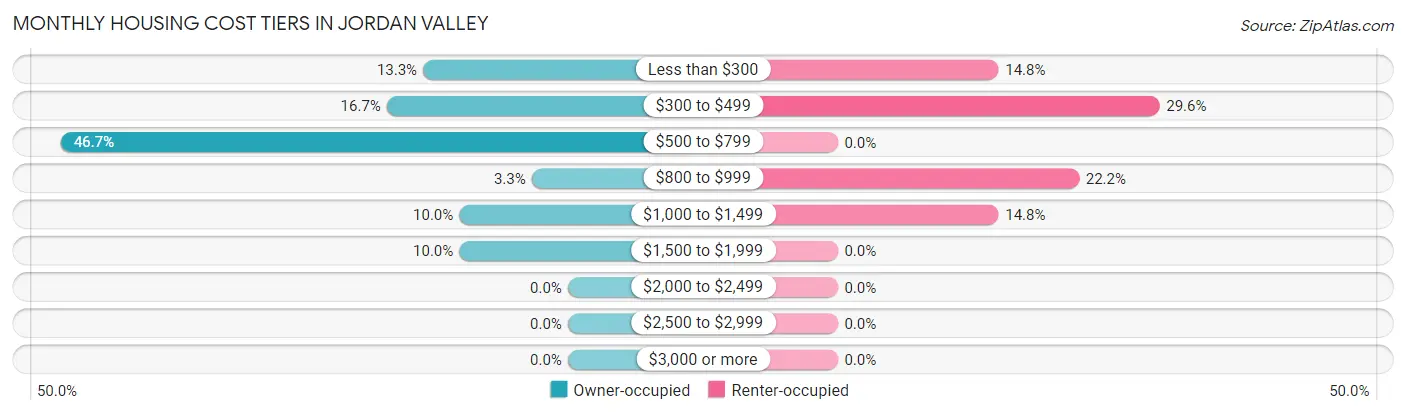
| Monthly Cost | Owner-occupied | Renter-occupied |
| Less than $300 | 4 (13.3%) | 4 (14.8%) |
| $300 to $499 | 5 (16.7%) | 8 (29.6%) |
| $500 to $799 | 14 (46.7%) | 0 (0.0%) |
| $800 to $999 | 1 (3.3%) | 6 (22.2%) |
| $1,000 to $1,499 | 3 (10.0%) | 4 (14.8%) |
| $1,500 to $1,999 | 3 (10.0%) | 0 (0.0%) |
| $2,000 to $2,499 | 0 (0.0%) | 0 (0.0%) |
| $2,500 to $2,999 | 0 (0.0%) | 0 (0.0%) |
| $3,000 or more | 0 (0.0%) | 0 (0.0%) |
| Total | 30 (100.0%) | 27 (100.0%) |
Physical Housing Characteristics in Jordan Valley
Housing Structures in Jordan Valley
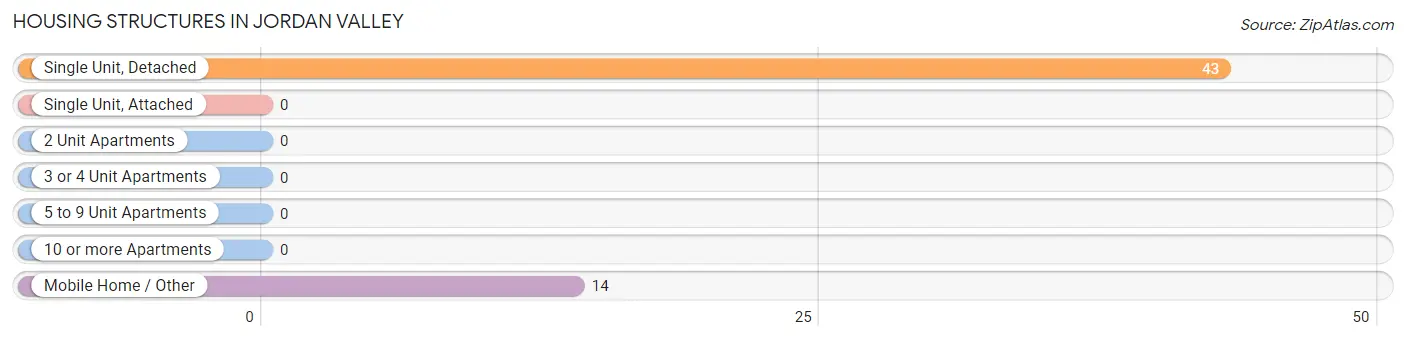
| Structure Type | # Housing Units | % Housing Units |
| Single Unit, Detached | 43 | 75.4% |
| Single Unit, Attached | 0 | 0.0% |
| 2 Unit Apartments | 0 | 0.0% |
| 3 or 4 Unit Apartments | 0 | 0.0% |
| 5 to 9 Unit Apartments | 0 | 0.0% |
| 10 or more Apartments | 0 | 0.0% |
| Mobile Home / Other | 14 | 24.6% |
| Total | 57 | 100.0% |
Housing Structures by Occupancy in Jordan Valley
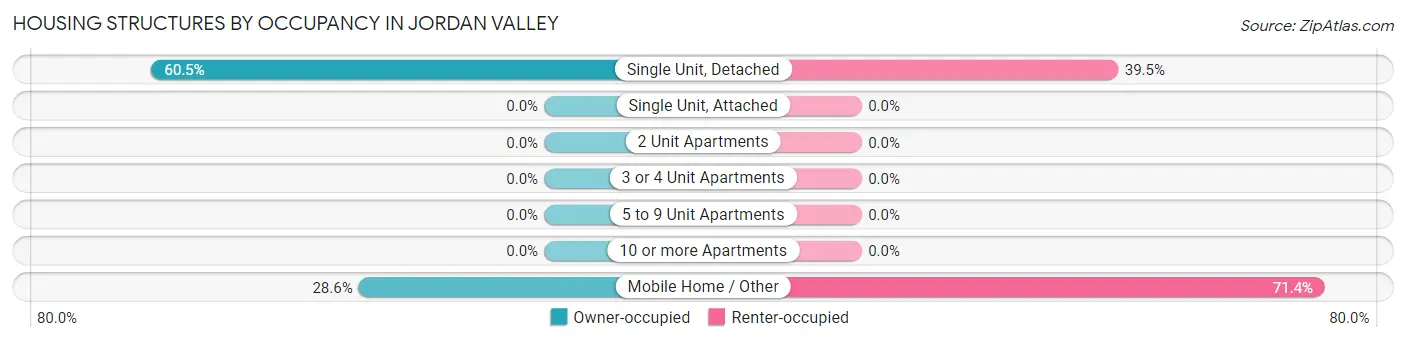
| Structure Type | Owner-occupied | Renter-occupied |
| Single Unit, Detached | 26 (60.5%) | 17 (39.5%) |
| Single Unit, Attached | 0 (0.0%) | 0 (0.0%) |
| 2 Unit Apartments | 0 (0.0%) | 0 (0.0%) |
| 3 or 4 Unit Apartments | 0 (0.0%) | 0 (0.0%) |
| 5 to 9 Unit Apartments | 0 (0.0%) | 0 (0.0%) |
| 10 or more Apartments | 0 (0.0%) | 0 (0.0%) |
| Mobile Home / Other | 4 (28.6%) | 10 (71.4%) |
| Total | 30 (52.6%) | 27 (47.4%) |
Housing Structures by Number of Rooms in Jordan Valley
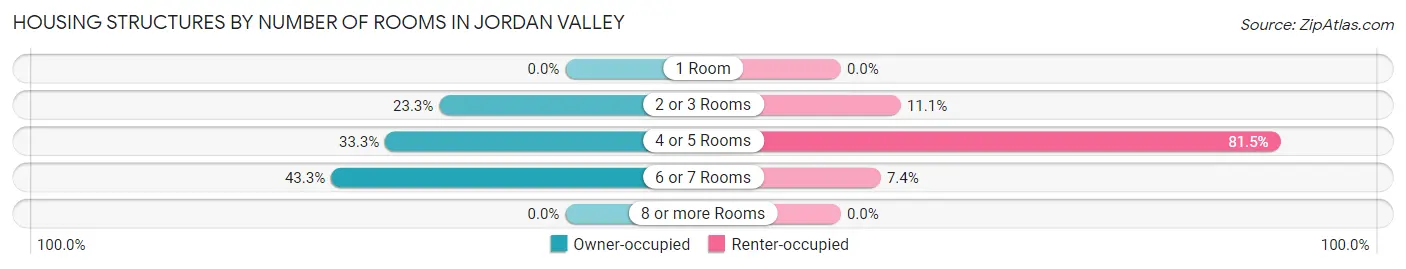
| Number of Rooms | Owner-occupied | Renter-occupied |
| 1 Room | 0 (0.0%) | 0 (0.0%) |
| 2 or 3 Rooms | 7 (23.3%) | 3 (11.1%) |
| 4 or 5 Rooms | 10 (33.3%) | 22 (81.5%) |
| 6 or 7 Rooms | 13 (43.3%) | 2 (7.4%) |
| 8 or more Rooms | 0 (0.0%) | 0 (0.0%) |
| Total | 30 (100.0%) | 27 (100.0%) |
Housing Structure by Heating Type in Jordan Valley
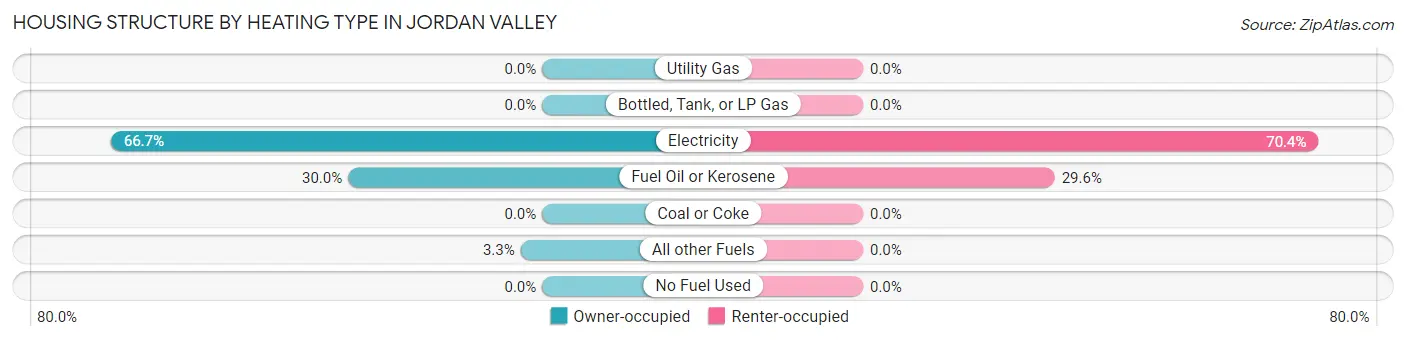
| Heating Type | Owner-occupied | Renter-occupied |
| Utility Gas | 0 (0.0%) | 0 (0.0%) |
| Bottled, Tank, or LP Gas | 0 (0.0%) | 0 (0.0%) |
| Electricity | 20 (66.7%) | 19 (70.4%) |
| Fuel Oil or Kerosene | 9 (30.0%) | 8 (29.6%) |
| Coal or Coke | 0 (0.0%) | 0 (0.0%) |
| All other Fuels | 1 (3.3%) | 0 (0.0%) |
| No Fuel Used | 0 (0.0%) | 0 (0.0%) |
| Total | 30 (100.0%) | 27 (100.0%) |
Household Vehicle Usage in Jordan Valley
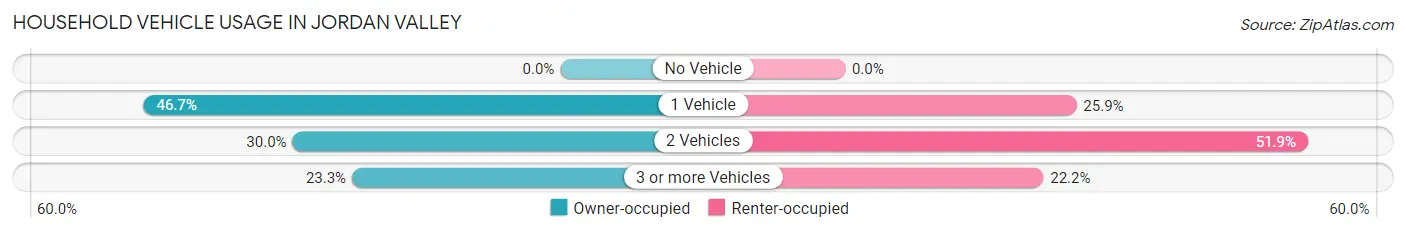
| Vehicles per Household | Owner-occupied | Renter-occupied |
| No Vehicle | 0 (0.0%) | 0 (0.0%) |
| 1 Vehicle | 14 (46.7%) | 7 (25.9%) |
| 2 Vehicles | 9 (30.0%) | 14 (51.8%) |
| 3 or more Vehicles | 7 (23.3%) | 6 (22.2%) |
| Total | 30 (100.0%) | 27 (100.0%) |
Real Estate & Mortgages in Jordan Valley
Real Estate and Mortgage Overview in Jordan Valley
| Characteristic | Without Mortgage | With Mortgage |
| Housing Units | 23 | 7 |
| Median Property Value | $117,500 | $220,800 |
| Median Household Income | $54,063 | $0 |
| Monthly Housing Costs | $519 | $0 |
| Real Estate Taxes | - | - |
Property Value by Mortgage Status in Jordan Valley
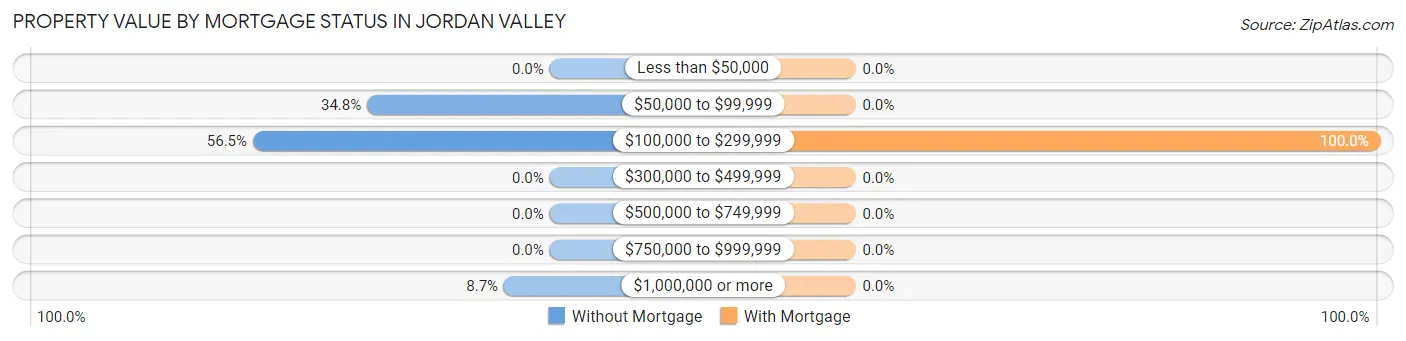
| Property Value | Without Mortgage | With Mortgage |
| Less than $50,000 | 0 (0.0%) | 0 (0.0%) |
| $50,000 to $99,999 | 8 (34.8%) | 0 (0.0%) |
| $100,000 to $299,999 | 13 (56.5%) | 7 (100.0%) |
| $300,000 to $499,999 | 0 (0.0%) | 0 (0.0%) |
| $500,000 to $749,999 | 0 (0.0%) | 0 (0.0%) |
| $750,000 to $999,999 | 0 (0.0%) | 0 (0.0%) |
| $1,000,000 or more | 2 (8.7%) | 0 (0.0%) |
| Total | 23 (100.0%) | 7 (100.0%) |
Household Income by Mortgage Status in Jordan Valley
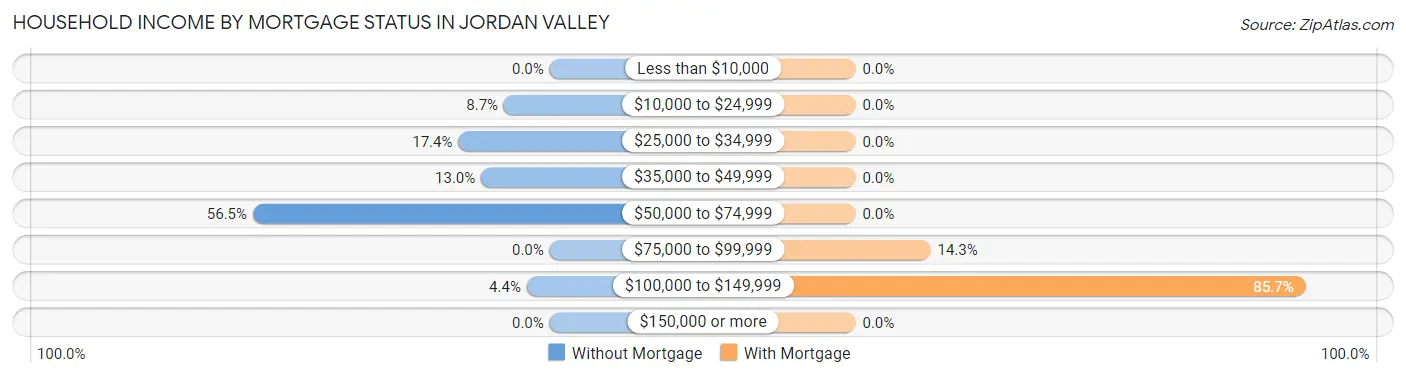
| Household Income | Without Mortgage | With Mortgage |
| Less than $10,000 | 0 (0.0%) | 0 (0.0%) |
| $10,000 to $24,999 | 2 (8.7%) | 0 (0.0%) |
| $25,000 to $34,999 | 4 (17.4%) | 0 (0.0%) |
| $35,000 to $49,999 | 3 (13.0%) | 0 (0.0%) |
| $50,000 to $74,999 | 13 (56.5%) | 0 (0.0%) |
| $75,000 to $99,999 | 0 (0.0%) | 1 (14.3%) |
| $100,000 to $149,999 | 1 (4.3%) | 6 (85.7%) |
| $150,000 or more | 0 (0.0%) | 0 (0.0%) |
| Total | 23 (100.0%) | 7 (100.0%) |
Property Value to Household Income Ratio in Jordan Valley
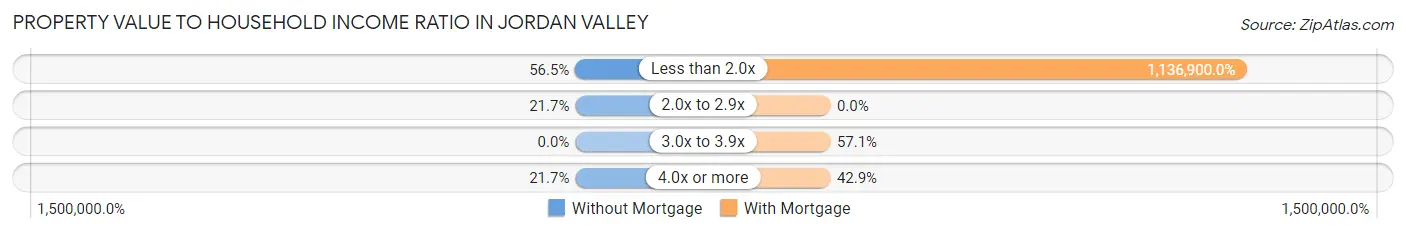
| Value-to-Income Ratio | Without Mortgage | With Mortgage |
| Less than 2.0x | 13 (56.5%) | 79,583 (1,136,900.0%) |
| 2.0x to 2.9x | 5 (21.7%) | 0 (0.0%) |
| 3.0x to 3.9x | 0 (0.0%) | 4 (57.1%) |
| 4.0x or more | 5 (21.7%) | 3 (42.9%) |
| Total | 23 (100.0%) | 7 (100.0%) |
Real Estate Taxes by Mortgage Status in Jordan Valley
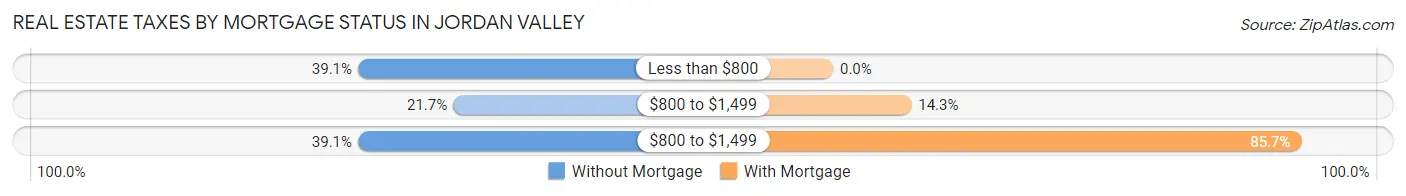
| Property Taxes | Without Mortgage | With Mortgage |
| Less than $800 | 9 (39.1%) | 0 (0.0%) |
| $800 to $1,499 | 5 (21.7%) | 1 (14.3%) |
| $800 to $1,499 | 9 (39.1%) | 6 (85.7%) |
| Total | 23 (100.0%) | 7 (100.0%) |
Health & Disability in Jordan Valley
Health Insurance Coverage by Age in Jordan Valley
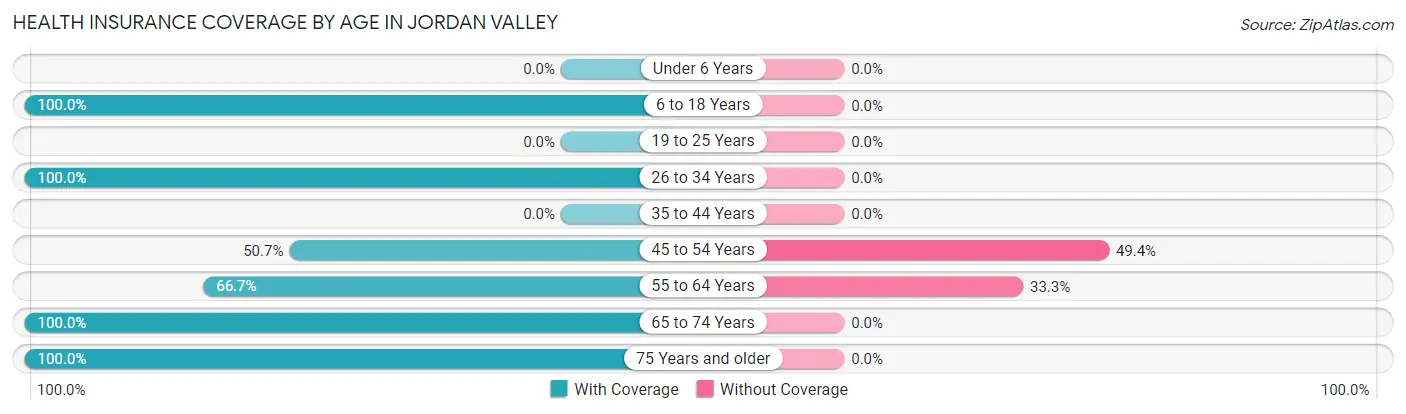
| Age Bracket | With Coverage | Without Coverage |
| Under 6 Years | 0 (0.0%) | 0 (0.0%) |
| 6 to 18 Years | 9 (100.0%) | 0 (0.0%) |
| 19 to 25 Years | 0 (0.0%) | 0 (0.0%) |
| 26 to 34 Years | 16 (100.0%) | 0 (0.0%) |
| 35 to 44 Years | 0 (0.0%) | 0 (0.0%) |
| 45 to 54 Years | 39 (50.6%) | 38 (49.3%) |
| 55 to 64 Years | 20 (66.7%) | 10 (33.3%) |
| 65 to 74 Years | 13 (100.0%) | 0 (0.0%) |
| 75 Years and older | 19 (100.0%) | 0 (0.0%) |
| Total | 116 (70.7%) | 48 (29.3%) |
Health Insurance Coverage by Citizenship Status in Jordan Valley
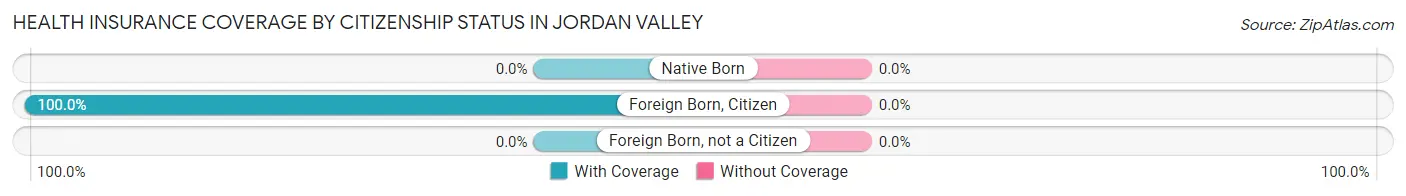
| Citizenship Status | With Coverage | Without Coverage |
| Native Born | 0 (0.0%) | 0 (0.0%) |
| Foreign Born, Citizen | 9 (100.0%) | 0 (0.0%) |
| Foreign Born, not a Citizen | 0 (0.0%) | 0 (0.0%) |
Health Insurance Coverage by Household Income in Jordan Valley
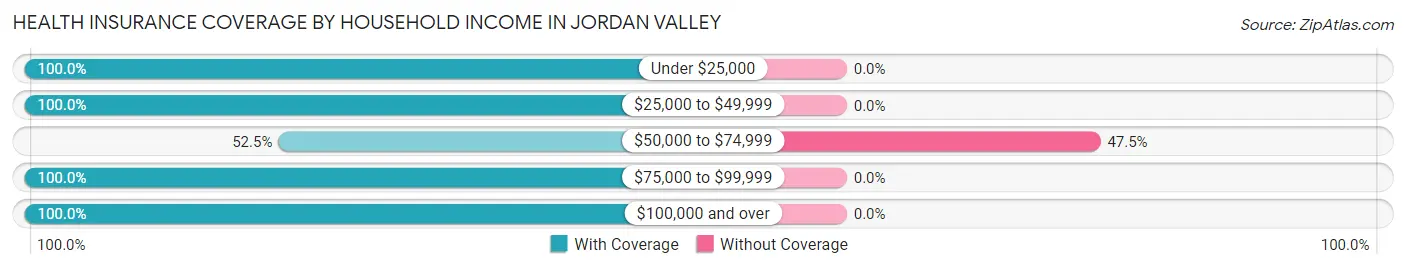
| Household Income | With Coverage | Without Coverage |
| Under $25,000 | 8 (100.0%) | 0 (0.0%) |
| $25,000 to $49,999 | 14 (100.0%) | 0 (0.0%) |
| $50,000 to $74,999 | 53 (52.5%) | 48 (47.5%) |
| $75,000 to $99,999 | 12 (100.0%) | 0 (0.0%) |
| $100,000 and over | 22 (100.0%) | 0 (0.0%) |
Public vs Private Health Insurance Coverage by Age in Jordan Valley
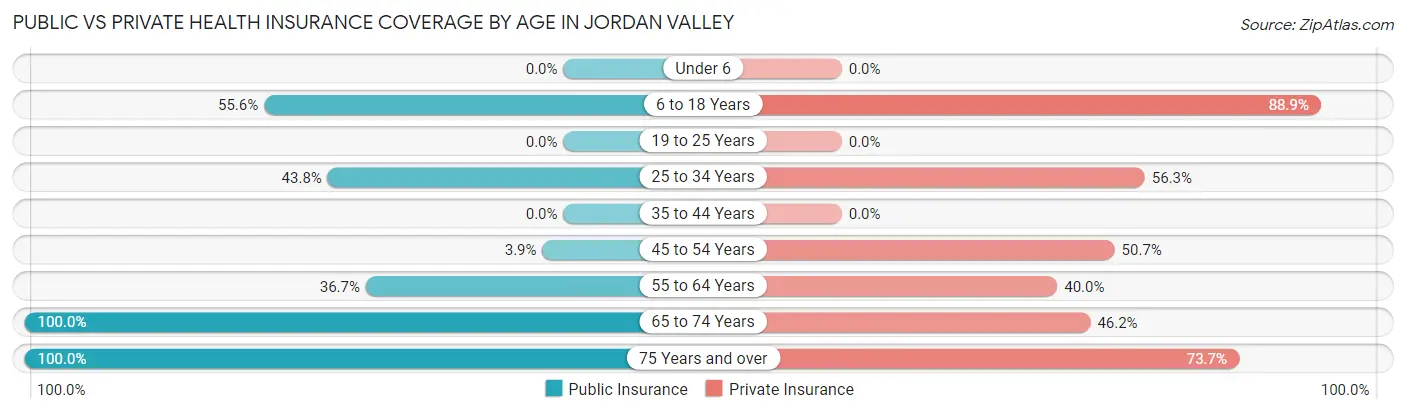
| Age Bracket | Public Insurance | Private Insurance |
| Under 6 | 0 (0.0%) | 0 (0.0%) |
| 6 to 18 Years | 5 (55.6%) | 8 (88.9%) |
| 19 to 25 Years | 0 (0.0%) | 0 (0.0%) |
| 25 to 34 Years | 7 (43.8%) | 9 (56.2%) |
| 35 to 44 Years | 0 (0.0%) | 0 (0.0%) |
| 45 to 54 Years | 3 (3.9%) | 39 (50.6%) |
| 55 to 64 Years | 11 (36.7%) | 12 (40.0%) |
| 65 to 74 Years | 13 (100.0%) | 6 (46.2%) |
| 75 Years and over | 19 (100.0%) | 14 (73.7%) |
| Total | 58 (35.4%) | 88 (53.7%) |
Disability Status by Sex by Age in Jordan Valley
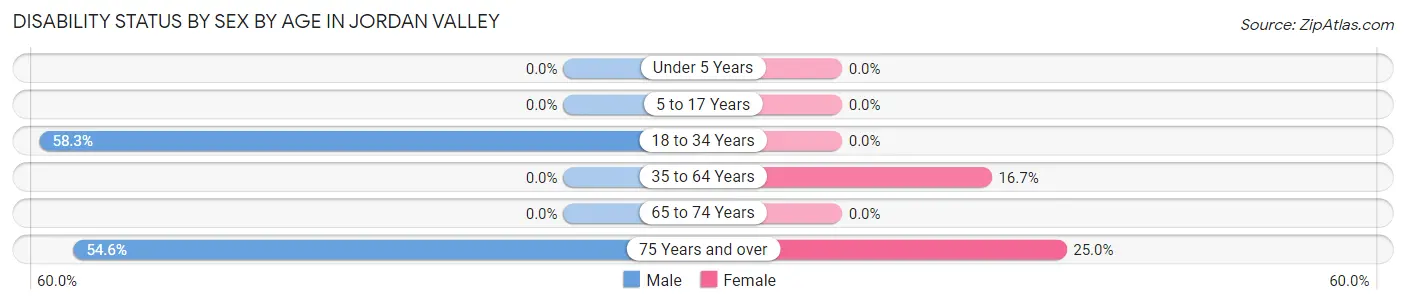
| Age Bracket | Male | Female |
| Under 5 Years | 0 (0.0%) | 0 (0.0%) |
| 5 to 17 Years | 0 (0.0%) | 0 (0.0%) |
| 18 to 34 Years | 7 (58.3%) | 0 (0.0%) |
| 35 to 64 Years | 0 (0.0%) | 5 (16.7%) |
| 65 to 74 Years | 0 (0.0%) | 0 (0.0%) |
| 75 Years and over | 6 (54.5%) | 2 (25.0%) |
Disability Class by Sex by Age in Jordan Valley
Disability Class: Hearing Difficulty
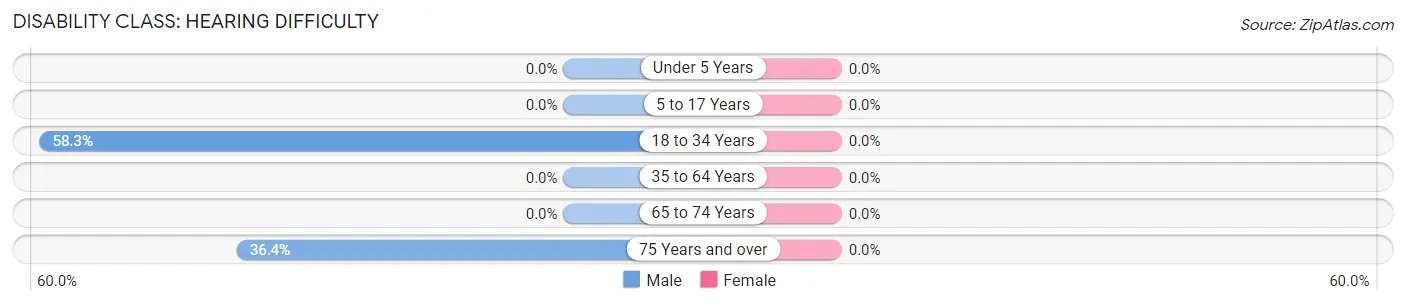
| Age Bracket | Male | Female |
| Under 5 Years | 0 (0.0%) | 0 (0.0%) |
| 5 to 17 Years | 0 (0.0%) | 0 (0.0%) |
| 18 to 34 Years | 7 (58.3%) | 0 (0.0%) |
| 35 to 64 Years | 0 (0.0%) | 0 (0.0%) |
| 65 to 74 Years | 0 (0.0%) | 0 (0.0%) |
| 75 Years and over | 4 (36.4%) | 0 (0.0%) |
Disability Class: Vision Difficulty
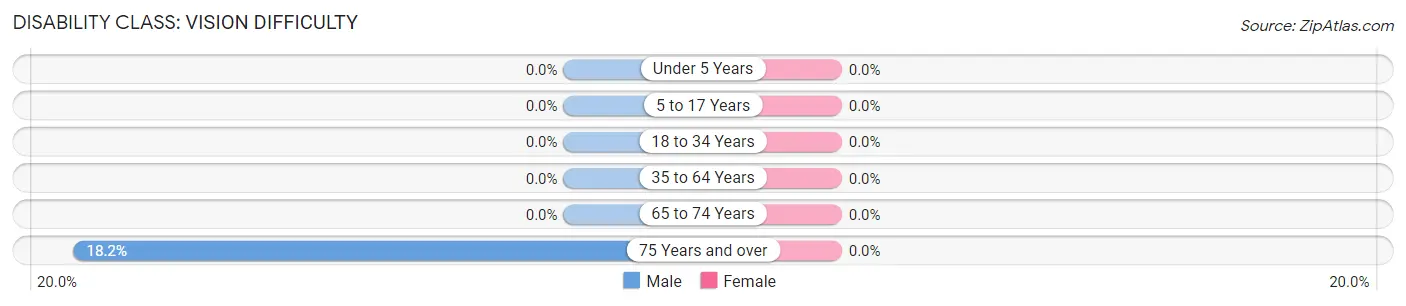
| Age Bracket | Male | Female |
| Under 5 Years | 0 (0.0%) | 0 (0.0%) |
| 5 to 17 Years | 0 (0.0%) | 0 (0.0%) |
| 18 to 34 Years | 0 (0.0%) | 0 (0.0%) |
| 35 to 64 Years | 0 (0.0%) | 0 (0.0%) |
| 65 to 74 Years | 0 (0.0%) | 0 (0.0%) |
| 75 Years and over | 2 (18.2%) | 0 (0.0%) |
Disability Class: Cognitive Difficulty
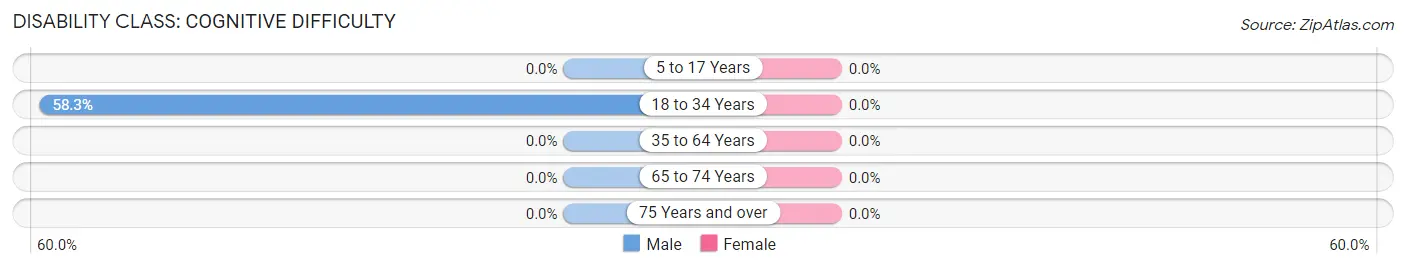
| Age Bracket | Male | Female |
| 5 to 17 Years | 0 (0.0%) | 0 (0.0%) |
| 18 to 34 Years | 7 (58.3%) | 0 (0.0%) |
| 35 to 64 Years | 0 (0.0%) | 0 (0.0%) |
| 65 to 74 Years | 0 (0.0%) | 0 (0.0%) |
| 75 Years and over | 0 (0.0%) | 0 (0.0%) |
Disability Class: Ambulatory Difficulty
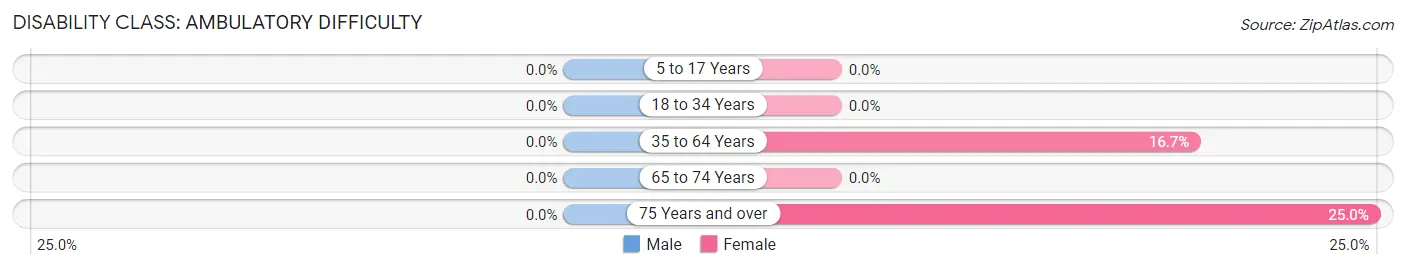
| Age Bracket | Male | Female |
| 5 to 17 Years | 0 (0.0%) | 0 (0.0%) |
| 18 to 34 Years | 0 (0.0%) | 0 (0.0%) |
| 35 to 64 Years | 0 (0.0%) | 5 (16.7%) |
| 65 to 74 Years | 0 (0.0%) | 0 (0.0%) |
| 75 Years and over | 0 (0.0%) | 2 (25.0%) |
Disability Class: Self-Care Difficulty
| Age Bracket | Male | Female |
| 5 to 17 Years | 0 (0.0%) | 0 (0.0%) |
| 18 to 34 Years | 0 (0.0%) | 0 (0.0%) |
| 35 to 64 Years | 0 (0.0%) | 0 (0.0%) |
| 65 to 74 Years | 0 (0.0%) | 0 (0.0%) |
| 75 Years and over | 0 (0.0%) | 0 (0.0%) |
Technology Access in Jordan Valley
Computing Device Access in Jordan Valley
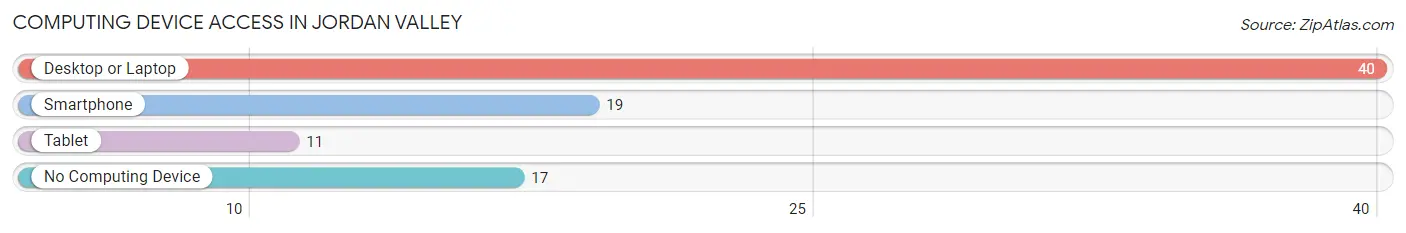
| Device Type | # Households | % Households |
| Desktop or Laptop | 40 | 70.2% |
| Smartphone | 19 | 33.3% |
| Tablet | 11 | 19.3% |
| No Computing Device | 17 | 29.8% |
| Total | 57 | 100.0% |
Internet Access in Jordan Valley
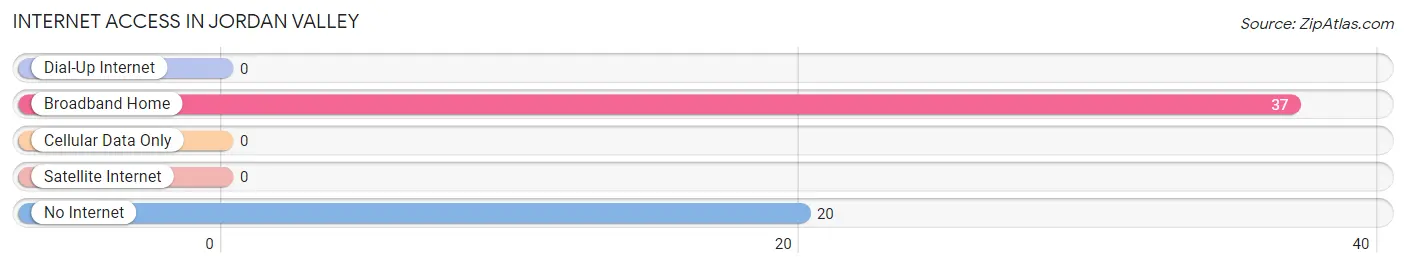
| Internet Type | # Households | % Households |
| Dial-Up Internet | 0 | 0.0% |
| Broadband Home | 37 | 64.9% |
| Cellular Data Only | 0 | 0.0% |
| Satellite Internet | 0 | 0.0% |
| No Internet | 20 | 35.1% |
| Total | 57 | 100.0% |
Jordan Valley Summary
Jordan Valley is a small unincorporated community located in Malheur County, Oregon, United States. It is situated in the high desert of southeastern Oregon, near the Idaho border. The population was estimated to be around 200 in 2020.
History
The area around Jordan Valley was first inhabited by the Northern Paiute people. The first non-native settlers arrived in the area in the late 1800s, and the town was officially established in 1887. The town was named after the nearby Jordan Creek, which was named after the biblical Jordan River.
The town was initially a farming and ranching community, and the local economy was largely based on the production of hay, wheat, and cattle. In the early 1900s, the town began to grow as a trading center for the surrounding area. The Jordan Valley Irrigation District was established in 1909, and the town was incorporated in 1910.
In the 1920s, the town began to experience a boom in population and economic activity. The Jordan Valley Bank was established in 1921, and the Jordan Valley Hotel was built in 1923. The town also became a popular tourist destination, and the Jordan Valley Golf Course was built in 1925.
Geography
Jordan Valley is located in southeastern Oregon, near the Idaho border. It is situated in the high desert of the Great Basin, at an elevation of 4,000 feet. The town is located on the banks of the Jordan Creek, which flows through the town and is a tributary of the Owyhee River.
The surrounding area is mostly flat, with some rolling hills. The climate is semi-arid, with hot summers and cold winters. The average annual precipitation is around 8 inches.
Economy
The economy of Jordan Valley is largely based on agriculture and tourism. The town is home to several farms and ranches, which produce hay, wheat, and cattle. The town is also a popular tourist destination, and the Jordan Valley Golf Course is a popular attraction.
The town is also home to several small businesses, including a grocery store, a hardware store, and a restaurant. The town also has a post office and a library.
Demographics
As of the 2010 census, the population of Jordan Valley was estimated to be around 200. The racial makeup of the town was 95.0% White, 0.5% Native American, 0.5% Asian, 0.5% from other races, and 3.5% from two or more races.
The median household income in Jordan Valley was $31,250, and the median family income was $37,500. The per capita income was $17,500. About 11.5% of the population was below the poverty line.
Conclusion
Jordan Valley is a small unincorporated community located in Malheur County, Oregon. It is situated in the high desert of southeastern Oregon, near the Idaho border. The town was established in 1887 and has a population of around 200. The economy of Jordan Valley is largely based on agriculture and tourism, and the town is home to several small businesses. The racial makeup of the town is mostly White, with a small percentage of Native American, Asian, and other races. The median household income in Jordan Valley is $31,250, and the per capita income is $17,500.
Common Questions
What is Per Capita Income in Jordan Valley?
Per Capita income in Jordan Valley is $25,031.
What is the Median Family Income in Jordan Valley?
Median Family Income in Jordan Valley is $63,750.
What is the Median Household income in Jordan Valley?
Median Household Income in Jordan Valley is $54,875.
What is Inequality or Gini Index in Jordan Valley?
Inequality or Gini Index in Jordan Valley is 0.27.
What is the Total Population of Jordan Valley?
Total Population of Jordan Valley is 164.
What is the Total Male Population of Jordan Valley?
Total Male Population of Jordan Valley is 108.
What is the Total Female Population of Jordan Valley?
Total Female Population of Jordan Valley is 56.
What is the Ratio of Males per 100 Females in Jordan Valley?
There are 192.86 Males per 100 Females in Jordan Valley.
What is the Ratio of Females per 100 Males in Jordan Valley?
There are 51.85 Females per 100 Males in Jordan Valley.
What is the Median Population Age in Jordan Valley?
Median Population Age in Jordan Valley is 49.0 Years.
What is the Average Family Size in Jordan Valley
Average Family Size in Jordan Valley is 3.4 People.
What is the Average Household Size in Jordan Valley
Average Household Size in Jordan Valley is 2.8 People.
How Large is the Labor Force in Jordan Valley?
There are 81 People in the Labor Forcein in Jordan Valley.
What is the Percentage of People in the Labor Force in Jordan Valley?
50.9% of People are in the Labor Force in Jordan Valley.
What is the Unemployment Rate in Jordan Valley?
Unemployment Rate in Jordan Valley is 4.9%.