Lookingglass, OR Map & Demographics
Lookingglass Map
Lookingglass Overview
$35,111
PER CAPITA INCOME
$62,500
AVG FAMILY INCOME
$68,088
AVG HOUSEHOLD INCOME
0.39
INEQUALITY / GINI INDEX
762
TOTAL POPULATION
385
MALE POPULATION
377
FEMALE POPULATION
102.12
MALES / 100 FEMALES
97.92
FEMALES / 100 MALES
62.7
MEDIAN AGE
2.6
AVG FAMILY SIZE
2.4
AVG HOUSEHOLD SIZE
262
LABOR FORCE [ PEOPLE ]
41.6%
PERCENT IN LABOR FORCE
14.9%
UNEMPLOYMENT RATE
Income in Lookingglass
Income Overview in Lookingglass
Per Capita Income in Lookingglass is $35,111, while median incomes of families and households are $62,500 and $68,088 respectively.
| Characteristic | Number | Measure |
| Per Capita Income | 762 | $35,111 |
| Median Family Income | 264 | $62,500 |
| Mean Family Income | 264 | $82,567 |
| Median Household Income | 312 | $68,088 |
| Mean Household Income | 312 | $85,050 |
| Income Deficit | 264 | $0 |
| Wage / Income Gap (%) | 762 | 0.00% |
| Wage / Income Gap ($) | 762 | 100.00¢ per $1 |
| Gini / Inequality Index | 762 | 0.39 |
Earnings by Sex in Lookingglass
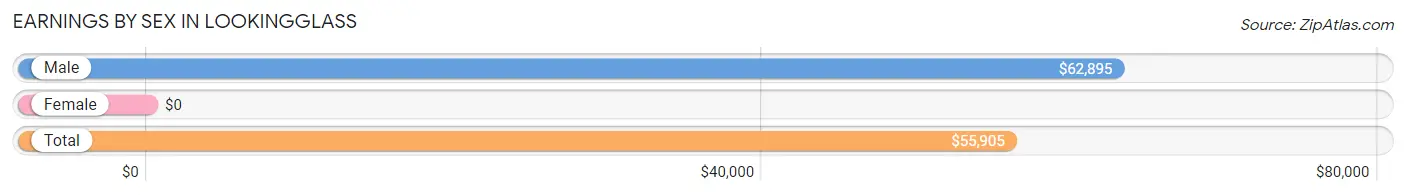
| Sex | Number | Average Earnings |
| Male | 144 (51.2%) | $62,895 |
| Female | 137 (48.7%) | $0 |
| Total | 281 (100.0%) | $55,905 |
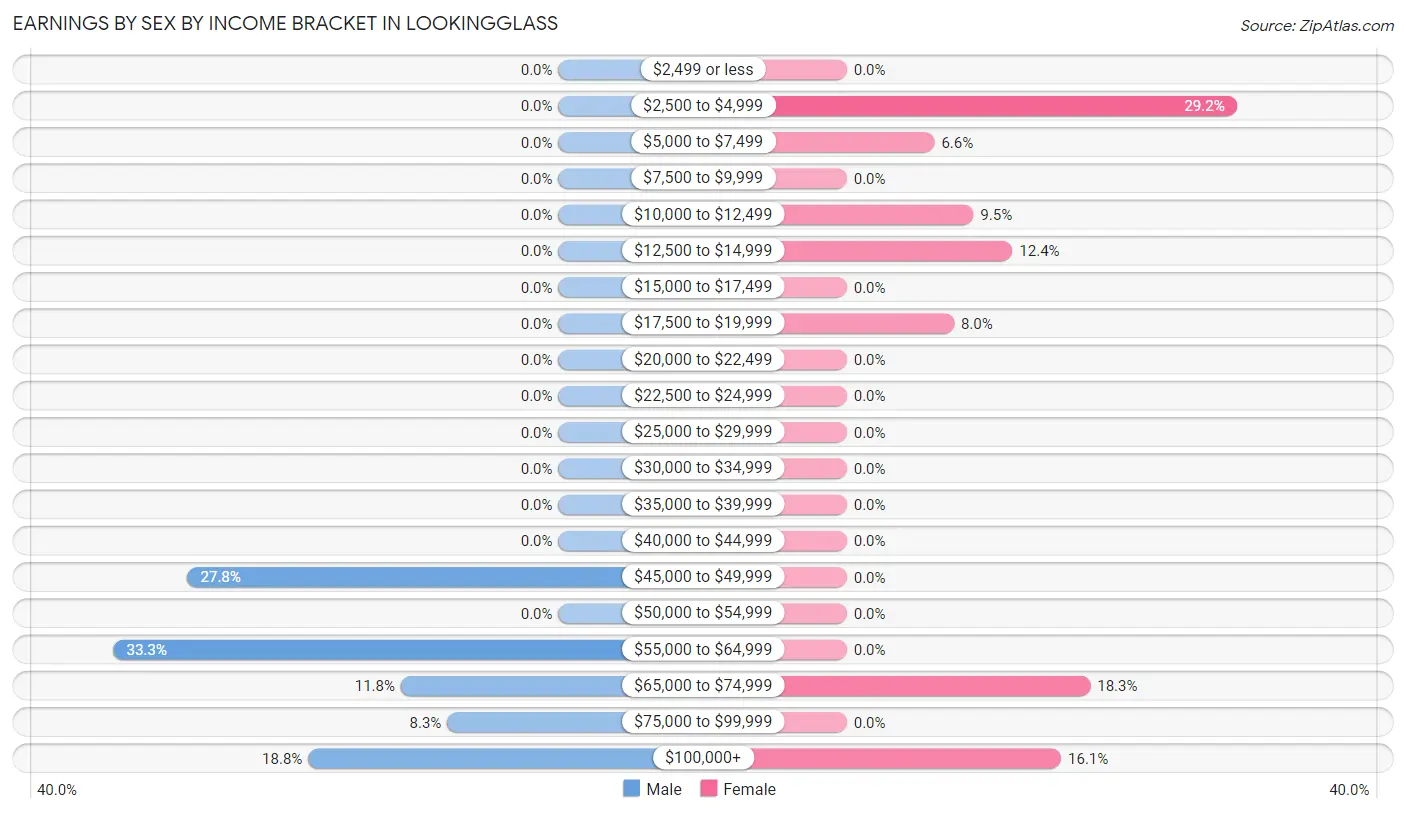
Earnings by Sex by Income Bracket in Lookingglass
The most common earnings brackets in Lookingglass are $55,000 to $64,999 for men (48 | 33.3%) and $2,500 to $4,999 for women (40 | 29.2%).
| Income | Male | Female |
| $2,499 or less | 0 (0.0%) | 0 (0.0%) |
| $2,500 to $4,999 | 0 (0.0%) | 40 (29.2%) |
| $5,000 to $7,499 | 0 (0.0%) | 9 (6.6%) |
| $7,500 to $9,999 | 0 (0.0%) | 0 (0.0%) |
| $10,000 to $12,499 | 0 (0.0%) | 13 (9.5%) |
| $12,500 to $14,999 | 0 (0.0%) | 17 (12.4%) |
| $15,000 to $17,499 | 0 (0.0%) | 0 (0.0%) |
| $17,500 to $19,999 | 0 (0.0%) | 11 (8.0%) |
| $20,000 to $22,499 | 0 (0.0%) | 0 (0.0%) |
| $22,500 to $24,999 | 0 (0.0%) | 0 (0.0%) |
| $25,000 to $29,999 | 0 (0.0%) | 0 (0.0%) |
| $30,000 to $34,999 | 0 (0.0%) | 0 (0.0%) |
| $35,000 to $39,999 | 0 (0.0%) | 0 (0.0%) |
| $40,000 to $44,999 | 0 (0.0%) | 0 (0.0%) |
| $45,000 to $49,999 | 40 (27.8%) | 0 (0.0%) |
| $50,000 to $54,999 | 0 (0.0%) | 0 (0.0%) |
| $55,000 to $64,999 | 48 (33.3%) | 0 (0.0%) |
| $65,000 to $74,999 | 17 (11.8%) | 25 (18.2%) |
| $75,000 to $99,999 | 12 (8.3%) | 0 (0.0%) |
| $100,000+ | 27 (18.8%) | 22 (16.1%) |
| Total | 144 (100.0%) | 137 (100.0%) |
Earnings by Sex by Educational Attainment in Lookingglass
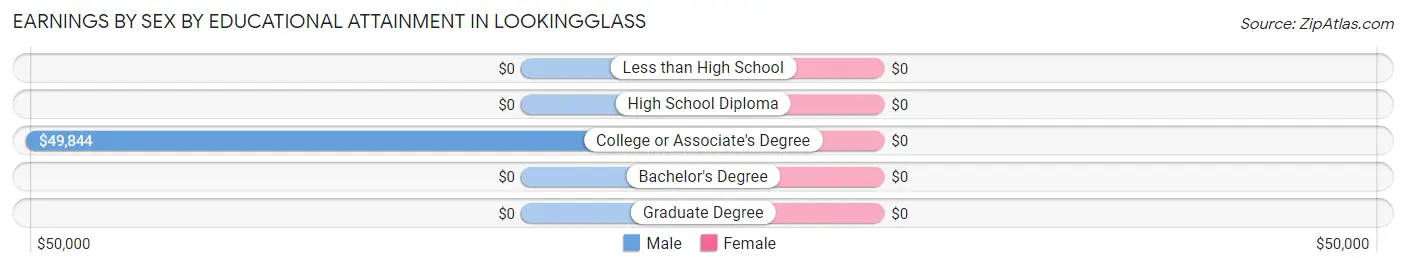
| Educational Attainment | Male Income | Female Income |
| Less than High School | - | - |
| High School Diploma | - | - |
| College or Associate's Degree | $49,844 | $0 |
| Bachelor's Degree | - | - |
| Graduate Degree | - | - |
| Total | $57,026 | $0 |
Family Income in Lookingglass
Family Income Brackets in Lookingglass
According to the Lookingglass family income data, there are 76 families falling into the $35,000 to $49,999 income range, which is the most common income bracket and makes up 28.8% of all families.
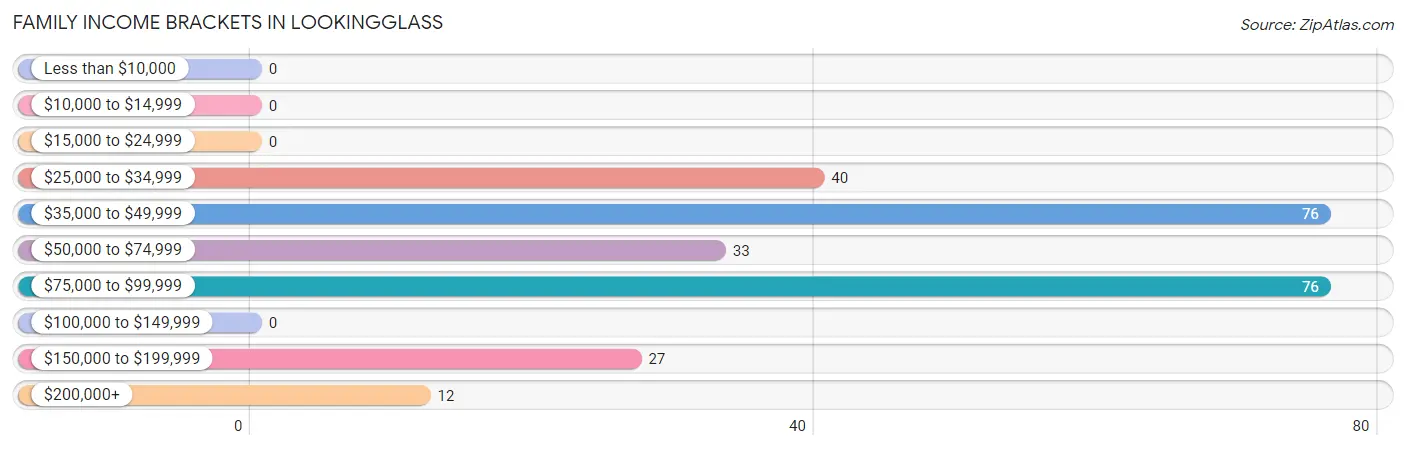
| Income Bracket | # Families | % Families |
| Less than $10,000 | 0 | 0.0% |
| $10,000 to $14,999 | 0 | 0.0% |
| $15,000 to $24,999 | 0 | 0.0% |
| $25,000 to $34,999 | 40 | 15.2% |
| $35,000 to $49,999 | 76 | 28.8% |
| $50,000 to $74,999 | 33 | 12.5% |
| $75,000 to $99,999 | 76 | 28.8% |
| $100,000 to $149,999 | 0 | 0.0% |
| $150,000 to $199,999 | 27 | 10.2% |
| $200,000+ | 12 | 4.5% |
Family Income by Famaliy Size in Lookingglass
2-person families (212 | 80.3%) account for the highest median family income in Lookingglass with $49,359 per family, while 2-person families (212 | 80.3%) have the highest median income of $24,680 per family member.
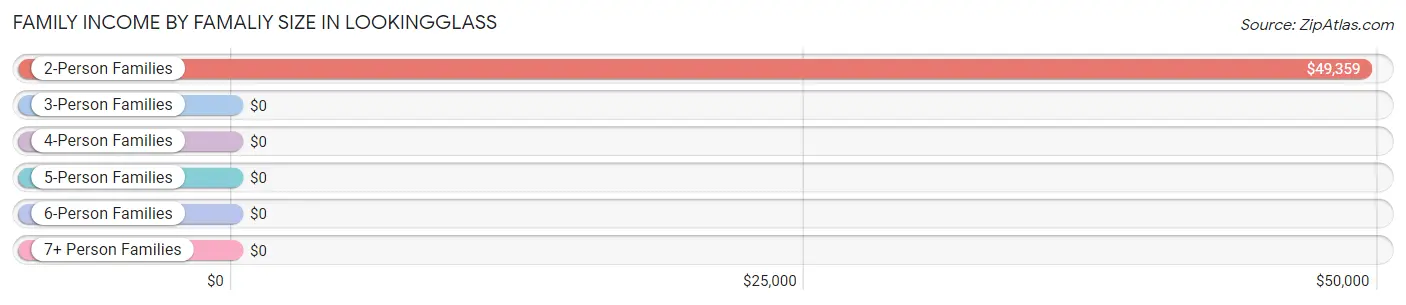
| Income Bracket | # Families | Median Income |
| 2-Person Families | 212 (80.3%) | $49,359 |
| 3-Person Families | 25 (9.5%) | $0 |
| 4-Person Families | 0 (0.0%) | $0 |
| 5-Person Families | 0 (0.0%) | $0 |
| 6-Person Families | 27 (10.2%) | $0 |
| 7+ Person Families | 0 (0.0%) | $0 |
| Total | 264 (100.0%) | $62,500 |
Family Income by Number of Earners in Lookingglass
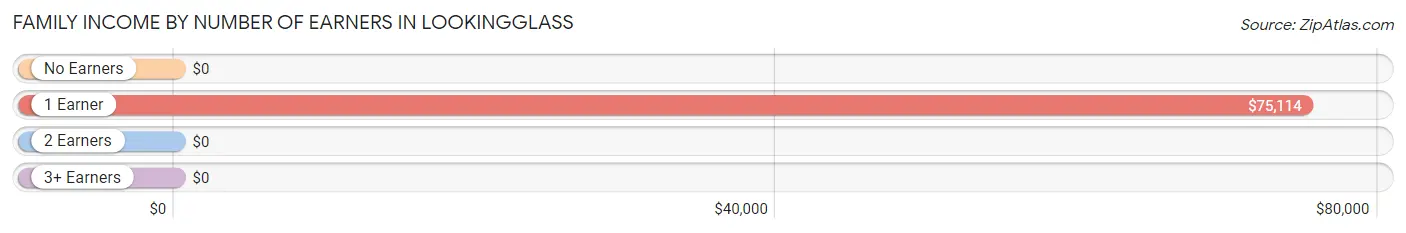
| Number of Earners | # Families | Median Income |
| No Earners | 75 (28.4%) | $0 |
| 1 Earner | 149 (56.4%) | $75,114 |
| 2 Earners | 40 (15.1%) | $0 |
| 3+ Earners | 0 (0.0%) | $0 |
| Total | 264 (100.0%) | $62,500 |
Household Income in Lookingglass
Household Income Brackets in Lookingglass
With 95 households falling in the category, the $75,000 to $99,999 income range is the most frequent in Lookingglass, accounting for 30.4% of all households.
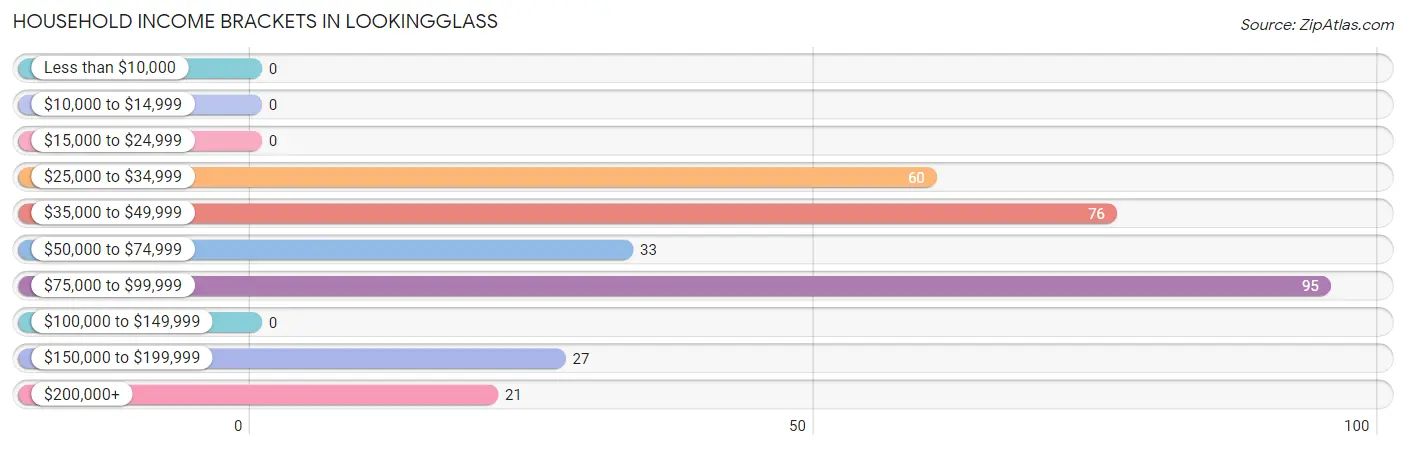
| Income Bracket | # Households | % Households |
| Less than $10,000 | 0 | 0.0% |
| $10,000 to $14,999 | 0 | 0.0% |
| $15,000 to $24,999 | 0 | 0.0% |
| $25,000 to $34,999 | 60 | 19.2% |
| $35,000 to $49,999 | 76 | 24.4% |
| $50,000 to $74,999 | 33 | 10.6% |
| $75,000 to $99,999 | 95 | 30.4% |
| $100,000 to $149,999 | 0 | 0.0% |
| $150,000 to $199,999 | 27 | 8.7% |
| $200,000+ | 21 | 6.7% |
Household Income by Householder Age in Lookingglass
The median household income in Lookingglass is $68,088, with the highest median household income of $68,750 found in the 45 to 64 years age bracket for the primary householder. A total of 97 households (31.1%) fall into this category.
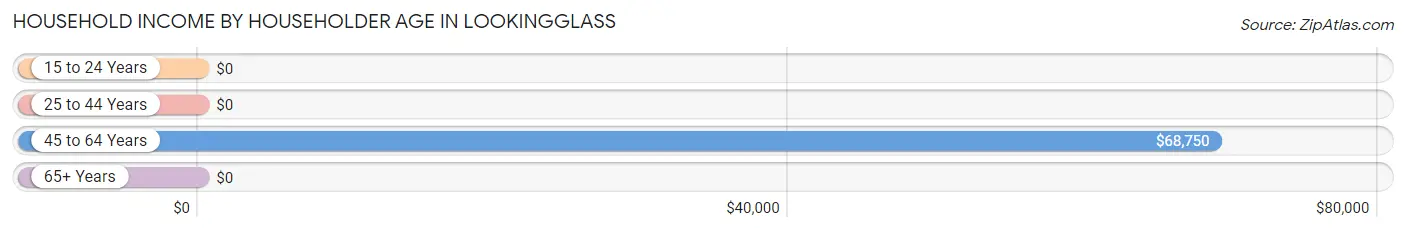
| Income Bracket | # Households | Median Income |
| 15 to 24 Years | 0 (0.0%) | $0 |
| 25 to 44 Years | 43 (13.8%) | $0 |
| 45 to 64 Years | 97 (31.1%) | $68,750 |
| 65+ Years | 172 (55.1%) | $0 |
| Total | 312 (100.0%) | $68,088 |
Poverty in Lookingglass
Income Below Poverty by Sex and Age in Lookingglass
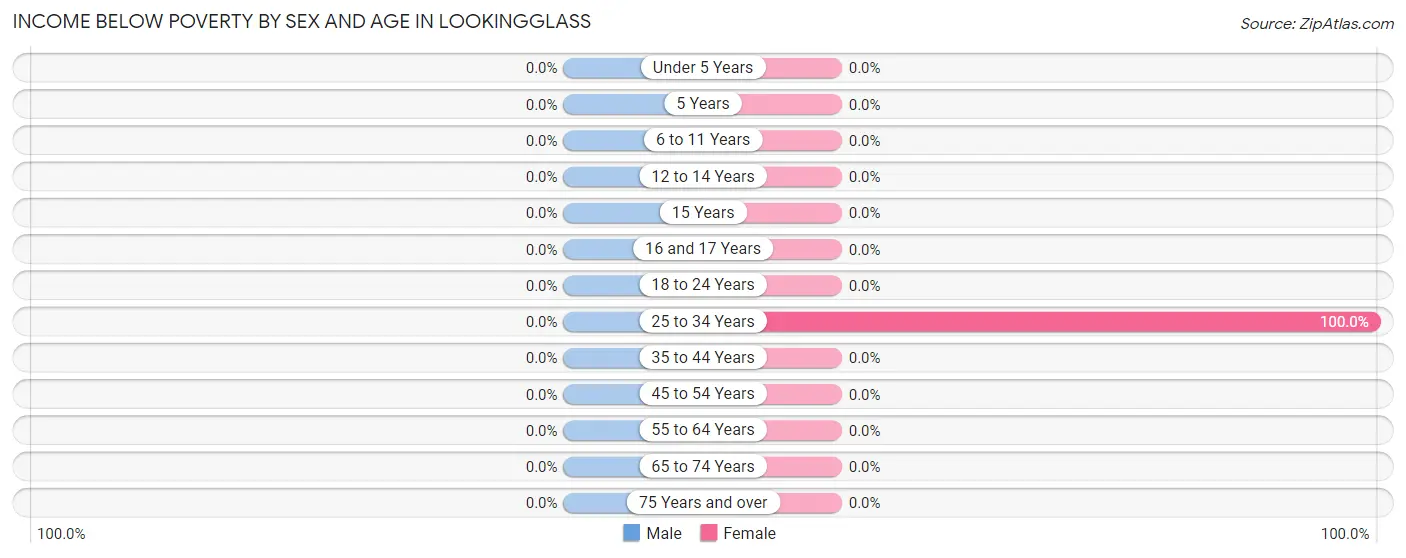
| Age Bracket | Male | Female |
| Under 5 Years | 0 (0.0%) | 0 (0.0%) |
| 5 Years | 0 (0.0%) | 0 (0.0%) |
| 6 to 11 Years | 0 (0.0%) | 0 (0.0%) |
| 12 to 14 Years | 0 (0.0%) | 0 (0.0%) |
| 15 Years | 0 (0.0%) | 0 (0.0%) |
| 16 and 17 Years | 0 (0.0%) | 0 (0.0%) |
| 18 to 24 Years | 0 (0.0%) | 0 (0.0%) |
| 25 to 34 Years | 0 (0.0%) | 21 (100.0%) |
| 35 to 44 Years | 0 (0.0%) | 0 (0.0%) |
| 45 to 54 Years | 0 (0.0%) | 0 (0.0%) |
| 55 to 64 Years | 0 (0.0%) | 0 (0.0%) |
| 65 to 74 Years | 0 (0.0%) | 0 (0.0%) |
| 75 Years and over | 0 (0.0%) | 0 (0.0%) |
| Total | 0 (0.0%) | 21 (5.6%) |
Income Above Poverty by Sex and Age in Lookingglass
According to the poverty statistics in Lookingglass, males aged 5 years and females aged under 5 years are the age groups that are most secure financially, with 100.0% of males and 100.0% of females in these age groups living above the poverty line.
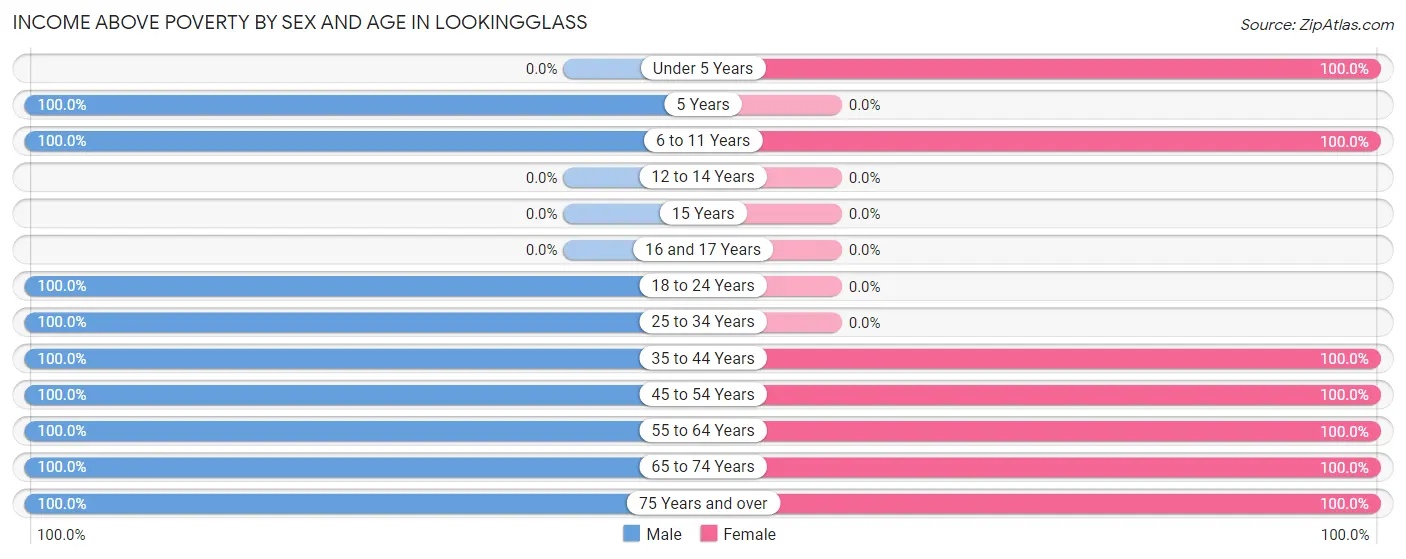
| Age Bracket | Male | Female |
| Under 5 Years | 0 (0.0%) | 52 (100.0%) |
| 5 Years | 28 (100.0%) | 0 (0.0%) |
| 6 to 11 Years | 28 (100.0%) | 24 (100.0%) |
| 12 to 14 Years | 0 (0.0%) | 0 (0.0%) |
| 15 Years | 0 (0.0%) | 0 (0.0%) |
| 16 and 17 Years | 0 (0.0%) | 0 (0.0%) |
| 18 to 24 Years | 17 (100.0%) | 0 (0.0%) |
| 25 to 34 Years | 27 (100.0%) | 0 (0.0%) |
| 35 to 44 Years | 27 (100.0%) | 25 (100.0%) |
| 45 to 54 Years | 13 (100.0%) | 13 (100.0%) |
| 55 to 64 Years | 48 (100.0%) | 77 (100.0%) |
| 65 to 74 Years | 62 (100.0%) | 44 (100.0%) |
| 75 Years and over | 135 (100.0%) | 121 (100.0%) |
| Total | 385 (100.0%) | 356 (94.4%) |
Income Below Poverty Among Married-Couple Families in Lookingglass
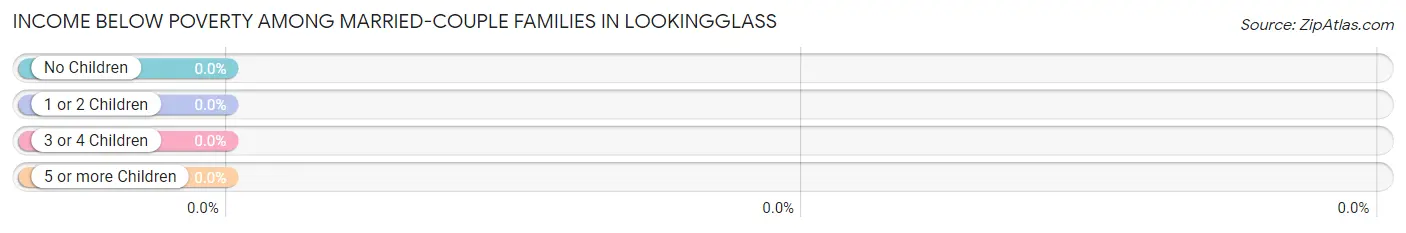
| Children | Above Poverty | Below Poverty |
| No Children | 152 (100.0%) | 0 (0.0%) |
| 1 or 2 Children | 0 (0.0%) | 0 (0.0%) |
| 3 or 4 Children | 27 (100.0%) | 0 (0.0%) |
| 5 or more Children | 0 (0.0%) | 0 (0.0%) |
| Total | 179 (100.0%) | 0 (0.0%) |
Income Below Poverty Among Single-Parent Households in Lookingglass
| Children | Single Father | Single Mother |
| No Children | 0 (0.0%) | 0 (0.0%) |
| 1 or 2 Children | 0 (0.0%) | 0 (0.0%) |
| 3 or 4 Children | 0 (0.0%) | 0 (0.0%) |
| 5 or more Children | 0 (0.0%) | 0 (0.0%) |
| Total | 0 (0.0%) | 0 (0.0%) |
Income Below Poverty Among Married-Couple vs Single-Parent Households in Lookingglass
| Children | Married-Couple Families | Single-Parent Households |
| No Children | 0 (0.0%) | 0 (0.0%) |
| 1 or 2 Children | 0 (0.0%) | 0 (0.0%) |
| 3 or 4 Children | 0 (0.0%) | 0 (0.0%) |
| 5 or more Children | 0 (0.0%) | 0 (0.0%) |
| Total | 0 (0.0%) | 0 (0.0%) |
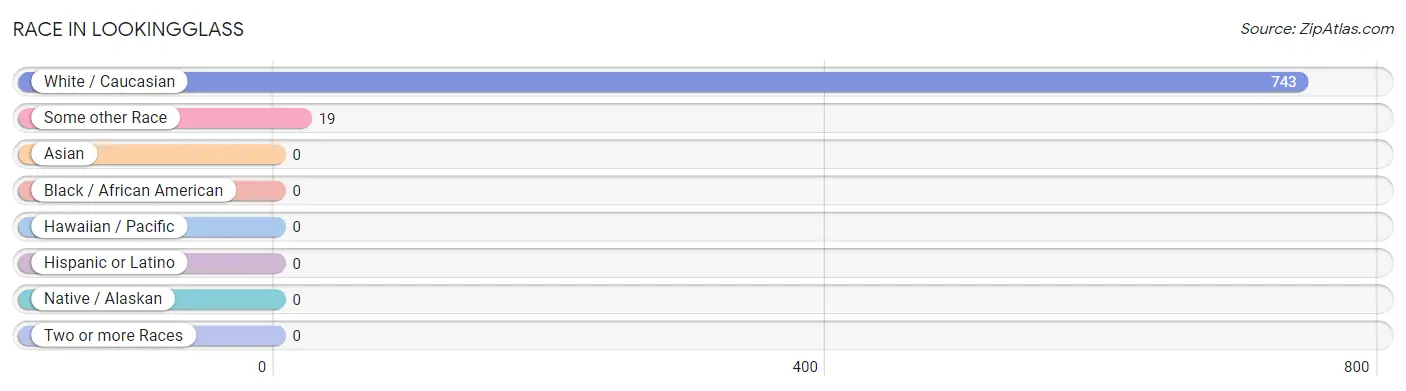
Race in Lookingglass
The most populous races in Lookingglass are White / Caucasian (743 | 97.5%), and Some other Race (19 | 2.5%).
| Race | # Population | % Population |
| Asian | 0 | 0.0% |
| Black / African American | 0 | 0.0% |
| Hawaiian / Pacific | 0 | 0.0% |
| Hispanic or Latino | 0 | 0.0% |
| Native / Alaskan | 0 | 0.0% |
| White / Caucasian | 743 | 97.5% |
| Two or more Races | 0 | 0.0% |
| Some other Race | 19 | 2.5% |
| Total | 762 | 100.0% |
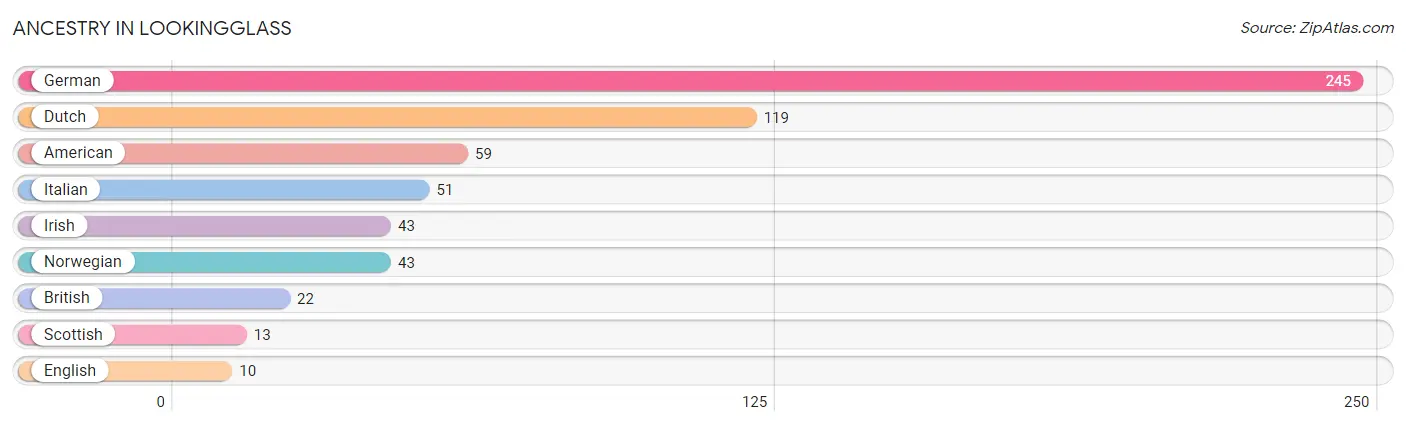
Ancestry in Lookingglass
The most populous ancestries reported in Lookingglass are German (245 | 32.2%), Dutch (119 | 15.6%), American (59 | 7.7%), Italian (51 | 6.7%), and Irish (43 | 5.6%), together accounting for 67.8% of all Lookingglass residents.
| Ancestry | # Population | % Population |
| American | 59 | 7.7% |
| British | 22 | 2.9% |
| Dutch | 119 | 15.6% |
| English | 10 | 1.3% |
| German | 245 | 32.2% |
| Irish | 43 | 5.6% |
| Italian | 51 | 6.7% |
| Norwegian | 43 | 5.6% |
| Scottish | 13 | 1.7% | View All 9 Rows |
Immigrants in Lookingglass

| Immigration Origin | # Population | % Population | View All 0 Rows |
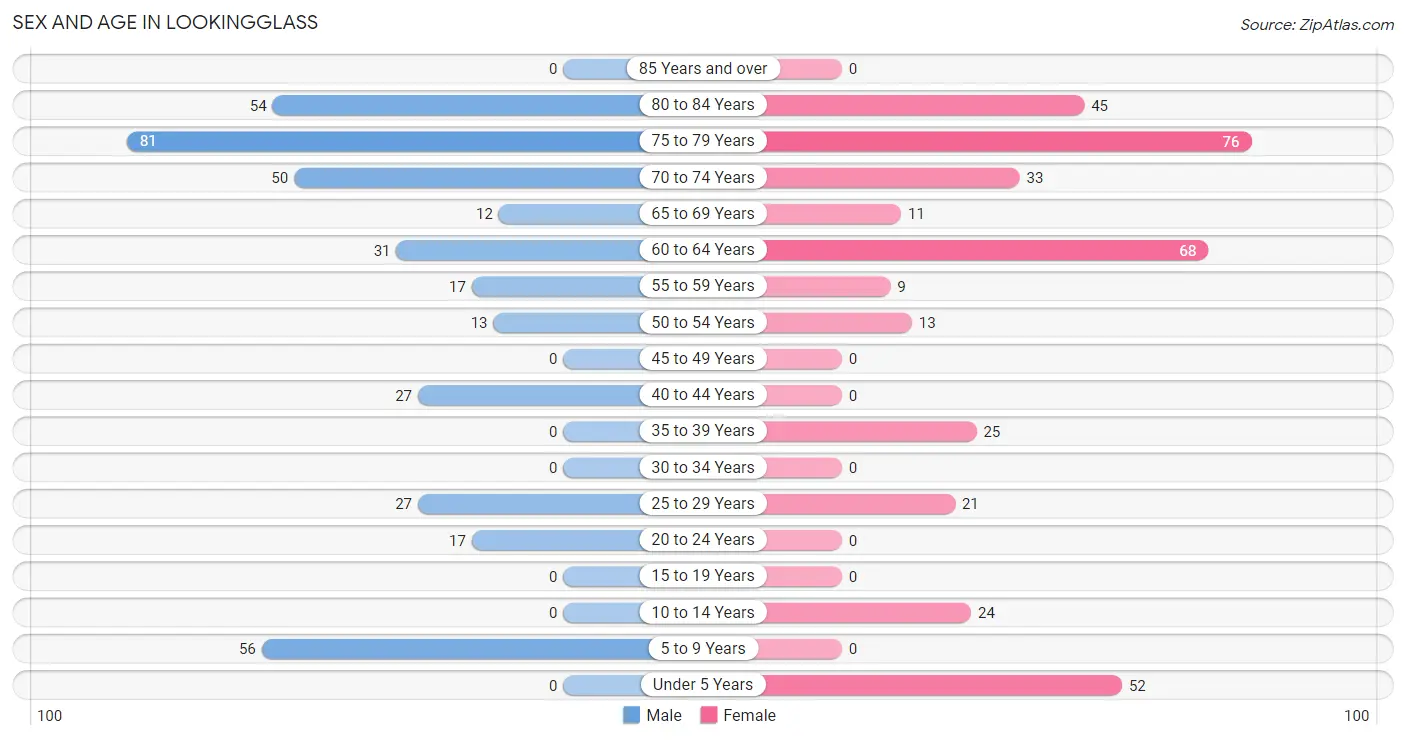
Sex and Age in Lookingglass
Sex and Age in Lookingglass
The most populous age groups in Lookingglass are 75 to 79 Years (81 | 21.0%) for men and 75 to 79 Years (76 | 20.2%) for women.
| Age Bracket | Male | Female |
| Under 5 Years | 0 (0.0%) | 52 (13.8%) |
| 5 to 9 Years | 56 (14.5%) | 0 (0.0%) |
| 10 to 14 Years | 0 (0.0%) | 24 (6.4%) |
| 15 to 19 Years | 0 (0.0%) | 0 (0.0%) |
| 20 to 24 Years | 17 (4.4%) | 0 (0.0%) |
| 25 to 29 Years | 27 (7.0%) | 21 (5.6%) |
| 30 to 34 Years | 0 (0.0%) | 0 (0.0%) |
| 35 to 39 Years | 0 (0.0%) | 25 (6.6%) |
| 40 to 44 Years | 27 (7.0%) | 0 (0.0%) |
| 45 to 49 Years | 0 (0.0%) | 0 (0.0%) |
| 50 to 54 Years | 13 (3.4%) | 13 (3.5%) |
| 55 to 59 Years | 17 (4.4%) | 9 (2.4%) |
| 60 to 64 Years | 31 (8.1%) | 68 (18.0%) |
| 65 to 69 Years | 12 (3.1%) | 11 (2.9%) |
| 70 to 74 Years | 50 (13.0%) | 33 (8.7%) |
| 75 to 79 Years | 81 (21.0%) | 76 (20.2%) |
| 80 to 84 Years | 54 (14.0%) | 45 (11.9%) |
| 85 Years and over | 0 (0.0%) | 0 (0.0%) |
| Total | 385 (100.0%) | 377 (100.0%) |
Families and Households in Lookingglass
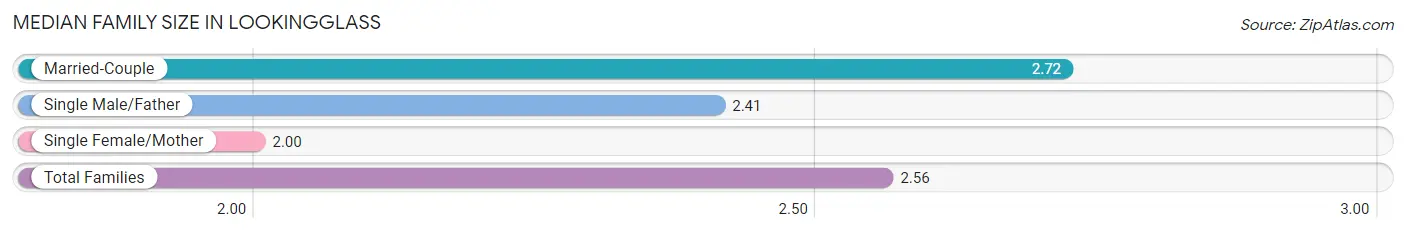
Median Family Size in Lookingglass
The median family size in Lookingglass is 2.56 persons per family, with married-couple families (179 | 67.8%) accounting for the largest median family size of 2.72 persons per family. On the other hand, single female/mother families (39 | 14.8%) represent the smallest median family size with 2.00 persons per family.
| Family Type | # Families | Family Size |
| Married-Couple | 179 (67.8%) | 2.72 |
| Single Male/Father | 46 (17.4%) | 2.41 |
| Single Female/Mother | 39 (14.8%) | 2.00 |
| Total Families | 264 (100.0%) | 2.56 |
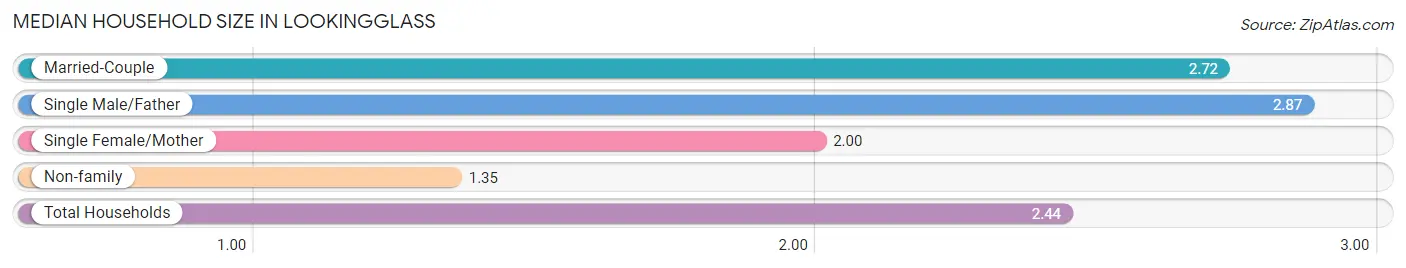
Median Household Size in Lookingglass
The median household size in Lookingglass is 2.44 persons per household, with single male/father households (46 | 14.7%) accounting for the largest median household size of 2.87 persons per household. non-family households (48 | 15.4%) represent the smallest median household size with 1.35 persons per household.
| Household Type | # Households | Household Size |
| Married-Couple | 179 (57.4%) | 2.72 |
| Single Male/Father | 46 (14.7%) | 2.87 |
| Single Female/Mother | 39 (12.5%) | 2.00 |
| Non-family | 48 (15.4%) | 1.35 |
| Total Households | 312 (100.0%) | 2.44 |
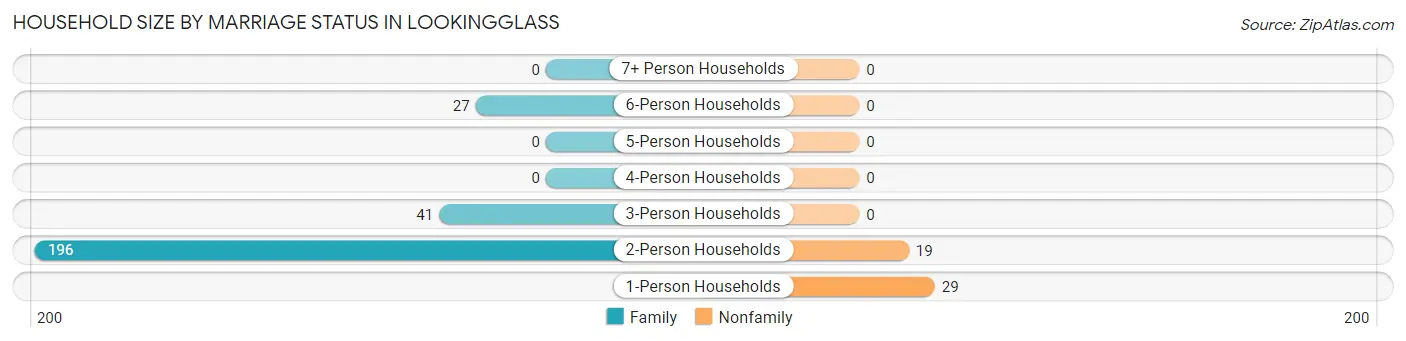
Household Size by Marriage Status in Lookingglass
Out of a total of 312 households in Lookingglass, 264 (84.6%) are family households, while 48 (15.4%) are nonfamily households. The most numerous type of family households are 2-person households, comprising 196, and the most common type of nonfamily households are 1-person households, comprising 29.
| Household Size | Family Households | Nonfamily Households |
| 1-Person Households | - | 29 (9.3%) |
| 2-Person Households | 196 (62.8%) | 19 (6.1%) |
| 3-Person Households | 41 (13.1%) | 0 (0.0%) |
| 4-Person Households | 0 (0.0%) | 0 (0.0%) |
| 5-Person Households | 0 (0.0%) | 0 (0.0%) |
| 6-Person Households | 27 (8.6%) | 0 (0.0%) |
| 7+ Person Households | 0 (0.0%) | 0 (0.0%) |
| Total | 264 (84.6%) | 48 (15.4%) |
Female Fertility in Lookingglass
Fertility by Age in Lookingglass
| Age Bracket | Women with Births | Births / 1,000 Women |
| 15 to 19 years | 0 (0.0%) | 0.0 |
| 20 to 34 years | 0 (0.0%) | 0.0 |
| 35 to 50 years | 0 (0.0%) | 0.0 |
| Total | 0 (0.0%) | 0.0 |
Fertility by Age by Marriage Status in Lookingglass
| Age Bracket | Married | Unmarried |
| 15 to 19 years | 0 (0.0%) | 0 (0.0%) |
| 20 to 34 years | 0 (0.0%) | 0 (0.0%) |
| 35 to 50 years | 0 (0.0%) | 0 (0.0%) |
| Total | 0 (0.0%) | 0 (0.0%) |
Fertility by Education in Lookingglass
| Educational Attainment | Women with Births | Births / 1,000 Women |
| Less than High School | 0 (0.0%) | 0.0 |
| High School Diploma | 0 (0.0%) | 0.0 |
| College or Associate's Degree | 0 (0.0%) | 0.0 |
| Bachelor's Degree | 0 (0.0%) | 0.0 |
| Graduate Degree | 0 (0.0%) | 0.0 |
| Total | 0 (0.0%) | 0.0 |
Fertility by Education by Marriage Status in Lookingglass
| Educational Attainment | Married | Unmarried |
| Less than High School | 0 (0.0%) | 0 (0.0%) |
| High School Diploma | 0 (0.0%) | 0 (0.0%) |
| College or Associate's Degree | 0 (0.0%) | 0 (0.0%) |
| Bachelor's Degree | 0 (0.0%) | 0 (0.0%) |
| Graduate Degree | 0 (0.0%) | 0 (0.0%) |
| Total | 0 (0.0%) | 0 (0.0%) |
Employment Characteristics in Lookingglass
Employment by Class of Employer in Lookingglass
Among the 212 employed individuals in Lookingglass, self-employed (not incorporated) (78 | 36.8%), private company employees (45 | 21.2%), and not-for-profit organizations (40 | 18.9%) make up the most common classes of employment.
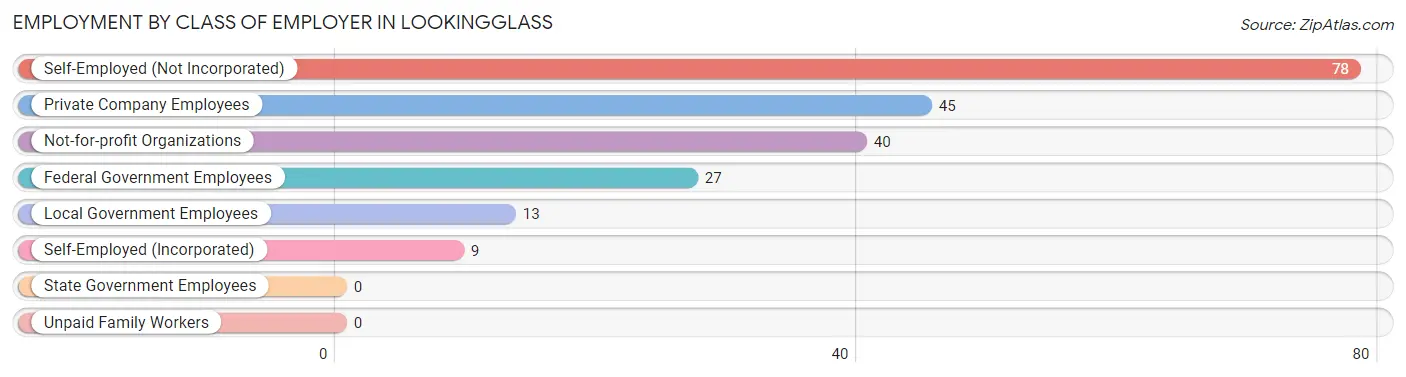
| Employer Class | # Employees | % Employees |
| Private Company Employees | 45 | 21.2% |
| Self-Employed (Incorporated) | 9 | 4.3% |
| Self-Employed (Not Incorporated) | 78 | 36.8% |
| Not-for-profit Organizations | 40 | 18.9% |
| Local Government Employees | 13 | 6.1% |
| State Government Employees | 0 | 0.0% |
| Federal Government Employees | 27 | 12.7% |
| Unpaid Family Workers | 0 | 0.0% |
| Total | 212 | 100.0% |
Employment Status by Age in Lookingglass
According to the labor force statistics for Lookingglass, out of the total population over 16 years of age (630), 41.6% or 262 individuals are in the labor force, with 14.9% or 39 of them unemployed. The age group with the highest labor force participation rate is 20 to 24 years, with 100.0% or 17 individuals in the labor force. Within the labor force, the 55 to 59 years age range has the highest percentage of unemployed individuals, with 65.4% or 17 of them being unemployed.
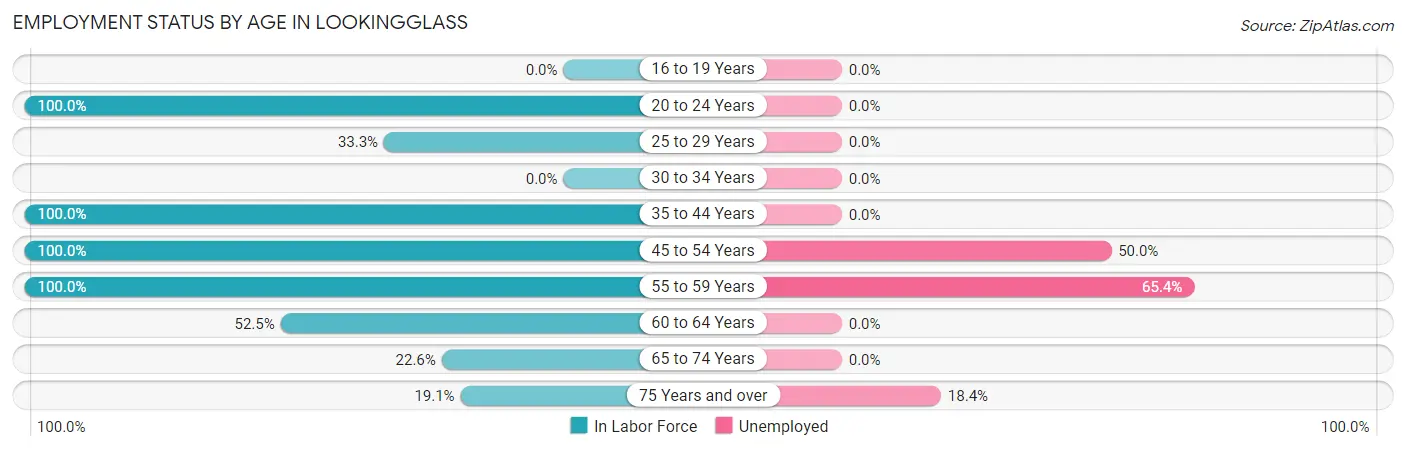
| Age Bracket | In Labor Force | Unemployed |
| 16 to 19 Years | 0 (0.0%) | 0 (0.0%) |
| 20 to 24 Years | 17 (100.0%) | 0 (0.0%) |
| 25 to 29 Years | 16 (33.3%) | 0 (0.0%) |
| 30 to 34 Years | 0 (0.0%) | 0 (0.0%) |
| 35 to 44 Years | 52 (100.0%) | 0 (0.0%) |
| 45 to 54 Years | 26 (100.0%) | 13 (50.0%) |
| 55 to 59 Years | 26 (100.0%) | 17 (65.4%) |
| 60 to 64 Years | 52 (52.5%) | 0 (0.0%) |
| 65 to 74 Years | 24 (22.6%) | 0 (0.0%) |
| 75 Years and over | 49 (19.1%) | 9 (18.4%) |
| Total | 262 (41.6%) | 39 (14.9%) |
Employment Status by Educational Attainment in Lookingglass
According to labor force statistics for Lookingglass, 68.5% of individuals (172) out of the total population between 25 and 64 years of age (251) are in the labor force, with 17.4% or 30 of them being unemployed. The group with the highest labor force participation rate are those with the educational attainment of bachelor's degree or higher, with 84.7% or 61 individuals in the labor force. Within the labor force, individuals with high school diploma education have the highest percentage of unemployment, with 34.2% or 13 of them being unemployed.
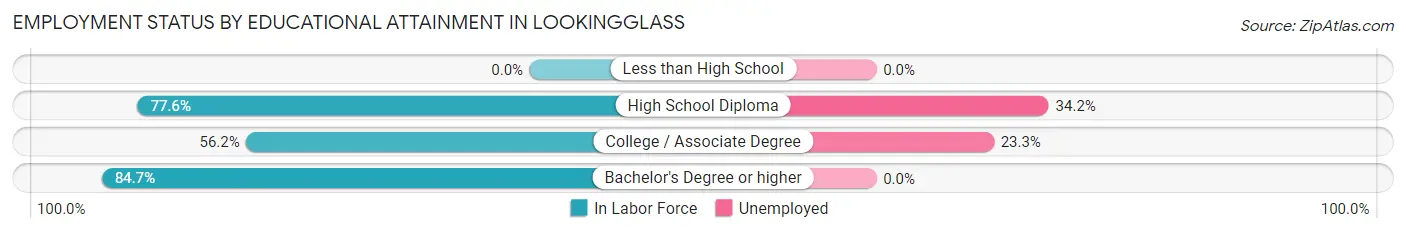
| Educational Attainment | In Labor Force | Unemployed |
| Less than High School | 0 (0.0%) | 0 (0.0%) |
| High School Diploma | 38 (77.6%) | 17 (34.2%) |
| College / Associate Degree | 73 (56.2%) | 30 (23.3%) |
| Bachelor's Degree or higher | 61 (84.7%) | 0 (0.0%) |
| Total | 172 (68.5%) | 44 (17.4%) |
Employment Occupations by Sex in Lookingglass
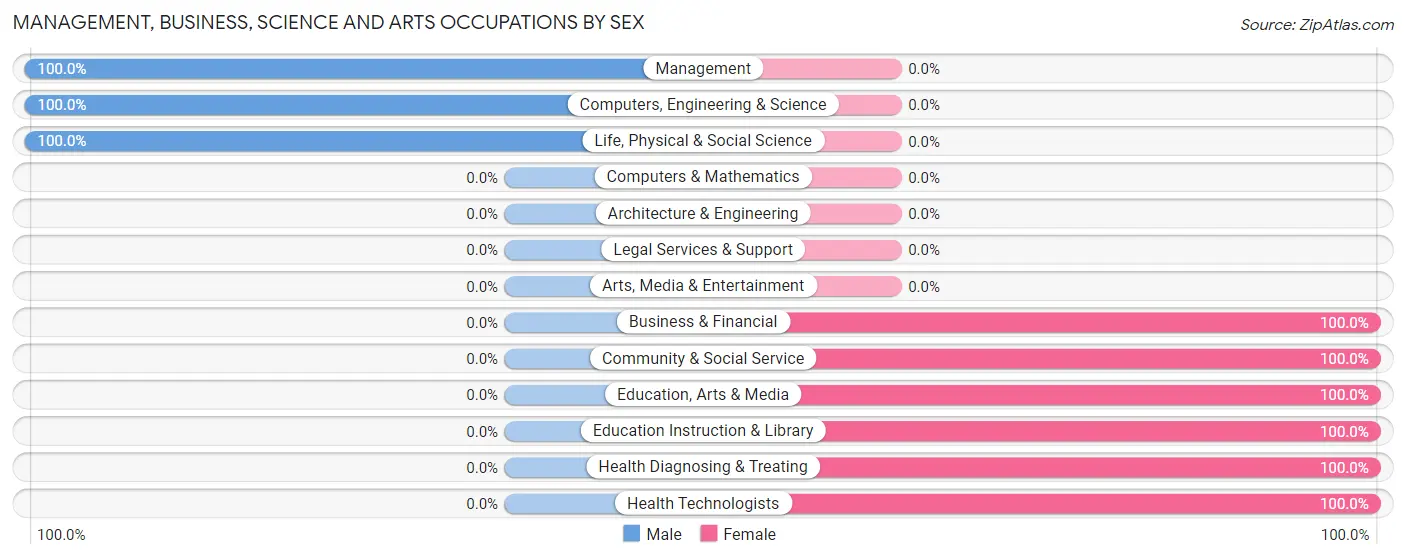
Management, Business, Science and Arts Occupations
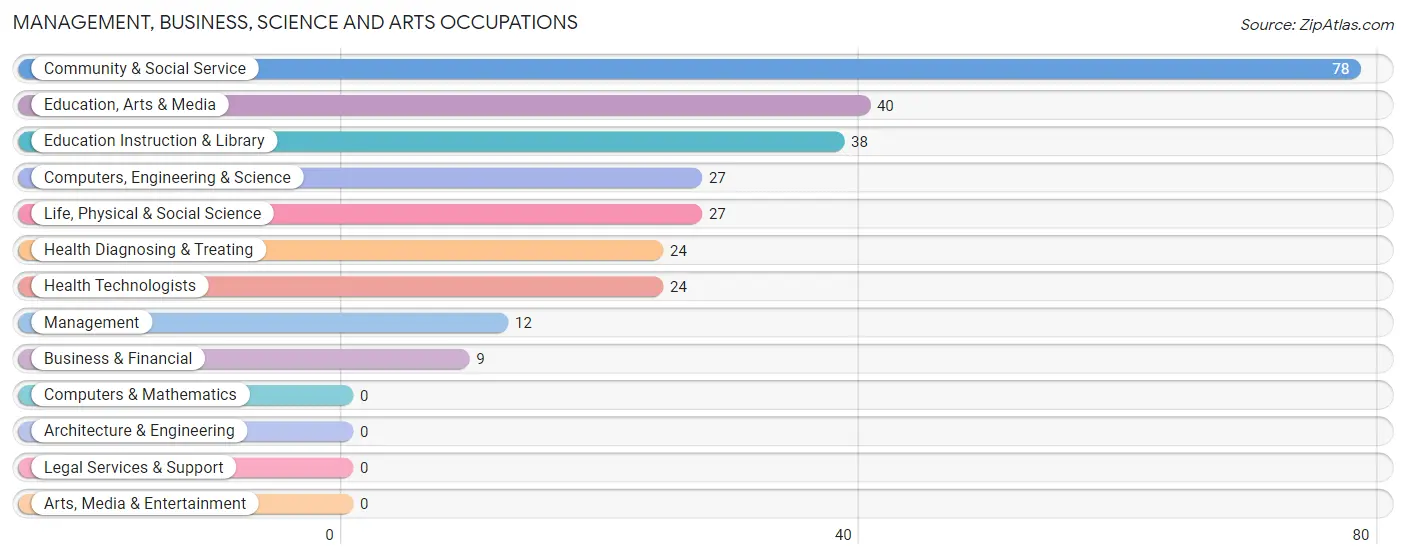
The most common Management, Business, Science and Arts occupations in Lookingglass are Community & Social Service (78 | 35.0%), Education, Arts & Media (40 | 17.9%), Education Instruction & Library (38 | 17.0%), Computers, Engineering & Science (27 | 12.1%), and Life, Physical & Social Science (27 | 12.1%).
Management, Business, Science and Arts Occupations by Sex
Within the Management, Business, Science and Arts occupations in Lookingglass, the most male-oriented occupations are Management (100.0%), Computers, Engineering & Science (100.0%), and Life, Physical & Social Science (100.0%), while the most female-oriented occupations are Business & Financial (100.0%), Community & Social Service (100.0%), and Education, Arts & Media (100.0%).
| Occupation | Male | Female |
| Management | 12 (100.0%) | 0 (0.0%) |
| Business & Financial | 0 (0.0%) | 9 (100.0%) |
| Computers, Engineering & Science | 27 (100.0%) | 0 (0.0%) |
| Computers & Mathematics | 0 (0.0%) | 0 (0.0%) |
| Architecture & Engineering | 0 (0.0%) | 0 (0.0%) |
| Life, Physical & Social Science | 27 (100.0%) | 0 (0.0%) |
| Community & Social Service | 0 (0.0%) | 78 (100.0%) |
| Education, Arts & Media | 0 (0.0%) | 40 (100.0%) |
| Legal Services & Support | 0 (0.0%) | 0 (0.0%) |
| Education Instruction & Library | 0 (0.0%) | 38 (100.0%) |
| Arts, Media & Entertainment | 0 (0.0%) | 0 (0.0%) |
| Health Diagnosing & Treating | 0 (0.0%) | 24 (100.0%) |
| Health Technologists | 0 (0.0%) | 24 (100.0%) |
| Total (Category) | 39 (26.0%) | 111 (74.0%) |
| Total (Overall) | 112 (50.2%) | 111 (49.8%) |
Services Occupations
Services Occupations by Sex
| Occupation | Male | Female |
| Healthcare Support | 0 (0.0%) | 0 (0.0%) |
| Security & Protection | 0 (0.0%) | 0 (0.0%) |
| Firefighting & Prevention | 0 (0.0%) | 0 (0.0%) |
| Law Enforcement | 0 (0.0%) | 0 (0.0%) |
| Food Preparation & Serving | 0 (0.0%) | 0 (0.0%) |
| Cleaning & Maintenance | 0 (0.0%) | 0 (0.0%) |
| Personal Care & Service | 0 (0.0%) | 0 (0.0%) |
| Total (Category) | 0 (0.0%) | 0 (0.0%) |
| Total (Overall) | 112 (50.2%) | 111 (49.8%) |
Sales and Office Occupations
Sales and Office Occupations by Sex
| Occupation | Male | Female |
| Sales & Related | 0 (0.0%) | 0 (0.0%) |
| Office & Administration | 0 (0.0%) | 0 (0.0%) |
| Total (Category) | 0 (0.0%) | 0 (0.0%) |
| Total (Overall) | 112 (50.2%) | 111 (49.8%) |
Natural Resources, Construction and Maintenance Occupations
The most common Natural Resources, Construction and Maintenance occupations in Lookingglass are , and Installation, Maintenance & Repair (16 | 7.2%).
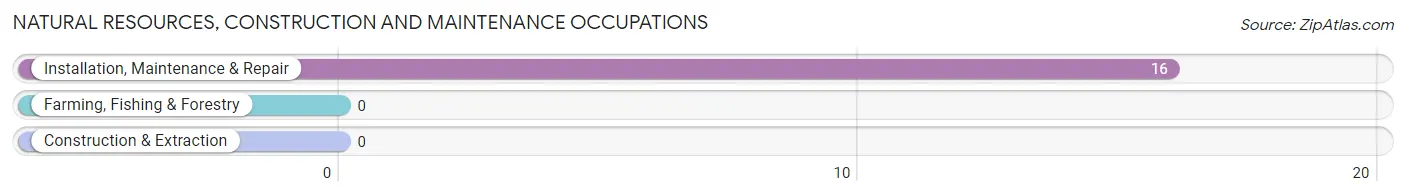
Natural Resources, Construction and Maintenance Occupations by Sex
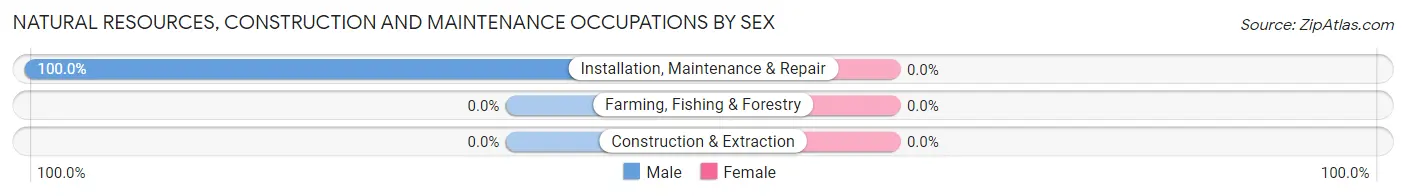
| Occupation | Male | Female |
| Farming, Fishing & Forestry | 0 (0.0%) | 0 (0.0%) |
| Construction & Extraction | 0 (0.0%) | 0 (0.0%) |
| Installation, Maintenance & Repair | 16 (100.0%) | 0 (0.0%) |
| Total (Category) | 16 (100.0%) | 0 (0.0%) |
| Total (Overall) | 112 (50.2%) | 111 (49.8%) |
Production, Transportation and Moving Occupations
The most common Production, Transportation and Moving occupations in Lookingglass are Transportation (40 | 17.9%), and Production (17 | 7.6%).
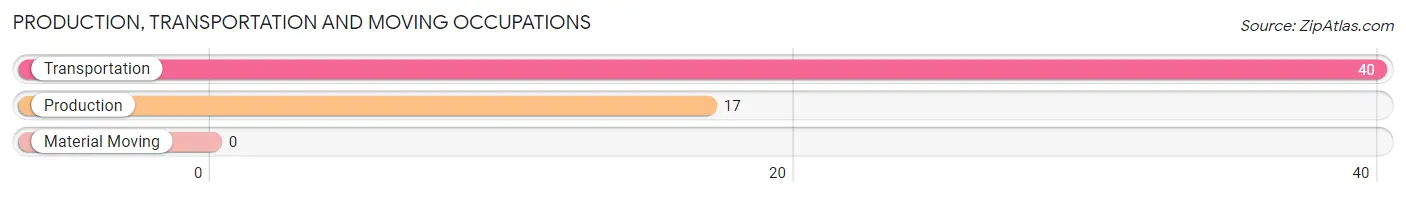
Production, Transportation and Moving Occupations by Sex
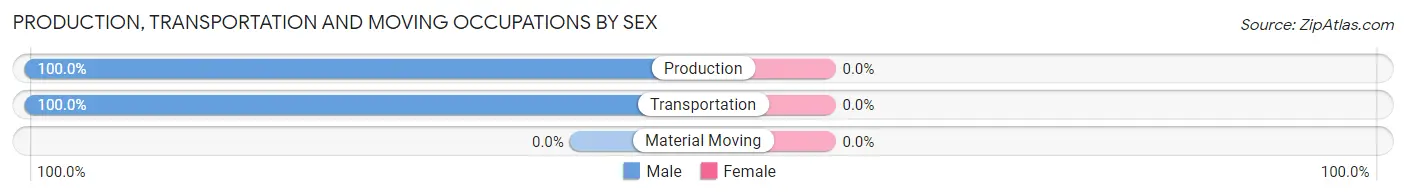
| Occupation | Male | Female |
| Production | 17 (100.0%) | 0 (0.0%) |
| Transportation | 40 (100.0%) | 0 (0.0%) |
| Material Moving | 0 (0.0%) | 0 (0.0%) |
| Total (Category) | 57 (100.0%) | 0 (0.0%) |
| Total (Overall) | 112 (50.2%) | 111 (49.8%) |
Employment Industries by Sex in Lookingglass
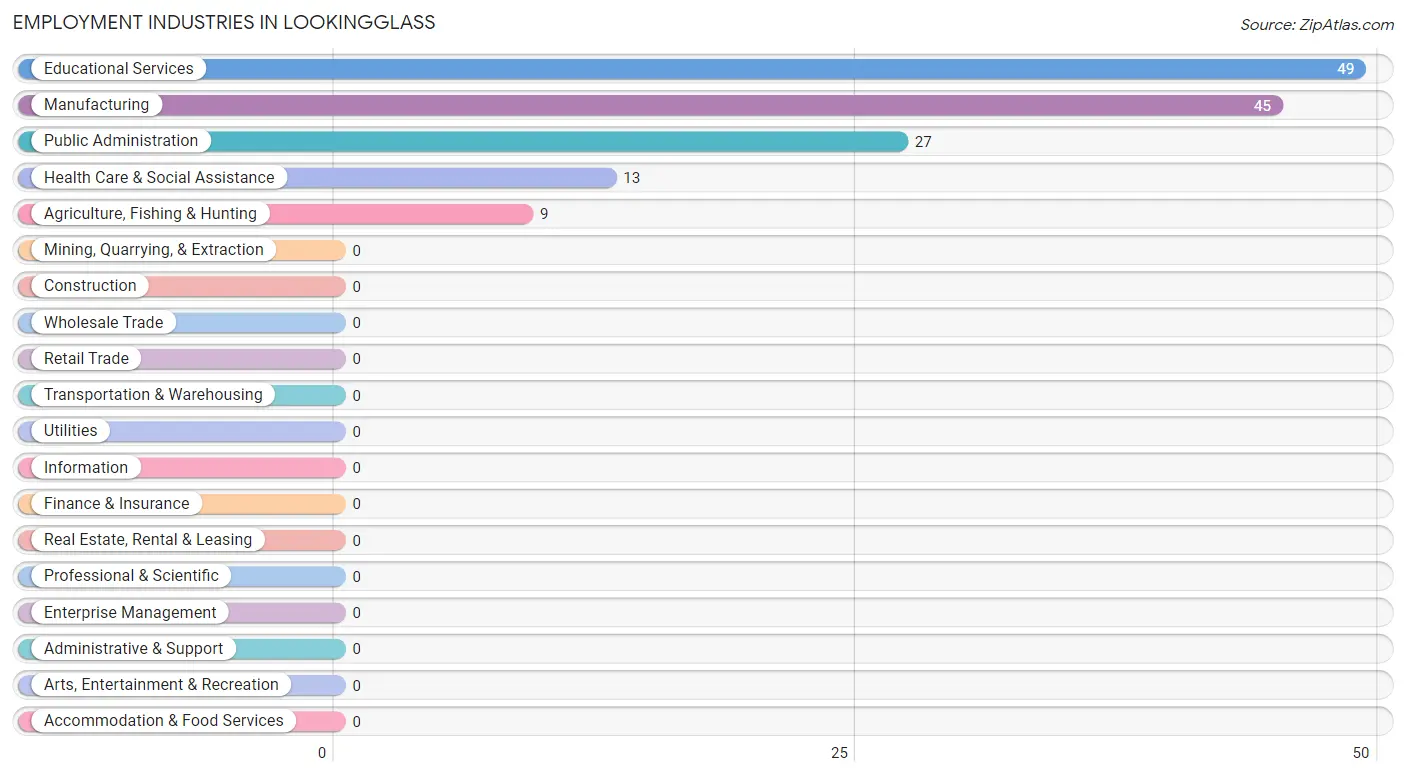
Employment Industries in Lookingglass
The major employment industries in Lookingglass include Educational Services (49 | 22.0%), Manufacturing (45 | 20.2%), Public Administration (27 | 12.1%), Health Care & Social Assistance (13 | 5.8%), and Agriculture, Fishing & Hunting (9 | 4.0%).
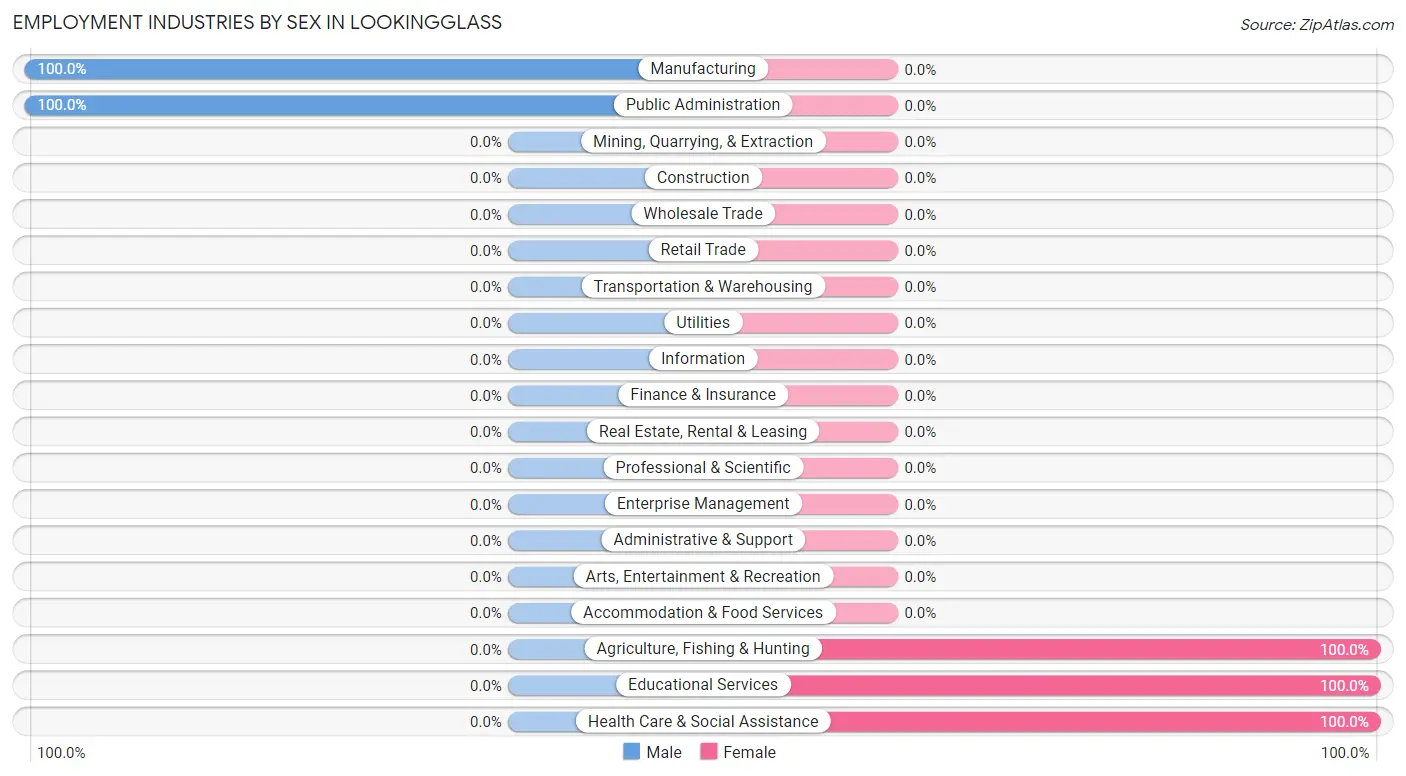
Employment Industries by Sex in Lookingglass
The Lookingglass industries that see more men than women are Manufacturing (100.0%), and Public Administration (100.0%), whereas the industries that tend to have a higher number of women are Agriculture, Fishing & Hunting (100.0%), Educational Services (100.0%), and Health Care & Social Assistance (100.0%).
| Industry | Male | Female |
| Agriculture, Fishing & Hunting | 0 (0.0%) | 9 (100.0%) |
| Mining, Quarrying, & Extraction | 0 (0.0%) | 0 (0.0%) |
| Construction | 0 (0.0%) | 0 (0.0%) |
| Manufacturing | 45 (100.0%) | 0 (0.0%) |
| Wholesale Trade | 0 (0.0%) | 0 (0.0%) |
| Retail Trade | 0 (0.0%) | 0 (0.0%) |
| Transportation & Warehousing | 0 (0.0%) | 0 (0.0%) |
| Utilities | 0 (0.0%) | 0 (0.0%) |
| Information | 0 (0.0%) | 0 (0.0%) |
| Finance & Insurance | 0 (0.0%) | 0 (0.0%) |
| Real Estate, Rental & Leasing | 0 (0.0%) | 0 (0.0%) |
| Professional & Scientific | 0 (0.0%) | 0 (0.0%) |
| Enterprise Management | 0 (0.0%) | 0 (0.0%) |
| Administrative & Support | 0 (0.0%) | 0 (0.0%) |
| Educational Services | 0 (0.0%) | 49 (100.0%) |
| Health Care & Social Assistance | 0 (0.0%) | 13 (100.0%) |
| Arts, Entertainment & Recreation | 0 (0.0%) | 0 (0.0%) |
| Accommodation & Food Services | 0 (0.0%) | 0 (0.0%) |
| Public Administration | 27 (100.0%) | 0 (0.0%) |
| Total | 112 (50.2%) | 111 (49.8%) |
Education in Lookingglass
School Enrollment in Lookingglass
The most common levels of schooling among the 96 students in Lookingglass are kindergarten (28 | 29.2%), elementary school (28 | 29.2%), and middle school (24 | 25.0%).
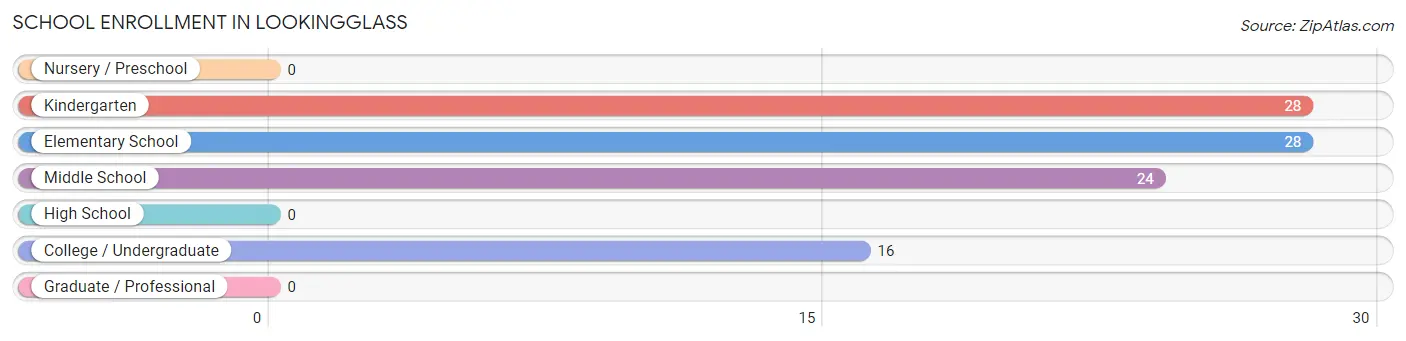
| School Level | # Students | % Students |
| Nursery / Preschool | 0 | 0.0% |
| Kindergarten | 28 | 29.2% |
| Elementary School | 28 | 29.2% |
| Middle School | 24 | 25.0% |
| High School | 0 | 0.0% |
| College / Undergraduate | 16 | 16.7% |
| Graduate / Professional | 0 | 0.0% |
| Total | 96 | 100.0% |
School Enrollment by Age by Funding Source in Lookingglass
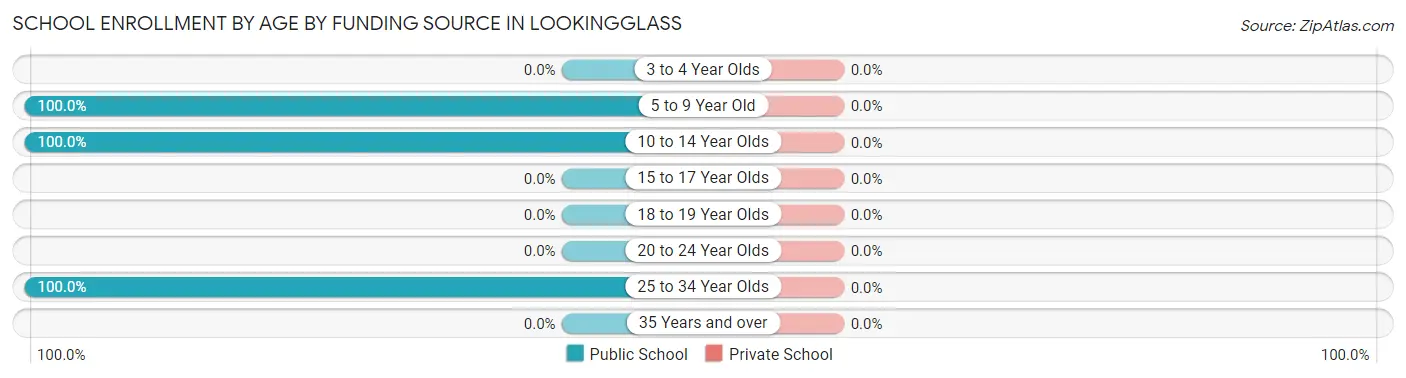
| Age Bracket | Public School | Private School |
| 3 to 4 Year Olds | 0 (0.0%) | 0 (0.0%) |
| 5 to 9 Year Old | 56 (100.0%) | 0 (0.0%) |
| 10 to 14 Year Olds | 24 (100.0%) | 0 (0.0%) |
| 15 to 17 Year Olds | 0 (0.0%) | 0 (0.0%) |
| 18 to 19 Year Olds | 0 (0.0%) | 0 (0.0%) |
| 20 to 24 Year Olds | 0 (0.0%) | 0 (0.0%) |
| 25 to 34 Year Olds | 16 (100.0%) | 0 (0.0%) |
| 35 Years and over | 0 (0.0%) | 0 (0.0%) |
| Total | 96 (100.0%) | 0 (0.0%) |
Educational Attainment by Field of Study in Lookingglass
Education (56 | 40.9%), bio, nature & agricultural (39 | 28.5%), science & technology (22 | 16.1%), psychology (11 | 8.0%), and business (9 | 6.6%) are the most common fields of study among 137 individuals in Lookingglass who have obtained a bachelor's degree or higher.
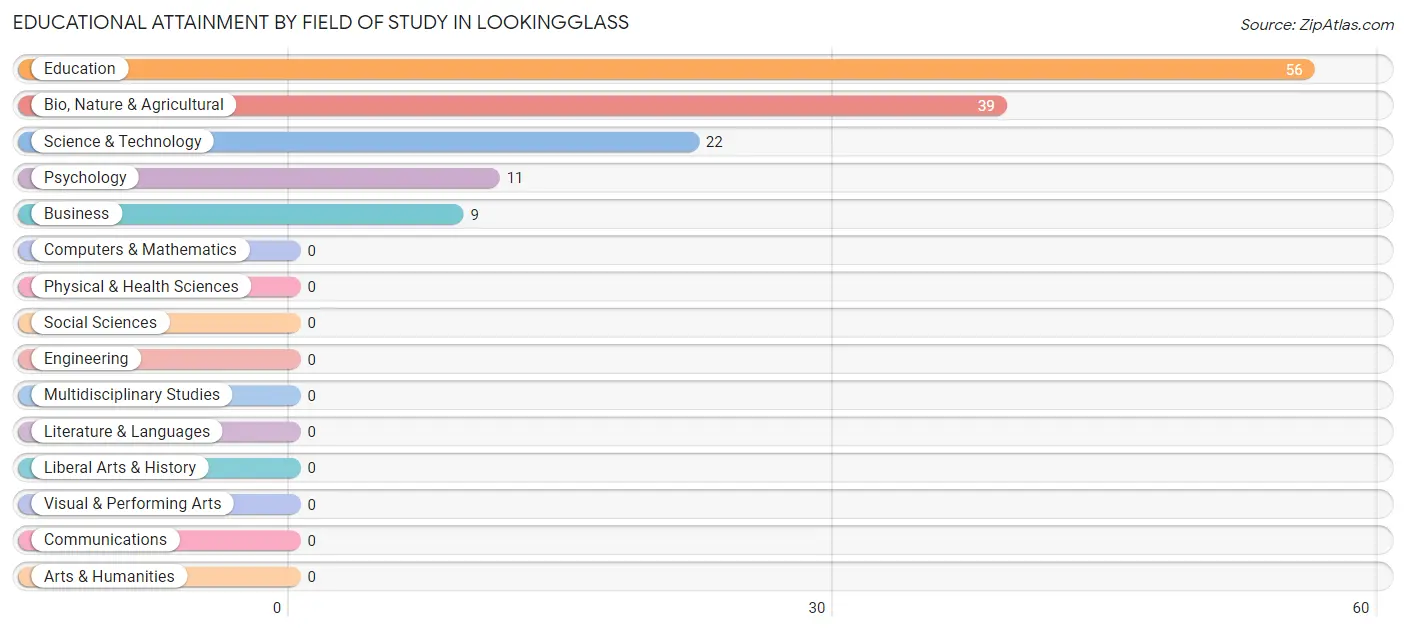
| Field of Study | # Graduates | % Graduates |
| Computers & Mathematics | 0 | 0.0% |
| Bio, Nature & Agricultural | 39 | 28.5% |
| Physical & Health Sciences | 0 | 0.0% |
| Psychology | 11 | 8.0% |
| Social Sciences | 0 | 0.0% |
| Engineering | 0 | 0.0% |
| Multidisciplinary Studies | 0 | 0.0% |
| Science & Technology | 22 | 16.1% |
| Business | 9 | 6.6% |
| Education | 56 | 40.9% |
| Literature & Languages | 0 | 0.0% |
| Liberal Arts & History | 0 | 0.0% |
| Visual & Performing Arts | 0 | 0.0% |
| Communications | 0 | 0.0% |
| Arts & Humanities | 0 | 0.0% |
| Total | 137 | 100.0% |
Transportation & Commute in Lookingglass
Vehicle Availability by Sex in Lookingglass
The most prevalent vehicle ownership categories in Lookingglass are males with 2 vehicles (56, accounting for 50.0%) and females with 2 vehicles (87, making up 56.0%).
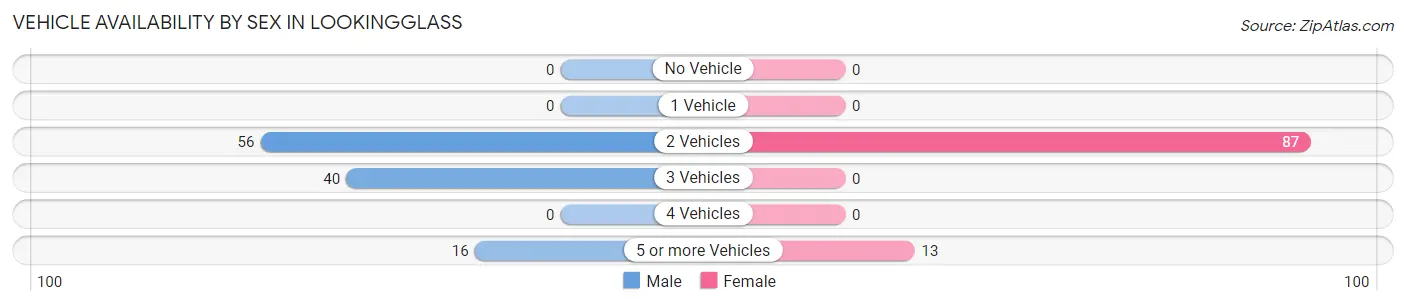
| Vehicles Available | Male | Female |
| No Vehicle | 0 (0.0%) | 0 (0.0%) |
| 1 Vehicle | 0 (0.0%) | 0 (0.0%) |
| 2 Vehicles | 56 (50.0%) | 87 (87.0%) |
| 3 Vehicles | 40 (35.7%) | 0 (0.0%) |
| 4 Vehicles | 0 (0.0%) | 0 (0.0%) |
| 5 or more Vehicles | 16 (14.3%) | 13 (13.0%) |
| Total | 112 (100.0%) | 100 (100.0%) |
Commute Time in Lookingglass
The most frequently occuring commute durations in Lookingglass are 20 to 24 minutes (77 commuters, 40.5%), 15 to 19 minutes (40 commuters, 21.0%), and 35 to 39 minutes (40 commuters, 21.0%).
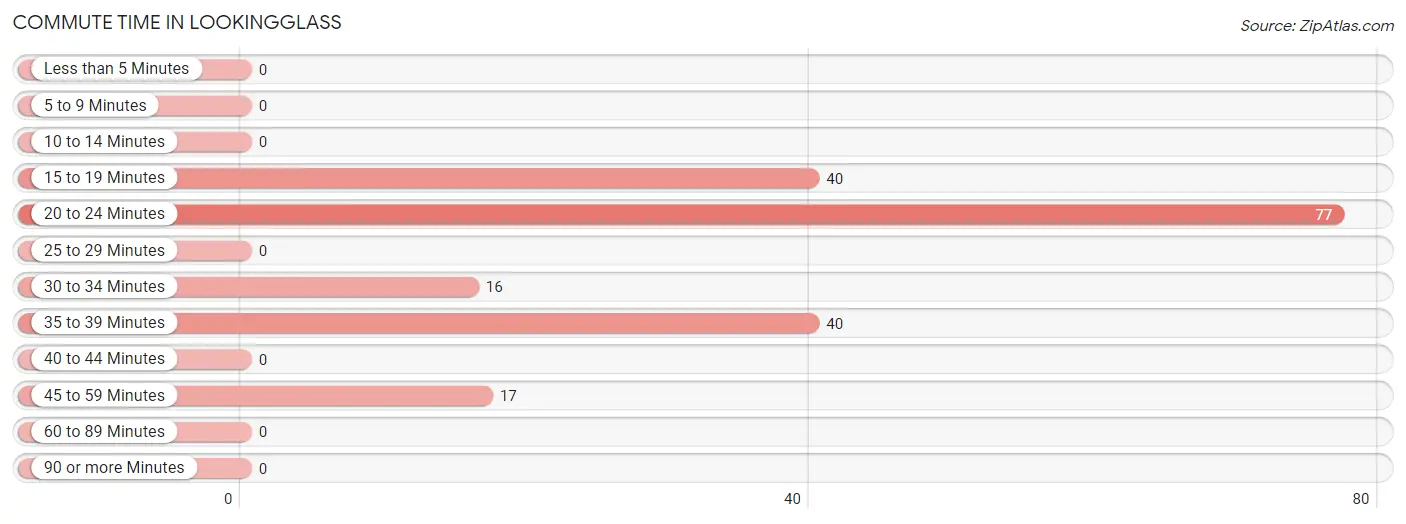
| Commute Time | # Commuters | % Commuters |
| Less than 5 Minutes | 0 | 0.0% |
| 5 to 9 Minutes | 0 | 0.0% |
| 10 to 14 Minutes | 0 | 0.0% |
| 15 to 19 Minutes | 40 | 21.0% |
| 20 to 24 Minutes | 77 | 40.5% |
| 25 to 29 Minutes | 0 | 0.0% |
| 30 to 34 Minutes | 16 | 8.4% |
| 35 to 39 Minutes | 40 | 21.0% |
| 40 to 44 Minutes | 0 | 0.0% |
| 45 to 59 Minutes | 17 | 8.9% |
| 60 to 89 Minutes | 0 | 0.0% |
| 90 or more Minutes | 0 | 0.0% |
Commute Time by Sex in Lookingglass
The most common commute times in Lookingglass are 15 to 19 minutes (40 commuters, 35.7%) for males and 35 to 39 minutes (40 commuters, 51.3%) for females.
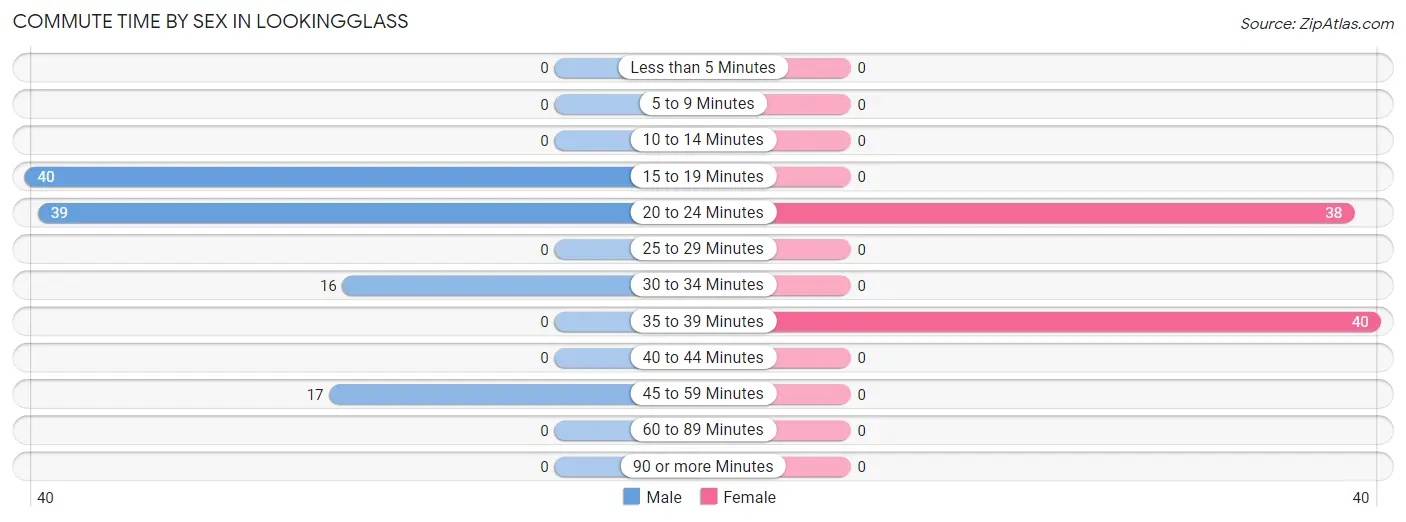
| Commute Time | Male | Female |
| Less than 5 Minutes | 0 (0.0%) | 0 (0.0%) |
| 5 to 9 Minutes | 0 (0.0%) | 0 (0.0%) |
| 10 to 14 Minutes | 0 (0.0%) | 0 (0.0%) |
| 15 to 19 Minutes | 40 (35.7%) | 0 (0.0%) |
| 20 to 24 Minutes | 39 (34.8%) | 38 (48.7%) |
| 25 to 29 Minutes | 0 (0.0%) | 0 (0.0%) |
| 30 to 34 Minutes | 16 (14.3%) | 0 (0.0%) |
| 35 to 39 Minutes | 0 (0.0%) | 40 (51.3%) |
| 40 to 44 Minutes | 0 (0.0%) | 0 (0.0%) |
| 45 to 59 Minutes | 17 (15.2%) | 0 (0.0%) |
| 60 to 89 Minutes | 0 (0.0%) | 0 (0.0%) |
| 90 or more Minutes | 0 (0.0%) | 0 (0.0%) |
Time of Departure to Work by Sex in Lookingglass
The most frequent times of departure to work in Lookingglass are 12:00 PM to 3:59 PM (40, 35.7%) for males and 11:00 AM to 11:59 AM (40, 51.3%) for females.
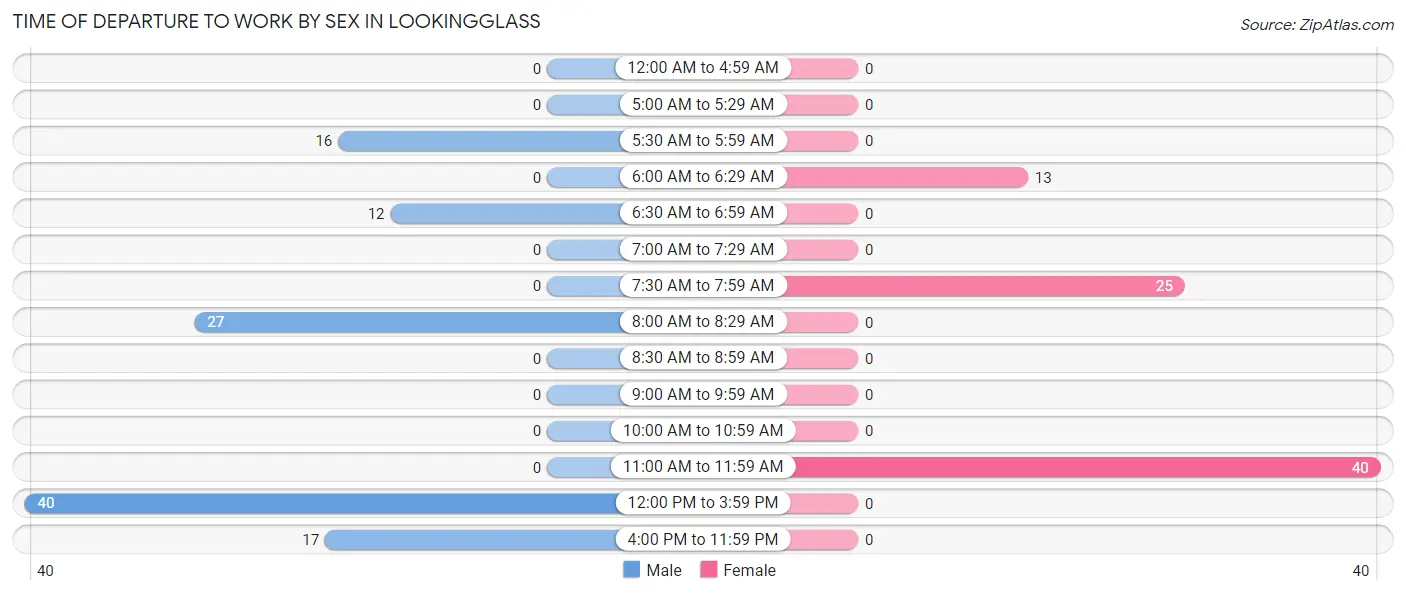
| Time of Departure | Male | Female |
| 12:00 AM to 4:59 AM | 0 (0.0%) | 0 (0.0%) |
| 5:00 AM to 5:29 AM | 0 (0.0%) | 0 (0.0%) |
| 5:30 AM to 5:59 AM | 16 (14.3%) | 0 (0.0%) |
| 6:00 AM to 6:29 AM | 0 (0.0%) | 13 (16.7%) |
| 6:30 AM to 6:59 AM | 12 (10.7%) | 0 (0.0%) |
| 7:00 AM to 7:29 AM | 0 (0.0%) | 0 (0.0%) |
| 7:30 AM to 7:59 AM | 0 (0.0%) | 25 (32.1%) |
| 8:00 AM to 8:29 AM | 27 (24.1%) | 0 (0.0%) |
| 8:30 AM to 8:59 AM | 0 (0.0%) | 0 (0.0%) |
| 9:00 AM to 9:59 AM | 0 (0.0%) | 0 (0.0%) |
| 10:00 AM to 10:59 AM | 0 (0.0%) | 0 (0.0%) |
| 11:00 AM to 11:59 AM | 0 (0.0%) | 40 (51.3%) |
| 12:00 PM to 3:59 PM | 40 (35.7%) | 0 (0.0%) |
| 4:00 PM to 11:59 PM | 17 (15.2%) | 0 (0.0%) |
| Total | 112 (100.0%) | 78 (100.0%) |
Housing Occupancy in Lookingglass
Occupancy by Ownership in Lookingglass
Of the total 312 dwellings in Lookingglass, owner-occupied units account for 296 (94.9%), while renter-occupied units make up 16 (5.1%).
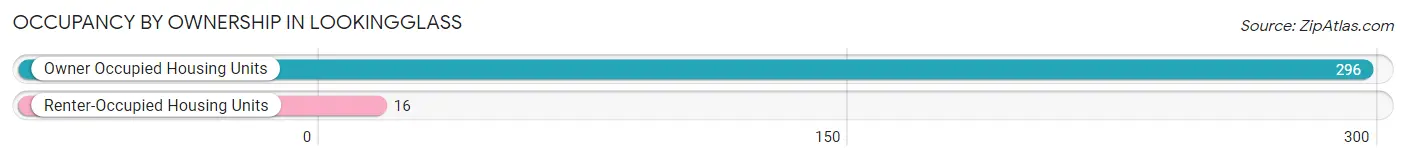
| Occupancy | # Housing Units | % Housing Units |
| Owner Occupied Housing Units | 296 | 94.9% |
| Renter-Occupied Housing Units | 16 | 5.1% |
| Total Occupied Housing Units | 312 | 100.0% |
Occupancy by Household Size in Lookingglass
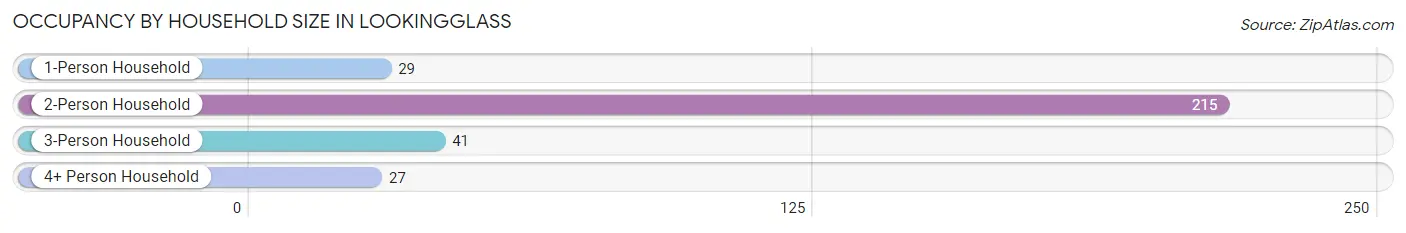
| Household Size | # Housing Units | % Housing Units |
| 1-Person Household | 29 | 9.3% |
| 2-Person Household | 215 | 68.9% |
| 3-Person Household | 41 | 13.1% |
| 4+ Person Household | 27 | 8.6% |
| Total Housing Units | 312 | 100.0% |
Occupancy by Ownership by Household Size in Lookingglass
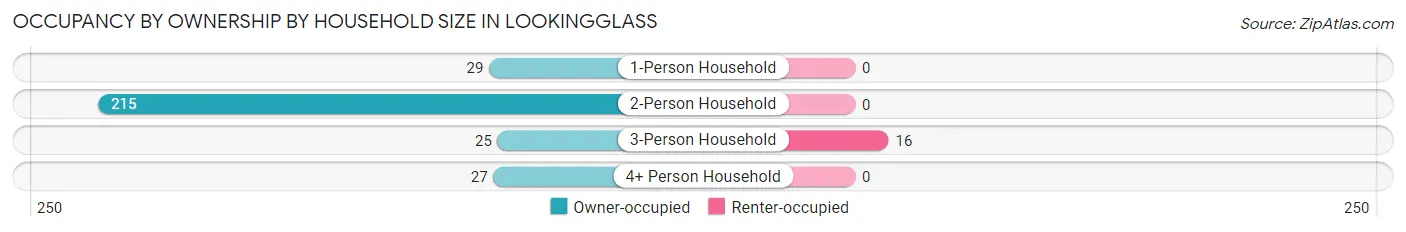
| Household Size | Owner-occupied | Renter-occupied |
| 1-Person Household | 29 (100.0%) | 0 (0.0%) |
| 2-Person Household | 215 (100.0%) | 0 (0.0%) |
| 3-Person Household | 25 (61.0%) | 16 (39.0%) |
| 4+ Person Household | 27 (100.0%) | 0 (0.0%) |
| Total Housing Units | 296 (94.9%) | 16 (5.1%) |
Occupancy by Educational Attainment in Lookingglass
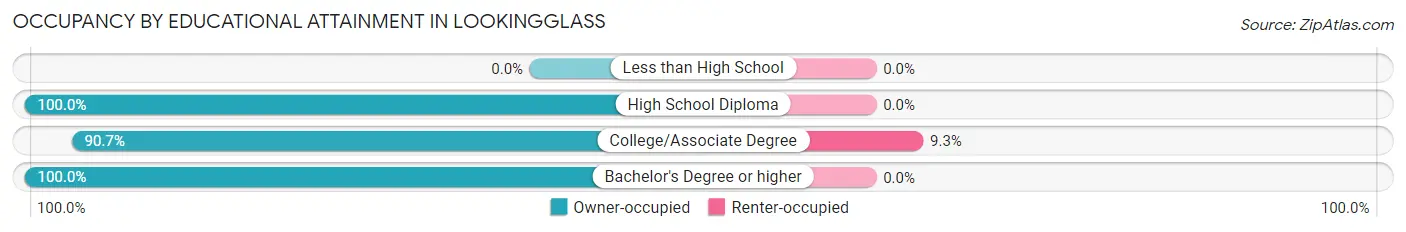
| Household Size | Owner-occupied | Renter-occupied |
| Less than High School | 0 (0.0%) | 0 (0.0%) |
| High School Diploma | 61 (100.0%) | 0 (0.0%) |
| College/Associate Degree | 156 (90.7%) | 16 (9.3%) |
| Bachelor's Degree or higher | 79 (100.0%) | 0 (0.0%) |
Occupancy by Age of Householder in Lookingglass
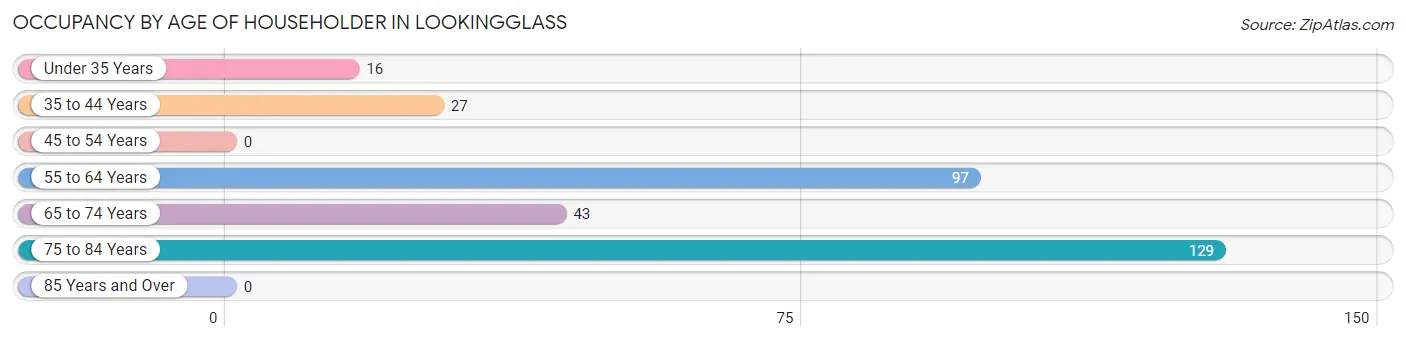
| Age Bracket | # Households | % Households |
| Under 35 Years | 16 | 5.1% |
| 35 to 44 Years | 27 | 8.6% |
| 45 to 54 Years | 0 | 0.0% |
| 55 to 64 Years | 97 | 31.1% |
| 65 to 74 Years | 43 | 13.8% |
| 75 to 84 Years | 129 | 41.3% |
| 85 Years and Over | 0 | 0.0% |
| Total | 312 | 100.0% |
Housing Finances in Lookingglass
Median Income by Occupancy in Lookingglass
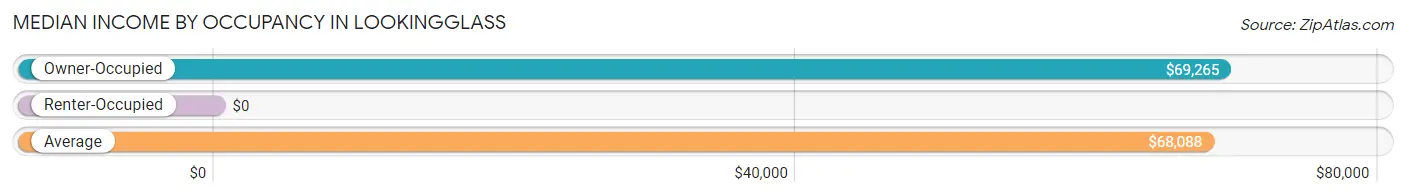
| Occupancy Type | # Households | Median Income |
| Owner-Occupied | 296 (94.9%) | $69,265 |
| Renter-Occupied | 16 (5.1%) | $0 |
| Average | 312 (100.0%) | $68,088 |
Occupancy by Householder Income Bracket in Lookingglass
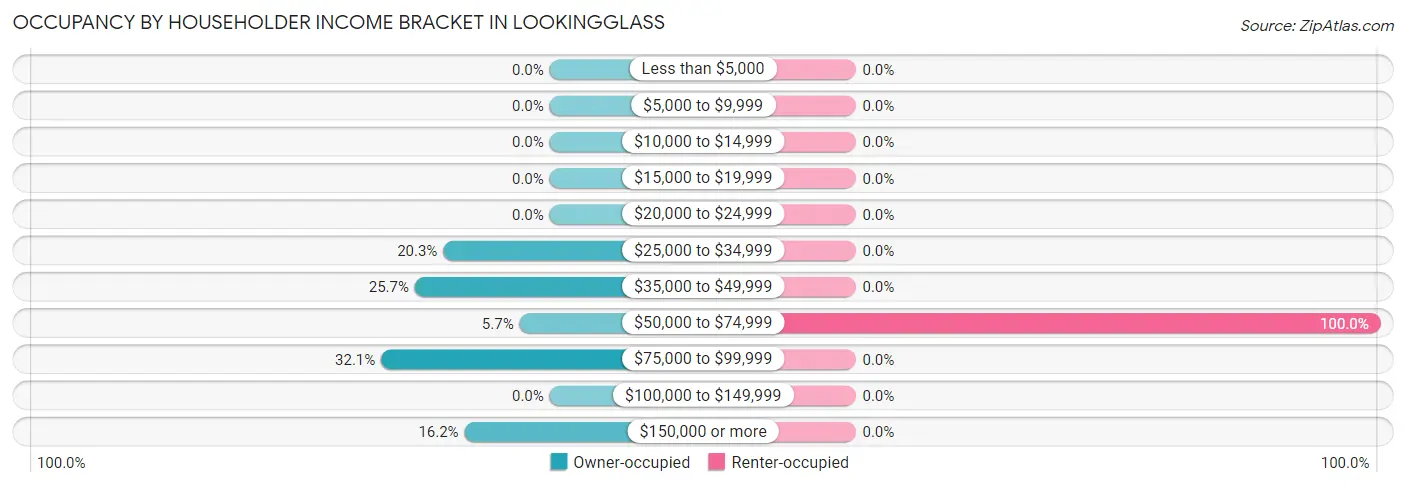
| Income Bracket | Owner-occupied | Renter-occupied |
| Less than $5,000 | 0 (0.0%) | 0 (0.0%) |
| $5,000 to $9,999 | 0 (0.0%) | 0 (0.0%) |
| $10,000 to $14,999 | 0 (0.0%) | 0 (0.0%) |
| $15,000 to $19,999 | 0 (0.0%) | 0 (0.0%) |
| $20,000 to $24,999 | 0 (0.0%) | 0 (0.0%) |
| $25,000 to $34,999 | 60 (20.3%) | 0 (0.0%) |
| $35,000 to $49,999 | 76 (25.7%) | 0 (0.0%) |
| $50,000 to $74,999 | 17 (5.7%) | 16 (100.0%) |
| $75,000 to $99,999 | 95 (32.1%) | 0 (0.0%) |
| $100,000 to $149,999 | 0 (0.0%) | 0 (0.0%) |
| $150,000 or more | 48 (16.2%) | 0 (0.0%) |
| Total | 296 (100.0%) | 16 (100.0%) |
Monthly Housing Cost Tiers in Lookingglass
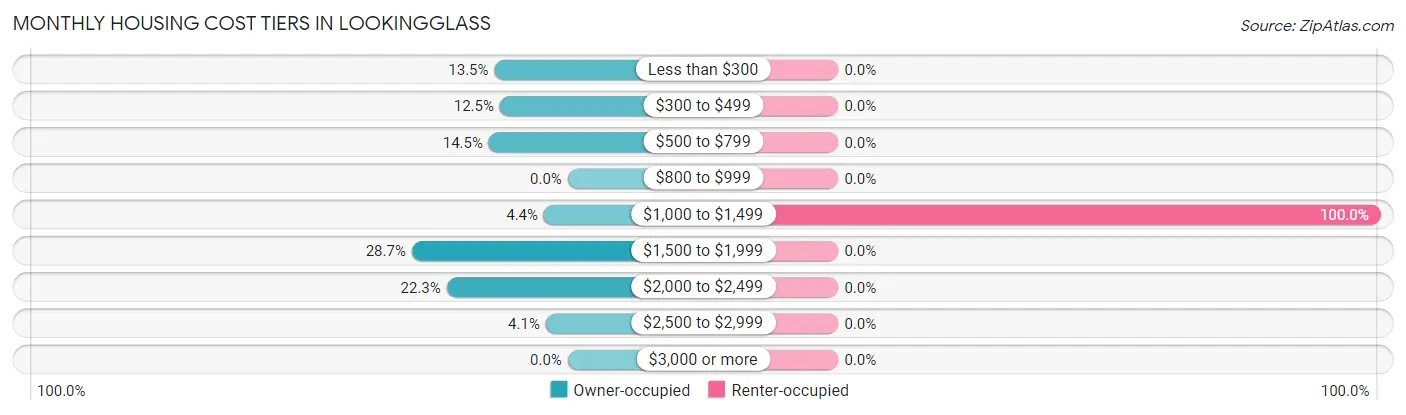
| Monthly Cost | Owner-occupied | Renter-occupied |
| Less than $300 | 40 (13.5%) | 0 (0.0%) |
| $300 to $499 | 37 (12.5%) | 0 (0.0%) |
| $500 to $799 | 43 (14.5%) | 0 (0.0%) |
| $800 to $999 | 0 (0.0%) | 0 (0.0%) |
| $1,000 to $1,499 | 13 (4.4%) | 16 (100.0%) |
| $1,500 to $1,999 | 85 (28.7%) | 0 (0.0%) |
| $2,000 to $2,499 | 66 (22.3%) | 0 (0.0%) |
| $2,500 to $2,999 | 12 (4.1%) | 0 (0.0%) |
| $3,000 or more | 0 (0.0%) | 0 (0.0%) |
| Total | 296 (100.0%) | 16 (100.0%) |
Physical Housing Characteristics in Lookingglass
Housing Structures in Lookingglass
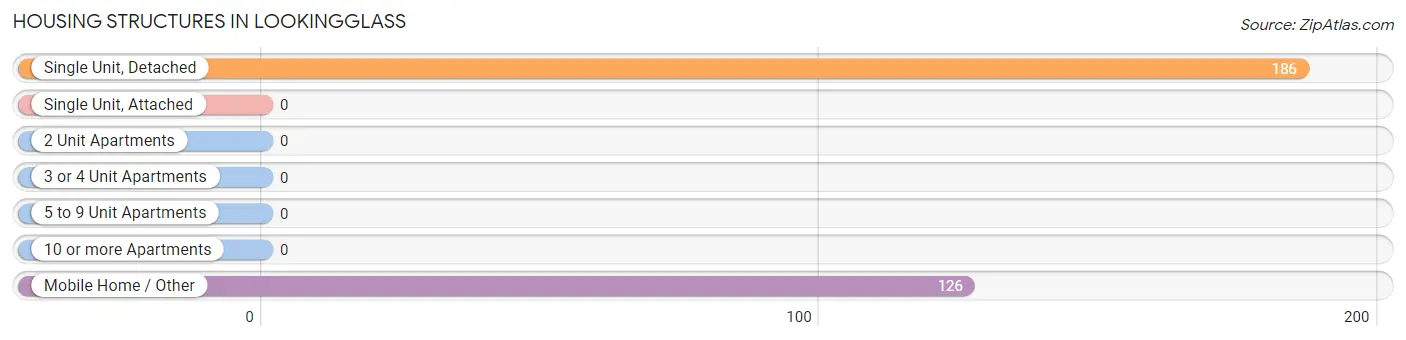
| Structure Type | # Housing Units | % Housing Units |
| Single Unit, Detached | 186 | 59.6% |
| Single Unit, Attached | 0 | 0.0% |
| 2 Unit Apartments | 0 | 0.0% |
| 3 or 4 Unit Apartments | 0 | 0.0% |
| 5 to 9 Unit Apartments | 0 | 0.0% |
| 10 or more Apartments | 0 | 0.0% |
| Mobile Home / Other | 126 | 40.4% |
| Total | 312 | 100.0% |
Housing Structures by Occupancy in Lookingglass
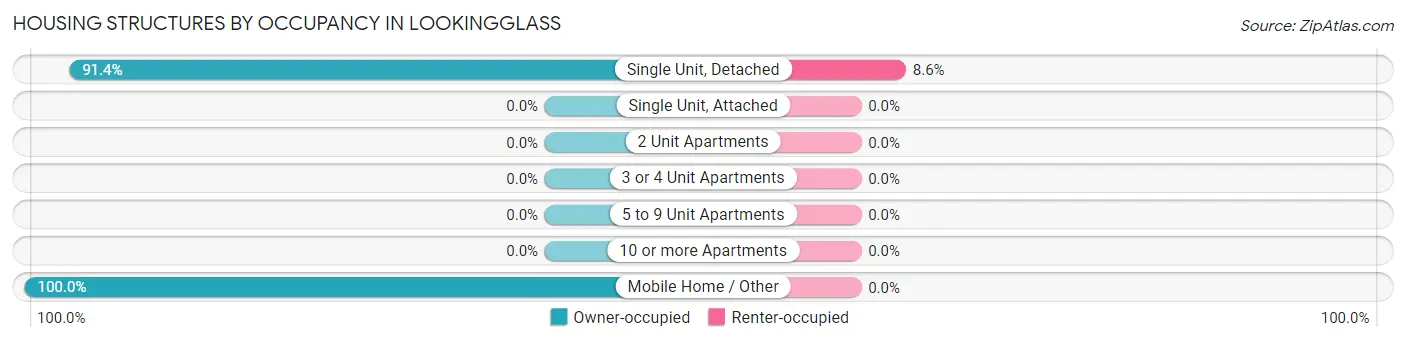
| Structure Type | Owner-occupied | Renter-occupied |
| Single Unit, Detached | 170 (91.4%) | 16 (8.6%) |
| Single Unit, Attached | 0 (0.0%) | 0 (0.0%) |
| 2 Unit Apartments | 0 (0.0%) | 0 (0.0%) |
| 3 or 4 Unit Apartments | 0 (0.0%) | 0 (0.0%) |
| 5 to 9 Unit Apartments | 0 (0.0%) | 0 (0.0%) |
| 10 or more Apartments | 0 (0.0%) | 0 (0.0%) |
| Mobile Home / Other | 126 (100.0%) | 0 (0.0%) |
| Total | 296 (94.9%) | 16 (5.1%) |
Housing Structures by Number of Rooms in Lookingglass
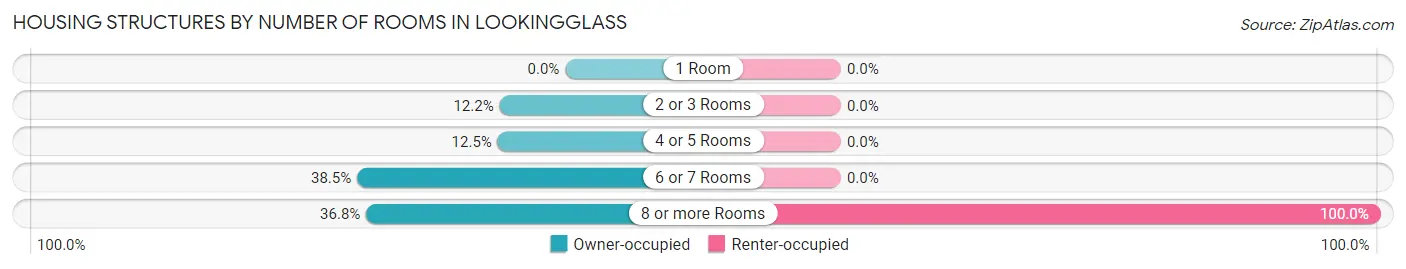
| Number of Rooms | Owner-occupied | Renter-occupied |
| 1 Room | 0 (0.0%) | 0 (0.0%) |
| 2 or 3 Rooms | 36 (12.2%) | 0 (0.0%) |
| 4 or 5 Rooms | 37 (12.5%) | 0 (0.0%) |
| 6 or 7 Rooms | 114 (38.5%) | 0 (0.0%) |
| 8 or more Rooms | 109 (36.8%) | 16 (100.0%) |
| Total | 296 (100.0%) | 16 (100.0%) |
Housing Structure by Heating Type in Lookingglass
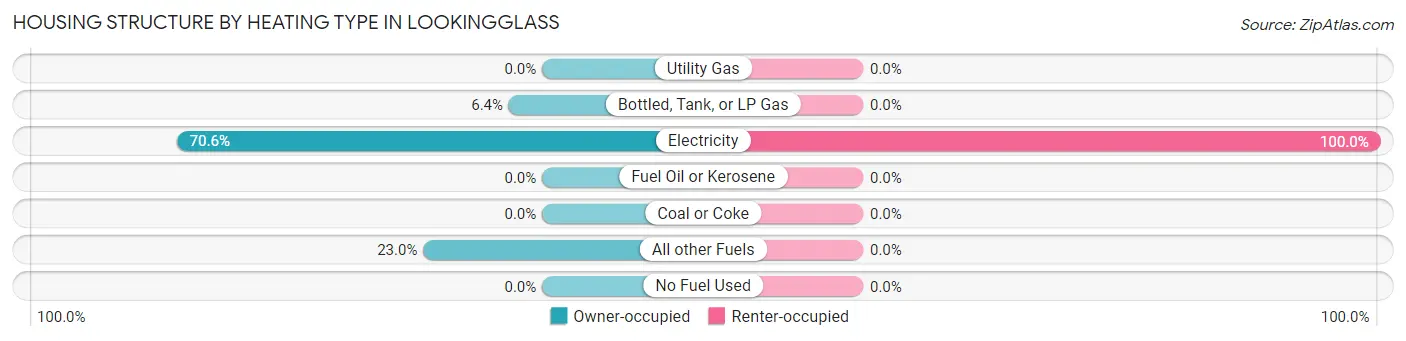
| Heating Type | Owner-occupied | Renter-occupied |
| Utility Gas | 0 (0.0%) | 0 (0.0%) |
| Bottled, Tank, or LP Gas | 19 (6.4%) | 0 (0.0%) |
| Electricity | 209 (70.6%) | 16 (100.0%) |
| Fuel Oil or Kerosene | 0 (0.0%) | 0 (0.0%) |
| Coal or Coke | 0 (0.0%) | 0 (0.0%) |
| All other Fuels | 68 (23.0%) | 0 (0.0%) |
| No Fuel Used | 0 (0.0%) | 0 (0.0%) |
| Total | 296 (100.0%) | 16 (100.0%) |
Household Vehicle Usage in Lookingglass
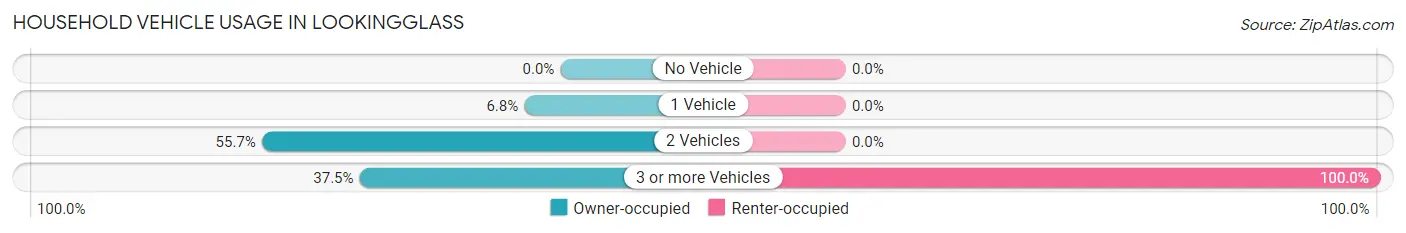
| Vehicles per Household | Owner-occupied | Renter-occupied |
| No Vehicle | 0 (0.0%) | 0 (0.0%) |
| 1 Vehicle | 20 (6.8%) | 0 (0.0%) |
| 2 Vehicles | 165 (55.7%) | 0 (0.0%) |
| 3 or more Vehicles | 111 (37.5%) | 16 (100.0%) |
| Total | 296 (100.0%) | 16 (100.0%) |
Real Estate & Mortgages in Lookingglass
Real Estate and Mortgage Overview in Lookingglass
| Characteristic | Without Mortgage | With Mortgage |
| Housing Units | 100 | 196 |
| Median Property Value | $262,500 | $412,100 |
| Median Household Income | $38,176 | $48 |
| Monthly Housing Costs | $427 | $0 |
| Real Estate Taxes | $2,191 | $0 |
Property Value by Mortgage Status in Lookingglass
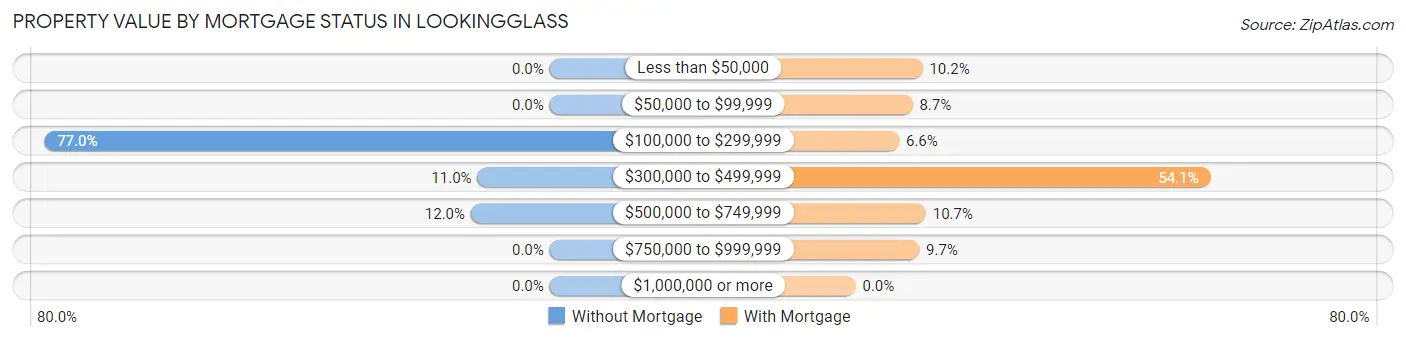
| Property Value | Without Mortgage | With Mortgage |
| Less than $50,000 | 0 (0.0%) | 20 (10.2%) |
| $50,000 to $99,999 | 0 (0.0%) | 17 (8.7%) |
| $100,000 to $299,999 | 77 (77.0%) | 13 (6.6%) |
| $300,000 to $499,999 | 11 (11.0%) | 106 (54.1%) |
| $500,000 to $749,999 | 12 (12.0%) | 21 (10.7%) |
| $750,000 to $999,999 | 0 (0.0%) | 19 (9.7%) |
| $1,000,000 or more | 0 (0.0%) | 0 (0.0%) |
| Total | 100 (100.0%) | 196 (100.0%) |
Household Income by Mortgage Status in Lookingglass
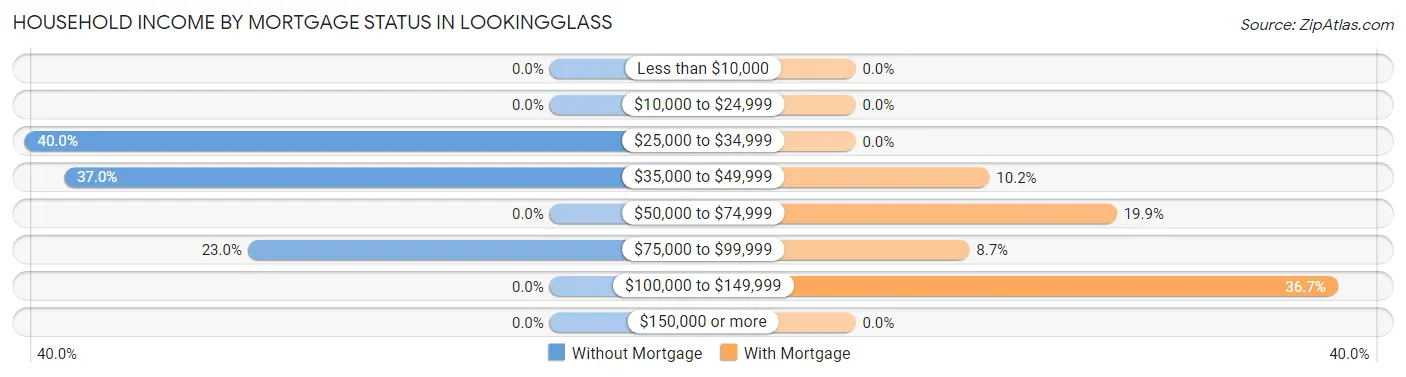
| Household Income | Without Mortgage | With Mortgage |
| Less than $10,000 | 0 (0.0%) | 0 (0.0%) |
| $10,000 to $24,999 | 0 (0.0%) | 0 (0.0%) |
| $25,000 to $34,999 | 40 (40.0%) | 0 (0.0%) |
| $35,000 to $49,999 | 37 (37.0%) | 20 (10.2%) |
| $50,000 to $74,999 | 0 (0.0%) | 39 (19.9%) |
| $75,000 to $99,999 | 23 (23.0%) | 17 (8.7%) |
| $100,000 to $149,999 | 0 (0.0%) | 72 (36.7%) |
| $150,000 or more | 0 (0.0%) | 0 (0.0%) |
| Total | 100 (100.0%) | 196 (100.0%) |
Property Value to Household Income Ratio in Lookingglass
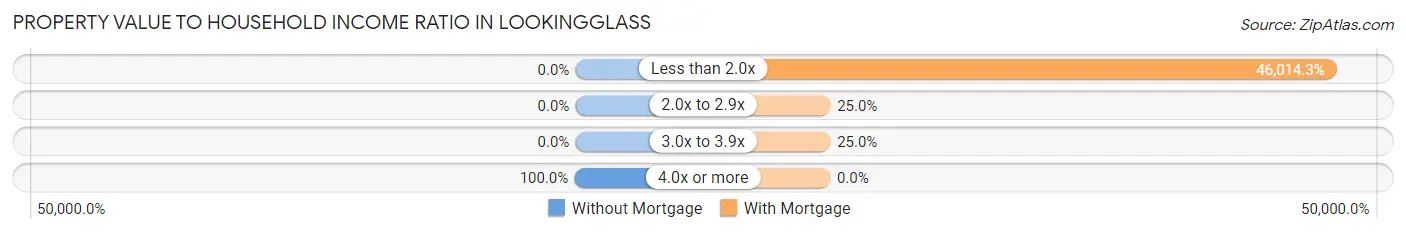
| Value-to-Income Ratio | Without Mortgage | With Mortgage |
| Less than 2.0x | 0 (0.0%) | 90,188 (46,014.3%) |
| 2.0x to 2.9x | 0 (0.0%) | 49 (25.0%) |
| 3.0x to 3.9x | 0 (0.0%) | 49 (25.0%) |
| 4.0x or more | 100 (100.0%) | 0 (0.0%) |
| Total | 100 (100.0%) | 196 (100.0%) |
Real Estate Taxes by Mortgage Status in Lookingglass
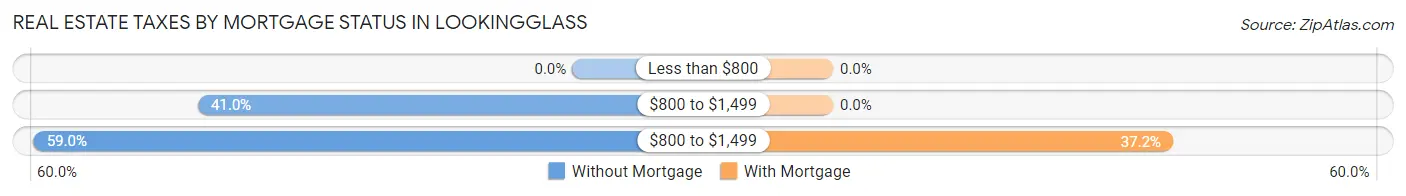
| Property Taxes | Without Mortgage | With Mortgage |
| Less than $800 | 0 (0.0%) | 0 (0.0%) |
| $800 to $1,499 | 41 (41.0%) | 0 (0.0%) |
| $800 to $1,499 | 59 (59.0%) | 73 (37.2%) |
| Total | 100 (100.0%) | 196 (100.0%) |
Health & Disability in Lookingglass
Health Insurance Coverage by Age in Lookingglass
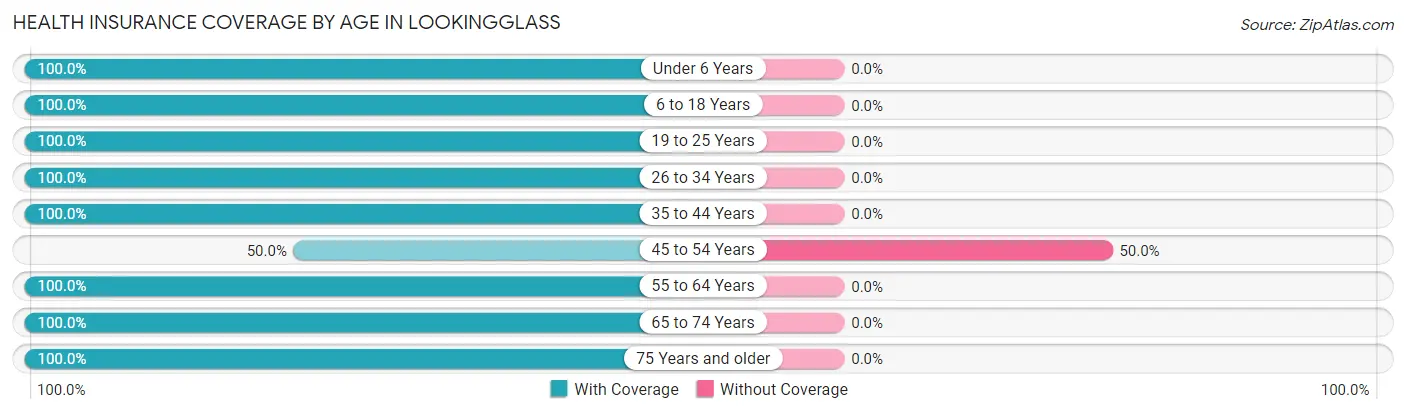
| Age Bracket | With Coverage | Without Coverage |
| Under 6 Years | 80 (100.0%) | 0 (0.0%) |
| 6 to 18 Years | 52 (100.0%) | 0 (0.0%) |
| 19 to 25 Years | 28 (100.0%) | 0 (0.0%) |
| 26 to 34 Years | 37 (100.0%) | 0 (0.0%) |
| 35 to 44 Years | 52 (100.0%) | 0 (0.0%) |
| 45 to 54 Years | 13 (50.0%) | 13 (50.0%) |
| 55 to 64 Years | 125 (100.0%) | 0 (0.0%) |
| 65 to 74 Years | 106 (100.0%) | 0 (0.0%) |
| 75 Years and older | 256 (100.0%) | 0 (0.0%) |
| Total | 749 (98.3%) | 13 (1.7%) |
Health Insurance Coverage by Citizenship Status in Lookingglass
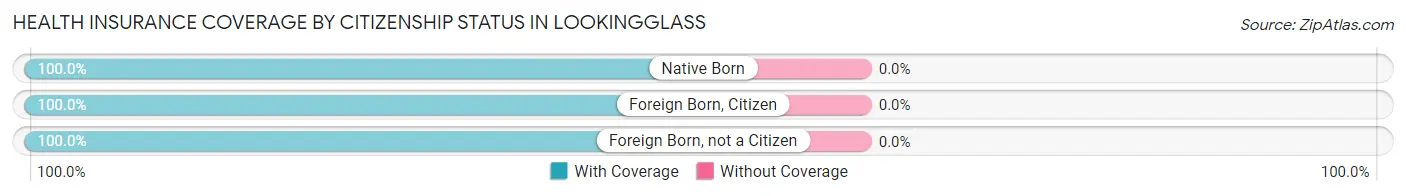
| Citizenship Status | With Coverage | Without Coverage |
| Native Born | 80 (100.0%) | 0 (0.0%) |
| Foreign Born, Citizen | 52 (100.0%) | 0 (0.0%) |
| Foreign Born, not a Citizen | 28 (100.0%) | 0 (0.0%) |
Health Insurance Coverage by Household Income in Lookingglass
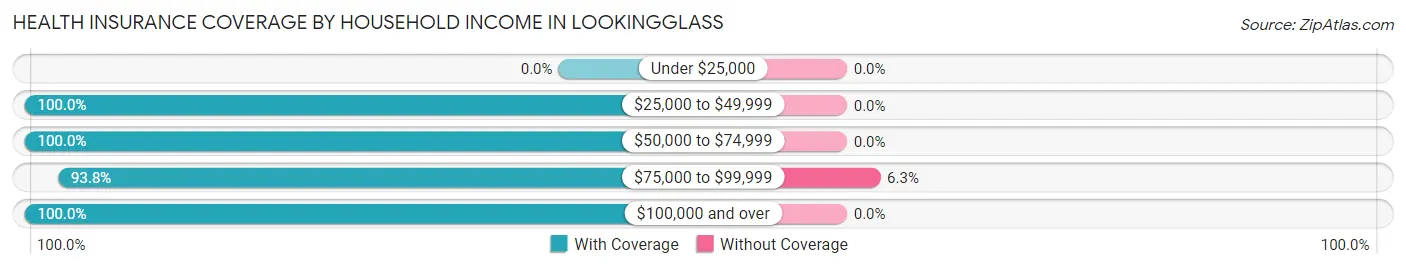
| Household Income | With Coverage | Without Coverage |
| Under $25,000 | 0 (0.0%) | 0 (0.0%) |
| $25,000 to $49,999 | 265 (100.0%) | 0 (0.0%) |
| $50,000 to $74,999 | 93 (100.0%) | 0 (0.0%) |
| $75,000 to $99,999 | 195 (93.8%) | 13 (6.2%) |
| $100,000 and over | 196 (100.0%) | 0 (0.0%) |
Public vs Private Health Insurance Coverage by Age in Lookingglass
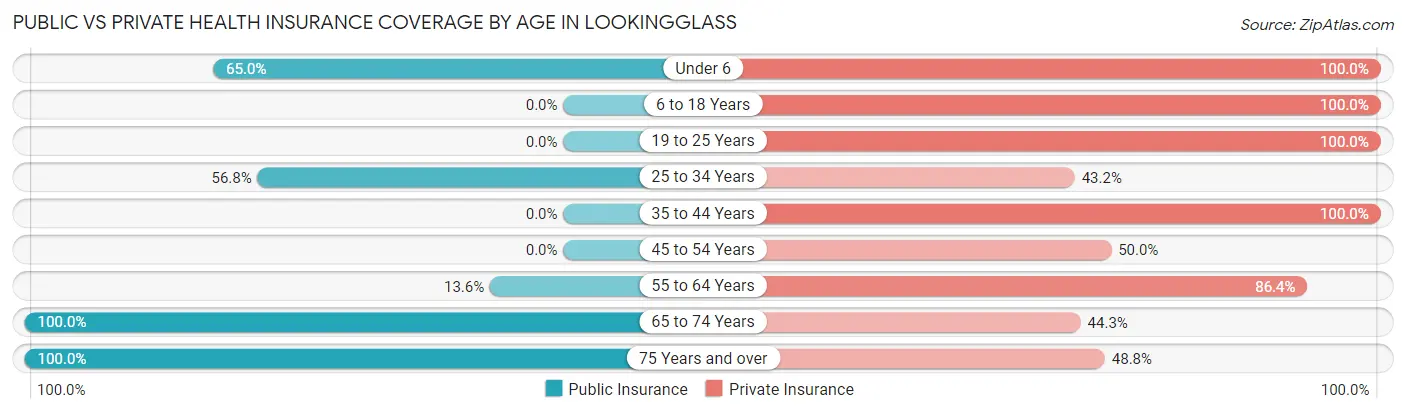
| Age Bracket | Public Insurance | Private Insurance |
| Under 6 | 52 (65.0%) | 80 (100.0%) |
| 6 to 18 Years | 0 (0.0%) | 52 (100.0%) |
| 19 to 25 Years | 0 (0.0%) | 28 (100.0%) |
| 25 to 34 Years | 21 (56.8%) | 16 (43.2%) |
| 35 to 44 Years | 0 (0.0%) | 52 (100.0%) |
| 45 to 54 Years | 0 (0.0%) | 13 (50.0%) |
| 55 to 64 Years | 17 (13.6%) | 108 (86.4%) |
| 65 to 74 Years | 106 (100.0%) | 47 (44.3%) |
| 75 Years and over | 256 (100.0%) | 125 (48.8%) |
| Total | 452 (59.3%) | 521 (68.4%) |
Disability Status by Sex by Age in Lookingglass
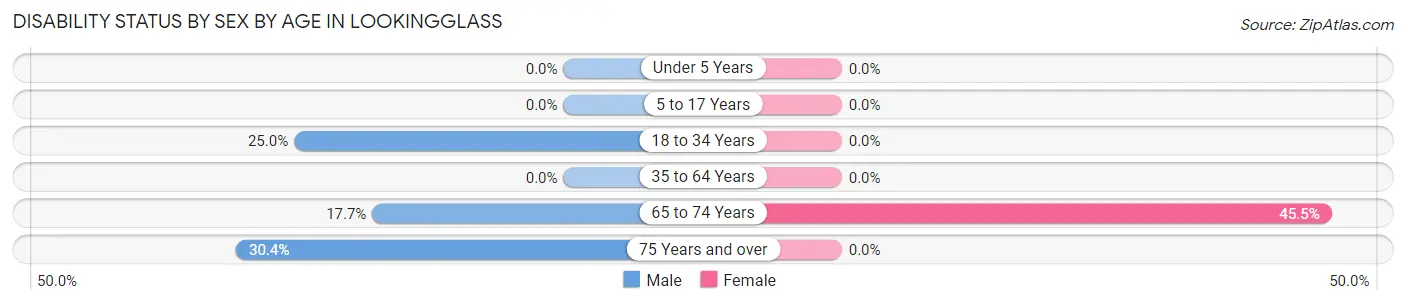
| Age Bracket | Male | Female |
| Under 5 Years | 0 (0.0%) | 0 (0.0%) |
| 5 to 17 Years | 0 (0.0%) | 0 (0.0%) |
| 18 to 34 Years | 11 (25.0%) | 0 (0.0%) |
| 35 to 64 Years | 0 (0.0%) | 0 (0.0%) |
| 65 to 74 Years | 11 (17.7%) | 20 (45.5%) |
| 75 Years and over | 41 (30.4%) | 0 (0.0%) |
Disability Class by Sex by Age in Lookingglass
Disability Class: Hearing Difficulty
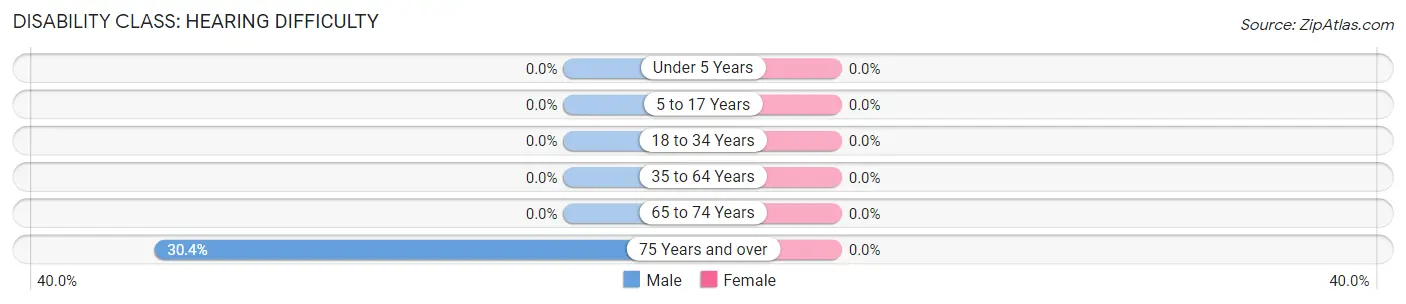
| Age Bracket | Male | Female |
| Under 5 Years | 0 (0.0%) | 0 (0.0%) |
| 5 to 17 Years | 0 (0.0%) | 0 (0.0%) |
| 18 to 34 Years | 0 (0.0%) | 0 (0.0%) |
| 35 to 64 Years | 0 (0.0%) | 0 (0.0%) |
| 65 to 74 Years | 0 (0.0%) | 0 (0.0%) |
| 75 Years and over | 41 (30.4%) | 0 (0.0%) |
Disability Class: Vision Difficulty
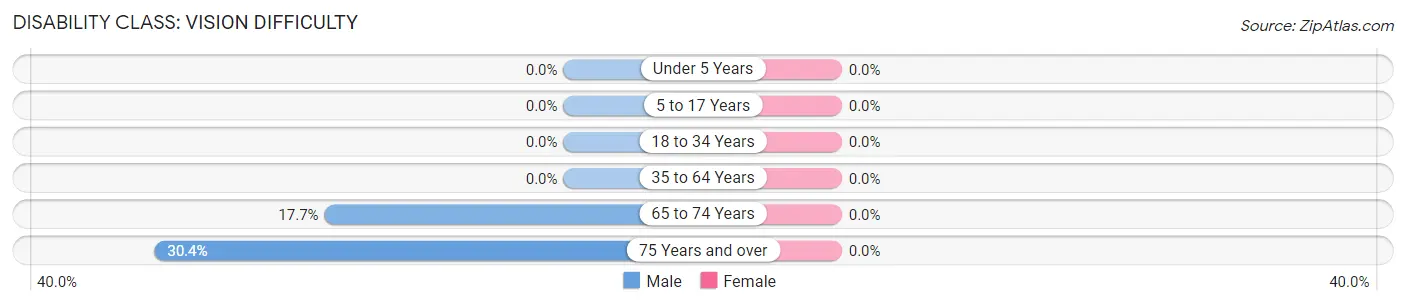
| Age Bracket | Male | Female |
| Under 5 Years | 0 (0.0%) | 0 (0.0%) |
| 5 to 17 Years | 0 (0.0%) | 0 (0.0%) |
| 18 to 34 Years | 0 (0.0%) | 0 (0.0%) |
| 35 to 64 Years | 0 (0.0%) | 0 (0.0%) |
| 65 to 74 Years | 11 (17.7%) | 0 (0.0%) |
| 75 Years and over | 41 (30.4%) | 0 (0.0%) |
Disability Class: Cognitive Difficulty
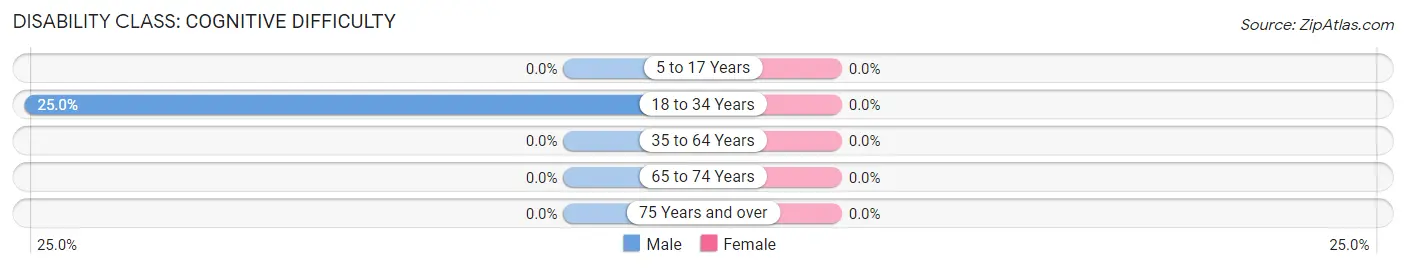
| Age Bracket | Male | Female |
| 5 to 17 Years | 0 (0.0%) | 0 (0.0%) |
| 18 to 34 Years | 11 (25.0%) | 0 (0.0%) |
| 35 to 64 Years | 0 (0.0%) | 0 (0.0%) |
| 65 to 74 Years | 0 (0.0%) | 0 (0.0%) |
| 75 Years and over | 0 (0.0%) | 0 (0.0%) |
Disability Class: Ambulatory Difficulty
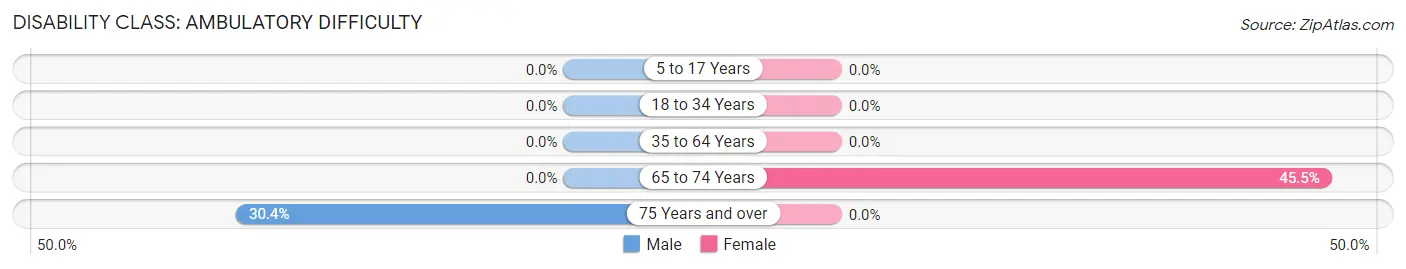
| Age Bracket | Male | Female |
| 5 to 17 Years | 0 (0.0%) | 0 (0.0%) |
| 18 to 34 Years | 0 (0.0%) | 0 (0.0%) |
| 35 to 64 Years | 0 (0.0%) | 0 (0.0%) |
| 65 to 74 Years | 0 (0.0%) | 20 (45.5%) |
| 75 Years and over | 41 (30.4%) | 0 (0.0%) |
Disability Class: Self-Care Difficulty
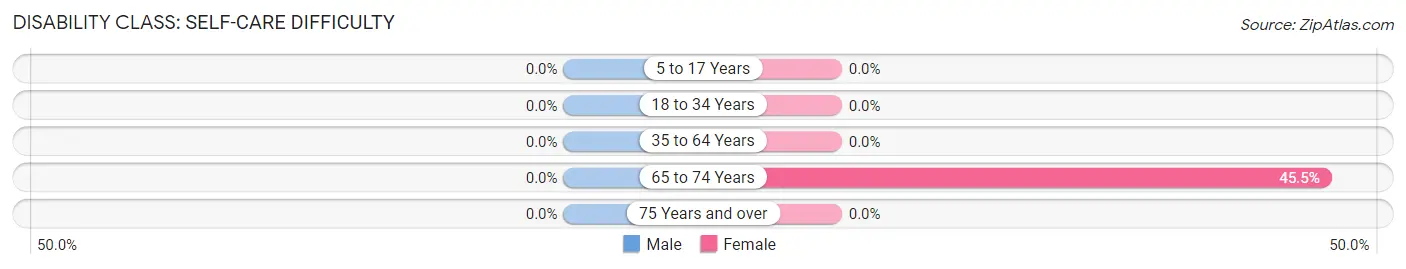
| Age Bracket | Male | Female |
| 5 to 17 Years | 0 (0.0%) | 0 (0.0%) |
| 18 to 34 Years | 0 (0.0%) | 0 (0.0%) |
| 35 to 64 Years | 0 (0.0%) | 0 (0.0%) |
| 65 to 74 Years | 0 (0.0%) | 20 (45.5%) |
| 75 Years and over | 0 (0.0%) | 0 (0.0%) |
Technology Access in Lookingglass
Computing Device Access in Lookingglass
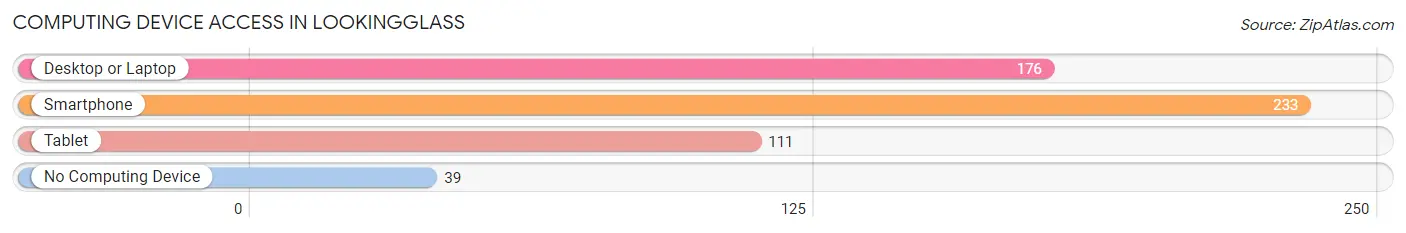
| Device Type | # Households | % Households |
| Desktop or Laptop | 176 | 56.4% |
| Smartphone | 233 | 74.7% |
| Tablet | 111 | 35.6% |
| No Computing Device | 39 | 12.5% |
| Total | 312 | 100.0% |
Internet Access in Lookingglass
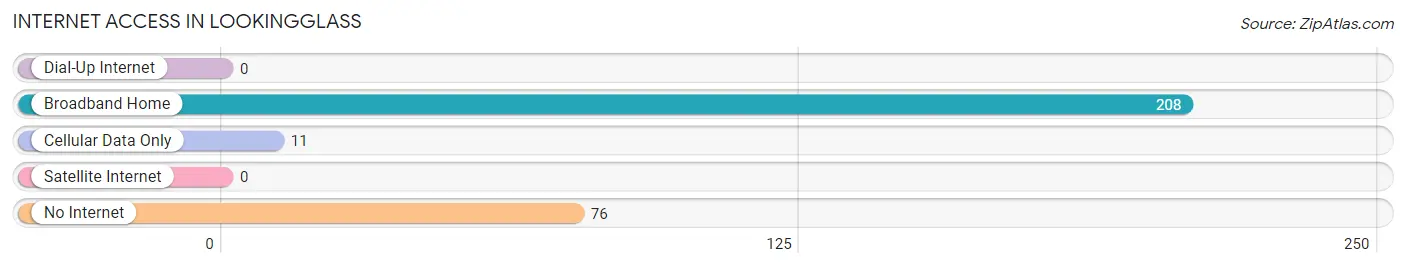
| Internet Type | # Households | % Households |
| Dial-Up Internet | 0 | 0.0% |
| Broadband Home | 208 | 66.7% |
| Cellular Data Only | 11 | 3.5% |
| Satellite Internet | 0 | 0.0% |
| No Internet | 76 | 24.4% |
| Total | 312 | 100.0% |
Lookingglass Summary
History
Lookingglass, Oregon is a small unincorporated community located in Douglas County, Oregon. It is situated on the banks of the Umpqua River, about 20 miles east of Roseburg. The area was first settled in the late 1800s by homesteaders, and the town was officially established in 1891. The town was named after the nearby Lookingglass Creek, which was named by early settlers who thought the creek resembled a looking glass.
The town of Lookingglass was originally a logging and farming community, and the local economy was largely based on these industries. In the early 1900s, the town was home to several sawmills, a grist mill, and a general store. The town also had a post office, a school, and a church.
In the 1950s, the logging industry began to decline in the area, and the town’s economy shifted to focus on tourism. The town is now home to several campgrounds, fishing spots, and other recreational activities.
Geography
Lookingglass is located in the Umpqua Valley, which is part of the Willamette Valley region of Oregon. The town is situated on the banks of the Umpqua River, about 20 miles east of Roseburg. The area is characterized by rolling hills, forests, and rivers.
The climate in Lookingglass is mild and temperate, with warm summers and cool winters. The average annual temperature is around 50 degrees Fahrenheit. The area receives an average of 40 inches of precipitation per year, with most of it falling in the winter months.
Economy
The economy of Lookingglass is largely based on tourism. The town is home to several campgrounds, fishing spots, and other recreational activities. The town also has a few small businesses, including a general store, a cafe, and a gas station.
The town is also home to several wineries, which produce a variety of wines from local grapes. The area is also known for its hazelnuts, which are grown in the nearby hills.
Demographics
As of the 2010 census, the population of Lookingglass was 545. The town is predominantly white, with about 95% of the population identifying as such. The median household income is around $35,000, and the median age is 44.
The town is home to a variety of religious denominations, including Baptist, Methodist, and Catholic. The town also has a small population of Native Americans, mostly from the Umpqua Tribe.
Conclusion
Lookingglass, Oregon is a small unincorporated community located in Douglas County, Oregon. It is situated on the banks of the Umpqua River, about 20 miles east of Roseburg. The town was originally a logging and farming community, but the economy has shifted to focus on tourism in recent years. The town is home to several campgrounds, fishing spots, and other recreational activities. The population of Lookingglass is predominantly white, with a median household income of around $35,000. The town is home to a variety of religious denominations, and a small population of Native Americans.
Common Questions
What is Per Capita Income in Lookingglass?
Per Capita income in Lookingglass is $35,111.
What is the Median Family Income in Lookingglass?
Median Family Income in Lookingglass is $62,500.
What is the Median Household income in Lookingglass?
Median Household Income in Lookingglass is $68,088.
What is Inequality or Gini Index in Lookingglass?
Inequality or Gini Index in Lookingglass is 0.39.
What is the Total Population of Lookingglass?
Total Population of Lookingglass is 762.
What is the Total Male Population of Lookingglass?
Total Male Population of Lookingglass is 385.
What is the Total Female Population of Lookingglass?
Total Female Population of Lookingglass is 377.
What is the Ratio of Males per 100 Females in Lookingglass?
There are 102.12 Males per 100 Females in Lookingglass.
What is the Ratio of Females per 100 Males in Lookingglass?
There are 97.92 Females per 100 Males in Lookingglass.
What is the Median Population Age in Lookingglass?
Median Population Age in Lookingglass is 62.7 Years.
What is the Average Family Size in Lookingglass
Average Family Size in Lookingglass is 2.6 People.
What is the Average Household Size in Lookingglass
Average Household Size in Lookingglass is 2.4 People.
How Large is the Labor Force in Lookingglass?
There are 262 People in the Labor Forcein in Lookingglass.
What is the Percentage of People in the Labor Force in Lookingglass?
41.6% of People are in the Labor Force in Lookingglass.
What is the Unemployment Rate in Lookingglass?
Unemployment Rate in Lookingglass is 14.9%.