Zip Codes with the Highest Percentage of Population Employed in Life, Physical & Social Science in Grants Pass, OR
RELATED REPORTS & OPTIONS
Life, Physical & Social Science
Grants Pass
Compare Zip Codes
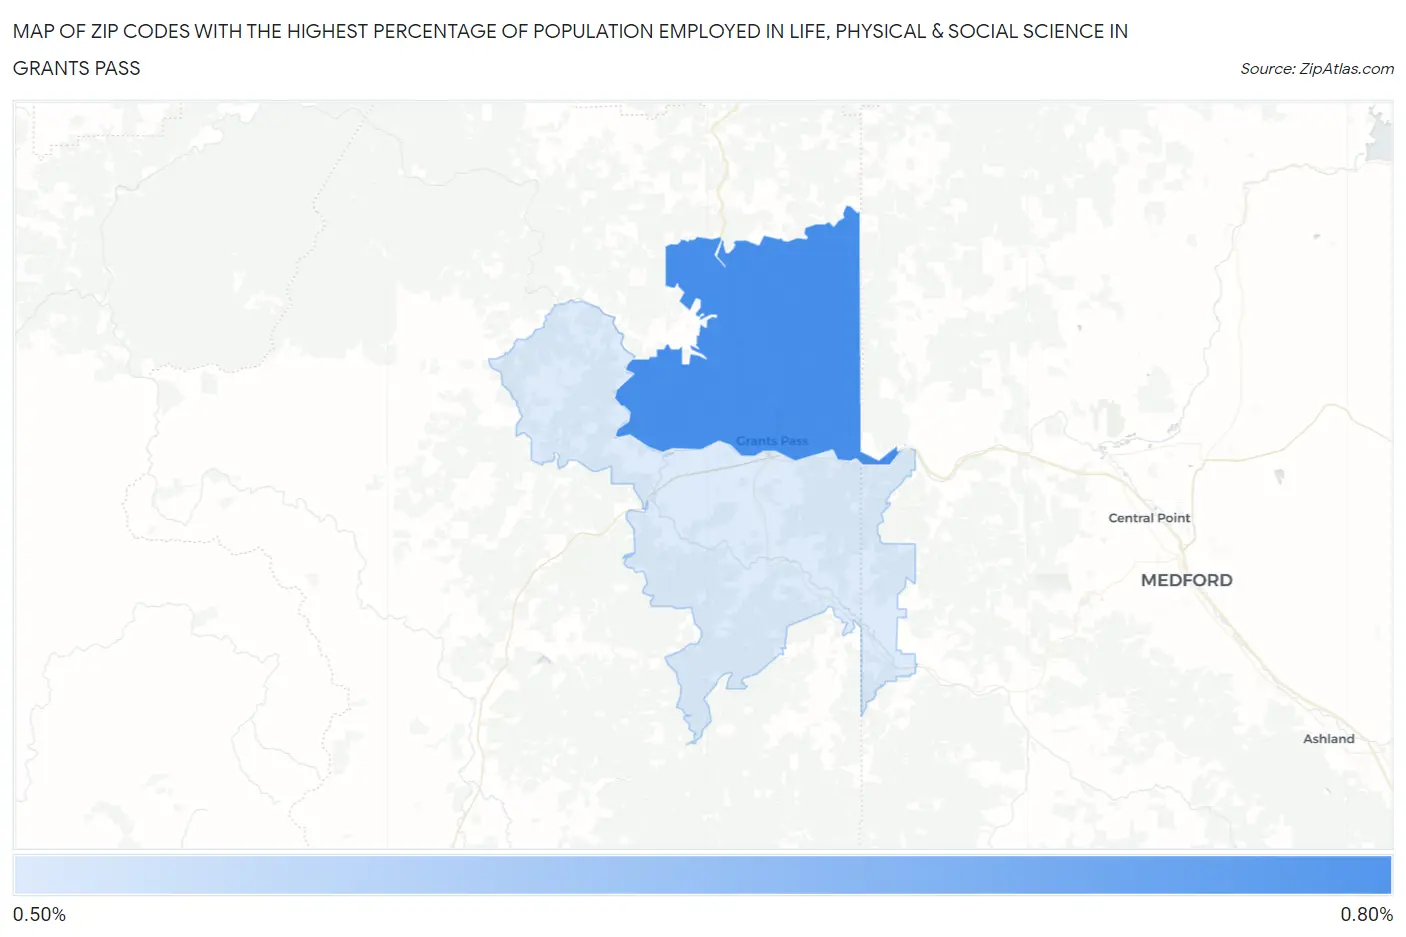
Map of Zip Codes with the Highest Percentage of Population Employed in Life, Physical & Social Science in Grants Pass
0.60%
0.65%
Zip Codes with the Highest Percentage of Population Employed in Life, Physical & Social Science in Grants Pass, OR
| Zip Code | % Employed | vs State | vs National | |
| 1. | 97526 | 0.65% | 1.3%(-0.623)#193 | 1.1%(-0.437)#12,621 |
| 2. | 97527 | 0.60% | 1.3%(-0.678)#204 | 1.1%(-0.492)#13,315 |
1
Common Questions
What are the Top Zip Codes with the Highest Percentage of Population Employed in Life, Physical & Social Science in Grants Pass, OR?
Top Zip Codes with the Highest Percentage of Population Employed in Life, Physical & Social Science in Grants Pass, OR are:
What zip code has the Highest Percentage of Population Employed in Life, Physical & Social Science in Grants Pass, OR?
97526 has the Highest Percentage of Population Employed in Life, Physical & Social Science in Grants Pass, OR with 0.65%.
What is the Percentage of Population Employed in Life, Physical & Social Science in Grants Pass, OR?
Percentage of Population Employed in Life, Physical & Social Science in Grants Pass is 0.28%.
What is the Percentage of Population Employed in Life, Physical & Social Science in Oregon?
Percentage of Population Employed in Life, Physical & Social Science in Oregon is 1.3%.
What is the Percentage of Population Employed in Life, Physical & Social Science in the United States?
Percentage of Population Employed in Life, Physical & Social Science in the United States is 1.1%.