Zip Codes with the Highest Percentage of Population Employed in Life, Physical & Social Science in Oregon
RELATED REPORTS & OPTIONS
Life, Physical & Social Science
Oregon
Compare Zip Codes
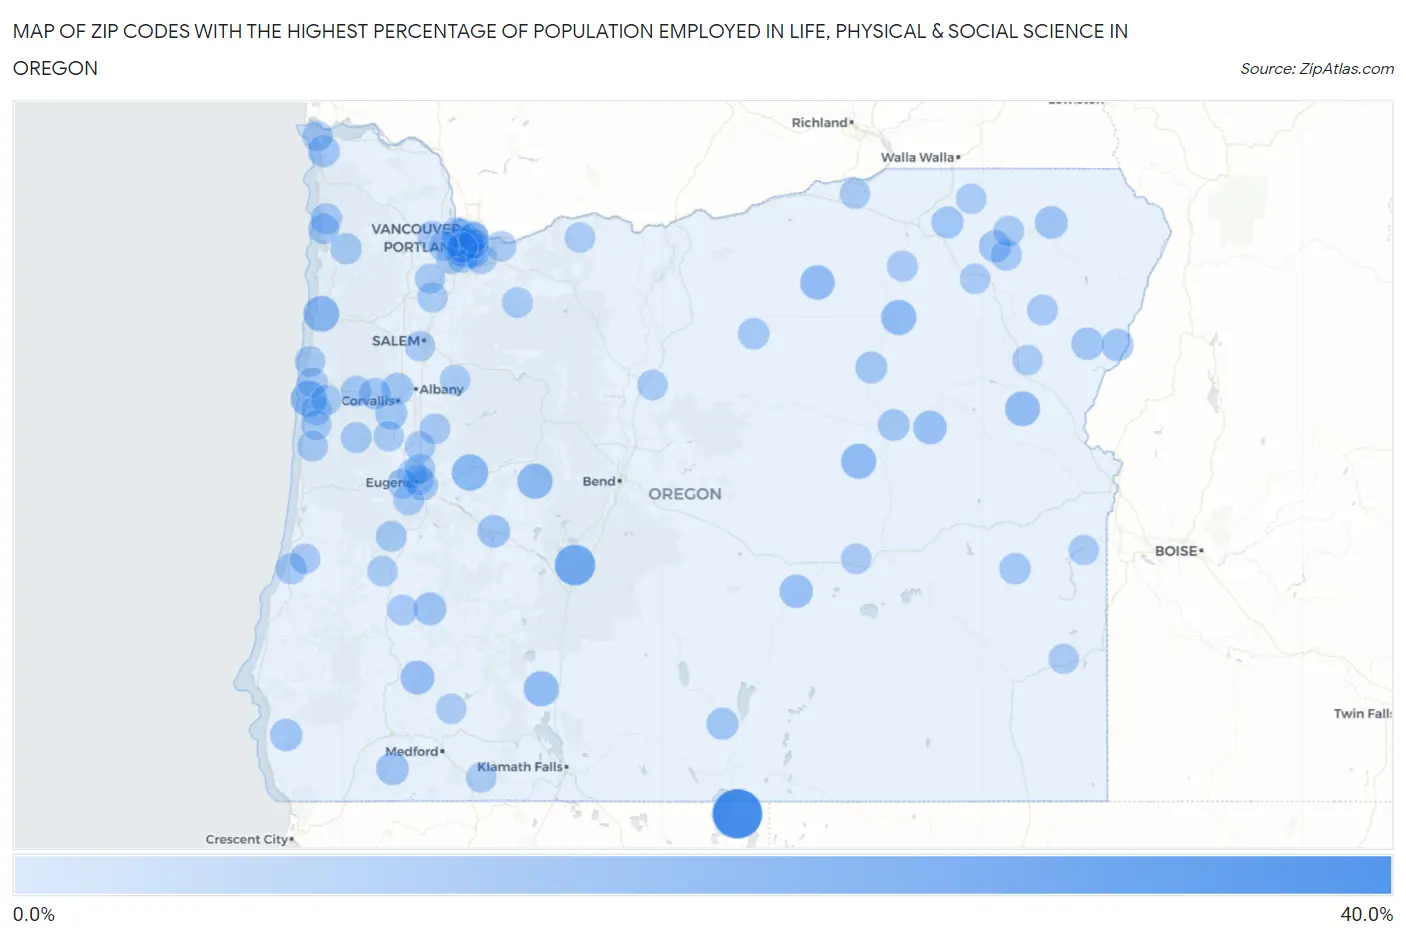
Map of Zip Codes with the Highest Percentage of Population Employed in Life, Physical & Social Science in Oregon
0.0%
40.0%
Zip Codes with the Highest Percentage of Population Employed in Life, Physical & Social Science in Oregon
| Zip Code | % Employed | vs State | vs National | |
| 1. | 97635 | 39.2% | 1.3%(+37.9)#1 | 1.1%(+38.1)#14 |
| 2. | 97737 | 21.1% | 1.3%(+19.8)#2 | 1.1%(+20.0)#55 |
| 3. | 97489 | 12.8% | 1.3%(+11.6)#3 | 1.1%(+11.8)#133 |
| 4. | 97366 | 12.4% | 1.3%(+11.1)#4 | 1.1%(+11.3)#140 |
| 5. | 97149 | 12.0% | 1.3%(+10.8)#5 | 1.1%(+11.0)#145 |
| 6. | 97413 | 11.0% | 1.3%(+9.69)#6 | 1.1%(+9.87)#173 |
| 7. | 97880 | 10.7% | 1.3%(+9.38)#7 | 1.1%(+9.56)#185 |
| 8. | 97820 | 10.5% | 1.3%(+9.19)#8 | 1.1%(+9.37)#195 |
| 9. | 97626 | 10.4% | 1.3%(+9.17)#9 | 1.1%(+9.36)#196 |
| 10. | 97819 | 10.0% | 1.3%(+8.72)#10 | 1.1%(+8.91)#211 |
| 11. | 97836 | 9.5% | 1.3%(+8.21)#11 | 1.1%(+8.40)#227 |
| 12. | 97410 | 8.1% | 1.3%(+6.87)#12 | 1.1%(+7.06)#311 |
| 13. | 97869 | 7.7% | 1.3%(+6.39)#13 | 1.1%(+6.58)#353 |
| 14. | 97758 | 7.1% | 1.3%(+5.87)#14 | 1.1%(+6.05)#395 |
| 15. | 97443 | 6.2% | 1.3%(+4.89)#15 | 1.1%(+5.07)#524 |
| 16. | 97885 | 6.1% | 1.3%(+4.81)#16 | 1.1%(+5.00)#535 |
| 17. | 97544 | 6.1% | 1.3%(+4.79)#17 | 1.1%(+4.98)#541 |
| 18. | 97463 | 5.8% | 1.3%(+4.55)#18 | 1.1%(+4.73)#573 |
| 19. | 97444 | 5.4% | 1.3%(+4.08)#19 | 1.1%(+4.27)#661 |
| 20. | 97834 | 5.3% | 1.3%(+4.07)#20 | 1.1%(+4.26)#669 |
| 21. | 97840 | 5.1% | 1.3%(+3.81)#21 | 1.1%(+3.99)#741 |
| 22. | 97876 | 4.6% | 1.3%(+3.35)#22 | 1.1%(+3.53)#875 |
| 23. | 97333 | 4.6% | 1.3%(+3.33)#23 | 1.1%(+3.51)#883 |
| 24. | 97146 | 4.5% | 1.3%(+3.19)#24 | 1.1%(+3.38)#938 |
| 25. | 97630 | 4.4% | 1.3%(+3.11)#25 | 1.1%(+3.29)#972 |
| 26. | 97845 | 4.3% | 1.3%(+3.02)#26 | 1.1%(+3.20)#1,008 |
| 27. | 97810 | 4.3% | 1.3%(+2.99)#27 | 1.1%(+3.18)#1,020 |
| 28. | 97856 | 4.2% | 1.3%(+2.91)#28 | 1.1%(+3.10)#1,053 |
| 29. | 97330 | 4.2% | 1.3%(+2.91)#29 | 1.1%(+3.09)#1,057 |
| 30. | 97370 | 3.9% | 1.3%(+2.64)#30 | 1.1%(+2.82)#1,209 |
| 31. | 97830 | 3.6% | 1.3%(+2.33)#31 | 1.1%(+2.51)#1,367 |
| 32. | 97906 | 3.4% | 1.3%(+2.15)#32 | 1.1%(+2.33)#1,485 |
| 33. | 97202 | 3.2% | 1.3%(+1.95)#33 | 1.1%(+2.13)#1,650 |
| 34. | 97147 | 3.2% | 1.3%(+1.91)#34 | 1.1%(+2.09)#1,680 |
| 35. | 97841 | 3.2% | 1.3%(+1.88)#35 | 1.1%(+2.07)#1,698 |
| 36. | 97141 | 3.0% | 1.3%(+1.74)#36 | 1.1%(+1.93)#1,848 |
| 37. | 97403 | 2.9% | 1.3%(+1.59)#37 | 1.1%(+1.78)#2,035 |
| 38. | 97221 | 2.8% | 1.3%(+1.49)#38 | 1.1%(+1.68)#2,156 |
| 39. | 97324 | 2.7% | 1.3%(+1.47)#39 | 1.1%(+1.66)#2,177 |
| 40. | 97239 | 2.7% | 1.3%(+1.45)#40 | 1.1%(+1.63)#2,217 |
| 41. | 97459 | 2.7% | 1.3%(+1.39)#41 | 1.1%(+1.58)#2,283 |
| 42. | 97435 | 2.6% | 1.3%(+1.37)#42 | 1.1%(+1.55)#2,321 |
| 43. | 97136 | 2.6% | 1.3%(+1.35)#43 | 1.1%(+1.54)#2,345 |
| 44. | 97212 | 2.6% | 1.3%(+1.32)#44 | 1.1%(+1.50)#2,408 |
| 45. | 97206 | 2.6% | 1.3%(+1.29)#45 | 1.1%(+1.47)#2,461 |
| 46. | 97868 | 2.5% | 1.3%(+1.26)#46 | 1.1%(+1.45)#2,500 |
| 47. | 97201 | 2.5% | 1.3%(+1.24)#47 | 1.1%(+1.42)#2,549 |
| 48. | 97209 | 2.5% | 1.3%(+1.22)#48 | 1.1%(+1.40)#2,586 |
| 49. | 97214 | 2.5% | 1.3%(+1.18)#49 | 1.1%(+1.36)#2,653 |
| 50. | 97326 | 2.4% | 1.3%(+1.17)#50 | 1.1%(+1.35)#2,670 |
| 51. | 97498 | 2.4% | 1.3%(+1.17)#51 | 1.1%(+1.35)#2,671 |
| 52. | 97232 | 2.4% | 1.3%(+1.16)#52 | 1.1%(+1.35)#2,676 |
| 53. | 97219 | 2.4% | 1.3%(+1.12)#53 | 1.1%(+1.31)#2,758 |
| 54. | 97223 | 2.3% | 1.3%(+1.07)#54 | 1.1%(+1.26)#2,844 |
| 55. | 97405 | 2.3% | 1.3%(+1.07)#55 | 1.1%(+1.26)#2,848 |
| 56. | 97124 | 2.3% | 1.3%(+1.06)#56 | 1.1%(+1.25)#2,858 |
| 57. | 97883 | 2.3% | 1.3%(+1.06)#57 | 1.1%(+1.24)#2,869 |
| 58. | 97023 | 2.3% | 1.3%(+0.993)#58 | 1.1%(+1.18)#3,023 |
| 59. | 97827 | 2.2% | 1.3%(+0.961)#59 | 1.1%(+1.15)#3,097 |
| 60. | 97376 | 2.2% | 1.3%(+0.925)#60 | 1.1%(+1.11)#3,176 |
| 61. | 97327 | 2.2% | 1.3%(+0.880)#61 | 1.1%(+1.07)#3,285 |
| 62. | 97121 | 2.1% | 1.3%(+0.807)#62 | 1.1%(+0.992)#3,460 |
| 63. | 97210 | 2.1% | 1.3%(+0.784)#63 | 1.1%(+0.969)#3,516 |
| 64. | 97470 | 2.1% | 1.3%(+0.778)#64 | 1.1%(+0.963)#3,531 |
| 65. | 97446 | 2.0% | 1.3%(+0.743)#65 | 1.1%(+0.928)#3,634 |
| 66. | 97211 | 2.0% | 1.3%(+0.700)#66 | 1.1%(+0.886)#3,754 |
| 67. | 97738 | 1.9% | 1.3%(+0.671)#67 | 1.1%(+0.857)#3,839 |
| 68. | 97341 | 1.9% | 1.3%(+0.635)#68 | 1.1%(+0.821)#3,941 |
| 69. | 97401 | 1.9% | 1.3%(+0.627)#69 | 1.1%(+0.813)#3,964 |
| 70. | 97137 | 1.9% | 1.3%(+0.578)#70 | 1.1%(+0.764)#4,122 |
| 71. | 97462 | 1.8% | 1.3%(+0.569)#71 | 1.1%(+0.755)#4,151 |
| 72. | 97217 | 1.8% | 1.3%(+0.563)#72 | 1.1%(+0.749)#4,179 |
| 73. | 97449 | 1.8% | 1.3%(+0.553)#73 | 1.1%(+0.738)#4,220 |
| 74. | 97365 | 1.8% | 1.3%(+0.548)#74 | 1.1%(+0.734)#4,241 |
| 75. | 97086 | 1.8% | 1.3%(+0.509)#75 | 1.1%(+0.694)#4,382 |
| 76. | 97203 | 1.8% | 1.3%(+0.484)#76 | 1.1%(+0.670)#4,474 |
| 77. | 97539 | 1.7% | 1.3%(+0.471)#77 | 1.1%(+0.657)#4,518 |
| 78. | 97838 | 1.7% | 1.3%(+0.453)#78 | 1.1%(+0.639)#4,595 |
| 79. | 97374 | 1.7% | 1.3%(+0.450)#79 | 1.1%(+0.636)#4,608 |
| 80. | 97060 | 1.7% | 1.3%(+0.450)#80 | 1.1%(+0.636)#4,609 |
| 81. | 97391 | 1.7% | 1.3%(+0.435)#81 | 1.1%(+0.621)#4,665 |
| 82. | 97741 | 1.7% | 1.3%(+0.431)#82 | 1.1%(+0.617)#4,691 |
| 83. | 97850 | 1.7% | 1.3%(+0.409)#83 | 1.1%(+0.594)#4,794 |
| 84. | 97213 | 1.7% | 1.3%(+0.386)#84 | 1.1%(+0.571)#4,887 |
| 85. | 97456 | 1.7% | 1.3%(+0.381)#85 | 1.1%(+0.567)#4,907 |
| 86. | 97394 | 1.7% | 1.3%(+0.378)#86 | 1.1%(+0.564)#4,924 |
| 87. | 97218 | 1.6% | 1.3%(+0.361)#87 | 1.1%(+0.546)#5,006 |
| 88. | 97814 | 1.6% | 1.3%(+0.341)#88 | 1.1%(+0.527)#5,081 |
| 89. | 97404 | 1.6% | 1.3%(+0.327)#89 | 1.1%(+0.513)#5,136 |
| 90. | 97402 | 1.6% | 1.3%(+0.308)#90 | 1.1%(+0.494)#5,225 |
| 91. | 97205 | 1.6% | 1.3%(+0.308)#91 | 1.1%(+0.494)#5,226 |
| 92. | 97910 | 1.6% | 1.3%(+0.304)#92 | 1.1%(+0.490)#5,244 |
| 93. | 97031 | 1.6% | 1.3%(+0.304)#93 | 1.1%(+0.490)#5,246 |
| 94. | 97886 | 1.6% | 1.3%(+0.300)#94 | 1.1%(+0.486)#5,264 |
| 95. | 97520 | 1.5% | 1.3%(+0.249)#95 | 1.1%(+0.434)#5,520 |
| 96. | 97132 | 1.5% | 1.3%(+0.245)#96 | 1.1%(+0.430)#5,540 |
| 97. | 97408 | 1.5% | 1.3%(+0.239)#97 | 1.1%(+0.425)#5,565 |
| 98. | 97913 | 1.5% | 1.3%(+0.199)#98 | 1.1%(+0.384)#5,794 |
| 99. | 97302 | 1.5% | 1.3%(+0.193)#99 | 1.1%(+0.379)#5,826 |
| 100. | 97006 | 1.4% | 1.3%(+0.155)#100 | 1.1%(+0.341)#6,014 |
Common Questions
What are the Top 10 Zip Codes with the Highest Percentage of Population Employed in Life, Physical & Social Science in Oregon?
Top 10 Zip Codes with the Highest Percentage of Population Employed in Life, Physical & Social Science in Oregon are:
What zip code has the Highest Percentage of Population Employed in Life, Physical & Social Science in Oregon?
97635 has the Highest Percentage of Population Employed in Life, Physical & Social Science in Oregon with 39.2%.
What is the Percentage of Population Employed in Life, Physical & Social Science in the State of Oregon?
Percentage of Population Employed in Life, Physical & Social Science in Oregon is 1.3%.
What is the Percentage of Population Employed in Life, Physical & Social Science in the United States?
Percentage of Population Employed in Life, Physical & Social Science in the United States is 1.1%.