Harbor, OR Map & Demographics
Harbor Map
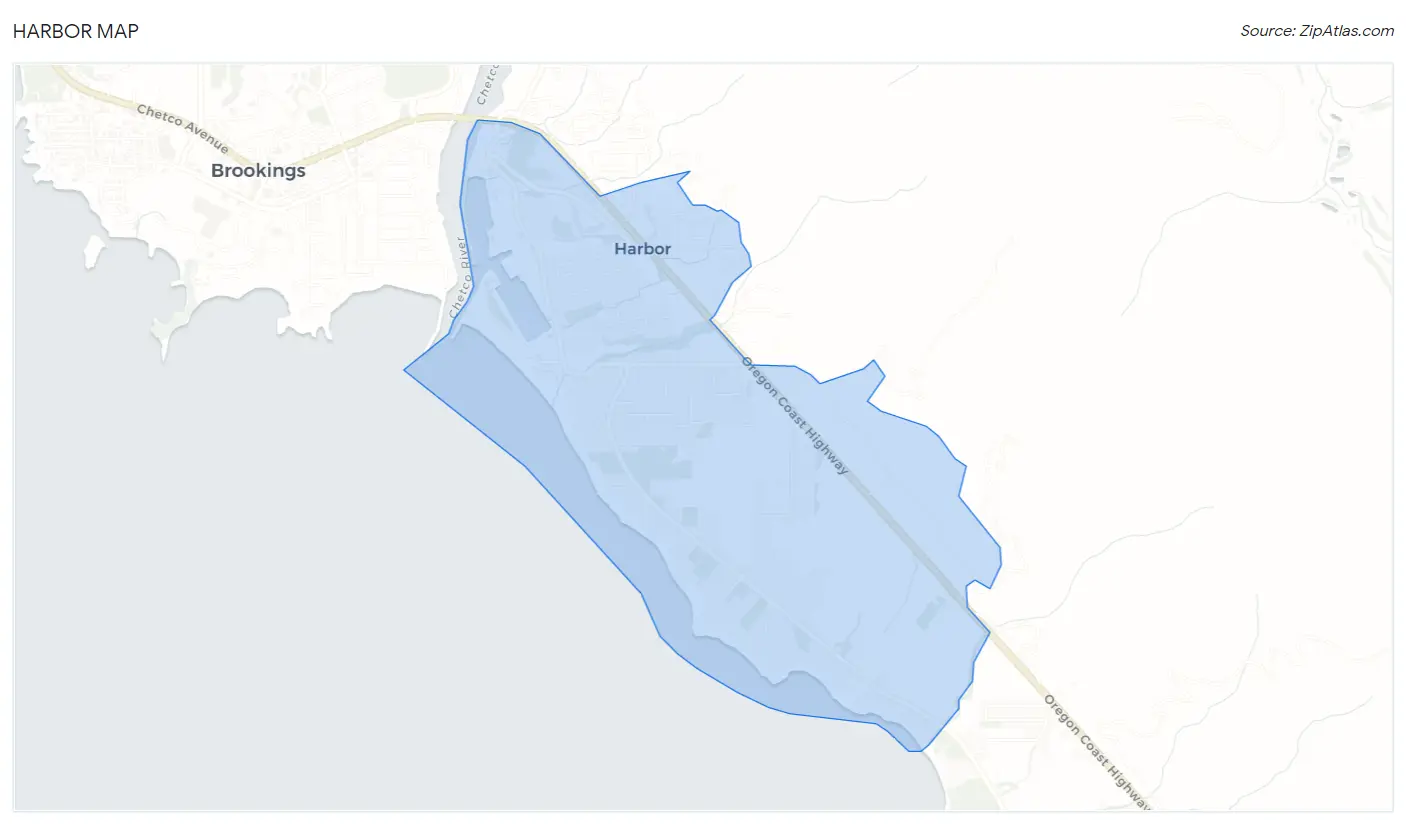
Harbor Overview
$34,106
PER CAPITA INCOME
$60,691
AVG FAMILY INCOME
$46,528
AVG HOUSEHOLD INCOME
35.4%
WAGE / INCOME GAP [ % ]
64.6¢/ $1
WAGE / INCOME GAP [ $ ]
0.39
INEQUALITY / GINI INDEX
2,003
TOTAL POPULATION
796
MALE POPULATION
1,207
FEMALE POPULATION
65.95
MALES / 100 FEMALES
151.63
FEMALES / 100 MALES
69.4
MEDIAN AGE
2.0
AVG FAMILY SIZE
1.7
AVG HOUSEHOLD SIZE
531
LABOR FORCE [ PEOPLE ]
26.8%
PERCENT IN LABOR FORCE
5.7%
UNEMPLOYMENT RATE
Harbor Area Codes
Income in Harbor
Income Overview in Harbor
Per Capita Income in Harbor is $34,106, while median incomes of families and households are $60,691 and $46,528 respectively.
| Characteristic | Number | Measure |
| Per Capita Income | 2,003 | $34,106 |
| Median Family Income | 721 | $60,691 |
| Mean Family Income | 721 | $69,204 |
| Median Household Income | 1,169 | $46,528 |
| Mean Household Income | 1,169 | $59,131 |
| Income Deficit | 721 | $0 |
| Wage / Income Gap (%) | 2,003 | 35.39% |
| Wage / Income Gap ($) | 2,003 | 64.61¢ per $1 |
| Gini / Inequality Index | 2,003 | 0.39 |
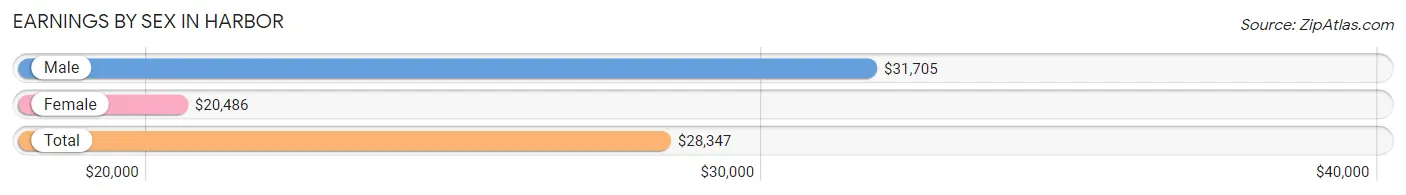
Earnings by Sex in Harbor
Average Earnings in Harbor are $28,347, $31,705 for men and $20,486 for women, a difference of 35.4%.
| Sex | Number | Average Earnings |
| Male | 233 (43.4%) | $31,705 |
| Female | 304 (56.6%) | $20,486 |
| Total | 537 (100.0%) | $28,347 |
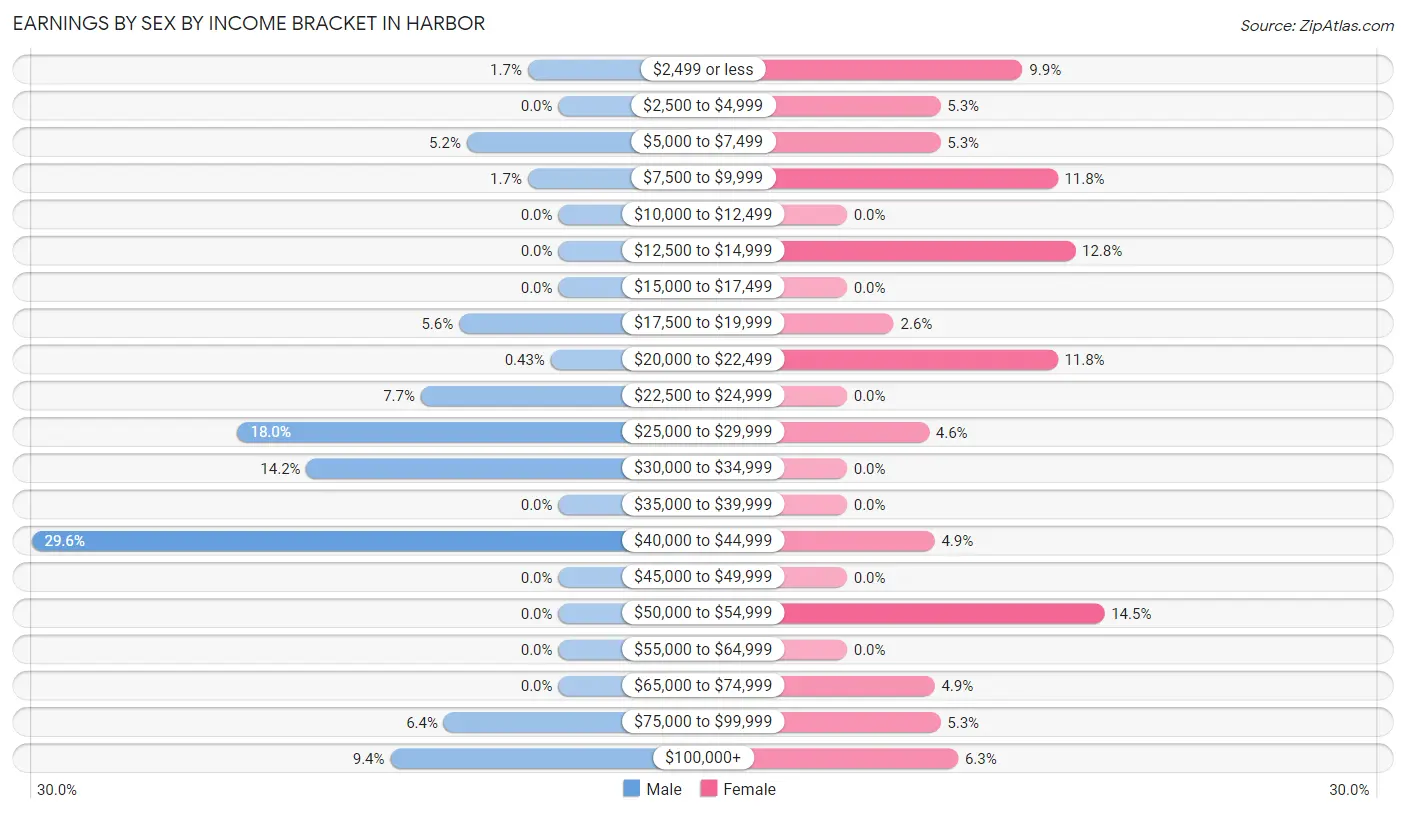
Earnings by Sex by Income Bracket in Harbor
The most common earnings brackets in Harbor are $40,000 to $44,999 for men (69 | 29.6%) and $50,000 to $54,999 for women (44 | 14.5%).
| Income | Male | Female |
| $2,499 or less | 4 (1.7%) | 30 (9.9%) |
| $2,500 to $4,999 | 0 (0.0%) | 16 (5.3%) |
| $5,000 to $7,499 | 12 (5.1%) | 16 (5.3%) |
| $7,500 to $9,999 | 4 (1.7%) | 36 (11.8%) |
| $10,000 to $12,499 | 0 (0.0%) | 0 (0.0%) |
| $12,500 to $14,999 | 0 (0.0%) | 39 (12.8%) |
| $15,000 to $17,499 | 0 (0.0%) | 0 (0.0%) |
| $17,500 to $19,999 | 13 (5.6%) | 8 (2.6%) |
| $20,000 to $22,499 | 1 (0.4%) | 36 (11.8%) |
| $22,500 to $24,999 | 18 (7.7%) | 0 (0.0%) |
| $25,000 to $29,999 | 42 (18.0%) | 14 (4.6%) |
| $30,000 to $34,999 | 33 (14.2%) | 0 (0.0%) |
| $35,000 to $39,999 | 0 (0.0%) | 0 (0.0%) |
| $40,000 to $44,999 | 69 (29.6%) | 15 (4.9%) |
| $45,000 to $49,999 | 0 (0.0%) | 0 (0.0%) |
| $50,000 to $54,999 | 0 (0.0%) | 44 (14.5%) |
| $55,000 to $64,999 | 0 (0.0%) | 0 (0.0%) |
| $65,000 to $74,999 | 0 (0.0%) | 15 (4.9%) |
| $75,000 to $99,999 | 15 (6.4%) | 16 (5.3%) |
| $100,000+ | 22 (9.4%) | 19 (6.2%) |
| Total | 233 (100.0%) | 304 (100.0%) |
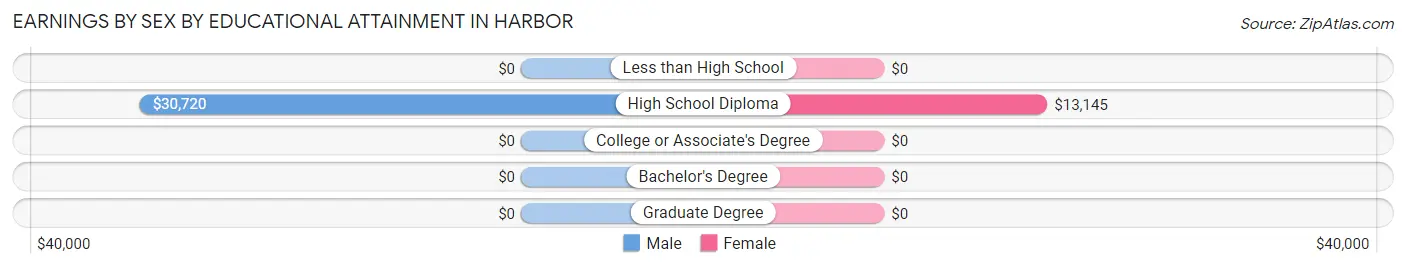
Earnings by Sex by Educational Attainment in Harbor
| Educational Attainment | Male Income | Female Income |
| Less than High School | - | - |
| High School Diploma | $30,720 | $13,145 |
| College or Associate's Degree | - | - |
| Bachelor's Degree | - | - |
| Graduate Degree | - | - |
| Total | $30,227 | $0 |
Family Income in Harbor
Family Income Brackets in Harbor
According to the Harbor family income data, there are 197 families falling into the $75,000 to $99,999 income range, which is the most common income bracket and makes up 27.3% of all families.
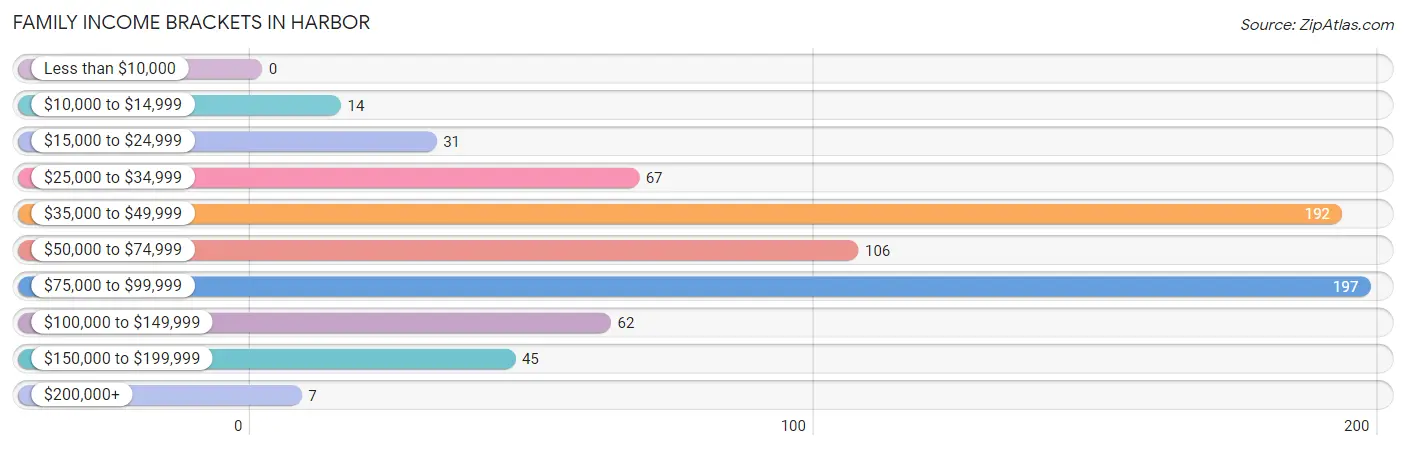
| Income Bracket | # Families | % Families |
| Less than $10,000 | 0 | 0.0% |
| $10,000 to $14,999 | 14 | 1.9% |
| $15,000 to $24,999 | 31 | 4.3% |
| $25,000 to $34,999 | 67 | 9.3% |
| $35,000 to $49,999 | 192 | 26.6% |
| $50,000 to $74,999 | 106 | 14.7% |
| $75,000 to $99,999 | 197 | 27.3% |
| $100,000 to $149,999 | 62 | 8.6% |
| $150,000 to $199,999 | 45 | 6.2% |
| $200,000+ | 7 | 1.0% |
Family Income by Famaliy Size in Harbor
2-person families (626 | 86.8%) account for the highest median family income in Harbor with $60,461 per family, while 2-person families (626 | 86.8%) have the highest median income of $30,230 per family member.
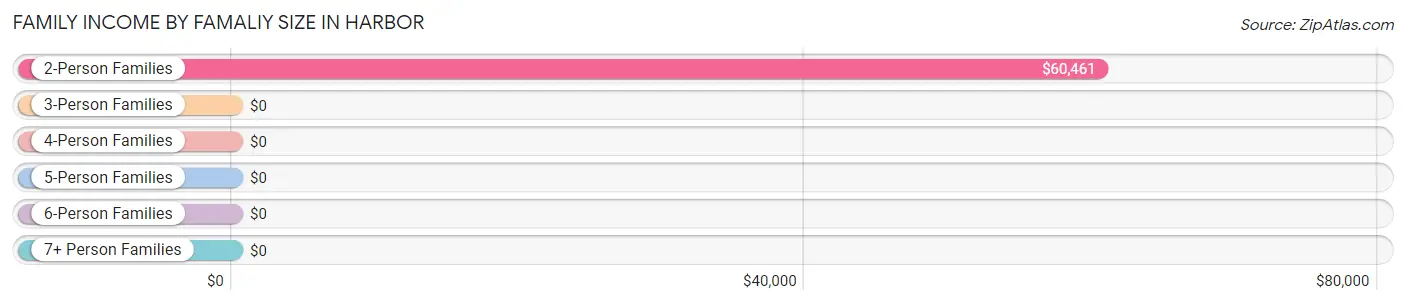
| Income Bracket | # Families | Median Income |
| 2-Person Families | 626 (86.8%) | $60,461 |
| 3-Person Families | 72 (10.0%) | $0 |
| 4-Person Families | 15 (2.1%) | $0 |
| 5-Person Families | 0 (0.0%) | $0 |
| 6-Person Families | 8 (1.1%) | $0 |
| 7+ Person Families | 0 (0.0%) | $0 |
| Total | 721 (100.0%) | $60,691 |
Family Income by Number of Earners in Harbor
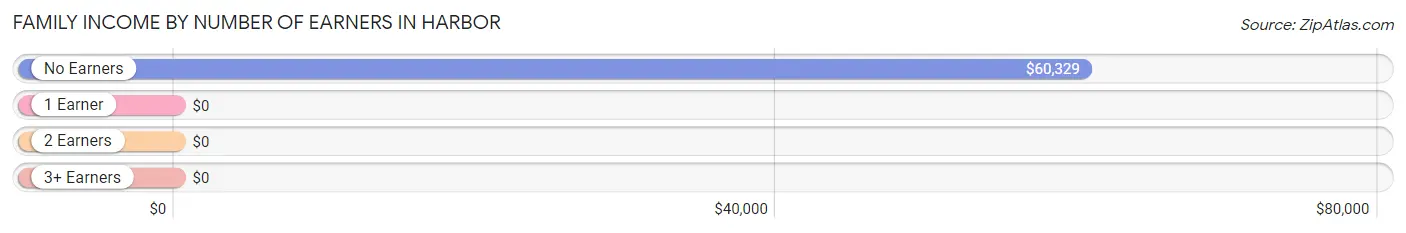
| Number of Earners | # Families | Median Income |
| No Earners | 536 (74.3%) | $60,329 |
| 1 Earner | 89 (12.3%) | $0 |
| 2 Earners | 73 (10.1%) | $0 |
| 3+ Earners | 23 (3.2%) | $0 |
| Total | 721 (100.0%) | $60,691 |
Household Income in Harbor
Household Income Brackets in Harbor
With 241 households falling in the category, the $75,000 to $99,999 income range is the most frequent in Harbor, accounting for 20.6% of all households.
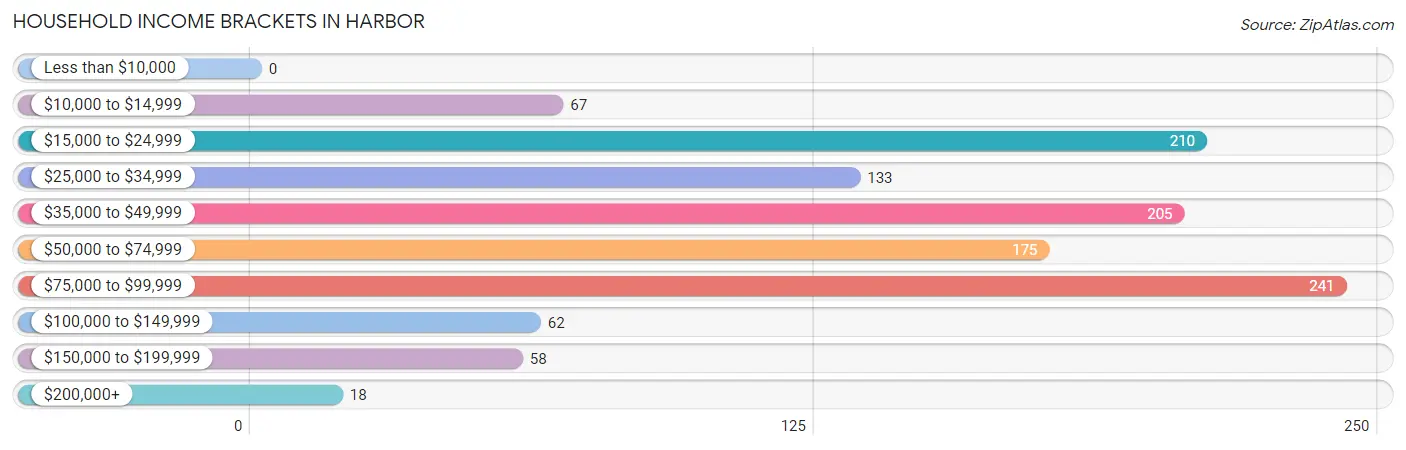
| Income Bracket | # Households | % Households |
| Less than $10,000 | 0 | 0.0% |
| $10,000 to $14,999 | 67 | 5.7% |
| $15,000 to $24,999 | 210 | 18.0% |
| $25,000 to $34,999 | 133 | 11.4% |
| $35,000 to $49,999 | 205 | 17.5% |
| $50,000 to $74,999 | 175 | 15.0% |
| $75,000 to $99,999 | 241 | 20.6% |
| $100,000 to $149,999 | 62 | 5.3% |
| $150,000 to $199,999 | 58 | 5.0% |
| $200,000+ | 18 | 1.5% |
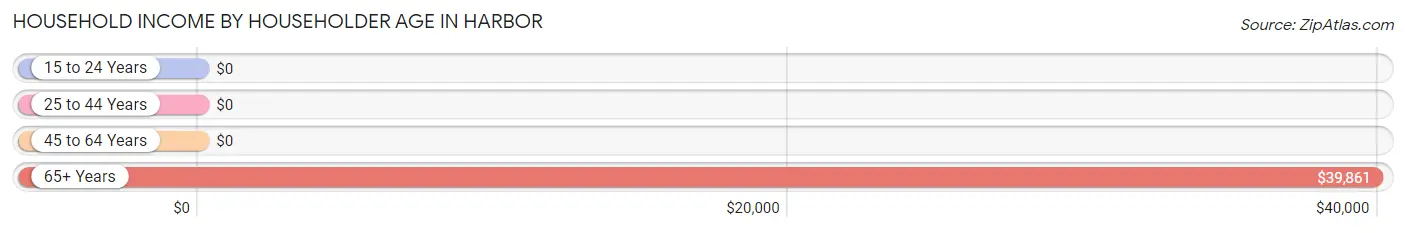
Household Income by Householder Age in Harbor
The median household income in Harbor is $46,528, with the highest median household income of $39,861 found in the 65+ years age bracket for the primary householder. A total of 860 households (73.6%) fall into this category. Meanwhile, the 15 to 24 years age bracket for the primary householder has the lowest median household income of $0, with 80 households (6.8%) in this group.
| Income Bracket | # Households | Median Income |
| 15 to 24 Years | 80 (6.8%) | $0 |
| 25 to 44 Years | 15 (1.3%) | $0 |
| 45 to 64 Years | 214 (18.3%) | $0 |
| 65+ Years | 860 (73.6%) | $39,861 |
| Total | 1,169 (100.0%) | $46,528 |
Poverty in Harbor
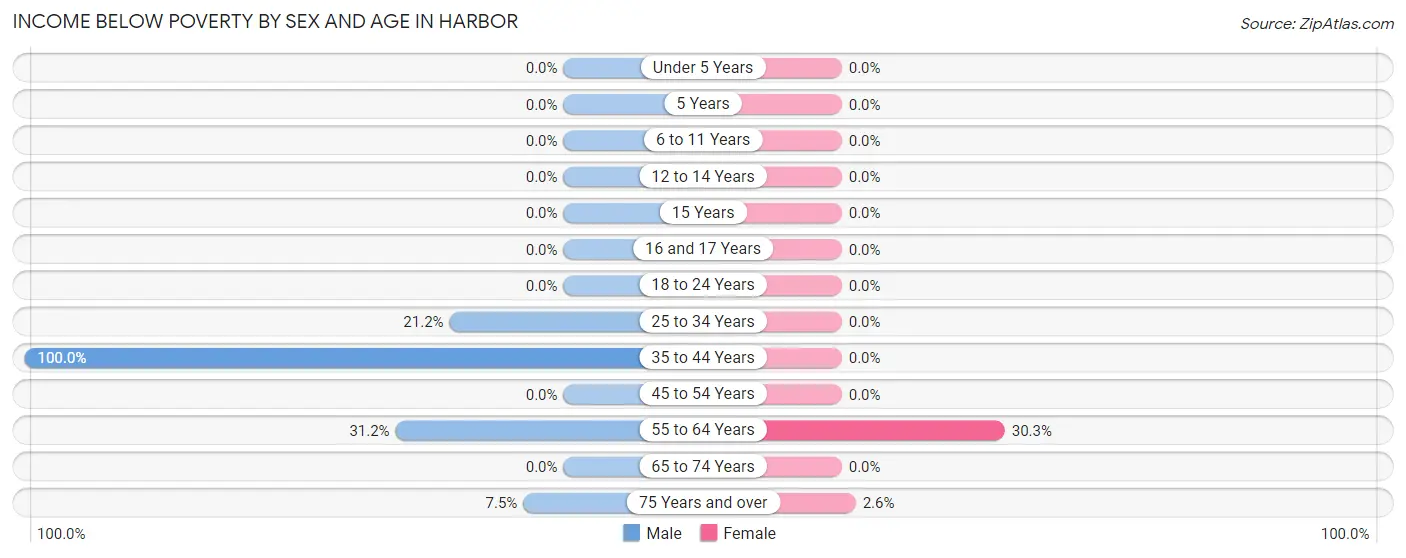
Income Below Poverty by Sex and Age in Harbor
With 10.2% poverty level for males and 4.8% for females among the residents of Harbor, 35 to 44 year old males and 55 to 64 year old females are the most vulnerable to poverty, with 7 males (100.0%) and 46 females (30.3%) in their respective age groups living below the poverty level.
| Age Bracket | Male | Female |
| Under 5 Years | 0 (0.0%) | 0 (0.0%) |
| 5 Years | 0 (0.0%) | 0 (0.0%) |
| 6 to 11 Years | 0 (0.0%) | 0 (0.0%) |
| 12 to 14 Years | 0 (0.0%) | 0 (0.0%) |
| 15 Years | 0 (0.0%) | 0 (0.0%) |
| 16 and 17 Years | 0 (0.0%) | 0 (0.0%) |
| 18 to 24 Years | 0 (0.0%) | 0 (0.0%) |
| 25 to 34 Years | 11 (21.1%) | 0 (0.0%) |
| 35 to 44 Years | 7 (100.0%) | 0 (0.0%) |
| 45 to 54 Years | 0 (0.0%) | 0 (0.0%) |
| 55 to 64 Years | 48 (31.2%) | 46 (30.3%) |
| 65 to 74 Years | 0 (0.0%) | 0 (0.0%) |
| 75 Years and over | 14 (7.4%) | 12 (2.6%) |
| Total | 80 (10.2%) | 58 (4.8%) |
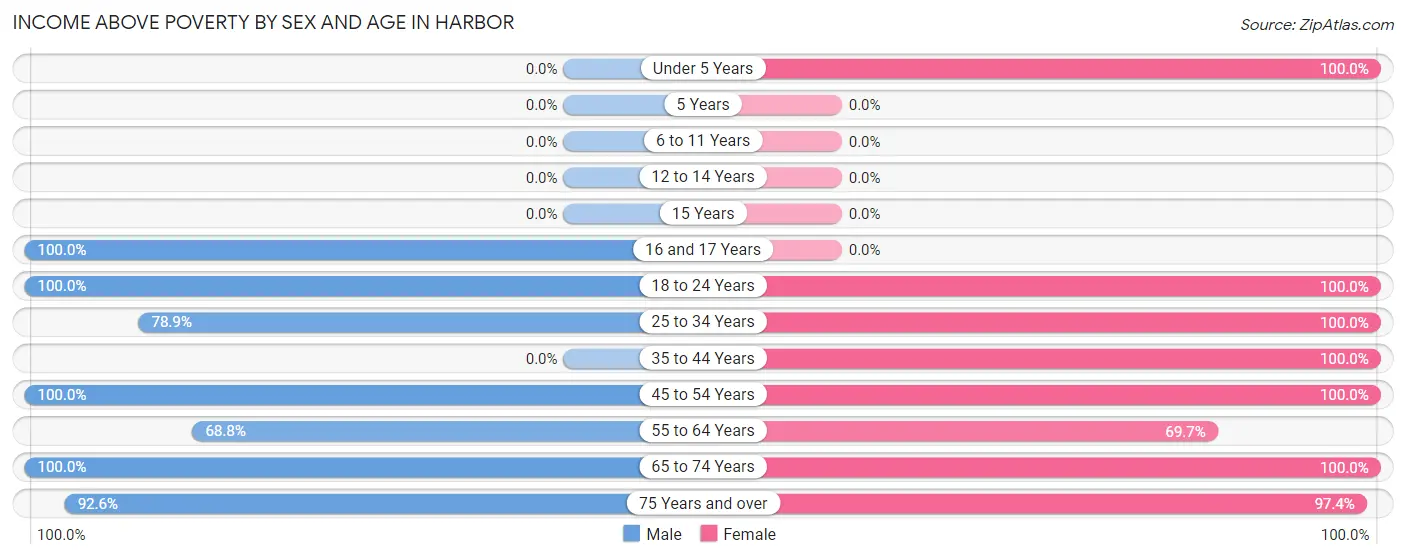
Income Above Poverty by Sex and Age in Harbor
According to the poverty statistics in Harbor, males aged 16 and 17 years and females aged under 5 years are the age groups that are most secure financially, with 100.0% of males and 100.0% of females in these age groups living above the poverty line.
| Age Bracket | Male | Female |
| Under 5 Years | 0 (0.0%) | 19 (100.0%) |
| 5 Years | 0 (0.0%) | 0 (0.0%) |
| 6 to 11 Years | 0 (0.0%) | 0 (0.0%) |
| 12 to 14 Years | 0 (0.0%) | 0 (0.0%) |
| 15 Years | 0 (0.0%) | 0 (0.0%) |
| 16 and 17 Years | 23 (100.0%) | 0 (0.0%) |
| 18 to 24 Years | 75 (100.0%) | 110 (100.0%) |
| 25 to 34 Years | 41 (78.8%) | 19 (100.0%) |
| 35 to 44 Years | 0 (0.0%) | 20 (100.0%) |
| 45 to 54 Years | 26 (100.0%) | 8 (100.0%) |
| 55 to 64 Years | 106 (68.8%) | 106 (69.7%) |
| 65 to 74 Years | 262 (100.0%) | 412 (100.0%) |
| 75 Years and over | 174 (92.5%) | 453 (97.4%) |
| Total | 707 (89.8%) | 1,147 (95.2%) |
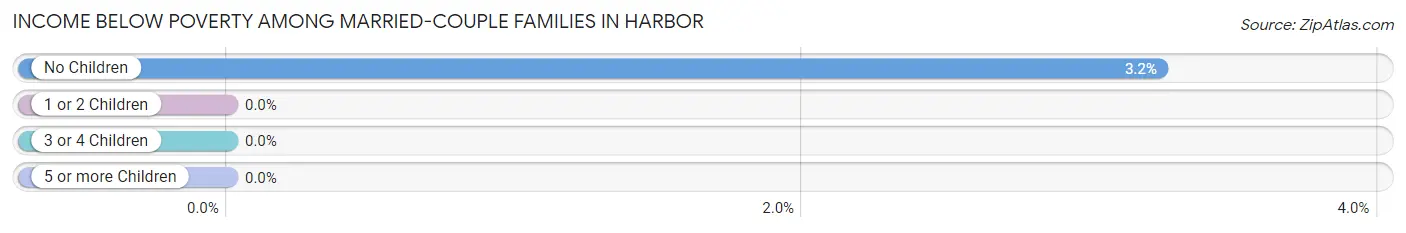
Income Below Poverty Among Married-Couple Families in Harbor
The poverty statistics for married-couple families in Harbor show that 2.9% or 14 of the total 483 families live below the poverty line. Families with no children have the highest poverty rate of 3.2%, comprising of 14 families. On the other hand, families with 1 or 2 children have the lowest poverty rate of 0.0%, which includes 0 families.
| Children | Above Poverty | Below Poverty |
| No Children | 418 (96.8%) | 14 (3.2%) |
| 1 or 2 Children | 51 (100.0%) | 0 (0.0%) |
| 3 or 4 Children | 0 (0.0%) | 0 (0.0%) |
| 5 or more Children | 0 (0.0%) | 0 (0.0%) |
| Total | 469 (97.1%) | 14 (2.9%) |
Income Below Poverty Among Single-Parent Households in Harbor
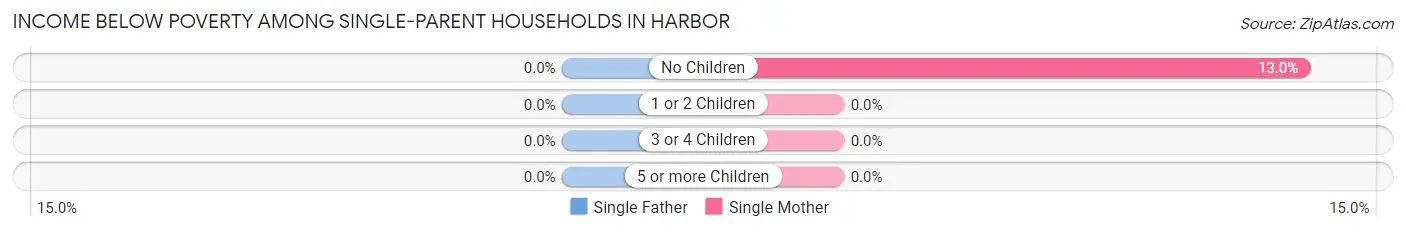
| Children | Single Father | Single Mother |
| No Children | 0 (0.0%) | 31 (13.0%) |
| 1 or 2 Children | 0 (0.0%) | 0 (0.0%) |
| 3 or 4 Children | 0 (0.0%) | 0 (0.0%) |
| 5 or more Children | 0 (0.0%) | 0 (0.0%) |
| Total | 0 (0.0%) | 31 (13.0%) |
Income Below Poverty Among Married-Couple vs Single-Parent Households in Harbor
The poverty data for Harbor shows that 14 of the married-couple family households (2.9%) and 31 of the single-parent households (13.0%) are living below the poverty level. Within the married-couple family households, those with no children have the highest poverty rate, with 14 households (3.2%) falling below the poverty line. Among the single-parent households, those with no children have the highest poverty rate, with 31 household (13.0%) living below poverty.
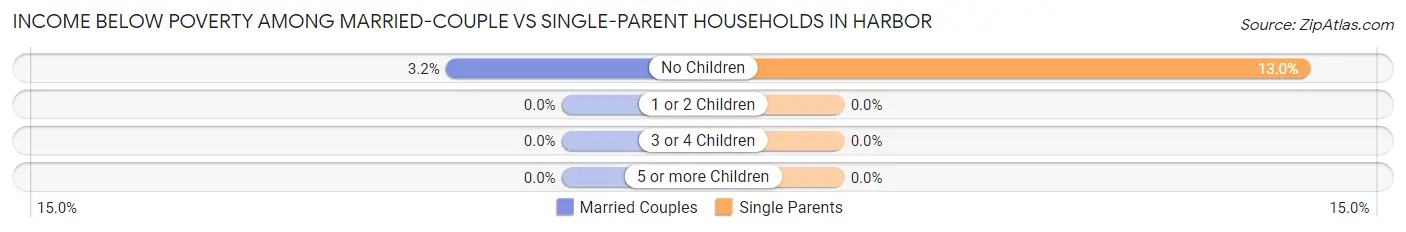
| Children | Married-Couple Families | Single-Parent Households |
| No Children | 14 (3.2%) | 31 (13.0%) |
| 1 or 2 Children | 0 (0.0%) | 0 (0.0%) |
| 3 or 4 Children | 0 (0.0%) | 0 (0.0%) |
| 5 or more Children | 0 (0.0%) | 0 (0.0%) |
| Total | 14 (2.9%) | 31 (13.0%) |
Race in Harbor
The most populous races in Harbor are White / Caucasian (1,901 | 94.9%), Two or more Races (84 | 4.2%), and Hispanic or Latino (56 | 2.8%).
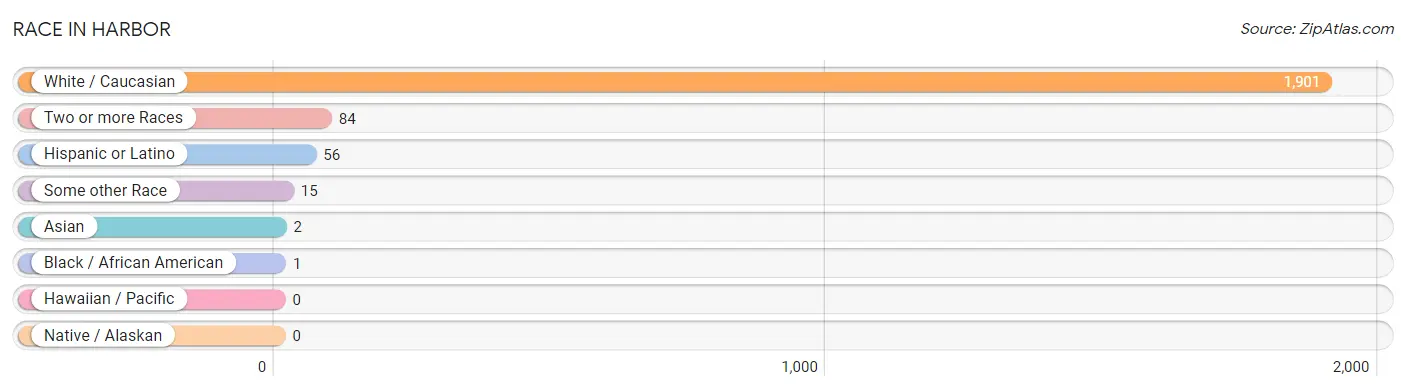
| Race | # Population | % Population |
| Asian | 2 | 0.1% |
| Black / African American | 1 | 0.1% |
| Hawaiian / Pacific | 0 | 0.0% |
| Hispanic or Latino | 56 | 2.8% |
| Native / Alaskan | 0 | 0.0% |
| White / Caucasian | 1,901 | 94.9% |
| Two or more Races | 84 | 4.2% |
| Some other Race | 15 | 0.7% |
| Total | 2,003 | 100.0% |
Ancestry in Harbor
The most populous ancestries reported in Harbor are German (642 | 32.1%), American (273 | 13.6%), English (259 | 12.9%), French (189 | 9.4%), and European (131 | 6.5%), together accounting for 74.6% of all Harbor residents.
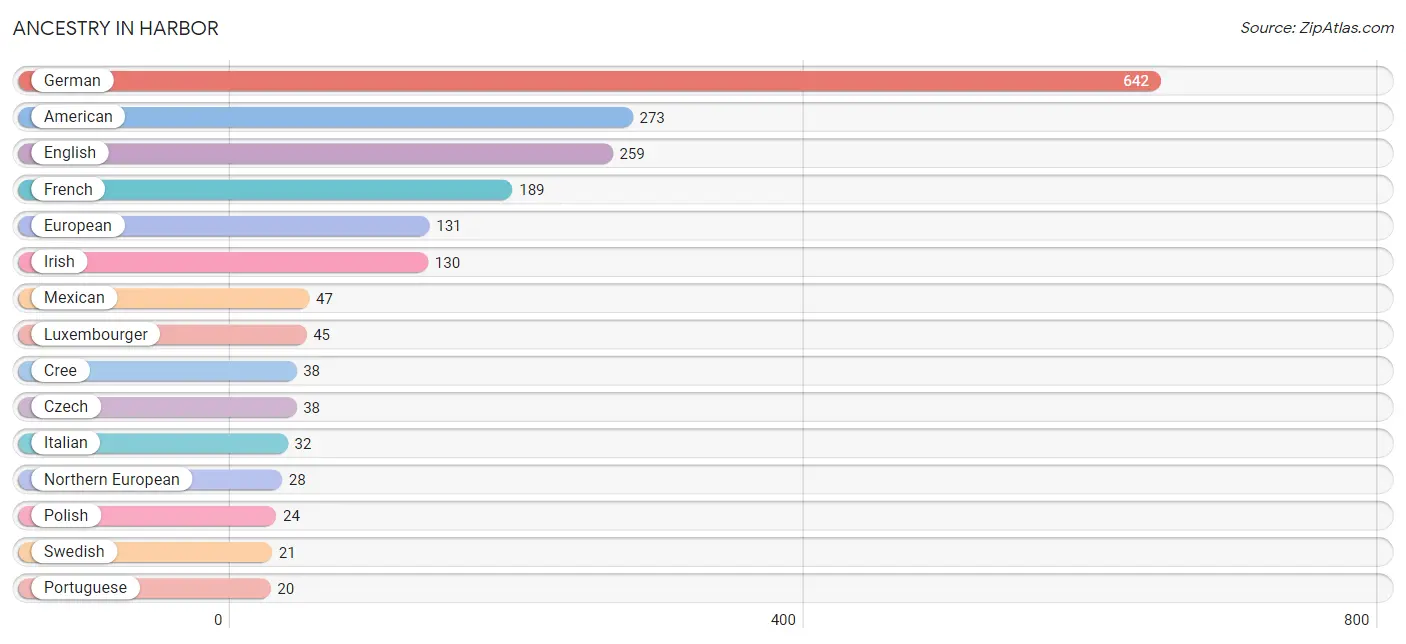
| Ancestry | # Population | % Population |
| American | 273 | 13.6% |
| Arab | 12 | 0.6% |
| British | 12 | 0.6% |
| Burmese | 2 | 0.1% |
| Cree | 38 | 1.9% |
| Czech | 38 | 1.9% |
| Danish | 16 | 0.8% |
| Dutch | 7 | 0.4% |
| English | 259 | 12.9% |
| European | 131 | 6.5% |
| French | 189 | 9.4% |
| German | 642 | 32.1% |
| Guyanese | 1 | 0.1% |
| Hungarian | 8 | 0.4% |
| Irish | 130 | 6.5% |
| Italian | 32 | 1.6% |
| Korean | 12 | 0.6% |
| Luxembourger | 45 | 2.2% |
| Mexican | 47 | 2.4% |
| Northern European | 28 | 1.4% |
| Norwegian | 9 | 0.4% |
| Polish | 24 | 1.2% |
| Portuguese | 20 | 1.0% |
| Scandinavian | 8 | 0.4% |
| Scotch-Irish | 17 | 0.9% |
| Scottish | 14 | 0.7% |
| Spaniard | 9 | 0.4% |
| Swedish | 21 | 1.1% | View All 28 Rows |
Immigrants in Harbor
The most numerous immigrant groups reported in Harbor came from Europe (67 | 3.3%), Germany (59 | 2.9%), Western Europe (59 | 2.9%), Eastern Europe (8 | 0.4%), and Hungary (8 | 0.4%), together accounting for 10.0% of all Harbor residents.
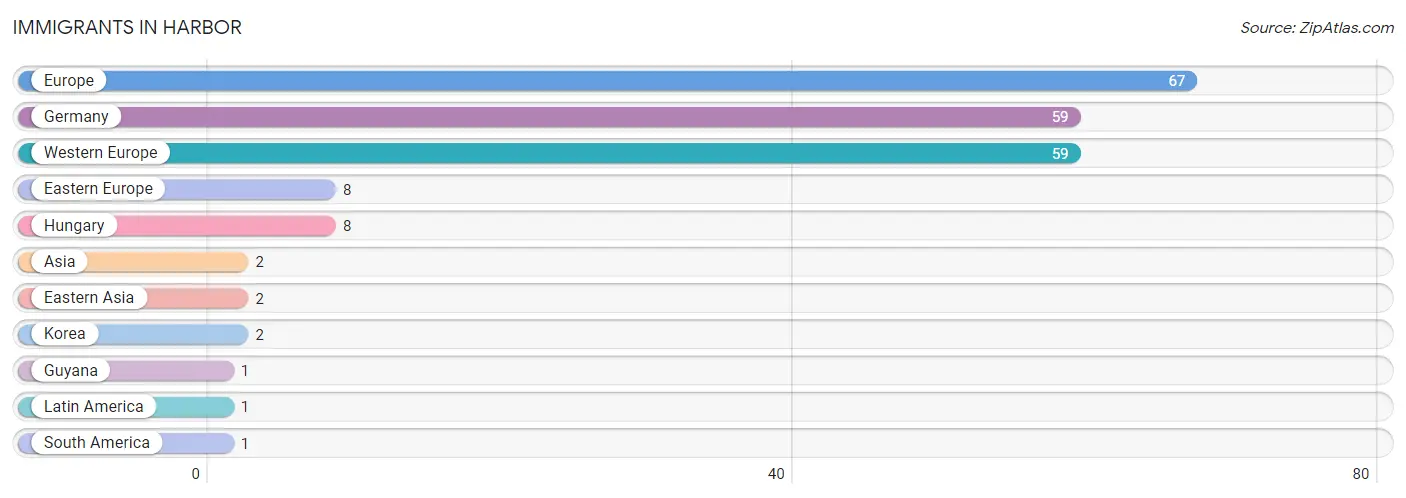
| Immigration Origin | # Population | % Population |
| Asia | 2 | 0.1% |
| Eastern Asia | 2 | 0.1% |
| Eastern Europe | 8 | 0.4% |
| Europe | 67 | 3.3% |
| Germany | 59 | 2.9% |
| Guyana | 1 | 0.1% |
| Hungary | 8 | 0.4% |
| Korea | 2 | 0.1% |
| Latin America | 1 | 0.1% |
| South America | 1 | 0.1% |
| Western Europe | 59 | 2.9% | View All 11 Rows |
Sex and Age in Harbor
Sex and Age in Harbor
The most populous age groups in Harbor are 65 to 69 Years (140 | 17.6%) for men and 65 to 69 Years (293 | 24.3%) for women.
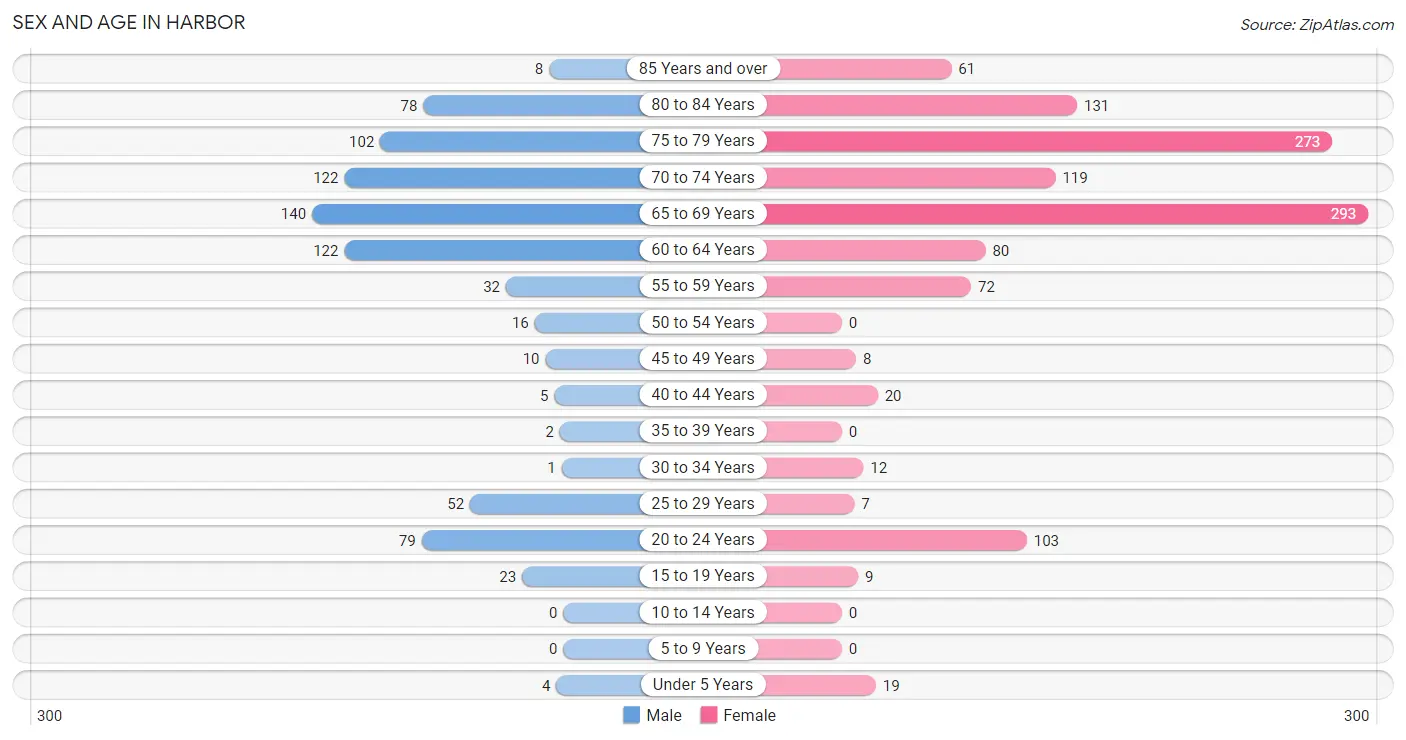
| Age Bracket | Male | Female |
| Under 5 Years | 4 (0.5%) | 19 (1.6%) |
| 5 to 9 Years | 0 (0.0%) | 0 (0.0%) |
| 10 to 14 Years | 0 (0.0%) | 0 (0.0%) |
| 15 to 19 Years | 23 (2.9%) | 9 (0.7%) |
| 20 to 24 Years | 79 (9.9%) | 103 (8.5%) |
| 25 to 29 Years | 52 (6.5%) | 7 (0.6%) |
| 30 to 34 Years | 1 (0.1%) | 12 (1.0%) |
| 35 to 39 Years | 2 (0.3%) | 0 (0.0%) |
| 40 to 44 Years | 5 (0.6%) | 20 (1.7%) |
| 45 to 49 Years | 10 (1.3%) | 8 (0.7%) |
| 50 to 54 Years | 16 (2.0%) | 0 (0.0%) |
| 55 to 59 Years | 32 (4.0%) | 72 (6.0%) |
| 60 to 64 Years | 122 (15.3%) | 80 (6.6%) |
| 65 to 69 Years | 140 (17.6%) | 293 (24.3%) |
| 70 to 74 Years | 122 (15.3%) | 119 (9.9%) |
| 75 to 79 Years | 102 (12.8%) | 273 (22.6%) |
| 80 to 84 Years | 78 (9.8%) | 131 (10.8%) |
| 85 Years and over | 8 (1.0%) | 61 (5.1%) |
| Total | 796 (100.0%) | 1,207 (100.0%) |
Families and Households in Harbor
Median Family Size in Harbor
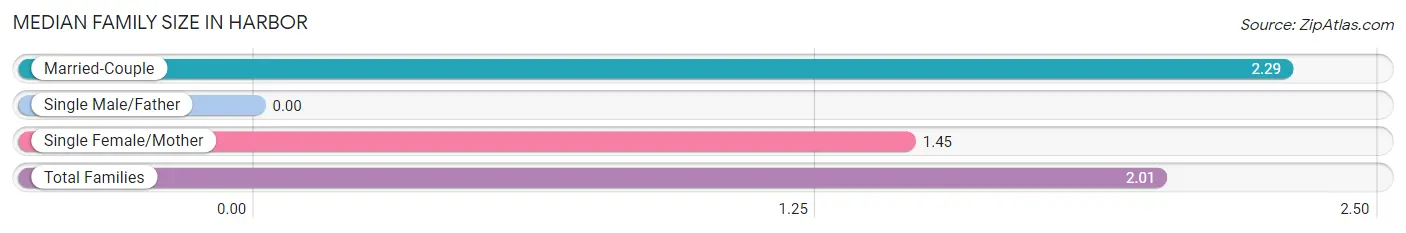
| Family Type | # Families | Family Size |
| Married-Couple | 483 (67.0%) | 2.29 |
| Single Male/Father | 0 (0.0%) | - |
| Single Female/Mother | 238 (33.0%) | 1.45 |
| Total Families | 721 (100.0%) | 2.01 |
Median Household Size in Harbor
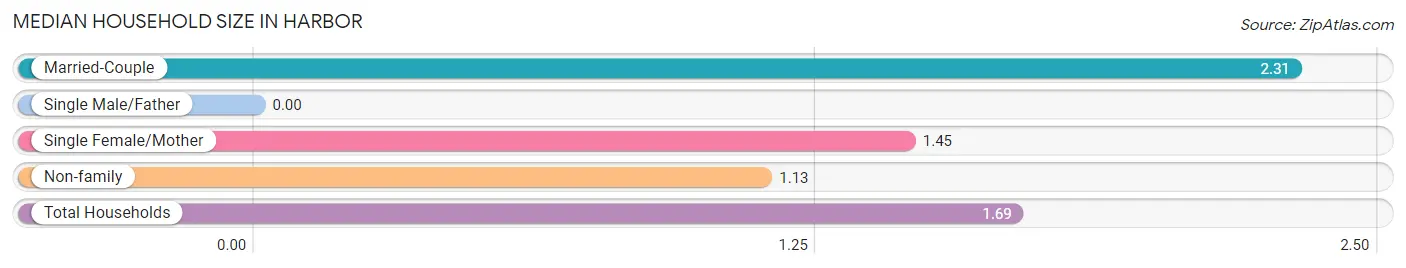
| Household Type | # Households | Household Size |
| Married-Couple | 483 (41.3%) | 2.31 |
| Single Male/Father | 0 (0.0%) | - |
| Single Female/Mother | 238 (20.4%) | 1.45 |
| Non-family | 448 (38.3%) | 1.13 |
| Total Households | 1,169 (100.0%) | 1.69 |
Household Size by Marriage Status in Harbor
Out of a total of 1,169 households in Harbor, 721 (61.7%) are family households, while 448 (38.3%) are nonfamily households. The most numerous type of family households are 2-person households, comprising 626, and the most common type of nonfamily households are 1-person households, comprising 404.
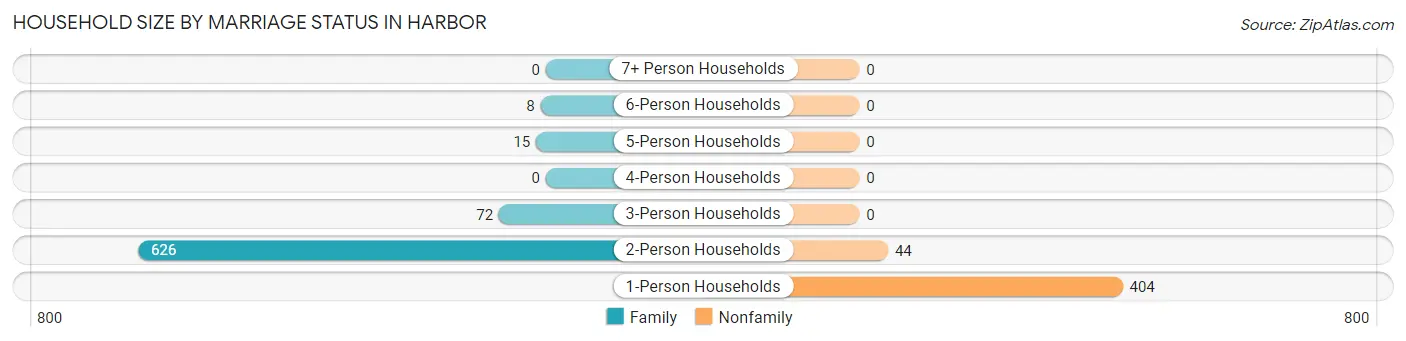
| Household Size | Family Households | Nonfamily Households |
| 1-Person Households | - | 404 (34.6%) |
| 2-Person Households | 626 (53.5%) | 44 (3.8%) |
| 3-Person Households | 72 (6.2%) | 0 (0.0%) |
| 4-Person Households | 0 (0.0%) | 0 (0.0%) |
| 5-Person Households | 15 (1.3%) | 0 (0.0%) |
| 6-Person Households | 8 (0.7%) | 0 (0.0%) |
| 7+ Person Households | 0 (0.0%) | 0 (0.0%) |
| Total | 721 (61.7%) | 448 (38.3%) |
Female Fertility in Harbor
Fertility by Age in Harbor
Average fertility rate in Harbor is 226.0 births per 1,000 women. Women in the age bracket of 20 to 34 years have the highest fertility rate with 295.0 births per 1,000 women. Women in the age bracket of 20 to 34 years acount for 100.0% of all women with births.
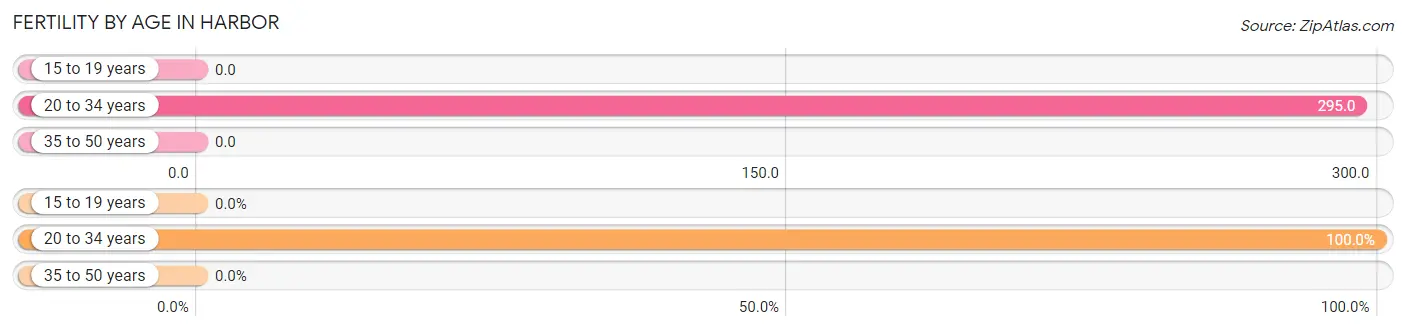
| Age Bracket | Women with Births | Births / 1,000 Women |
| 15 to 19 years | 0 (0.0%) | 0.0 |
| 20 to 34 years | 36 (100.0%) | 295.0 |
| 35 to 50 years | 0 (0.0%) | 0.0 |
| Total | 36 (100.0%) | 226.0 |
Fertility by Age by Marriage Status in Harbor
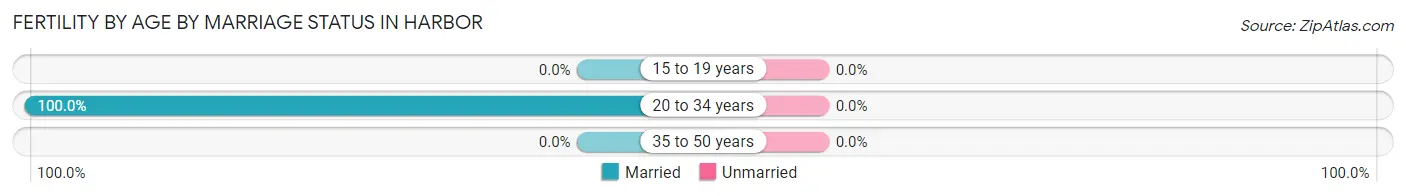
| Age Bracket | Married | Unmarried |
| 15 to 19 years | 0 (0.0%) | 0 (0.0%) |
| 20 to 34 years | 36 (100.0%) | 0 (0.0%) |
| 35 to 50 years | 0 (0.0%) | 0 (0.0%) |
| Total | 36 (100.0%) | 0 (0.0%) |
Fertility by Education in Harbor
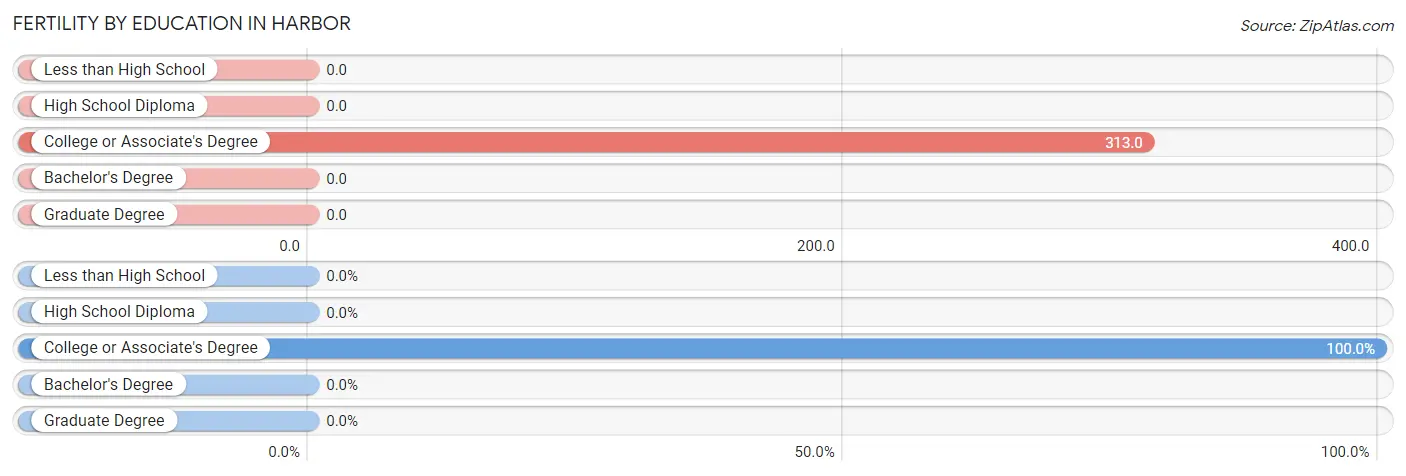
| Educational Attainment | Women with Births | Births / 1,000 Women |
| Less than High School | 0 (0.0%) | 0.0 |
| High School Diploma | 0 (0.0%) | 0.0 |
| College or Associate's Degree | 36 (100.0%) | 313.0 |
| Bachelor's Degree | 0 (0.0%) | 0.0 |
| Graduate Degree | 0 (0.0%) | 0.0 |
| Total | 36 (100.0%) | 226.0 |
Fertility by Education by Marriage Status in Harbor
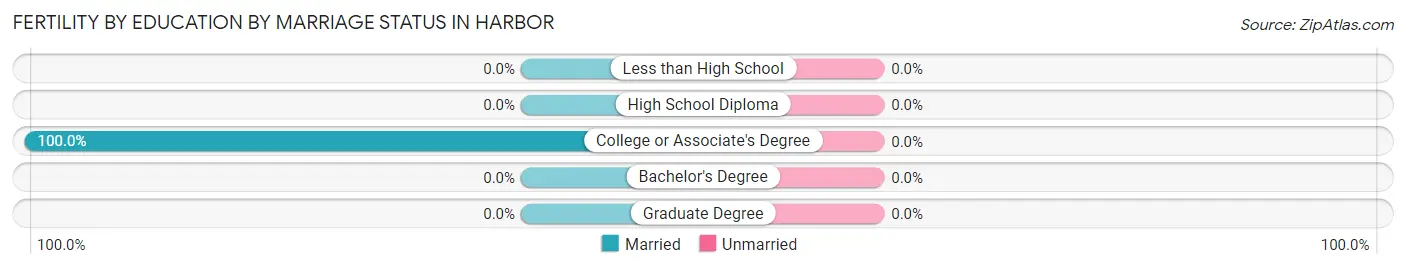
| Educational Attainment | Married | Unmarried |
| Less than High School | 0 (0.0%) | 0 (0.0%) |
| High School Diploma | 0 (0.0%) | 0 (0.0%) |
| College or Associate's Degree | 36 (100.0%) | 0 (0.0%) |
| Bachelor's Degree | 0 (0.0%) | 0 (0.0%) |
| Graduate Degree | 0 (0.0%) | 0 (0.0%) |
| Total | 36 (100.0%) | 0 (0.0%) |
Employment Characteristics in Harbor
Employment by Class of Employer in Harbor
Among the 500 employed individuals in Harbor, private company employees (318 | 63.6%), state government employees (59 | 11.8%), and self-employed (not incorporated) (34 | 6.8%) make up the most common classes of employment.
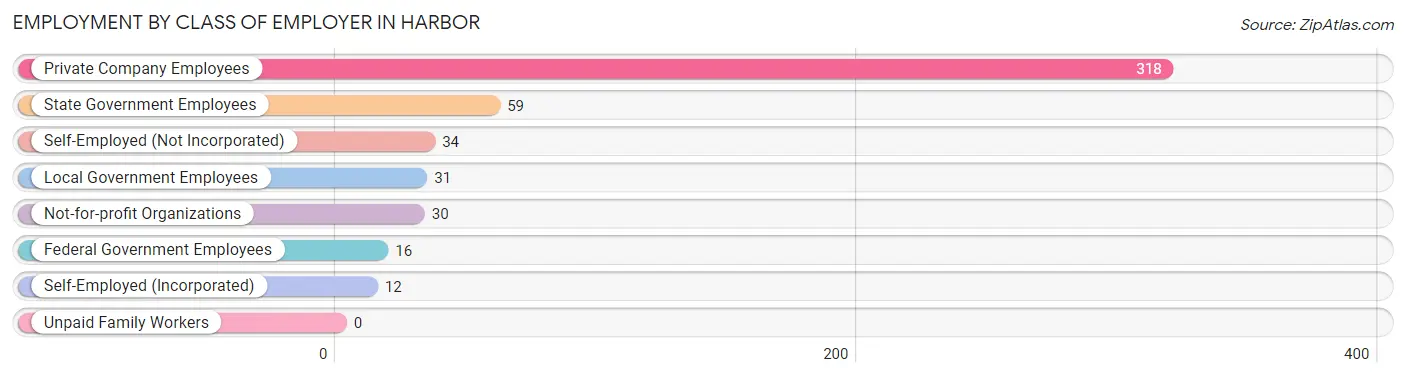
| Employer Class | # Employees | % Employees |
| Private Company Employees | 318 | 63.6% |
| Self-Employed (Incorporated) | 12 | 2.4% |
| Self-Employed (Not Incorporated) | 34 | 6.8% |
| Not-for-profit Organizations | 30 | 6.0% |
| Local Government Employees | 31 | 6.2% |
| State Government Employees | 59 | 11.8% |
| Federal Government Employees | 16 | 3.2% |
| Unpaid Family Workers | 0 | 0.0% |
| Total | 500 | 100.0% |
Employment Status by Age in Harbor
According to the labor force statistics for Harbor, out of the total population over 16 years of age (1,980), 26.8% or 531 individuals are in the labor force, with 5.7% or 30 of them unemployed. The age group with the highest labor force participation rate is 20 to 24 years, with 100.0% or 182 individuals in the labor force. Within the labor force, the 65 to 74 years age range has the highest percentage of unemployed individuals, with 57.7% or 30 of them being unemployed.
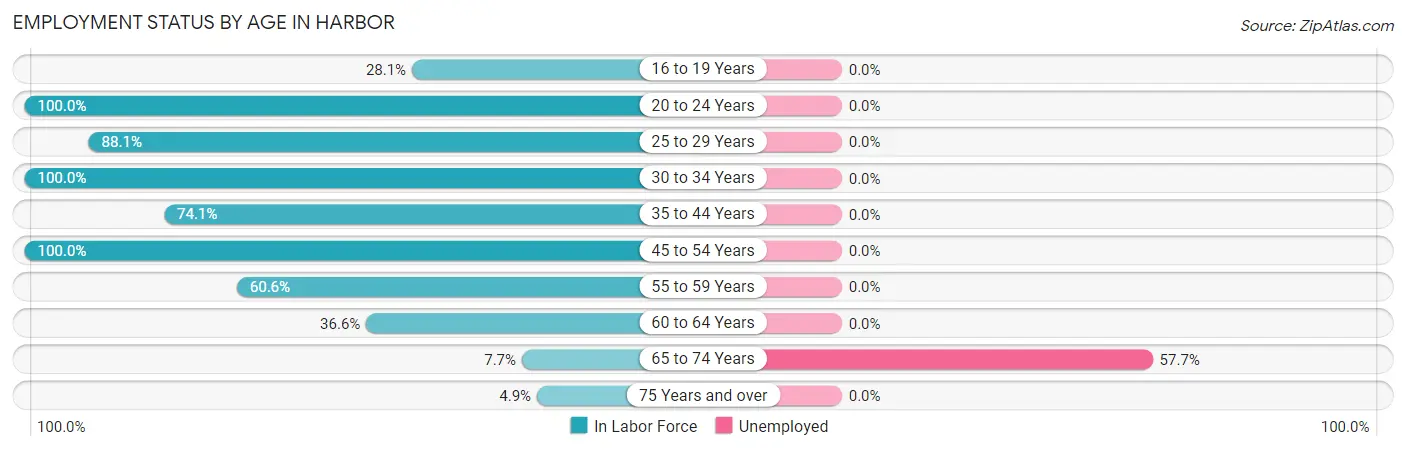
| Age Bracket | In Labor Force | Unemployed |
| 16 to 19 Years | 9 (28.1%) | 0 (0.0%) |
| 20 to 24 Years | 182 (100.0%) | 0 (0.0%) |
| 25 to 29 Years | 52 (88.1%) | 0 (0.0%) |
| 30 to 34 Years | 13 (100.0%) | 0 (0.0%) |
| 35 to 44 Years | 20 (74.1%) | 0 (0.0%) |
| 45 to 54 Years | 34 (100.0%) | 0 (0.0%) |
| 55 to 59 Years | 63 (60.6%) | 0 (0.0%) |
| 60 to 64 Years | 74 (36.6%) | 0 (0.0%) |
| 65 to 74 Years | 52 (7.7%) | 30 (57.7%) |
| 75 Years and over | 32 (4.9%) | 0 (0.0%) |
| Total | 531 (26.8%) | 30 (5.7%) |
Employment Status by Educational Attainment in Harbor
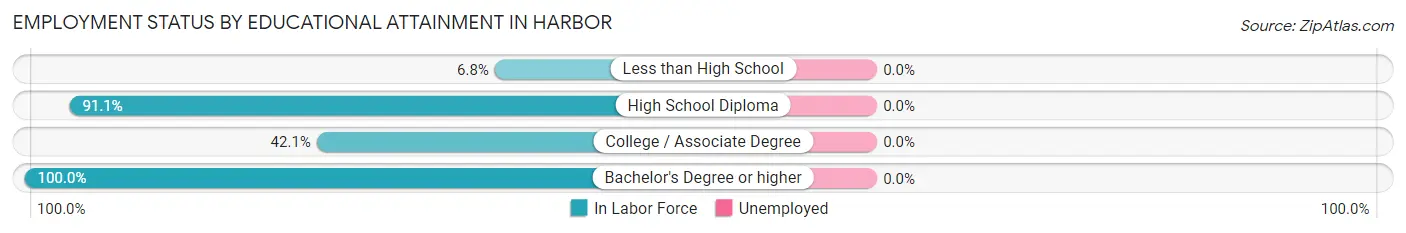
| Educational Attainment | In Labor Force | Unemployed |
| Less than High School | 4 (6.8%) | 0 (0.0%) |
| High School Diploma | 113 (91.1%) | 0 (0.0%) |
| College / Associate Degree | 85 (42.1%) | 0 (0.0%) |
| Bachelor's Degree or higher | 54 (100.0%) | 0 (0.0%) |
| Total | 256 (58.3%) | 0 (0.0%) |
Employment Occupations by Sex in Harbor
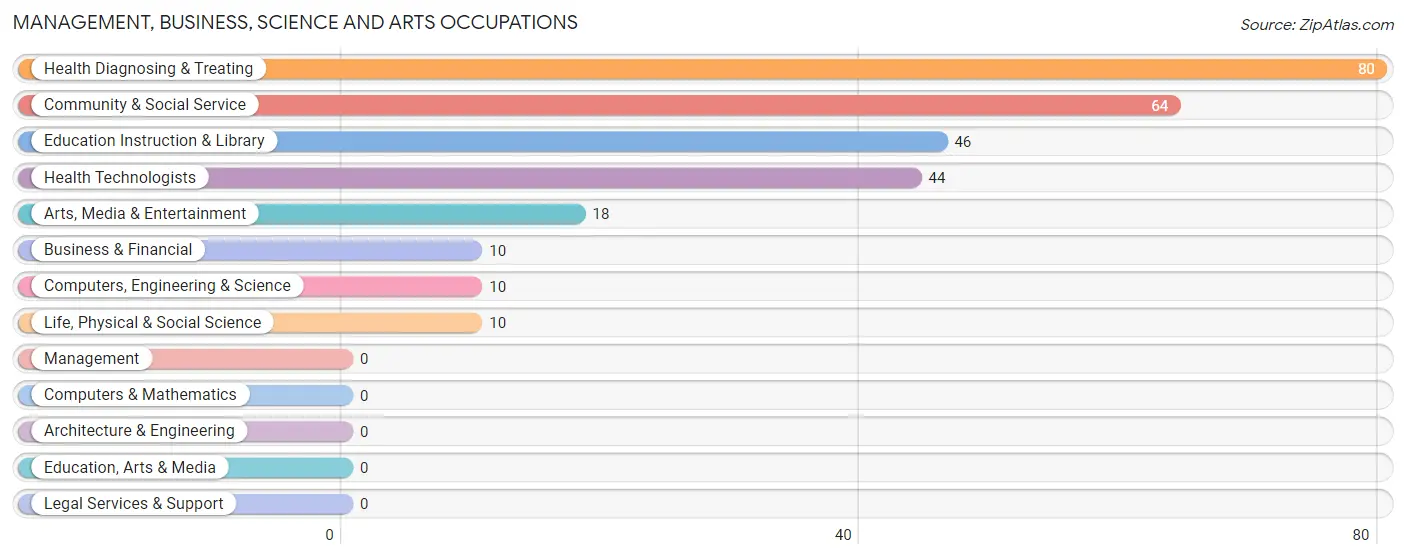
Management, Business, Science and Arts Occupations
The most common Management, Business, Science and Arts occupations in Harbor are Health Diagnosing & Treating (80 | 16.2%), Community & Social Service (64 | 12.9%), Education Instruction & Library (46 | 9.3%), Health Technologists (44 | 8.9%), and Arts, Media & Entertainment (18 | 3.6%).
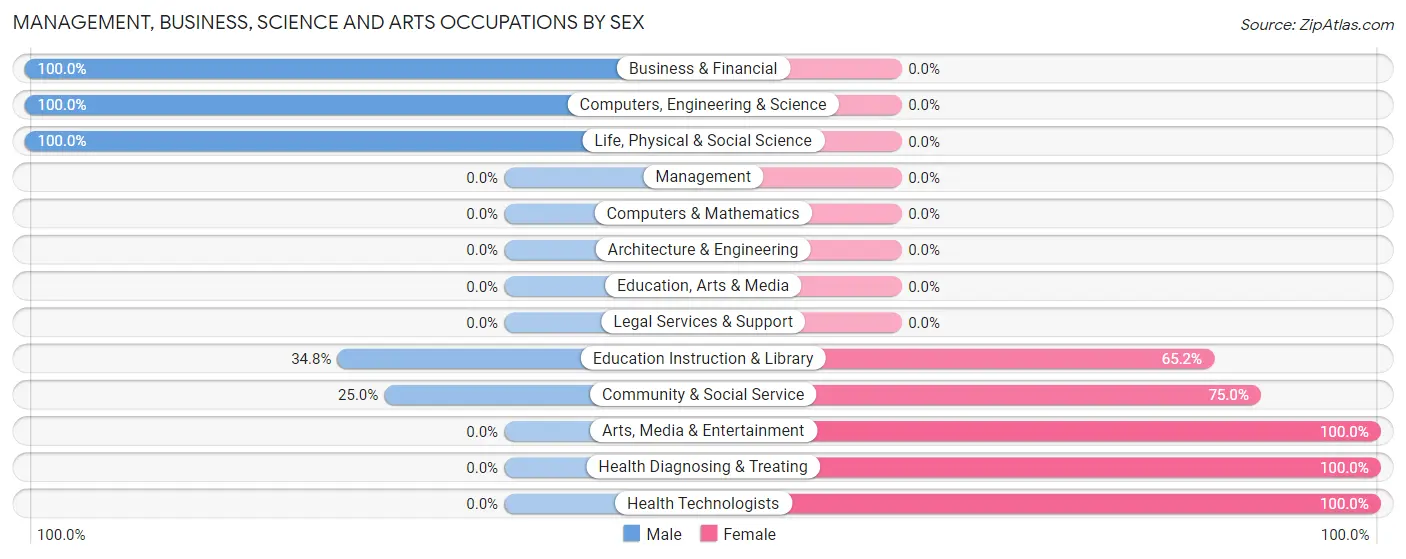
Management, Business, Science and Arts Occupations by Sex
Within the Management, Business, Science and Arts occupations in Harbor, the most male-oriented occupations are Business & Financial (100.0%), Computers, Engineering & Science (100.0%), and Life, Physical & Social Science (100.0%), while the most female-oriented occupations are Arts, Media & Entertainment (100.0%), Health Diagnosing & Treating (100.0%), and Health Technologists (100.0%).
| Occupation | Male | Female |
| Management | 0 (0.0%) | 0 (0.0%) |
| Business & Financial | 10 (100.0%) | 0 (0.0%) |
| Computers, Engineering & Science | 10 (100.0%) | 0 (0.0%) |
| Computers & Mathematics | 0 (0.0%) | 0 (0.0%) |
| Architecture & Engineering | 0 (0.0%) | 0 (0.0%) |
| Life, Physical & Social Science | 10 (100.0%) | 0 (0.0%) |
| Community & Social Service | 16 (25.0%) | 48 (75.0%) |
| Education, Arts & Media | 0 (0.0%) | 0 (0.0%) |
| Legal Services & Support | 0 (0.0%) | 0 (0.0%) |
| Education Instruction & Library | 16 (34.8%) | 30 (65.2%) |
| Arts, Media & Entertainment | 0 (0.0%) | 18 (100.0%) |
| Health Diagnosing & Treating | 0 (0.0%) | 80 (100.0%) |
| Health Technologists | 0 (0.0%) | 44 (100.0%) |
| Total (Category) | 36 (22.0%) | 128 (78.0%) |
| Total (Overall) | 217 (43.8%) | 278 (56.2%) |
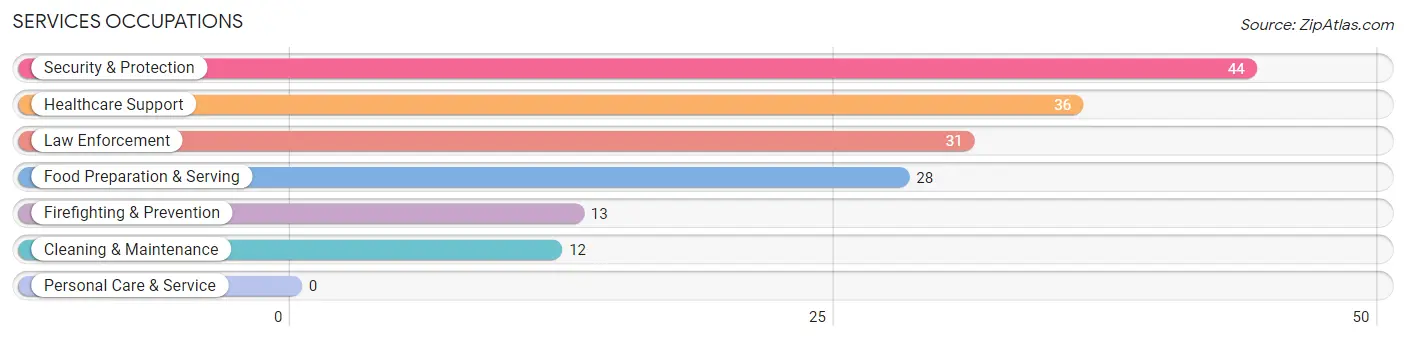
Services Occupations
The most common Services occupations in Harbor are Security & Protection (44 | 8.9%), Healthcare Support (36 | 7.3%), Law Enforcement (31 | 6.3%), Food Preparation & Serving (28 | 5.7%), and Firefighting & Prevention (13 | 2.6%).
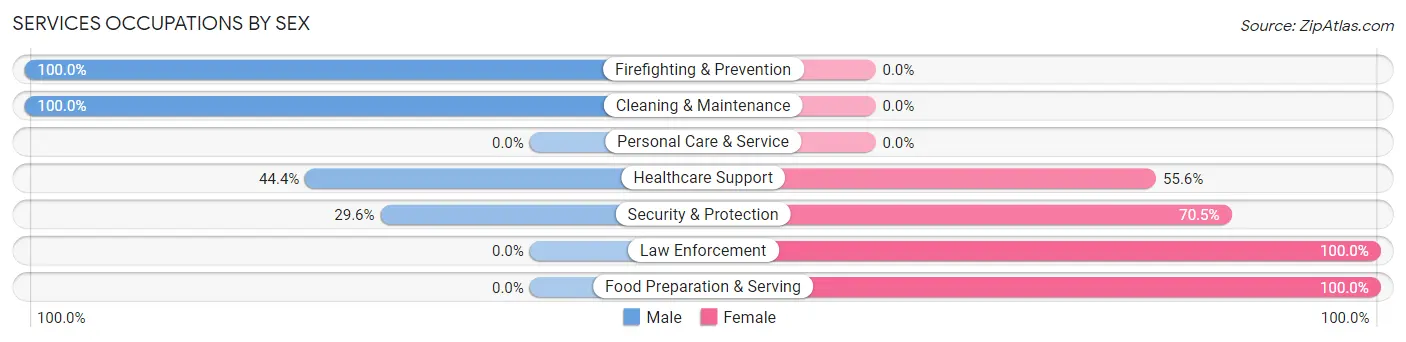
Services Occupations by Sex
Within the Services occupations in Harbor, the most male-oriented occupations are Firefighting & Prevention (100.0%), Cleaning & Maintenance (100.0%), and Healthcare Support (44.4%), while the most female-oriented occupations are Law Enforcement (100.0%), Food Preparation & Serving (100.0%), and Security & Protection (70.5%).
| Occupation | Male | Female |
| Healthcare Support | 16 (44.4%) | 20 (55.6%) |
| Security & Protection | 13 (29.5%) | 31 (70.5%) |
| Firefighting & Prevention | 13 (100.0%) | 0 (0.0%) |
| Law Enforcement | 0 (0.0%) | 31 (100.0%) |
| Food Preparation & Serving | 0 (0.0%) | 28 (100.0%) |
| Cleaning & Maintenance | 12 (100.0%) | 0 (0.0%) |
| Personal Care & Service | 0 (0.0%) | 0 (0.0%) |
| Total (Category) | 41 (34.2%) | 79 (65.8%) |
| Total (Overall) | 217 (43.8%) | 278 (56.2%) |
Sales and Office Occupations
The most common Sales and Office occupations in Harbor are Sales & Related (94 | 19.0%), and Office & Administration (36 | 7.3%).
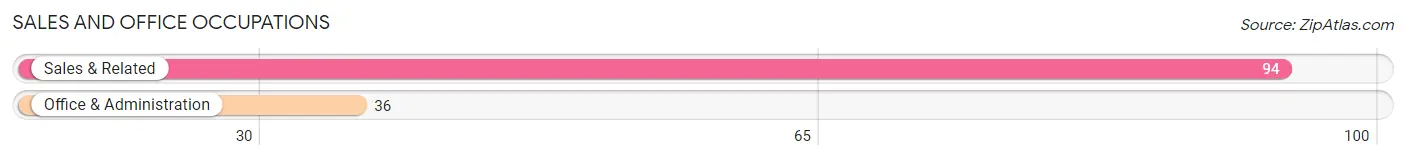
Sales and Office Occupations by Sex
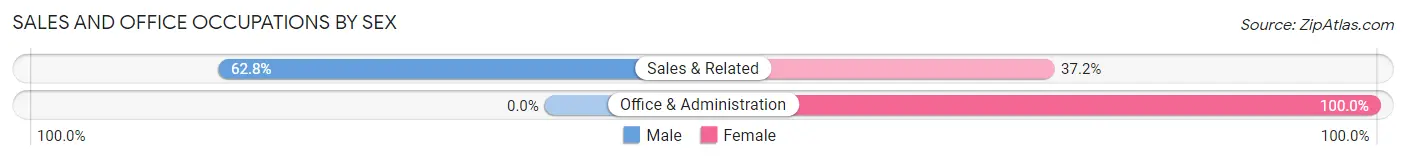
| Occupation | Male | Female |
| Sales & Related | 59 (62.8%) | 35 (37.2%) |
| Office & Administration | 0 (0.0%) | 36 (100.0%) |
| Total (Category) | 59 (45.4%) | 71 (54.6%) |
| Total (Overall) | 217 (43.8%) | 278 (56.2%) |
Natural Resources, Construction and Maintenance Occupations
The most common Natural Resources, Construction and Maintenance occupations in Harbor are Construction & Extraction (16 | 3.2%), and Installation, Maintenance & Repair (12 | 2.4%).
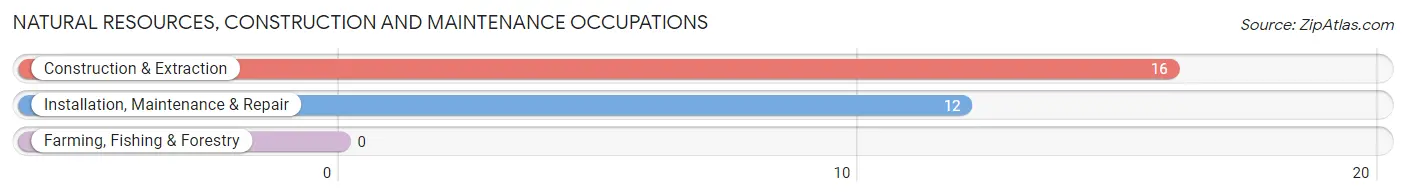
Natural Resources, Construction and Maintenance Occupations by Sex
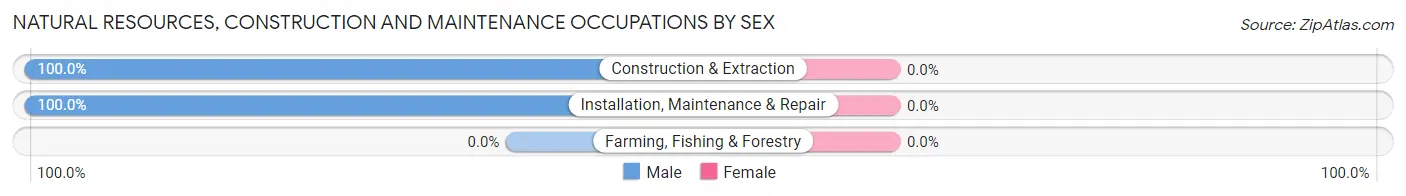
| Occupation | Male | Female |
| Farming, Fishing & Forestry | 0 (0.0%) | 0 (0.0%) |
| Construction & Extraction | 16 (100.0%) | 0 (0.0%) |
| Installation, Maintenance & Repair | 12 (100.0%) | 0 (0.0%) |
| Total (Category) | 28 (100.0%) | 0 (0.0%) |
| Total (Overall) | 217 (43.8%) | 278 (56.2%) |
Production, Transportation and Moving Occupations
The most common Production, Transportation and Moving occupations in Harbor are Production (37 | 7.5%), and Material Moving (16 | 3.2%).
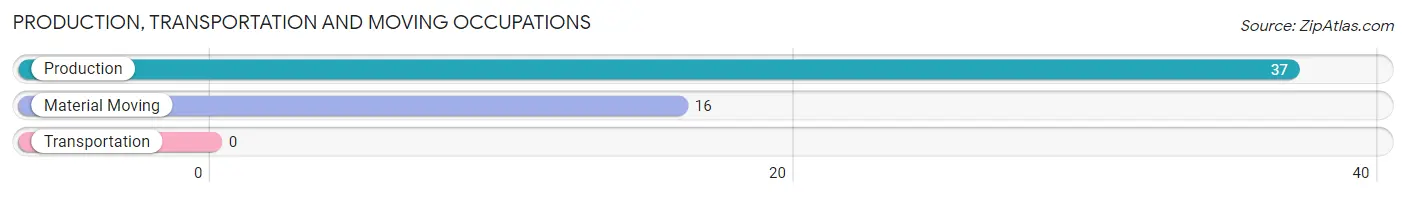
Production, Transportation and Moving Occupations by Sex
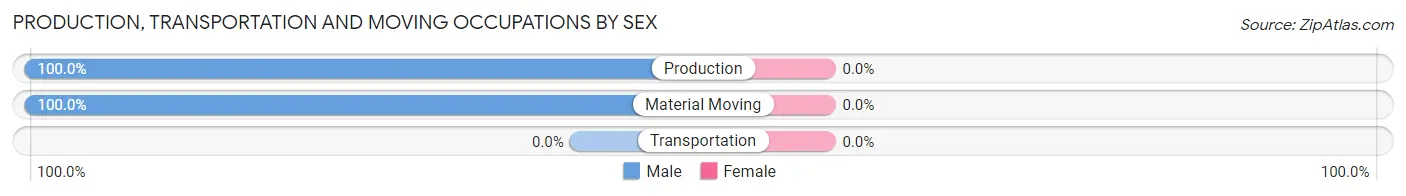
| Occupation | Male | Female |
| Production | 37 (100.0%) | 0 (0.0%) |
| Transportation | 0 (0.0%) | 0 (0.0%) |
| Material Moving | 16 (100.0%) | 0 (0.0%) |
| Total (Category) | 53 (100.0%) | 0 (0.0%) |
| Total (Overall) | 217 (43.8%) | 278 (56.2%) |
Employment Industries by Sex in Harbor
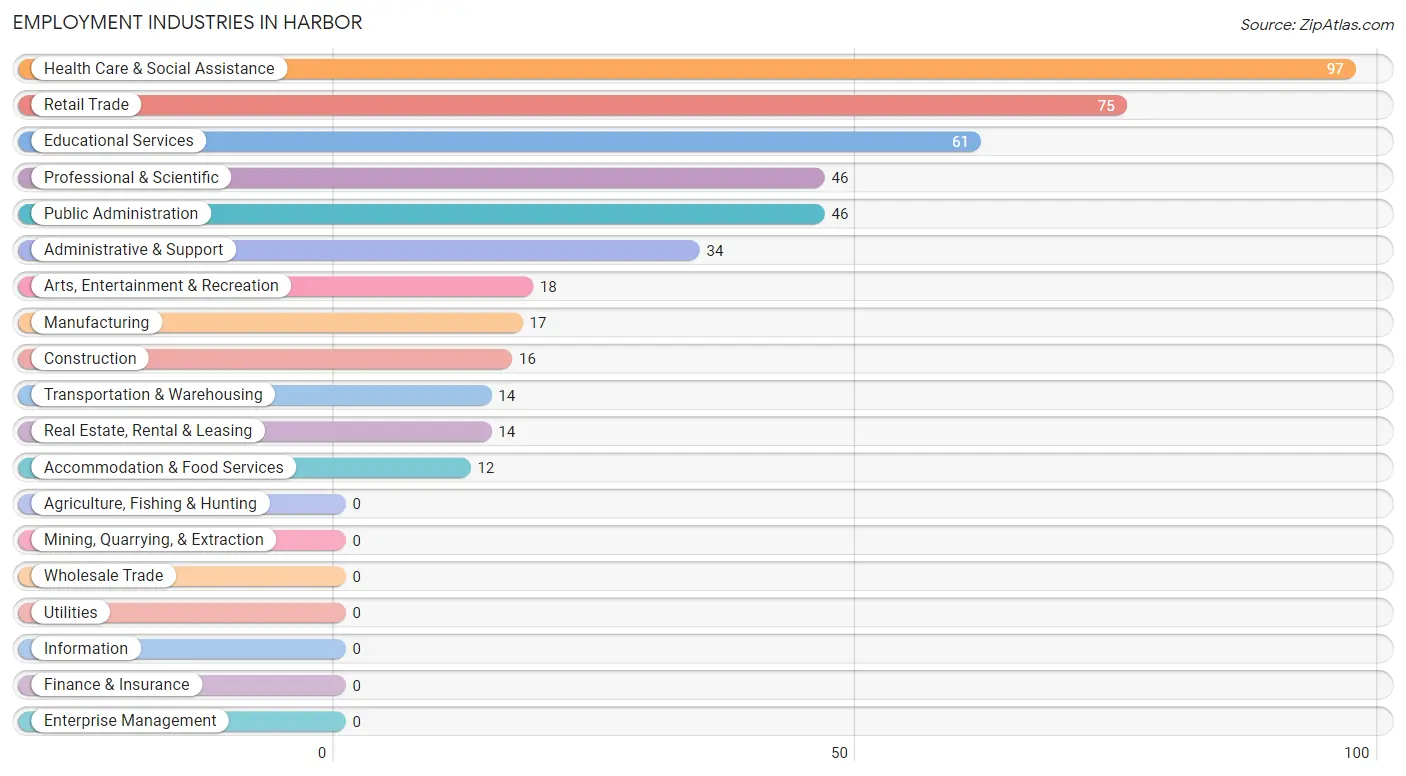
Employment Industries in Harbor
The major employment industries in Harbor include Health Care & Social Assistance (97 | 19.6%), Retail Trade (75 | 15.1%), Educational Services (61 | 12.3%), Professional & Scientific (46 | 9.3%), and Public Administration (46 | 9.3%).
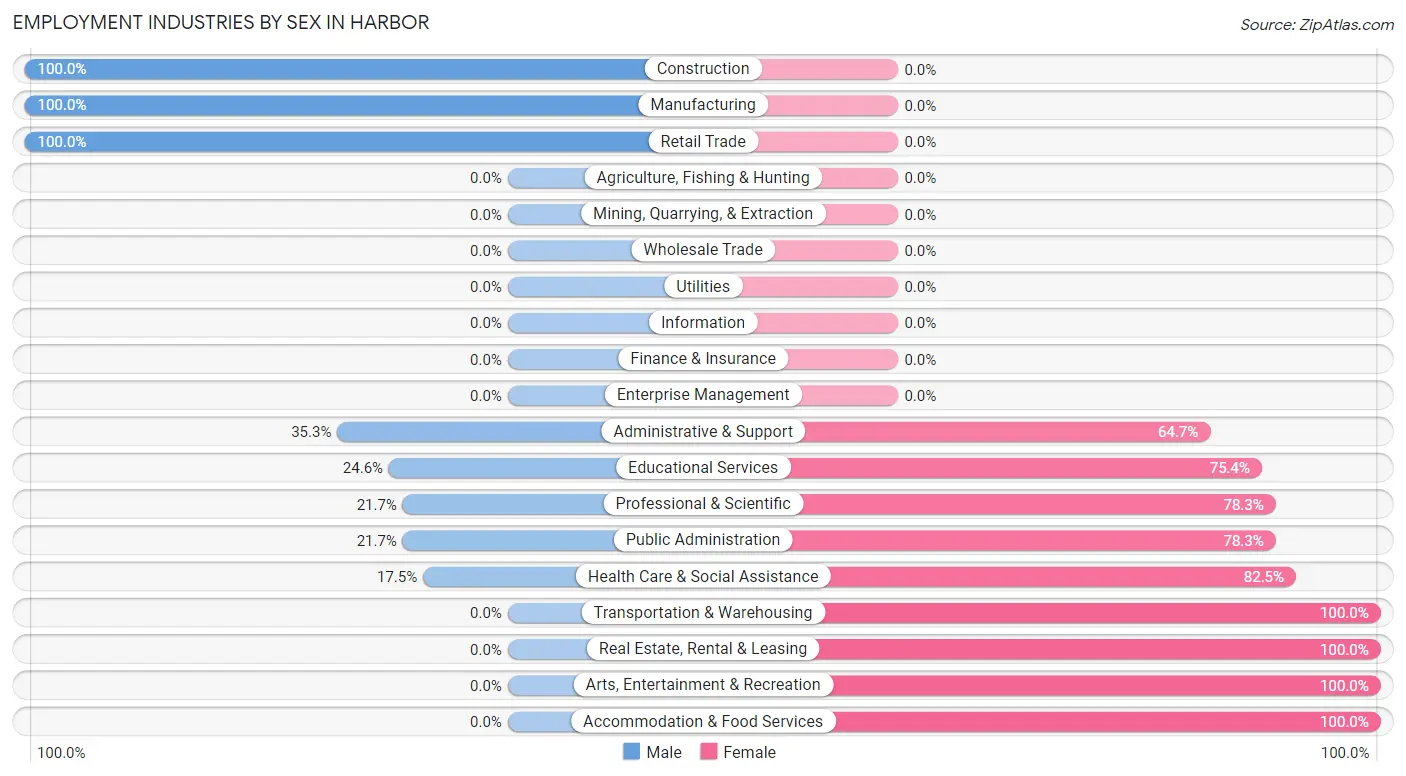
Employment Industries by Sex in Harbor
The Harbor industries that see more men than women are Construction (100.0%), Manufacturing (100.0%), and Retail Trade (100.0%), whereas the industries that tend to have a higher number of women are Transportation & Warehousing (100.0%), Real Estate, Rental & Leasing (100.0%), and Arts, Entertainment & Recreation (100.0%).
| Industry | Male | Female |
| Agriculture, Fishing & Hunting | 0 (0.0%) | 0 (0.0%) |
| Mining, Quarrying, & Extraction | 0 (0.0%) | 0 (0.0%) |
| Construction | 16 (100.0%) | 0 (0.0%) |
| Manufacturing | 17 (100.0%) | 0 (0.0%) |
| Wholesale Trade | 0 (0.0%) | 0 (0.0%) |
| Retail Trade | 75 (100.0%) | 0 (0.0%) |
| Transportation & Warehousing | 0 (0.0%) | 14 (100.0%) |
| Utilities | 0 (0.0%) | 0 (0.0%) |
| Information | 0 (0.0%) | 0 (0.0%) |
| Finance & Insurance | 0 (0.0%) | 0 (0.0%) |
| Real Estate, Rental & Leasing | 0 (0.0%) | 14 (100.0%) |
| Professional & Scientific | 10 (21.7%) | 36 (78.3%) |
| Enterprise Management | 0 (0.0%) | 0 (0.0%) |
| Administrative & Support | 12 (35.3%) | 22 (64.7%) |
| Educational Services | 15 (24.6%) | 46 (75.4%) |
| Health Care & Social Assistance | 17 (17.5%) | 80 (82.5%) |
| Arts, Entertainment & Recreation | 0 (0.0%) | 18 (100.0%) |
| Accommodation & Food Services | 0 (0.0%) | 12 (100.0%) |
| Public Administration | 10 (21.7%) | 36 (78.3%) |
| Total | 217 (43.8%) | 278 (56.2%) |
Education in Harbor
School Enrollment in Harbor
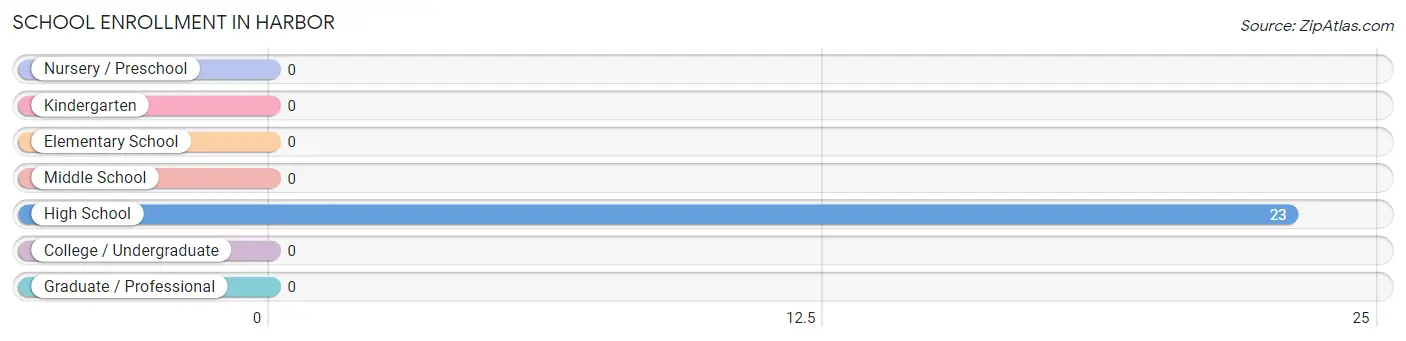
| School Level | # Students | % Students |
| Nursery / Preschool | 0 | 0.0% |
| Kindergarten | 0 | 0.0% |
| Elementary School | 0 | 0.0% |
| Middle School | 0 | 0.0% |
| High School | 23 | 100.0% |
| College / Undergraduate | 0 | 0.0% |
| Graduate / Professional | 0 | 0.0% |
| Total | 23 | 100.0% |
School Enrollment by Age by Funding Source in Harbor
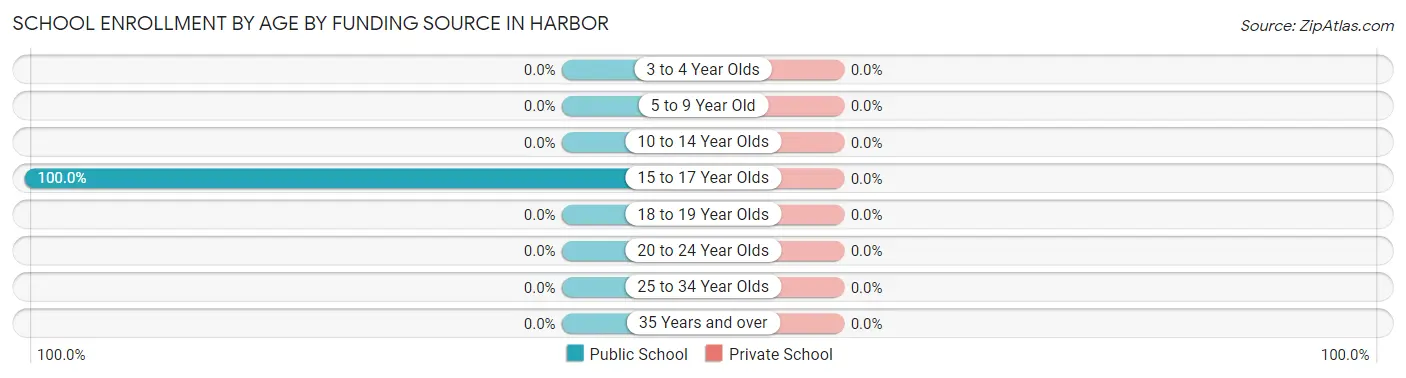
| Age Bracket | Public School | Private School |
| 3 to 4 Year Olds | 0 (0.0%) | 0 (0.0%) |
| 5 to 9 Year Old | 0 (0.0%) | 0 (0.0%) |
| 10 to 14 Year Olds | 0 (0.0%) | 0 (0.0%) |
| 15 to 17 Year Olds | 23 (100.0%) | 0 (0.0%) |
| 18 to 19 Year Olds | 0 (0.0%) | 0 (0.0%) |
| 20 to 24 Year Olds | 0 (0.0%) | 0 (0.0%) |
| 25 to 34 Year Olds | 0 (0.0%) | 0 (0.0%) |
| 35 Years and over | 0 (0.0%) | 0 (0.0%) |
| Total | 23 (100.0%) | 0 (0.0%) |
Educational Attainment by Field of Study in Harbor
Education (48 | 15.4%), physical & health sciences (39 | 12.5%), literature & languages (38 | 12.2%), engineering (35 | 11.2%), and social sciences (25 | 8.0%) are the most common fields of study among 312 individuals in Harbor who have obtained a bachelor's degree or higher.
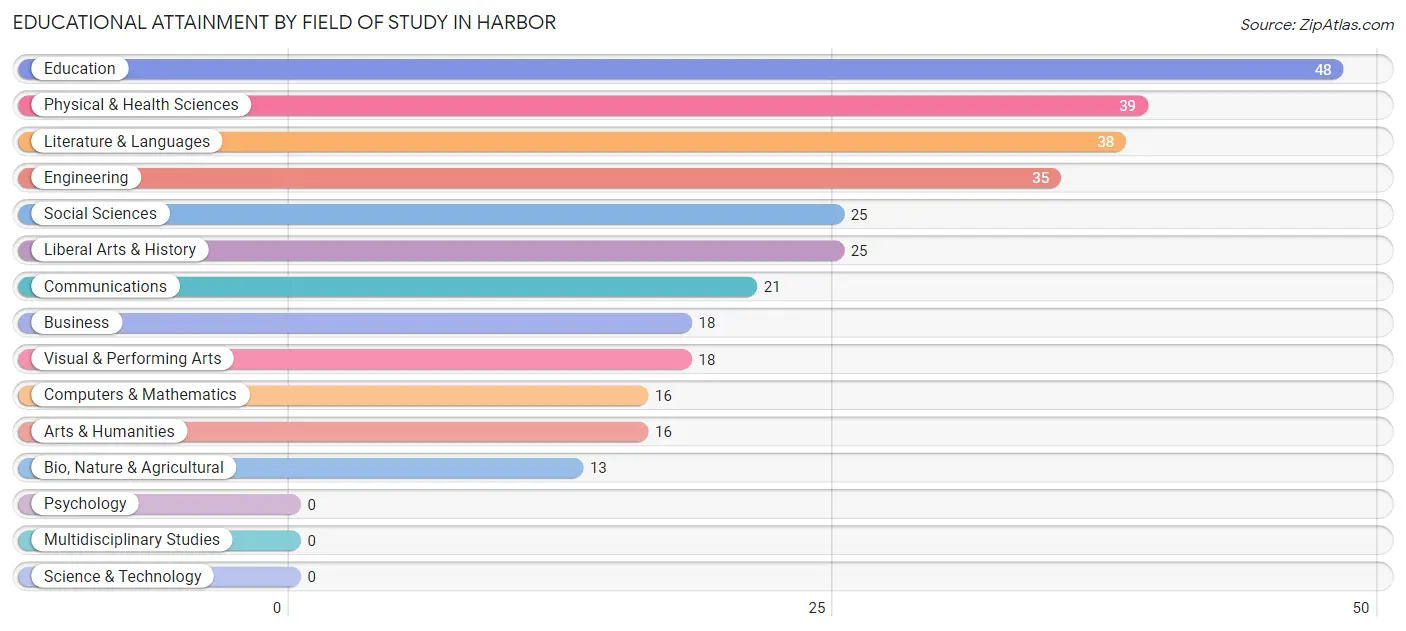
| Field of Study | # Graduates | % Graduates |
| Computers & Mathematics | 16 | 5.1% |
| Bio, Nature & Agricultural | 13 | 4.2% |
| Physical & Health Sciences | 39 | 12.5% |
| Psychology | 0 | 0.0% |
| Social Sciences | 25 | 8.0% |
| Engineering | 35 | 11.2% |
| Multidisciplinary Studies | 0 | 0.0% |
| Science & Technology | 0 | 0.0% |
| Business | 18 | 5.8% |
| Education | 48 | 15.4% |
| Literature & Languages | 38 | 12.2% |
| Liberal Arts & History | 25 | 8.0% |
| Visual & Performing Arts | 18 | 5.8% |
| Communications | 21 | 6.7% |
| Arts & Humanities | 16 | 5.1% |
| Total | 312 | 100.0% |
Transportation & Commute in Harbor
Vehicle Availability by Sex in Harbor
The most prevalent vehicle ownership categories in Harbor are males with 2 vehicles (94, accounting for 45.2%) and females with 2 vehicles (94, making up 33.8%).
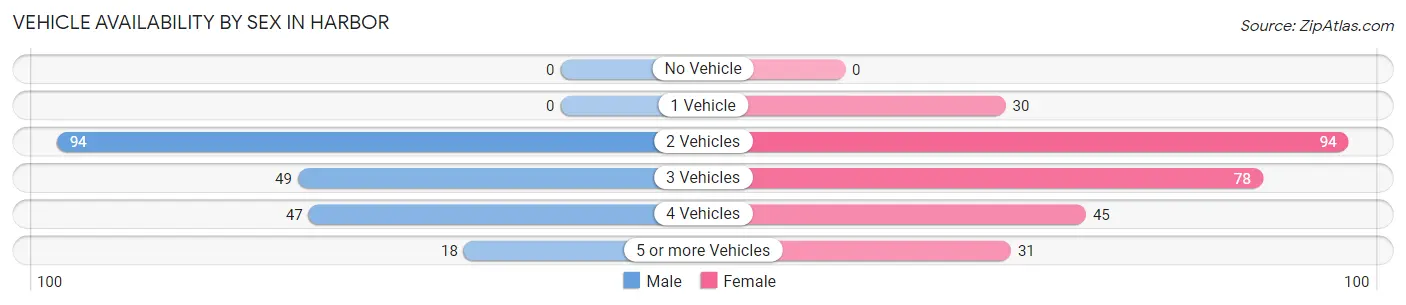
| Vehicles Available | Male | Female |
| No Vehicle | 0 (0.0%) | 0 (0.0%) |
| 1 Vehicle | 0 (0.0%) | 30 (10.8%) |
| 2 Vehicles | 94 (45.2%) | 94 (33.8%) |
| 3 Vehicles | 49 (23.6%) | 78 (28.1%) |
| 4 Vehicles | 47 (22.6%) | 45 (16.2%) |
| 5 or more Vehicles | 18 (8.6%) | 31 (11.2%) |
| Total | 208 (100.0%) | 278 (100.0%) |
Commute Time in Harbor
The most frequently occuring commute durations in Harbor are 5 to 9 minutes (212 commuters, 43.8%), 10 to 14 minutes (133 commuters, 27.5%), and 40 to 44 minutes (60 commuters, 12.4%).
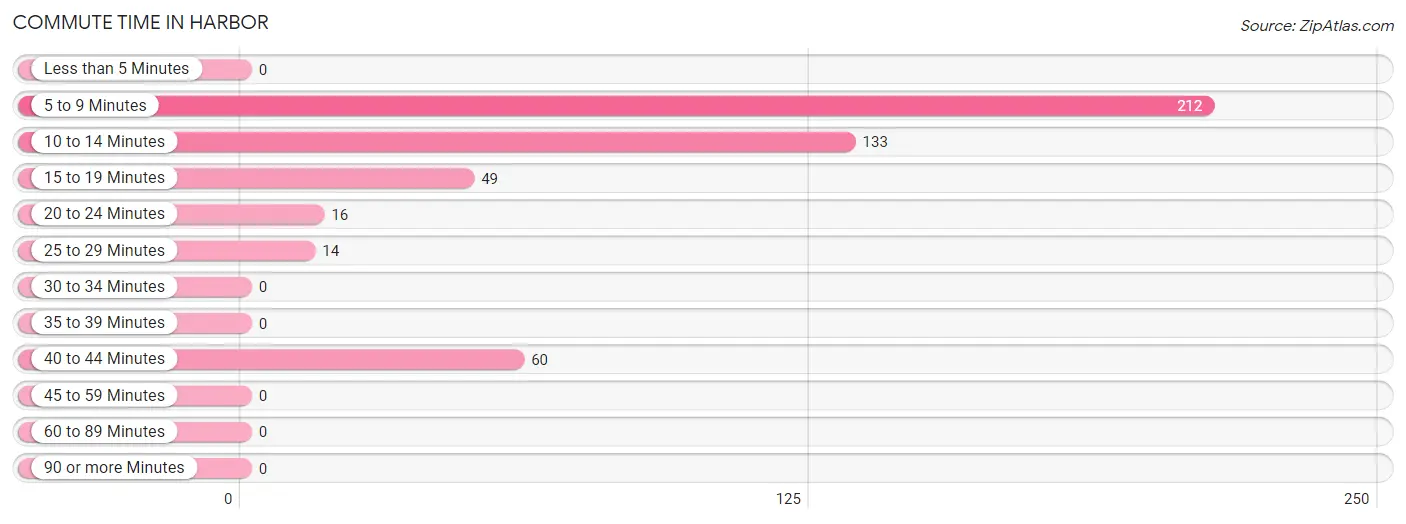
| Commute Time | # Commuters | % Commuters |
| Less than 5 Minutes | 0 | 0.0% |
| 5 to 9 Minutes | 212 | 43.8% |
| 10 to 14 Minutes | 133 | 27.5% |
| 15 to 19 Minutes | 49 | 10.1% |
| 20 to 24 Minutes | 16 | 3.3% |
| 25 to 29 Minutes | 14 | 2.9% |
| 30 to 34 Minutes | 0 | 0.0% |
| 35 to 39 Minutes | 0 | 0.0% |
| 40 to 44 Minutes | 60 | 12.4% |
| 45 to 59 Minutes | 0 | 0.0% |
| 60 to 89 Minutes | 0 | 0.0% |
| 90 or more Minutes | 0 | 0.0% |
Commute Time by Sex in Harbor
The most common commute times in Harbor are 5 to 9 minutes (119 commuters, 58.3%) for males and 5 to 9 minutes (93 commuters, 33.2%) for females.
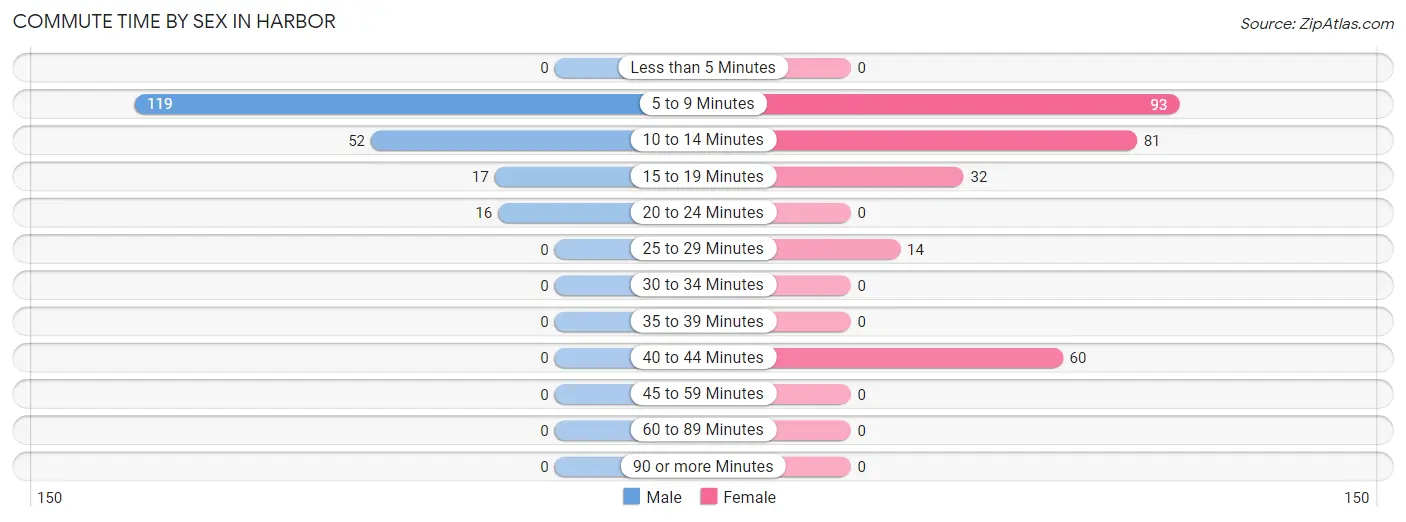
| Commute Time | Male | Female |
| Less than 5 Minutes | 0 (0.0%) | 0 (0.0%) |
| 5 to 9 Minutes | 119 (58.3%) | 93 (33.2%) |
| 10 to 14 Minutes | 52 (25.5%) | 81 (28.9%) |
| 15 to 19 Minutes | 17 (8.3%) | 32 (11.4%) |
| 20 to 24 Minutes | 16 (7.8%) | 0 (0.0%) |
| 25 to 29 Minutes | 0 (0.0%) | 14 (5.0%) |
| 30 to 34 Minutes | 0 (0.0%) | 0 (0.0%) |
| 35 to 39 Minutes | 0 (0.0%) | 0 (0.0%) |
| 40 to 44 Minutes | 0 (0.0%) | 60 (21.4%) |
| 45 to 59 Minutes | 0 (0.0%) | 0 (0.0%) |
| 60 to 89 Minutes | 0 (0.0%) | 0 (0.0%) |
| 90 or more Minutes | 0 (0.0%) | 0 (0.0%) |
Time of Departure to Work by Sex in Harbor
The most frequent times of departure to work in Harbor are 9:00 AM to 9:59 AM (88, 43.1%) for males and 7:30 AM to 7:59 AM (72, 25.7%) for females.
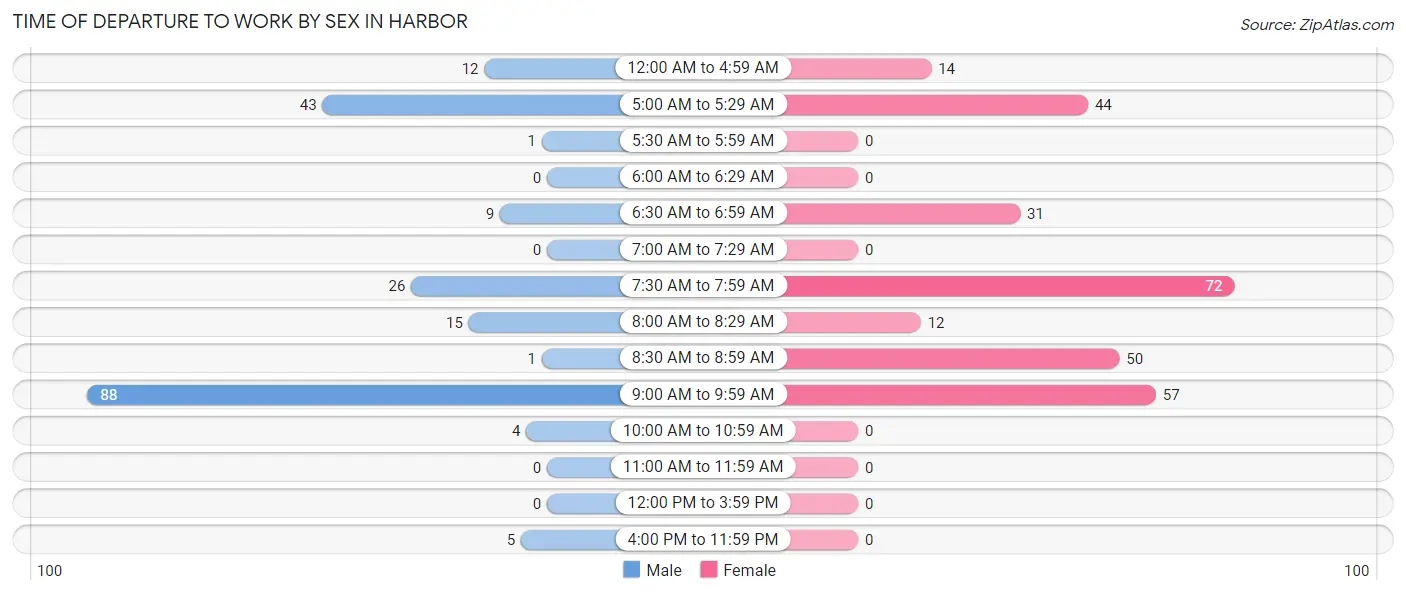
| Time of Departure | Male | Female |
| 12:00 AM to 4:59 AM | 12 (5.9%) | 14 (5.0%) |
| 5:00 AM to 5:29 AM | 43 (21.1%) | 44 (15.7%) |
| 5:30 AM to 5:59 AM | 1 (0.5%) | 0 (0.0%) |
| 6:00 AM to 6:29 AM | 0 (0.0%) | 0 (0.0%) |
| 6:30 AM to 6:59 AM | 9 (4.4%) | 31 (11.1%) |
| 7:00 AM to 7:29 AM | 0 (0.0%) | 0 (0.0%) |
| 7:30 AM to 7:59 AM | 26 (12.8%) | 72 (25.7%) |
| 8:00 AM to 8:29 AM | 15 (7.3%) | 12 (4.3%) |
| 8:30 AM to 8:59 AM | 1 (0.5%) | 50 (17.9%) |
| 9:00 AM to 9:59 AM | 88 (43.1%) | 57 (20.4%) |
| 10:00 AM to 10:59 AM | 4 (2.0%) | 0 (0.0%) |
| 11:00 AM to 11:59 AM | 0 (0.0%) | 0 (0.0%) |
| 12:00 PM to 3:59 PM | 0 (0.0%) | 0 (0.0%) |
| 4:00 PM to 11:59 PM | 5 (2.5%) | 0 (0.0%) |
| Total | 204 (100.0%) | 280 (100.0%) |
Housing Occupancy in Harbor
Occupancy by Ownership in Harbor
Of the total 1,169 dwellings in Harbor, owner-occupied units account for 873 (74.7%), while renter-occupied units make up 296 (25.3%).
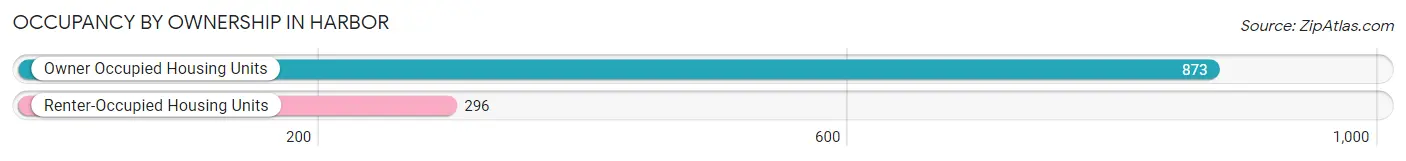
| Occupancy | # Housing Units | % Housing Units |
| Owner Occupied Housing Units | 873 | 74.7% |
| Renter-Occupied Housing Units | 296 | 25.3% |
| Total Occupied Housing Units | 1,169 | 100.0% |
Occupancy by Household Size in Harbor
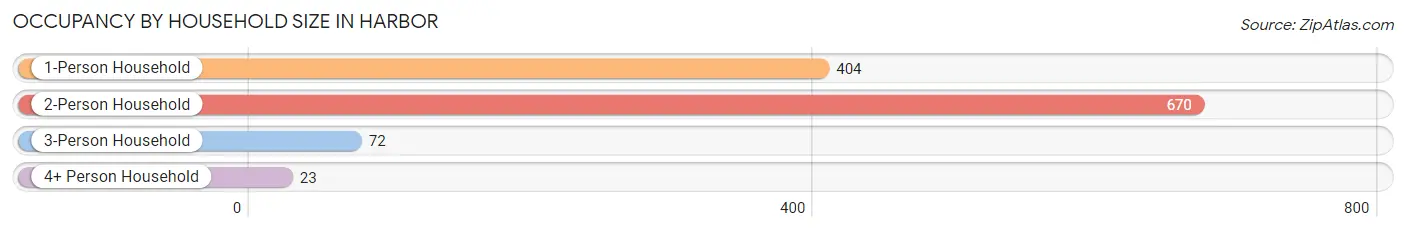
| Household Size | # Housing Units | % Housing Units |
| 1-Person Household | 404 | 34.6% |
| 2-Person Household | 670 | 57.3% |
| 3-Person Household | 72 | 6.2% |
| 4+ Person Household | 23 | 2.0% |
| Total Housing Units | 1,169 | 100.0% |
Occupancy by Ownership by Household Size in Harbor
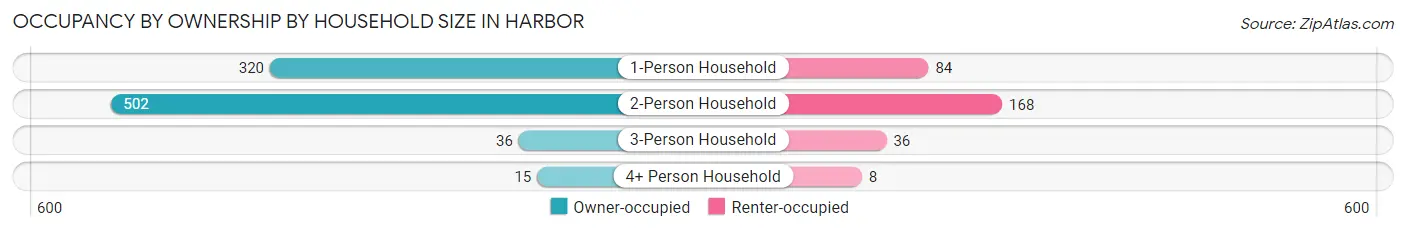
| Household Size | Owner-occupied | Renter-occupied |
| 1-Person Household | 320 (79.2%) | 84 (20.8%) |
| 2-Person Household | 502 (74.9%) | 168 (25.1%) |
| 3-Person Household | 36 (50.0%) | 36 (50.0%) |
| 4+ Person Household | 15 (65.2%) | 8 (34.8%) |
| Total Housing Units | 873 (74.7%) | 296 (25.3%) |
Occupancy by Educational Attainment in Harbor
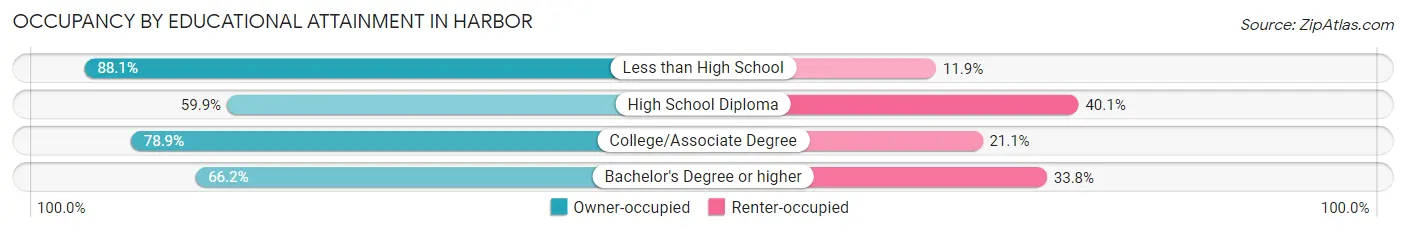
| Household Size | Owner-occupied | Renter-occupied |
| Less than High School | 89 (88.1%) | 12 (11.9%) |
| High School Diploma | 106 (59.9%) | 71 (40.1%) |
| College/Associate Degree | 547 (78.9%) | 146 (21.1%) |
| Bachelor's Degree or higher | 131 (66.2%) | 67 (33.8%) |
Occupancy by Age of Householder in Harbor
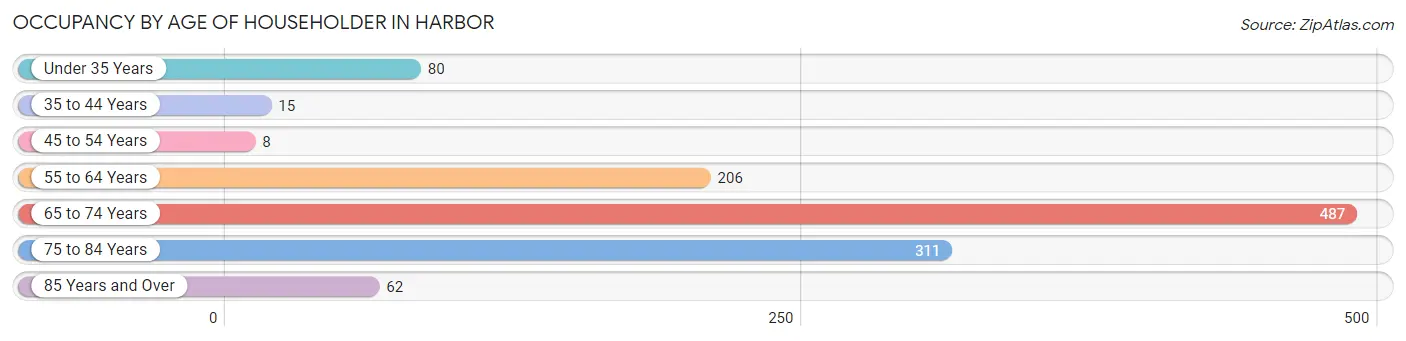
| Age Bracket | # Households | % Households |
| Under 35 Years | 80 | 6.8% |
| 35 to 44 Years | 15 | 1.3% |
| 45 to 54 Years | 8 | 0.7% |
| 55 to 64 Years | 206 | 17.6% |
| 65 to 74 Years | 487 | 41.7% |
| 75 to 84 Years | 311 | 26.6% |
| 85 Years and Over | 62 | 5.3% |
| Total | 1,169 | 100.0% |
Housing Finances in Harbor
Median Income by Occupancy in Harbor
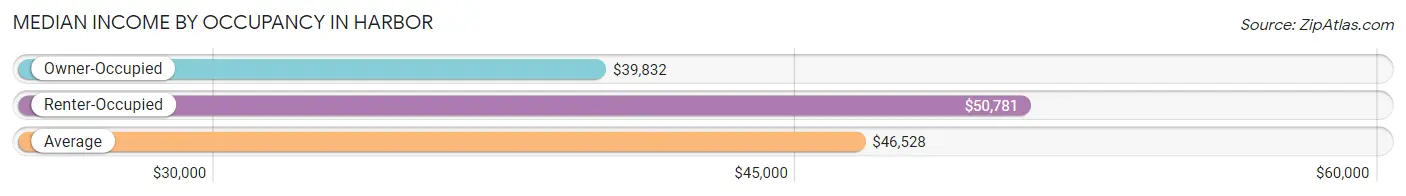
| Occupancy Type | # Households | Median Income |
| Owner-Occupied | 873 (74.7%) | $39,832 |
| Renter-Occupied | 296 (25.3%) | $50,781 |
| Average | 1,169 (100.0%) | $46,528 |
Occupancy by Householder Income Bracket in Harbor
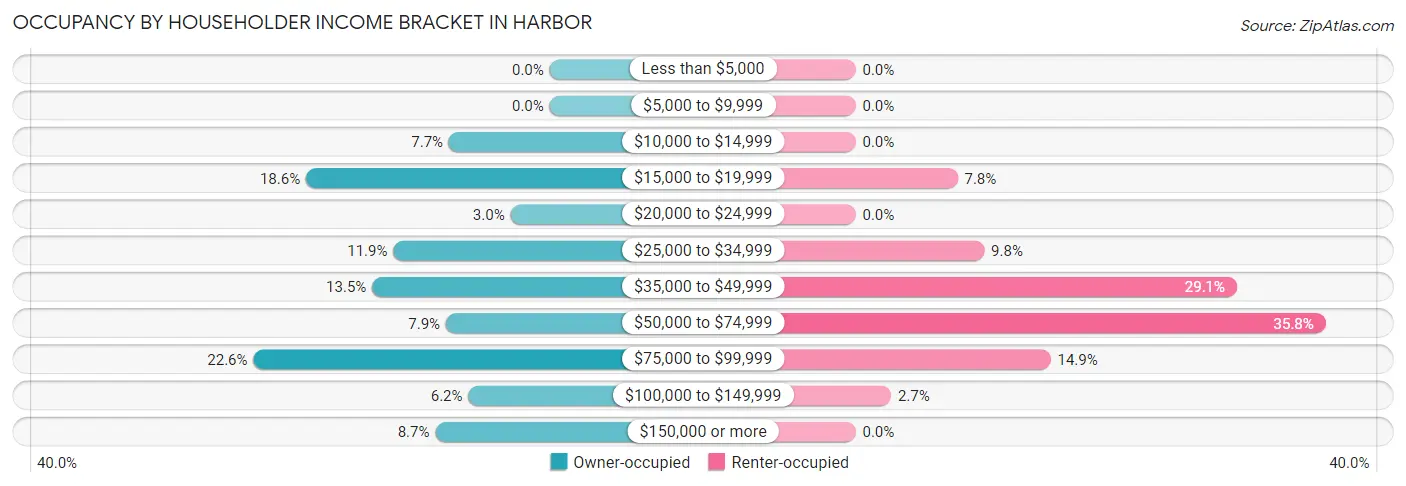
| Income Bracket | Owner-occupied | Renter-occupied |
| Less than $5,000 | 0 (0.0%) | 0 (0.0%) |
| $5,000 to $9,999 | 0 (0.0%) | 0 (0.0%) |
| $10,000 to $14,999 | 67 (7.7%) | 0 (0.0%) |
| $15,000 to $19,999 | 162 (18.6%) | 23 (7.8%) |
| $20,000 to $24,999 | 26 (3.0%) | 0 (0.0%) |
| $25,000 to $34,999 | 104 (11.9%) | 29 (9.8%) |
| $35,000 to $49,999 | 118 (13.5%) | 86 (29.0%) |
| $50,000 to $74,999 | 69 (7.9%) | 106 (35.8%) |
| $75,000 to $99,999 | 197 (22.6%) | 44 (14.9%) |
| $100,000 to $149,999 | 54 (6.2%) | 8 (2.7%) |
| $150,000 or more | 76 (8.7%) | 0 (0.0%) |
| Total | 873 (100.0%) | 296 (100.0%) |
Monthly Housing Cost Tiers in Harbor
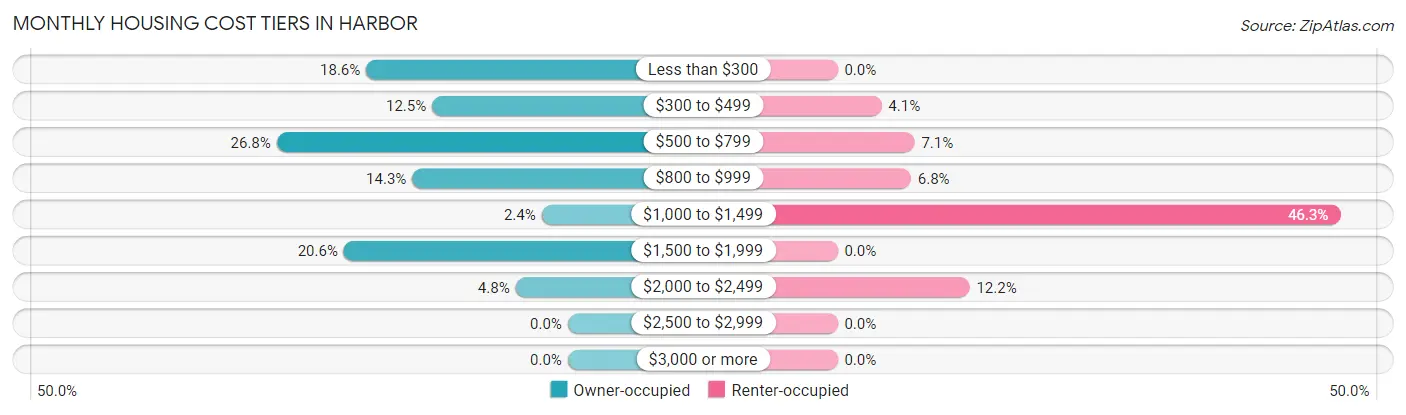
| Monthly Cost | Owner-occupied | Renter-occupied |
| Less than $300 | 162 (18.6%) | 0 (0.0%) |
| $300 to $499 | 109 (12.5%) | 12 (4.1%) |
| $500 to $799 | 234 (26.8%) | 21 (7.1%) |
| $800 to $999 | 125 (14.3%) | 20 (6.8%) |
| $1,000 to $1,499 | 21 (2.4%) | 137 (46.3%) |
| $1,500 to $1,999 | 180 (20.6%) | 0 (0.0%) |
| $2,000 to $2,499 | 42 (4.8%) | 36 (12.2%) |
| $2,500 to $2,999 | 0 (0.0%) | 0 (0.0%) |
| $3,000 or more | 0 (0.0%) | 0 (0.0%) |
| Total | 873 (100.0%) | 296 (100.0%) |
Physical Housing Characteristics in Harbor
Housing Structures in Harbor
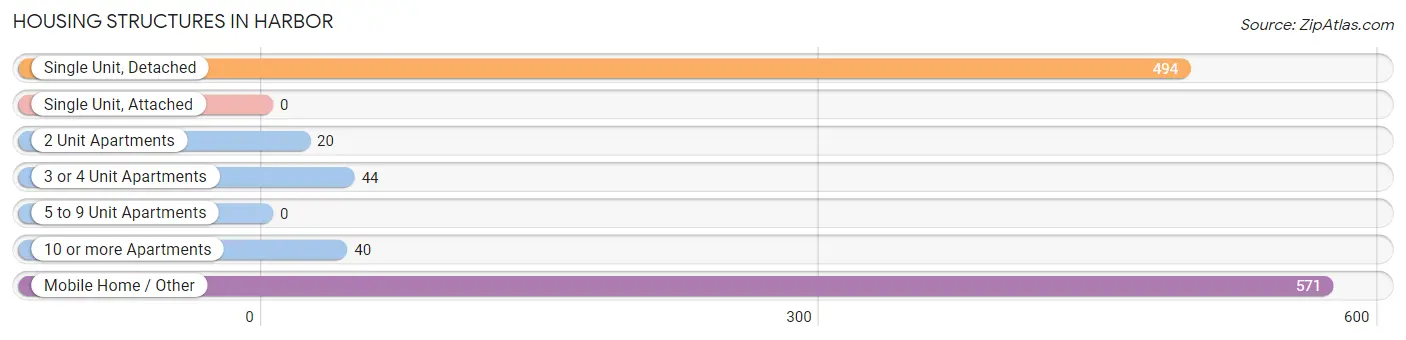
| Structure Type | # Housing Units | % Housing Units |
| Single Unit, Detached | 494 | 42.3% |
| Single Unit, Attached | 0 | 0.0% |
| 2 Unit Apartments | 20 | 1.7% |
| 3 or 4 Unit Apartments | 44 | 3.8% |
| 5 to 9 Unit Apartments | 0 | 0.0% |
| 10 or more Apartments | 40 | 3.4% |
| Mobile Home / Other | 571 | 48.8% |
| Total | 1,169 | 100.0% |
Housing Structures by Occupancy in Harbor
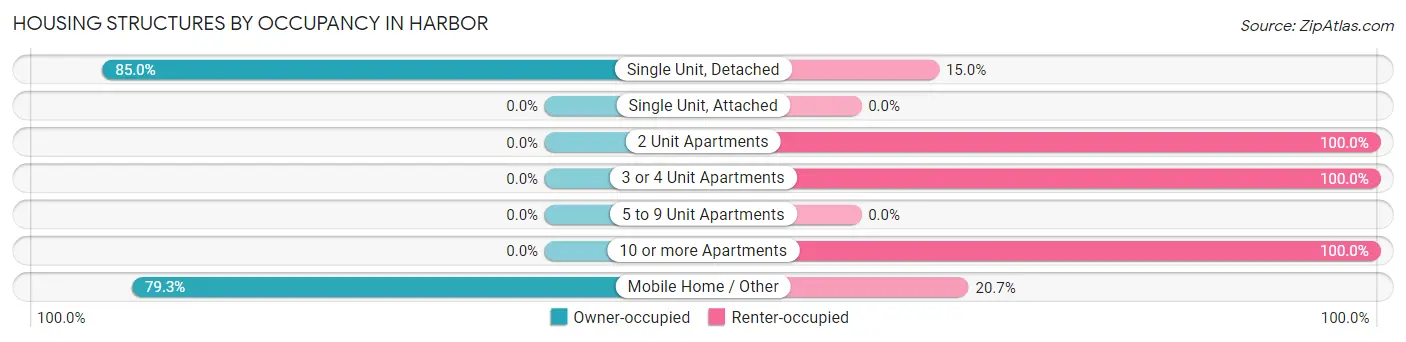
| Structure Type | Owner-occupied | Renter-occupied |
| Single Unit, Detached | 420 (85.0%) | 74 (15.0%) |
| Single Unit, Attached | 0 (0.0%) | 0 (0.0%) |
| 2 Unit Apartments | 0 (0.0%) | 20 (100.0%) |
| 3 or 4 Unit Apartments | 0 (0.0%) | 44 (100.0%) |
| 5 to 9 Unit Apartments | 0 (0.0%) | 0 (0.0%) |
| 10 or more Apartments | 0 (0.0%) | 40 (100.0%) |
| Mobile Home / Other | 453 (79.3%) | 118 (20.7%) |
| Total | 873 (74.7%) | 296 (25.3%) |
Housing Structures by Number of Rooms in Harbor
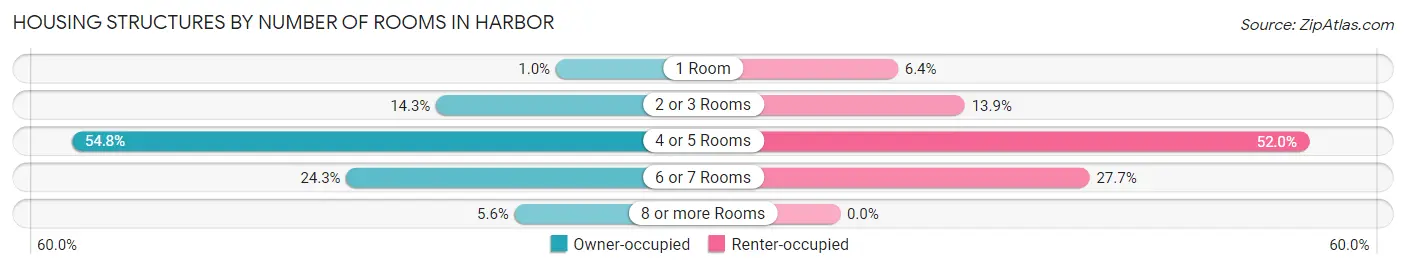
| Number of Rooms | Owner-occupied | Renter-occupied |
| 1 Room | 9 (1.0%) | 19 (6.4%) |
| 2 or 3 Rooms | 125 (14.3%) | 41 (13.9%) |
| 4 or 5 Rooms | 478 (54.7%) | 154 (52.0%) |
| 6 or 7 Rooms | 212 (24.3%) | 82 (27.7%) |
| 8 or more Rooms | 49 (5.6%) | 0 (0.0%) |
| Total | 873 (100.0%) | 296 (100.0%) |
Housing Structure by Heating Type in Harbor
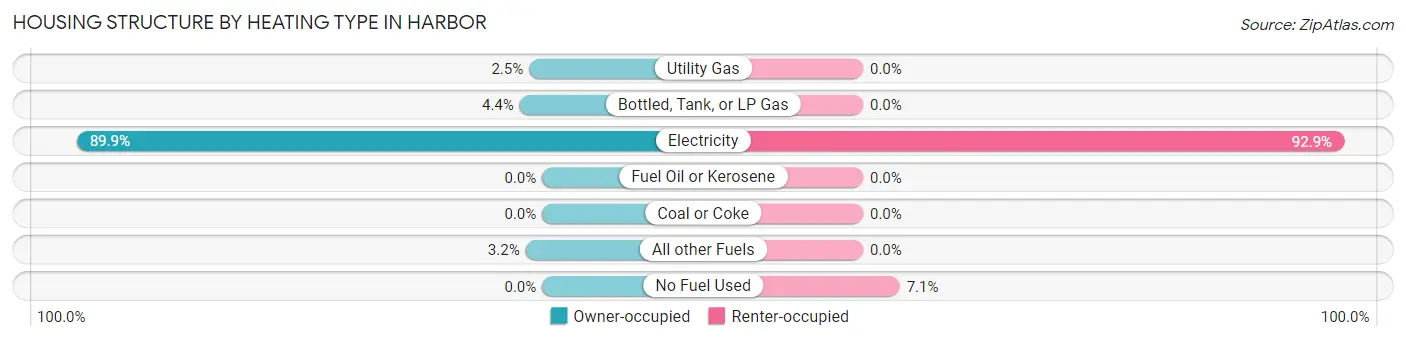
| Heating Type | Owner-occupied | Renter-occupied |
| Utility Gas | 22 (2.5%) | 0 (0.0%) |
| Bottled, Tank, or LP Gas | 38 (4.3%) | 0 (0.0%) |
| Electricity | 785 (89.9%) | 275 (92.9%) |
| Fuel Oil or Kerosene | 0 (0.0%) | 0 (0.0%) |
| Coal or Coke | 0 (0.0%) | 0 (0.0%) |
| All other Fuels | 28 (3.2%) | 0 (0.0%) |
| No Fuel Used | 0 (0.0%) | 21 (7.1%) |
| Total | 873 (100.0%) | 296 (100.0%) |
Household Vehicle Usage in Harbor
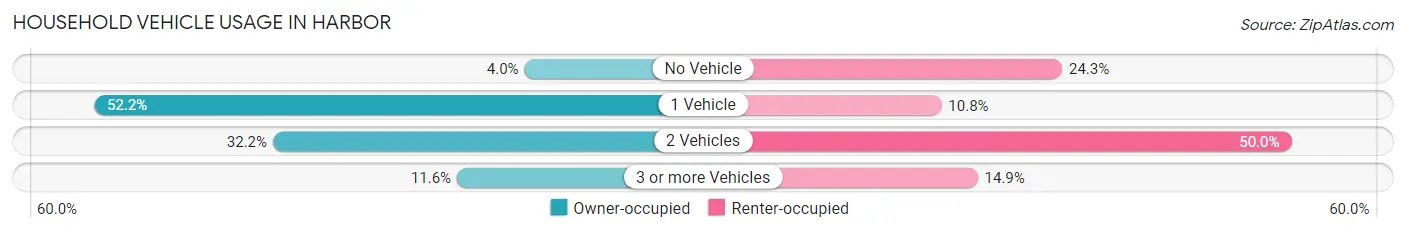
| Vehicles per Household | Owner-occupied | Renter-occupied |
| No Vehicle | 35 (4.0%) | 72 (24.3%) |
| 1 Vehicle | 456 (52.2%) | 32 (10.8%) |
| 2 Vehicles | 281 (32.2%) | 148 (50.0%) |
| 3 or more Vehicles | 101 (11.6%) | 44 (14.9%) |
| Total | 873 (100.0%) | 296 (100.0%) |
Real Estate & Mortgages in Harbor
Real Estate and Mortgage Overview in Harbor
| Characteristic | Without Mortgage | With Mortgage |
| Housing Units | 598 | 275 |
| Median Property Value | $171,500 | $334,000 |
| Median Household Income | $32,321 | $19 |
| Monthly Housing Costs | $544 | $0 |
| Real Estate Taxes | $1,043 | $0 |
Property Value by Mortgage Status in Harbor
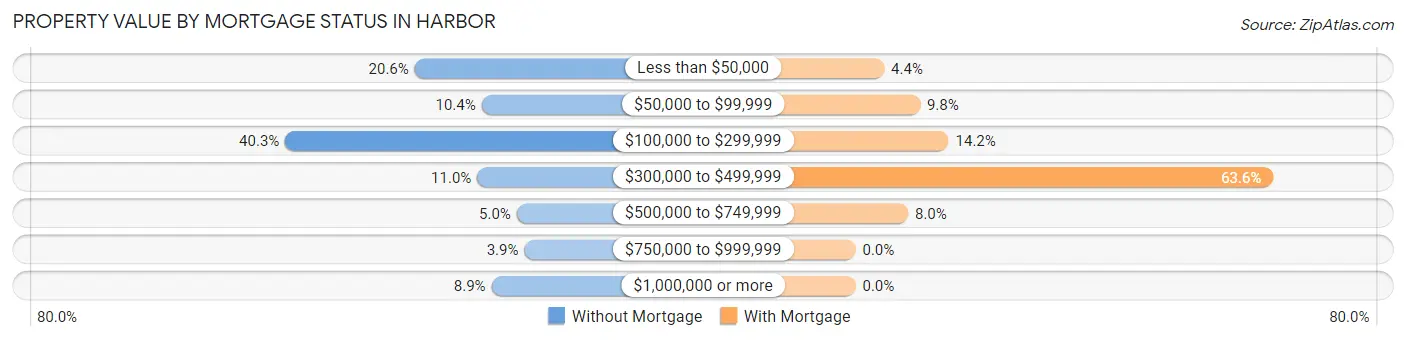
| Property Value | Without Mortgage | With Mortgage |
| Less than $50,000 | 123 (20.6%) | 12 (4.4%) |
| $50,000 to $99,999 | 62 (10.4%) | 27 (9.8%) |
| $100,000 to $299,999 | 241 (40.3%) | 39 (14.2%) |
| $300,000 to $499,999 | 66 (11.0%) | 175 (63.6%) |
| $500,000 to $749,999 | 30 (5.0%) | 22 (8.0%) |
| $750,000 to $999,999 | 23 (3.8%) | 0 (0.0%) |
| $1,000,000 or more | 53 (8.9%) | 0 (0.0%) |
| Total | 598 (100.0%) | 275 (100.0%) |
Household Income by Mortgage Status in Harbor
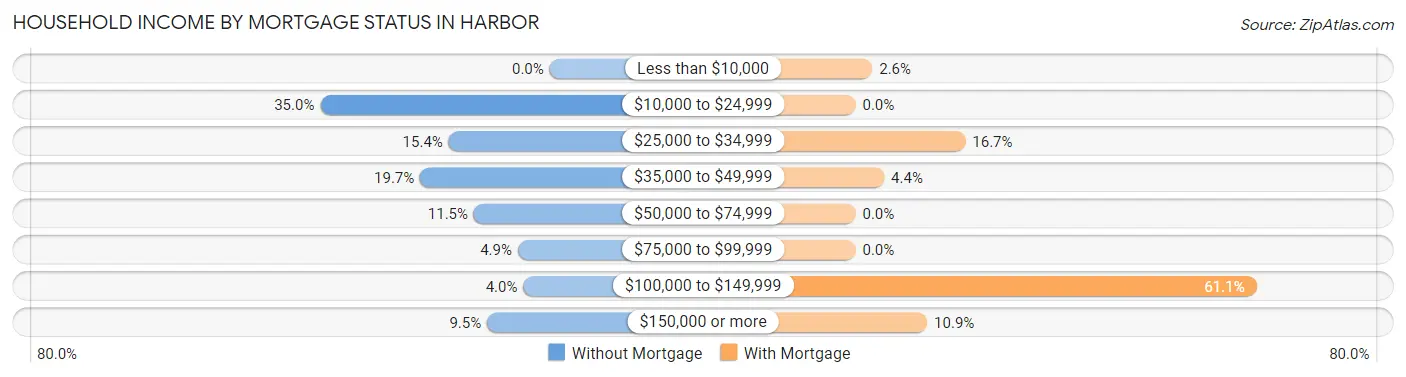
| Household Income | Without Mortgage | With Mortgage |
| Less than $10,000 | 0 (0.0%) | 7 (2.5%) |
| $10,000 to $24,999 | 209 (34.9%) | 0 (0.0%) |
| $25,000 to $34,999 | 92 (15.4%) | 46 (16.7%) |
| $35,000 to $49,999 | 118 (19.7%) | 12 (4.4%) |
| $50,000 to $74,999 | 69 (11.5%) | 0 (0.0%) |
| $75,000 to $99,999 | 29 (4.9%) | 0 (0.0%) |
| $100,000 to $149,999 | 24 (4.0%) | 168 (61.1%) |
| $150,000 or more | 57 (9.5%) | 30 (10.9%) |
| Total | 598 (100.0%) | 275 (100.0%) |
Property Value to Household Income Ratio in Harbor
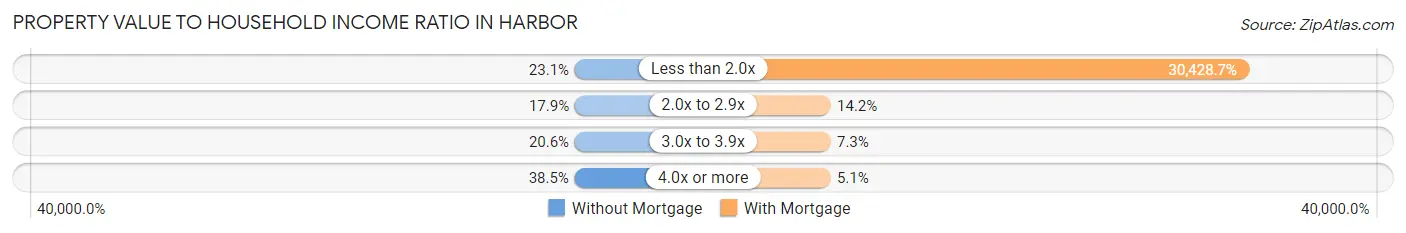
| Value-to-Income Ratio | Without Mortgage | With Mortgage |
| Less than 2.0x | 138 (23.1%) | 83,679 (30,428.7%) |
| 2.0x to 2.9x | 107 (17.9%) | 39 (14.2%) |
| 3.0x to 3.9x | 123 (20.6%) | 20 (7.3%) |
| 4.0x or more | 230 (38.5%) | 14 (5.1%) |
| Total | 598 (100.0%) | 275 (100.0%) |
Real Estate Taxes by Mortgage Status in Harbor
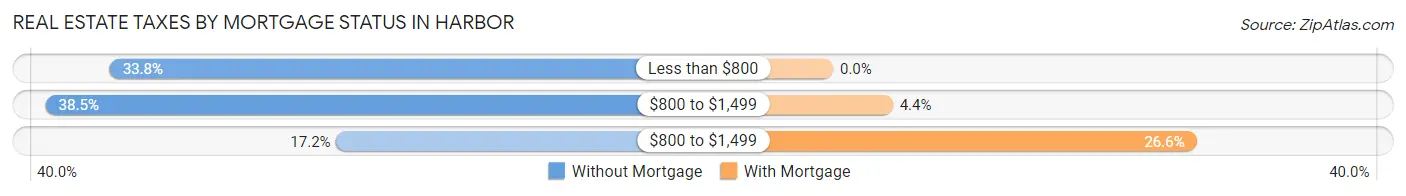
| Property Taxes | Without Mortgage | With Mortgage |
| Less than $800 | 202 (33.8%) | 0 (0.0%) |
| $800 to $1,499 | 230 (38.5%) | 12 (4.4%) |
| $800 to $1,499 | 103 (17.2%) | 73 (26.6%) |
| Total | 598 (100.0%) | 275 (100.0%) |
Health & Disability in Harbor
Health Insurance Coverage by Age in Harbor
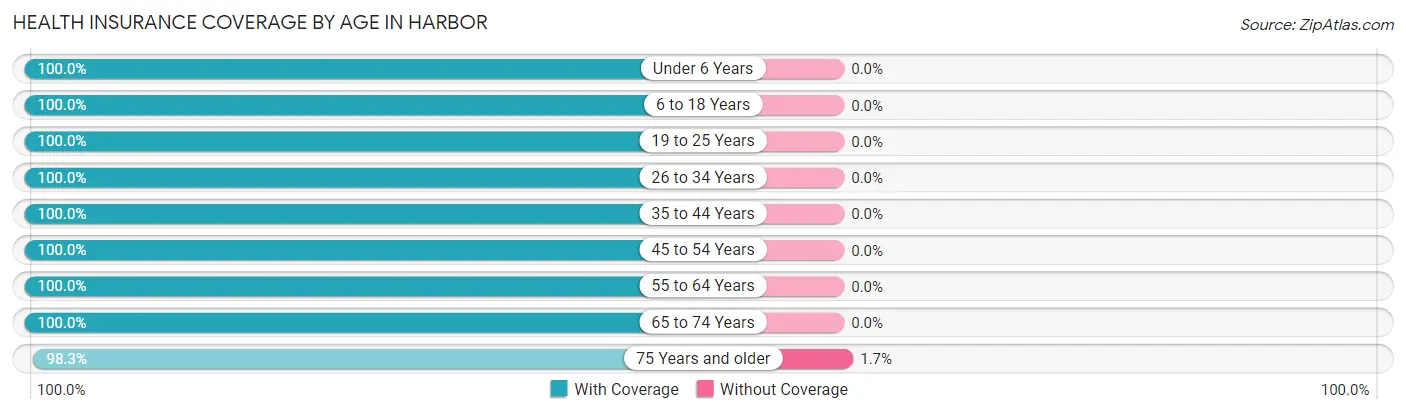
| Age Bracket | With Coverage | Without Coverage |
| Under 6 Years | 23 (100.0%) | 0 (0.0%) |
| 6 to 18 Years | 23 (100.0%) | 0 (0.0%) |
| 19 to 25 Years | 199 (100.0%) | 0 (0.0%) |
| 26 to 34 Years | 57 (100.0%) | 0 (0.0%) |
| 35 to 44 Years | 27 (100.0%) | 0 (0.0%) |
| 45 to 54 Years | 34 (100.0%) | 0 (0.0%) |
| 55 to 64 Years | 306 (100.0%) | 0 (0.0%) |
| 65 to 74 Years | 674 (100.0%) | 0 (0.0%) |
| 75 Years and older | 642 (98.3%) | 11 (1.7%) |
| Total | 1,985 (99.5%) | 11 (0.5%) |
Health Insurance Coverage by Citizenship Status in Harbor
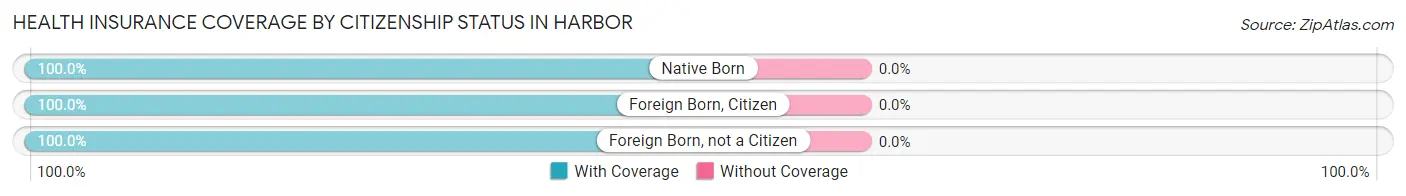
| Citizenship Status | With Coverage | Without Coverage |
| Native Born | 23 (100.0%) | 0 (0.0%) |
| Foreign Born, Citizen | 23 (100.0%) | 0 (0.0%) |
| Foreign Born, not a Citizen | 199 (100.0%) | 0 (0.0%) |
Health Insurance Coverage by Household Income in Harbor
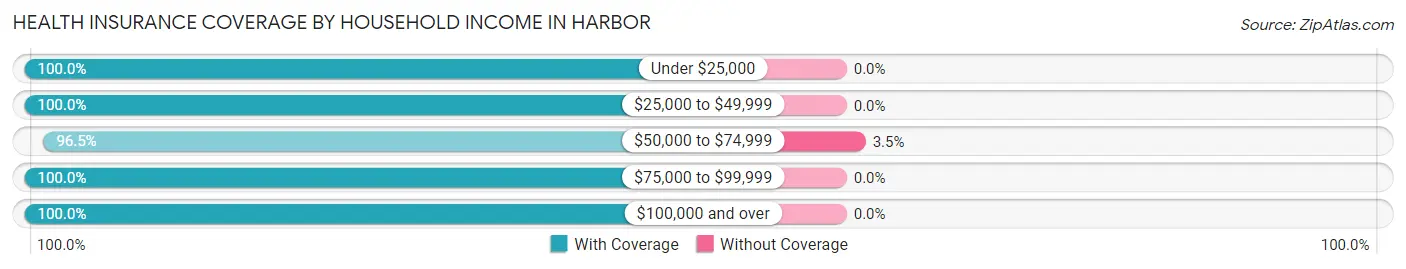
| Household Income | With Coverage | Without Coverage |
| Under $25,000 | 297 (100.0%) | 0 (0.0%) |
| $25,000 to $49,999 | 586 (100.0%) | 0 (0.0%) |
| $50,000 to $74,999 | 300 (96.5%) | 11 (3.5%) |
| $75,000 to $99,999 | 418 (100.0%) | 0 (0.0%) |
| $100,000 and over | 359 (100.0%) | 0 (0.0%) |
Public vs Private Health Insurance Coverage by Age in Harbor
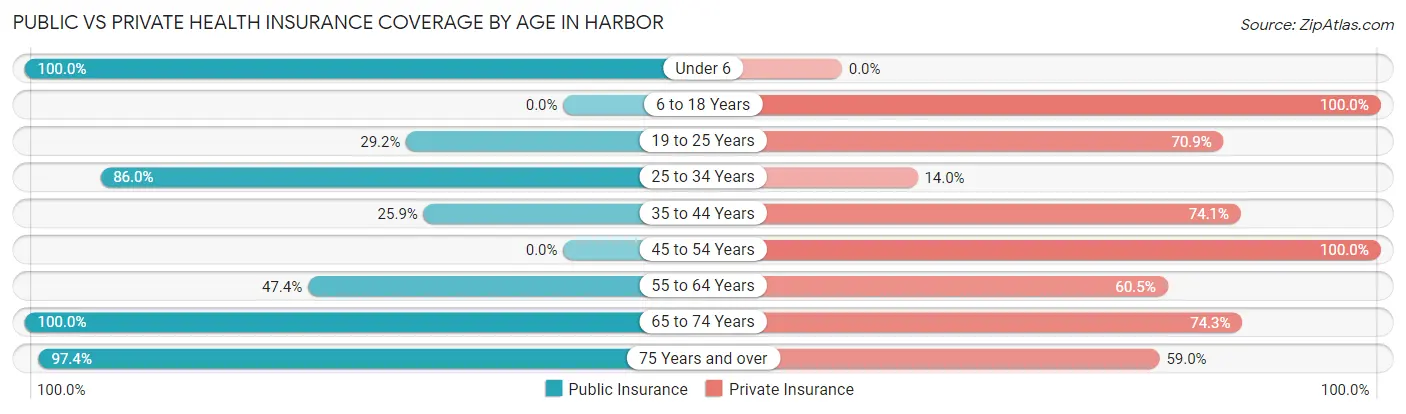
| Age Bracket | Public Insurance | Private Insurance |
| Under 6 | 23 (100.0%) | 0 (0.0%) |
| 6 to 18 Years | 0 (0.0%) | 23 (100.0%) |
| 19 to 25 Years | 58 (29.1%) | 141 (70.9%) |
| 25 to 34 Years | 49 (86.0%) | 8 (14.0%) |
| 35 to 44 Years | 7 (25.9%) | 20 (74.1%) |
| 45 to 54 Years | 0 (0.0%) | 34 (100.0%) |
| 55 to 64 Years | 145 (47.4%) | 185 (60.5%) |
| 65 to 74 Years | 674 (100.0%) | 501 (74.3%) |
| 75 Years and over | 636 (97.4%) | 385 (59.0%) |
| Total | 1,592 (79.8%) | 1,297 (65.0%) |
Disability Status by Sex by Age in Harbor
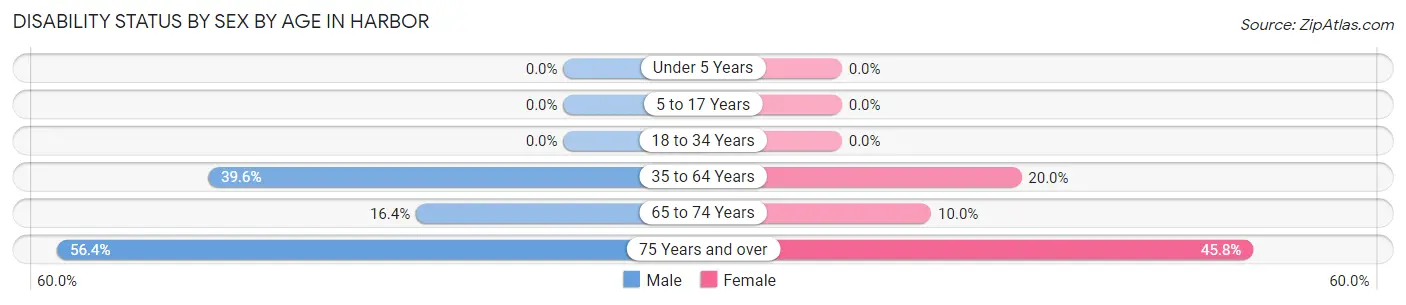
| Age Bracket | Male | Female |
| Under 5 Years | 0 (0.0%) | 0 (0.0%) |
| 5 to 17 Years | 0 (0.0%) | 0 (0.0%) |
| 18 to 34 Years | 0 (0.0%) | 0 (0.0%) |
| 35 to 64 Years | 74 (39.6%) | 36 (20.0%) |
| 65 to 74 Years | 43 (16.4%) | 41 (10.0%) |
| 75 Years and over | 106 (56.4%) | 213 (45.8%) |
Disability Class by Sex by Age in Harbor
Disability Class: Hearing Difficulty
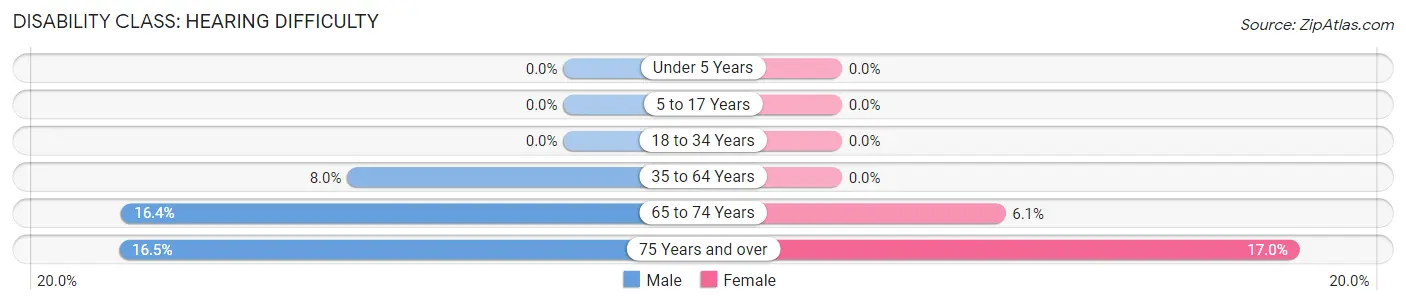
| Age Bracket | Male | Female |
| Under 5 Years | 0 (0.0%) | 0 (0.0%) |
| 5 to 17 Years | 0 (0.0%) | 0 (0.0%) |
| 18 to 34 Years | 0 (0.0%) | 0 (0.0%) |
| 35 to 64 Years | 15 (8.0%) | 0 (0.0%) |
| 65 to 74 Years | 43 (16.4%) | 25 (6.1%) |
| 75 Years and over | 31 (16.5%) | 79 (17.0%) |
Disability Class: Vision Difficulty
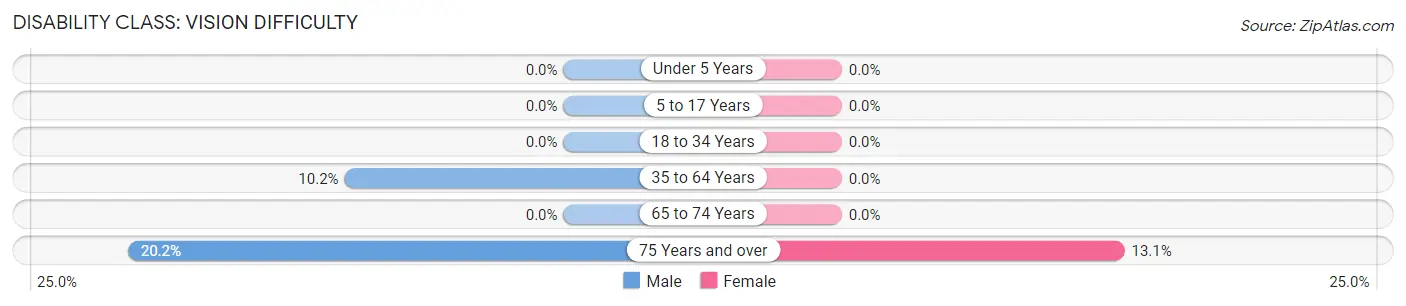
| Age Bracket | Male | Female |
| Under 5 Years | 0 (0.0%) | 0 (0.0%) |
| 5 to 17 Years | 0 (0.0%) | 0 (0.0%) |
| 18 to 34 Years | 0 (0.0%) | 0 (0.0%) |
| 35 to 64 Years | 19 (10.2%) | 0 (0.0%) |
| 65 to 74 Years | 0 (0.0%) | 0 (0.0%) |
| 75 Years and over | 38 (20.2%) | 61 (13.1%) |
Disability Class: Cognitive Difficulty
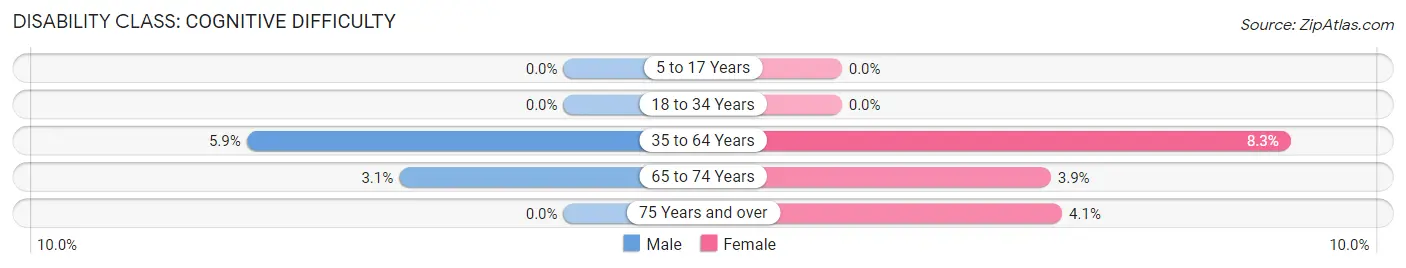
| Age Bracket | Male | Female |
| 5 to 17 Years | 0 (0.0%) | 0 (0.0%) |
| 18 to 34 Years | 0 (0.0%) | 0 (0.0%) |
| 35 to 64 Years | 11 (5.9%) | 15 (8.3%) |
| 65 to 74 Years | 8 (3.0%) | 16 (3.9%) |
| 75 Years and over | 0 (0.0%) | 19 (4.1%) |
Disability Class: Ambulatory Difficulty
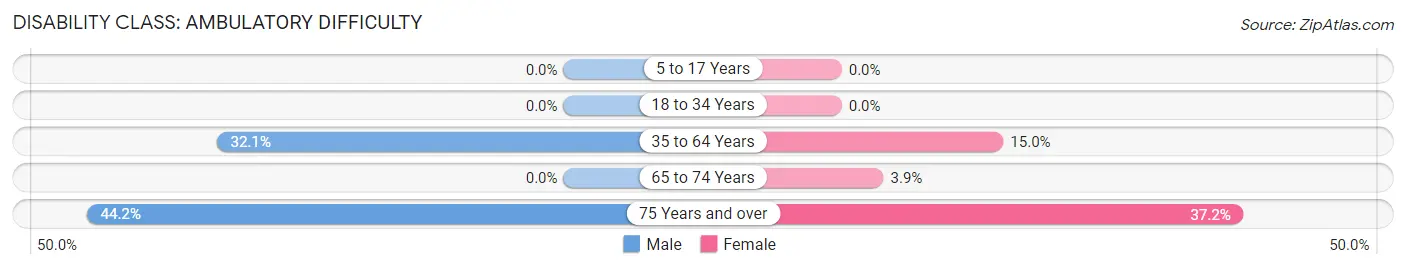
| Age Bracket | Male | Female |
| 5 to 17 Years | 0 (0.0%) | 0 (0.0%) |
| 18 to 34 Years | 0 (0.0%) | 0 (0.0%) |
| 35 to 64 Years | 60 (32.1%) | 27 (15.0%) |
| 65 to 74 Years | 0 (0.0%) | 16 (3.9%) |
| 75 Years and over | 83 (44.2%) | 173 (37.2%) |
Disability Class: Self-Care Difficulty
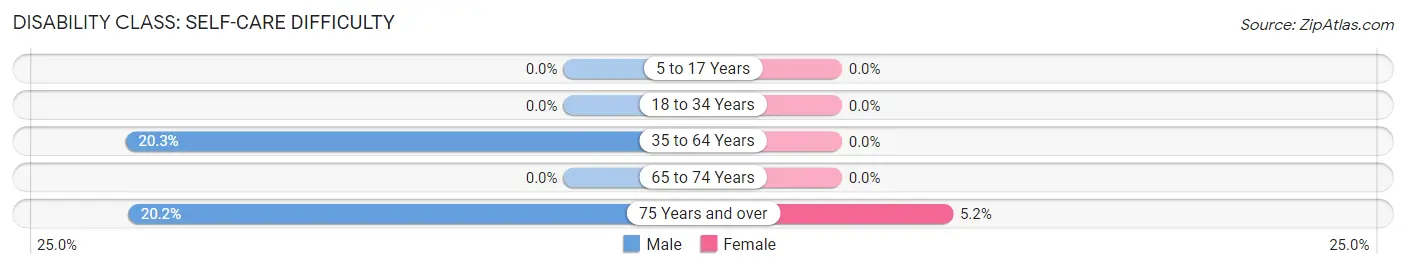
| Age Bracket | Male | Female |
| 5 to 17 Years | 0 (0.0%) | 0 (0.0%) |
| 18 to 34 Years | 0 (0.0%) | 0 (0.0%) |
| 35 to 64 Years | 38 (20.3%) | 0 (0.0%) |
| 65 to 74 Years | 0 (0.0%) | 0 (0.0%) |
| 75 Years and over | 38 (20.2%) | 24 (5.2%) |
Technology Access in Harbor
Computing Device Access in Harbor
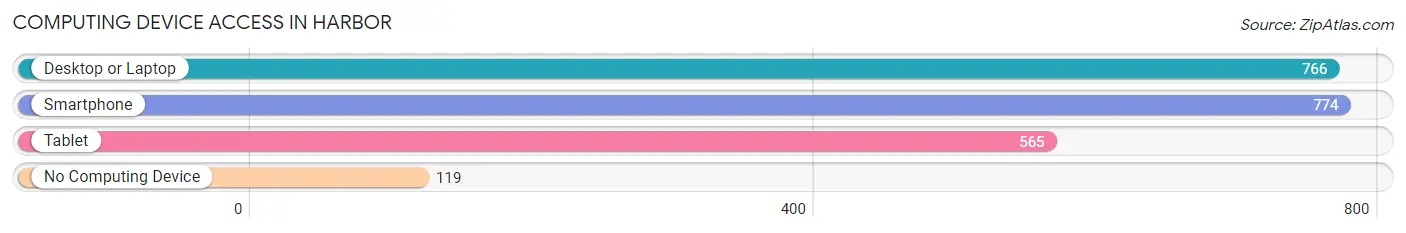
| Device Type | # Households | % Households |
| Desktop or Laptop | 766 | 65.5% |
| Smartphone | 774 | 66.2% |
| Tablet | 565 | 48.3% |
| No Computing Device | 119 | 10.2% |
| Total | 1,169 | 100.0% |
Internet Access in Harbor
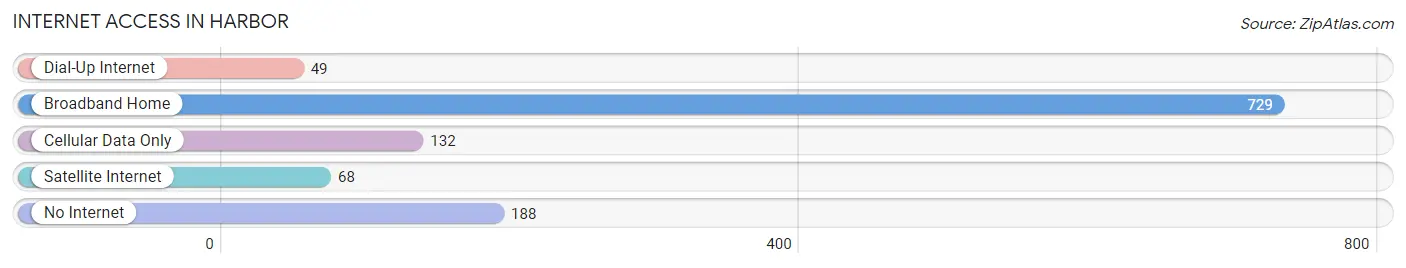
| Internet Type | # Households | % Households |
| Dial-Up Internet | 49 | 4.2% |
| Broadband Home | 729 | 62.4% |
| Cellular Data Only | 132 | 11.3% |
| Satellite Internet | 68 | 5.8% |
| No Internet | 188 | 16.1% |
| Total | 1,169 | 100.0% |
Harbor Summary
Harbor, Oregon is a small city located in Coos County, Oregon, United States. It is situated on the south side of Coos Bay, an inlet of the Pacific Ocean. The city is located on the south side of the bay, and is the largest city in the county. The population of Harbor was 5,313 at the 2010 census.
Geography
Harbor is located at the mouth of Coos Bay, an inlet of the Pacific Ocean. The city is situated on the south side of the bay, and is the largest city in the county. The city is located on the south side of the bay, and is the largest city in the county. The city is surrounded by the Coos Bay Estuary, which is a large estuary that is home to a variety of wildlife. The city is also located near the Oregon Dunes National Recreation Area, which is a popular destination for outdoor recreation.
The city has a total area of 4.2 square miles, of which 4.1 square miles is land and 0.1 square miles is water. The city is located at an elevation of 10 feet above sea level.
History
Harbor was founded in 1853 by a group of settlers from the East Coast. The city was originally named "New Boston" after the city of Boston, Massachusetts. The city was renamed "Harbor" in 1857, after the nearby Coos Bay.
The city was incorporated in 1874, and was the first city in Coos County to be incorporated. The city was a major port for the lumber industry, and was also a major fishing port. The city was also a major center for the canning industry, and was home to several canneries.
The city was also home to a large shipbuilding industry, and was home to several shipyards. The city was also home to a large fishing fleet, and was home to several fish processing plants.
Economy
Harbor is a major port for the lumber industry, and is home to several lumber mills. The city is also home to several fish processing plants, and is home to several canneries. The city is also home to a large shipbuilding industry, and is home to several shipyards.
The city is also home to a large fishing fleet, and is home to several fish processing plants. The city is also home to several seafood restaurants, and is home to several seafood markets.
The city is also home to several retail stores, and is home to several restaurants. The city is also home to several hotels, and is home to several tourist attractions.
Demographics
As of the 2010 census, the population of Harbor was 5,313. The racial makeup of the city was 90.3% White, 0.7% African American, 0.7% Native American, 0.7% Asian, 0.2% Pacific Islander, 0.7% from other races, and 2.4% from two or more races. Hispanic or Latino of any race were 4.2% of the population.
The median income for a household in the city was $37,917, and the median income for a family was $45,917. The per capita income for the city was $19,917. About 11.7% of families and 14.3% of the population were below the poverty line, including 19.2% of those under age 18 and 8.3% of those age 65 or over.
Common Questions
What is Per Capita Income in Harbor?
Per Capita income in Harbor is $34,106.
What is the Median Family Income in Harbor?
Median Family Income in Harbor is $60,691.
What is the Median Household income in Harbor?
Median Household Income in Harbor is $46,528.
What is Income or Wage Gap in Harbor?
Income or Wage Gap in Harbor is 35.4%.
Women in Harbor earn 64.6 cents for every dollar earned by a man.
What is Inequality or Gini Index in Harbor?
Inequality or Gini Index in Harbor is 0.39.
What is the Total Population of Harbor?
Total Population of Harbor is 2,003.
What is the Total Male Population of Harbor?
Total Male Population of Harbor is 796.
What is the Total Female Population of Harbor?
Total Female Population of Harbor is 1,207.
What is the Ratio of Males per 100 Females in Harbor?
There are 65.95 Males per 100 Females in Harbor.
What is the Ratio of Females per 100 Males in Harbor?
There are 151.63 Females per 100 Males in Harbor.
What is the Median Population Age in Harbor?
Median Population Age in Harbor is 69.4 Years.
What is the Average Family Size in Harbor
Average Family Size in Harbor is 2.0 People.
What is the Average Household Size in Harbor
Average Household Size in Harbor is 1.7 People.
How Large is the Labor Force in Harbor?
There are 531 People in the Labor Forcein in Harbor.
What is the Percentage of People in the Labor Force in Harbor?
26.8% of People are in the Labor Force in Harbor.
What is the Unemployment Rate in Harbor?
Unemployment Rate in Harbor is 5.7%.