Halsey, OR Map & Demographics
Halsey Map
Halsey Overview
$31,627
PER CAPITA INCOME
$94,375
AVG FAMILY INCOME
$96,250
AVG HOUSEHOLD INCOME
41.5%
WAGE / INCOME GAP [ % ]
58.5¢/ $1
WAGE / INCOME GAP [ $ ]
0.28
INEQUALITY / GINI INDEX
1,419
TOTAL POPULATION
694
MALE POPULATION
725
FEMALE POPULATION
95.72
MALES / 100 FEMALES
104.47
FEMALES / 100 MALES
37.2
MEDIAN AGE
3.1
AVG FAMILY SIZE
3.2
AVG HOUSEHOLD SIZE
804
LABOR FORCE [ PEOPLE ]
71.0%
PERCENT IN LABOR FORCE
5.3%
UNEMPLOYMENT RATE
Halsey Zip Codes
Halsey Area Codes
Income in Halsey
Income Overview in Halsey
Per Capita Income in Halsey is $31,627, while median incomes of families and households are $94,375 and $96,250 respectively.
| Characteristic | Number | Measure |
| Per Capita Income | 1,419 | $31,627 |
| Median Family Income | 390 | $94,375 |
| Mean Family Income | 390 | $98,541 |
| Median Household Income | 445 | $96,250 |
| Mean Household Income | 445 | $102,867 |
| Income Deficit | 390 | $0 |
| Wage / Income Gap (%) | 1,419 | 41.47% |
| Wage / Income Gap ($) | 1,419 | 58.53¢ per $1 |
| Gini / Inequality Index | 1,419 | 0.28 |
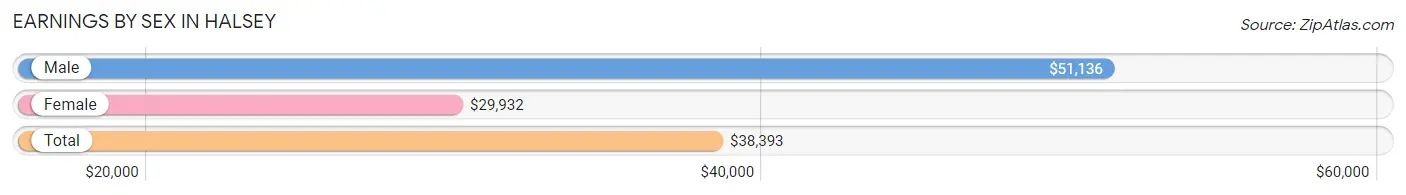
Earnings by Sex in Halsey
Average Earnings in Halsey are $38,393, $51,136 for men and $29,932 for women, a difference of 41.5%.
| Sex | Number | Average Earnings |
| Male | 414 (47.7%) | $51,136 |
| Female | 453 (52.2%) | $29,932 |
| Total | 867 (100.0%) | $38,393 |
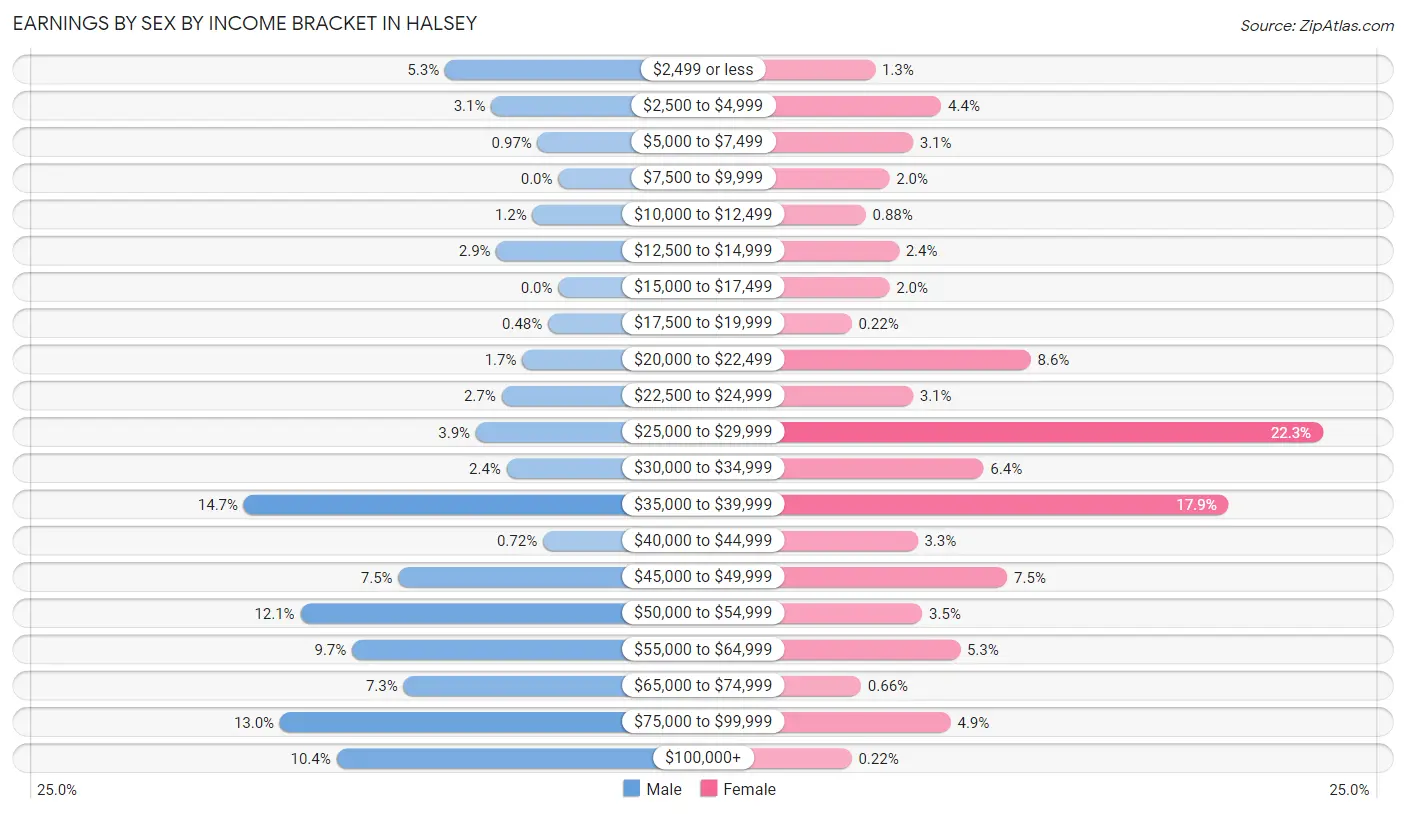
Earnings by Sex by Income Bracket in Halsey
The most common earnings brackets in Halsey are $35,000 to $39,999 for men (61 | 14.7%) and $25,000 to $29,999 for women (101 | 22.3%).
| Income | Male | Female |
| $2,499 or less | 22 (5.3%) | 6 (1.3%) |
| $2,500 to $4,999 | 13 (3.1%) | 20 (4.4%) |
| $5,000 to $7,499 | 4 (1.0%) | 14 (3.1%) |
| $7,500 to $9,999 | 0 (0.0%) | 9 (2.0%) |
| $10,000 to $12,499 | 5 (1.2%) | 4 (0.9%) |
| $12,500 to $14,999 | 12 (2.9%) | 11 (2.4%) |
| $15,000 to $17,499 | 0 (0.0%) | 9 (2.0%) |
| $17,500 to $19,999 | 2 (0.5%) | 1 (0.2%) |
| $20,000 to $22,499 | 7 (1.7%) | 39 (8.6%) |
| $22,500 to $24,999 | 11 (2.7%) | 14 (3.1%) |
| $25,000 to $29,999 | 16 (3.9%) | 101 (22.3%) |
| $30,000 to $34,999 | 10 (2.4%) | 29 (6.4%) |
| $35,000 to $39,999 | 61 (14.7%) | 81 (17.9%) |
| $40,000 to $44,999 | 3 (0.7%) | 15 (3.3%) |
| $45,000 to $49,999 | 31 (7.5%) | 34 (7.5%) |
| $50,000 to $54,999 | 50 (12.1%) | 16 (3.5%) |
| $55,000 to $64,999 | 40 (9.7%) | 24 (5.3%) |
| $65,000 to $74,999 | 30 (7.2%) | 3 (0.7%) |
| $75,000 to $99,999 | 54 (13.0%) | 22 (4.9%) |
| $100,000+ | 43 (10.4%) | 1 (0.2%) |
| Total | 414 (100.0%) | 453 (100.0%) |
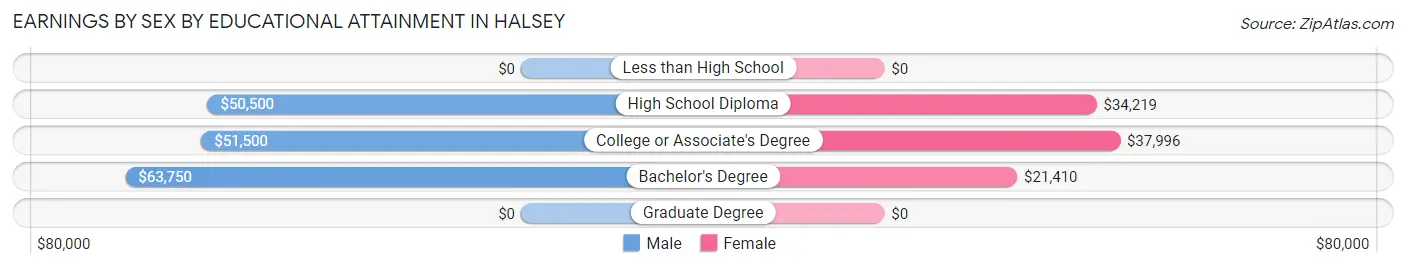
Earnings by Sex by Educational Attainment in Halsey
Average earnings in Halsey are $53,011 for men and $31,875 for women, a difference of 39.9%. Men with an educational attainment of bachelor's degree enjoy the highest average annual earnings of $63,750, while those with high school diploma education earn the least with $50,500. Women with an educational attainment of college or associate's degree earn the most with the average annual earnings of $37,996, while those with bachelor's degree education have the smallest earnings of $21,410.
| Educational Attainment | Male Income | Female Income |
| Less than High School | - | - |
| High School Diploma | $50,500 | $34,219 |
| College or Associate's Degree | $51,500 | $37,996 |
| Bachelor's Degree | $63,750 | $21,410 |
| Graduate Degree | - | - |
| Total | $53,011 | $31,875 |
Family Income in Halsey
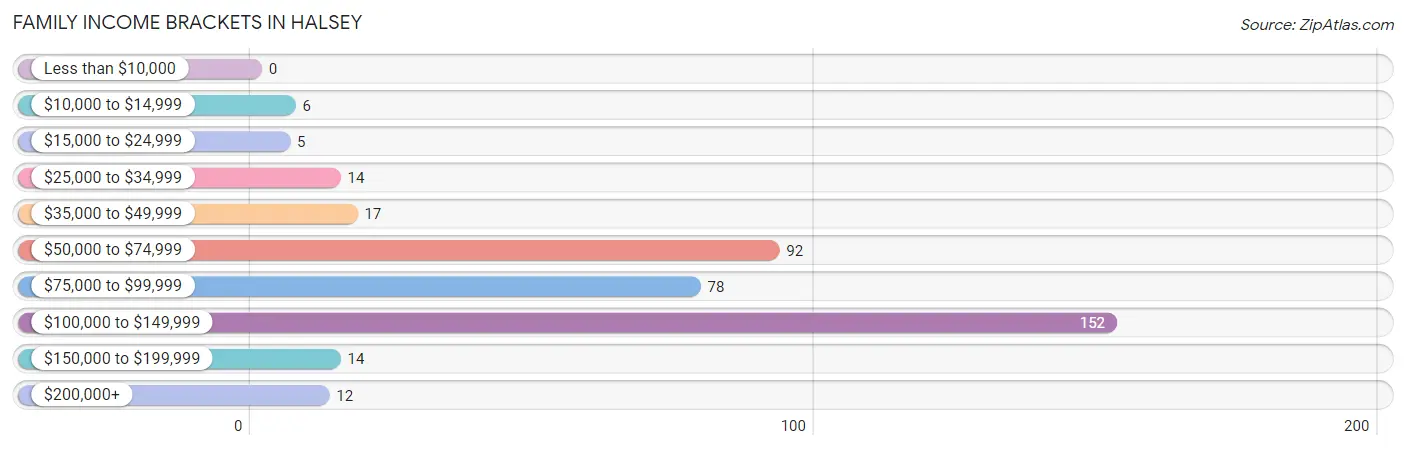
Family Income Brackets in Halsey
According to the Halsey family income data, there are 152 families falling into the $100,000 to $149,999 income range, which is the most common income bracket and makes up 39.0% of all families.
| Income Bracket | # Families | % Families |
| Less than $10,000 | 0 | 0.0% |
| $10,000 to $14,999 | 6 | 1.5% |
| $15,000 to $24,999 | 5 | 1.3% |
| $25,000 to $34,999 | 14 | 3.6% |
| $35,000 to $49,999 | 17 | 4.4% |
| $50,000 to $74,999 | 92 | 23.6% |
| $75,000 to $99,999 | 78 | 20.0% |
| $100,000 to $149,999 | 152 | 39.0% |
| $150,000 to $199,999 | 14 | 3.6% |
| $200,000+ | 12 | 3.1% |
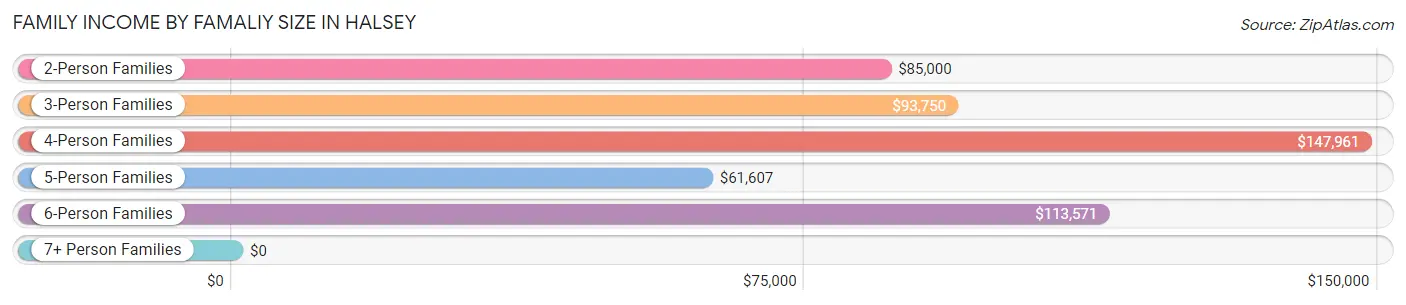
Family Income by Famaliy Size in Halsey
4-person families (90 | 23.1%) account for the highest median family income in Halsey with $147,961 per family, while 2-person families (184 | 47.2%) have the highest median income of $42,500 per family member.
| Income Bracket | # Families | Median Income |
| 2-Person Families | 184 (47.2%) | $85,000 |
| 3-Person Families | 52 (13.3%) | $93,750 |
| 4-Person Families | 90 (23.1%) | $147,961 |
| 5-Person Families | 47 (12.0%) | $61,607 |
| 6-Person Families | 10 (2.6%) | $113,571 |
| 7+ Person Families | 7 (1.8%) | $0 |
| Total | 390 (100.0%) | $94,375 |
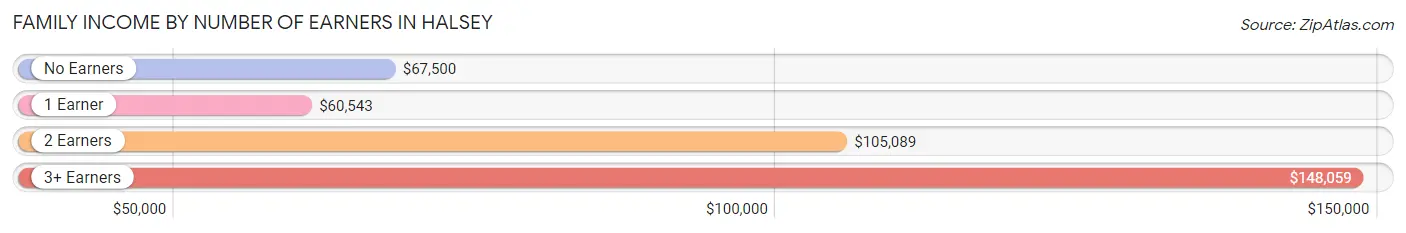
Family Income by Number of Earners in Halsey
The median family income in Halsey is $94,375, with families comprising 3+ earners (81) having the highest median family income of $148,059, while families with 1 earner (96) have the lowest median family income of $60,543, accounting for 20.8% and 24.6% of families, respectively.
| Number of Earners | # Families | Median Income |
| No Earners | 34 (8.7%) | $67,500 |
| 1 Earner | 96 (24.6%) | $60,543 |
| 2 Earners | 179 (45.9%) | $105,089 |
| 3+ Earners | 81 (20.8%) | $148,059 |
| Total | 390 (100.0%) | $94,375 |
Household Income in Halsey
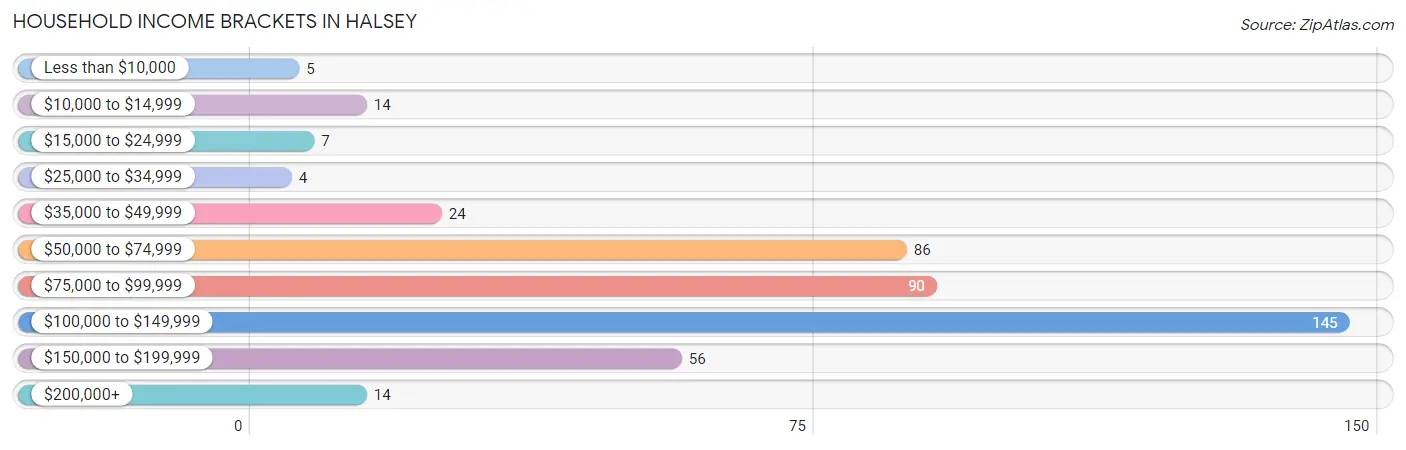
Household Income Brackets in Halsey
With 145 households falling in the category, the $100,000 to $149,999 income range is the most frequent in Halsey, accounting for 32.6% of all households. In contrast, only 4 households (0.9%) fall into the $25,000 to $34,999 income bracket, making it the least populous group.
| Income Bracket | # Households | % Households |
| Less than $10,000 | 5 | 1.1% |
| $10,000 to $14,999 | 14 | 3.1% |
| $15,000 to $24,999 | 7 | 1.6% |
| $25,000 to $34,999 | 4 | 0.9% |
| $35,000 to $49,999 | 24 | 5.4% |
| $50,000 to $74,999 | 86 | 19.3% |
| $75,000 to $99,999 | 90 | 20.2% |
| $100,000 to $149,999 | 145 | 32.6% |
| $150,000 to $199,999 | 56 | 12.6% |
| $200,000+ | 14 | 3.1% |
Household Income by Householder Age in Halsey
The median household income in Halsey is $96,250, with the highest median household income of $105,556 found in the 45 to 64 years age bracket for the primary householder. A total of 182 households (40.9%) fall into this category. Meanwhile, the 15 to 24 years age bracket for the primary householder has the lowest median household income of $0, with 3 households (0.7%) in this group.
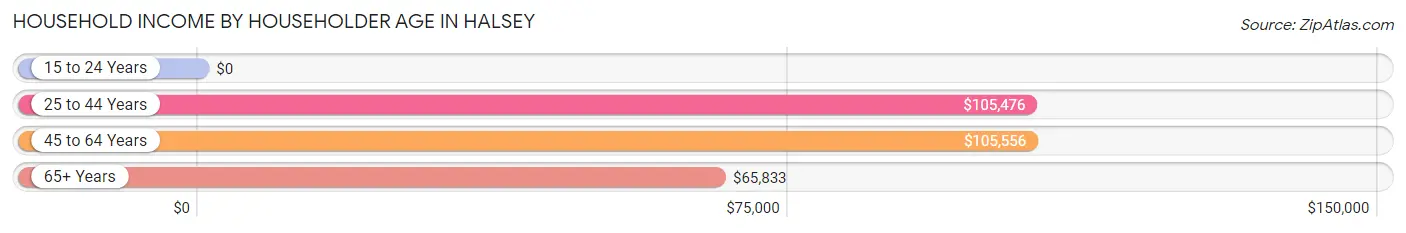
| Income Bracket | # Households | Median Income |
| 15 to 24 Years | 3 (0.7%) | $0 |
| 25 to 44 Years | 192 (43.1%) | $105,476 |
| 45 to 64 Years | 182 (40.9%) | $105,556 |
| 65+ Years | 68 (15.3%) | $65,833 |
| Total | 445 (100.0%) | $96,250 |
Poverty in Halsey
Income Below Poverty by Sex and Age in Halsey
With 5.7% poverty level for males and 10.9% for females among the residents of Halsey, under 5 year old males and 15 year old females are the most vulnerable to poverty, with 12 males (27.9%) and 7 females (58.3%) in their respective age groups living below the poverty level.
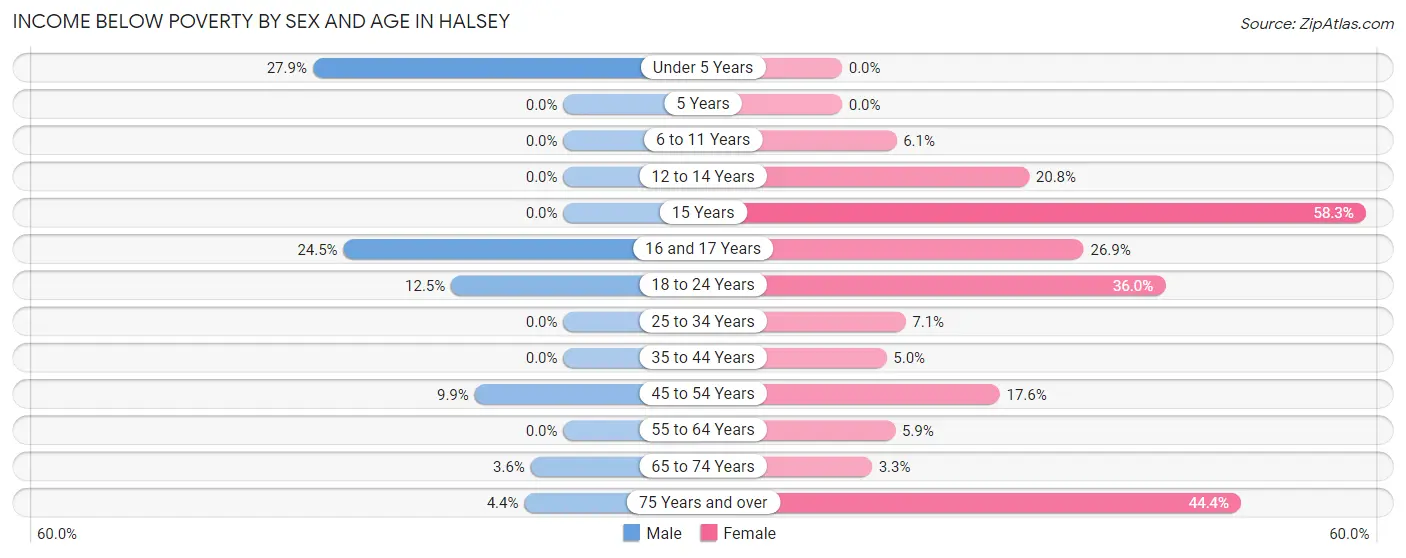
| Age Bracket | Male | Female |
| Under 5 Years | 12 (27.9%) | 0 (0.0%) |
| 5 Years | 0 (0.0%) | 0 (0.0%) |
| 6 to 11 Years | 0 (0.0%) | 2 (6.1%) |
| 12 to 14 Years | 0 (0.0%) | 5 (20.8%) |
| 15 Years | 0 (0.0%) | 7 (58.3%) |
| 16 and 17 Years | 12 (24.5%) | 7 (26.9%) |
| 18 to 24 Years | 4 (12.5%) | 9 (36.0%) |
| 25 to 34 Years | 0 (0.0%) | 8 (7.1%) |
| 35 to 44 Years | 0 (0.0%) | 6 (5.0%) |
| 45 to 54 Years | 8 (9.9%) | 13 (17.6%) |
| 55 to 64 Years | 0 (0.0%) | 10 (5.9%) |
| 65 to 74 Years | 2 (3.6%) | 2 (3.3%) |
| 75 Years and over | 1 (4.3%) | 8 (44.4%) |
| Total | 39 (5.7%) | 77 (10.9%) |
Income Above Poverty by Sex and Age in Halsey
According to the poverty statistics in Halsey, males aged 5 years and females aged under 5 years are the age groups that are most secure financially, with 100.0% of males and 100.0% of females in these age groups living above the poverty line.
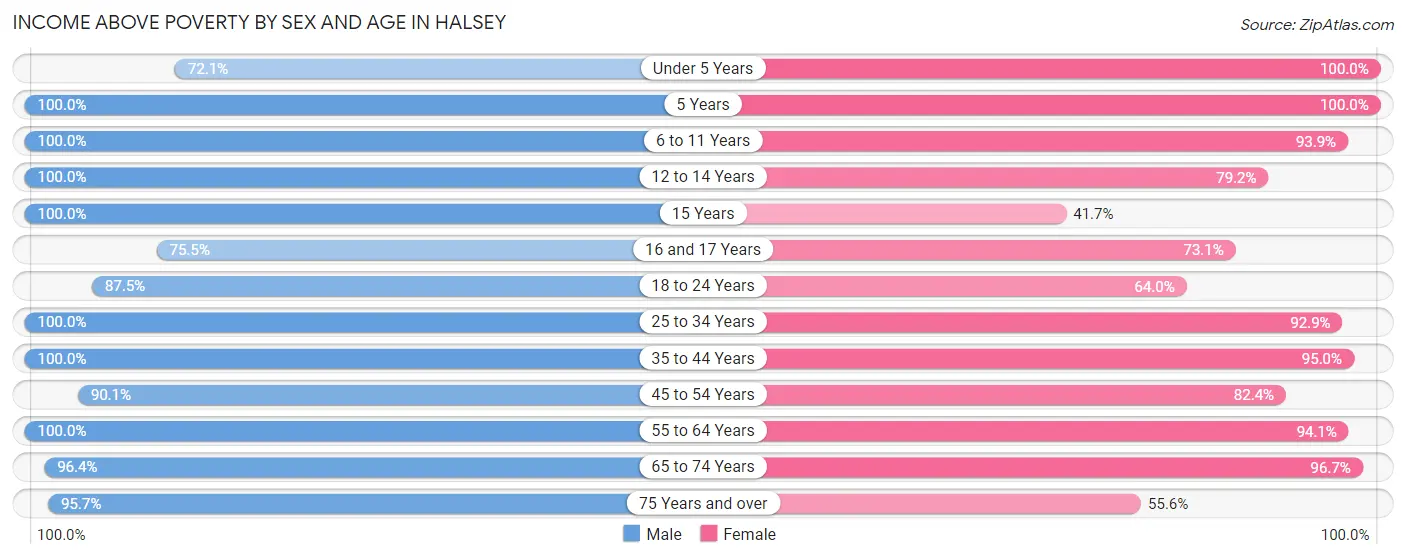
| Age Bracket | Male | Female |
| Under 5 Years | 31 (72.1%) | 30 (100.0%) |
| 5 Years | 3 (100.0%) | 4 (100.0%) |
| 6 to 11 Years | 84 (100.0%) | 31 (93.9%) |
| 12 to 14 Years | 12 (100.0%) | 19 (79.2%) |
| 15 Years | 13 (100.0%) | 5 (41.7%) |
| 16 and 17 Years | 37 (75.5%) | 19 (73.1%) |
| 18 to 24 Years | 28 (87.5%) | 16 (64.0%) |
| 25 to 34 Years | 106 (100.0%) | 105 (92.9%) |
| 35 to 44 Years | 129 (100.0%) | 115 (95.0%) |
| 45 to 54 Years | 73 (90.1%) | 61 (82.4%) |
| 55 to 64 Years | 51 (100.0%) | 159 (94.1%) |
| 65 to 74 Years | 53 (96.4%) | 58 (96.7%) |
| 75 Years and over | 22 (95.7%) | 10 (55.6%) |
| Total | 642 (94.3%) | 632 (89.1%) |
Income Below Poverty Among Married-Couple Families in Halsey
The poverty statistics for married-couple families in Halsey show that 3.0% or 8 of the total 268 families live below the poverty line. Families with no children have the highest poverty rate of 3.9%, comprising of 6 families. On the other hand, families with 3 or 4 children have the lowest poverty rate of 0.0%, which includes 0 families.
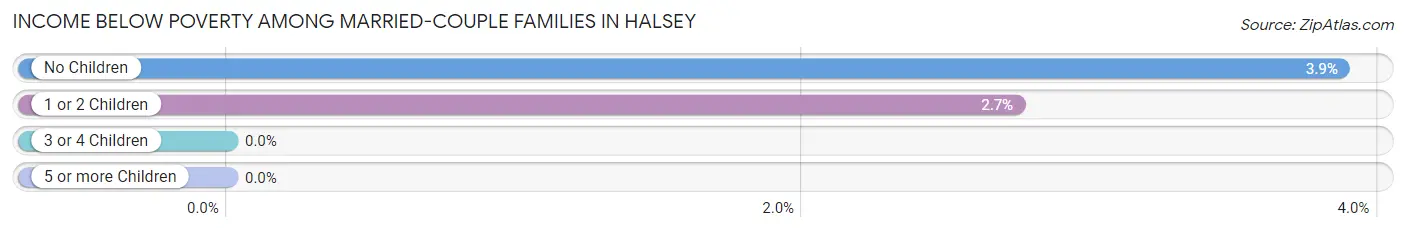
| Children | Above Poverty | Below Poverty |
| No Children | 149 (96.1%) | 6 (3.9%) |
| 1 or 2 Children | 71 (97.3%) | 2 (2.7%) |
| 3 or 4 Children | 33 (100.0%) | 0 (0.0%) |
| 5 or more Children | 7 (100.0%) | 0 (0.0%) |
| Total | 260 (97.0%) | 8 (3.0%) |
Income Below Poverty Among Single-Parent Households in Halsey
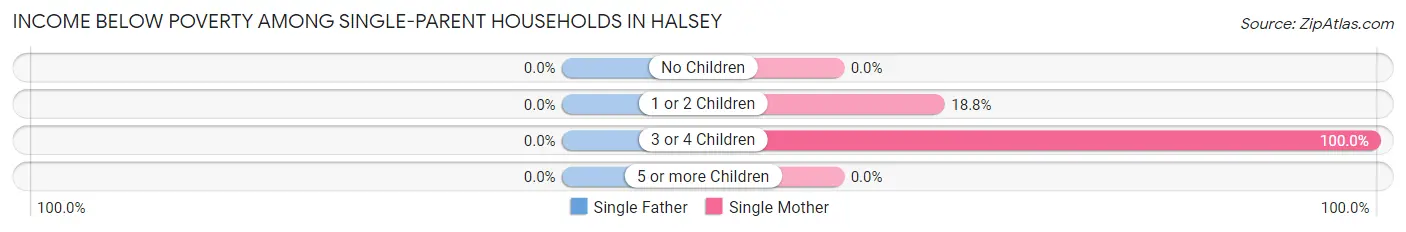
| Children | Single Father | Single Mother |
| No Children | 0 (0.0%) | 0 (0.0%) |
| 1 or 2 Children | 0 (0.0%) | 6 (18.8%) |
| 3 or 4 Children | 0 (0.0%) | 4 (100.0%) |
| 5 or more Children | 0 (0.0%) | 0 (0.0%) |
| Total | 0 (0.0%) | 10 (9.1%) |
Income Below Poverty Among Married-Couple vs Single-Parent Households in Halsey
The poverty data for Halsey shows that 8 of the married-couple family households (3.0%) and 10 of the single-parent households (8.2%) are living below the poverty level. Within the married-couple family households, those with no children have the highest poverty rate, with 6 households (3.9%) falling below the poverty line. Among the single-parent households, those with 3 or 4 children have the highest poverty rate, with 4 household (40.0%) living below poverty.
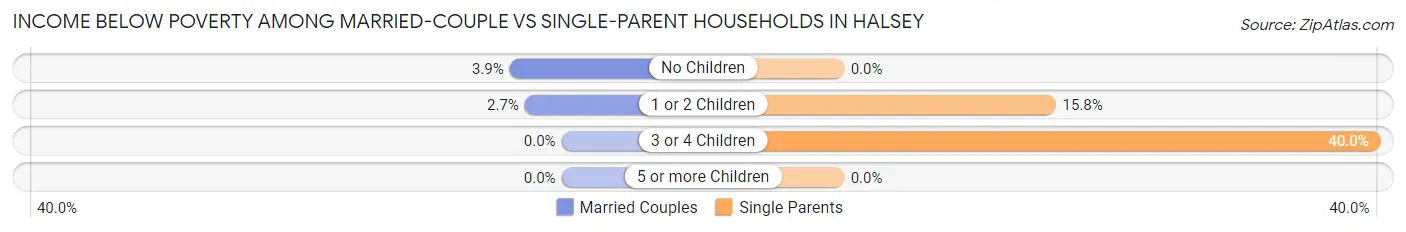
| Children | Married-Couple Families | Single-Parent Households |
| No Children | 6 (3.9%) | 0 (0.0%) |
| 1 or 2 Children | 2 (2.7%) | 6 (15.8%) |
| 3 or 4 Children | 0 (0.0%) | 4 (40.0%) |
| 5 or more Children | 0 (0.0%) | 0 (0.0%) |
| Total | 8 (3.0%) | 10 (8.2%) |
Race in Halsey
The most populous races in Halsey are White / Caucasian (1,131 | 79.7%), Hispanic or Latino (209 | 14.7%), and Two or more Races (159 | 11.2%).
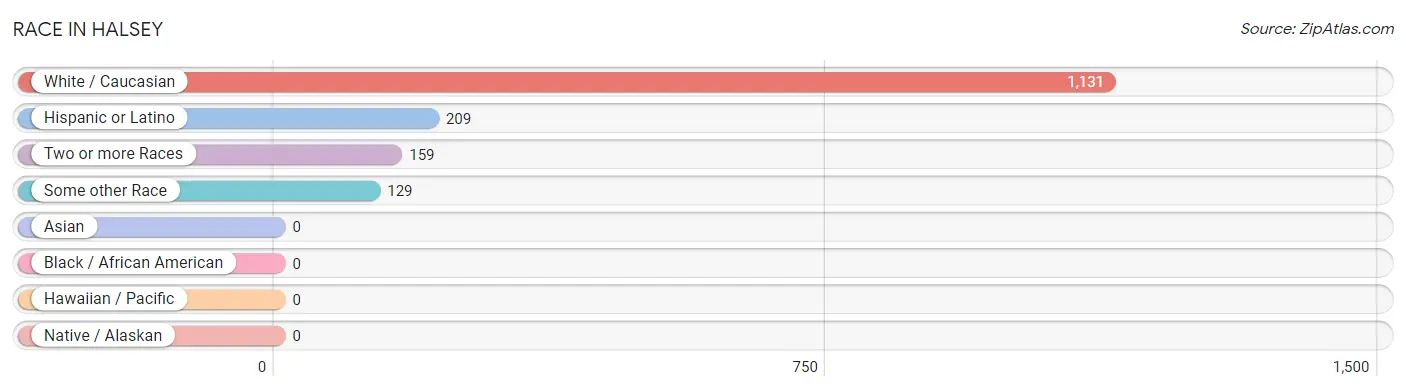
| Race | # Population | % Population |
| Asian | 0 | 0.0% |
| Black / African American | 0 | 0.0% |
| Hawaiian / Pacific | 0 | 0.0% |
| Hispanic or Latino | 209 | 14.7% |
| Native / Alaskan | 0 | 0.0% |
| White / Caucasian | 1,131 | 79.7% |
| Two or more Races | 159 | 11.2% |
| Some other Race | 129 | 9.1% |
| Total | 1,419 | 100.0% |
Ancestry in Halsey
The most populous ancestries reported in Halsey are German (333 | 23.5%), Irish (293 | 20.6%), Italian (197 | 13.9%), Mexican (184 | 13.0%), and American (84 | 5.9%), together accounting for 76.9% of all Halsey residents.
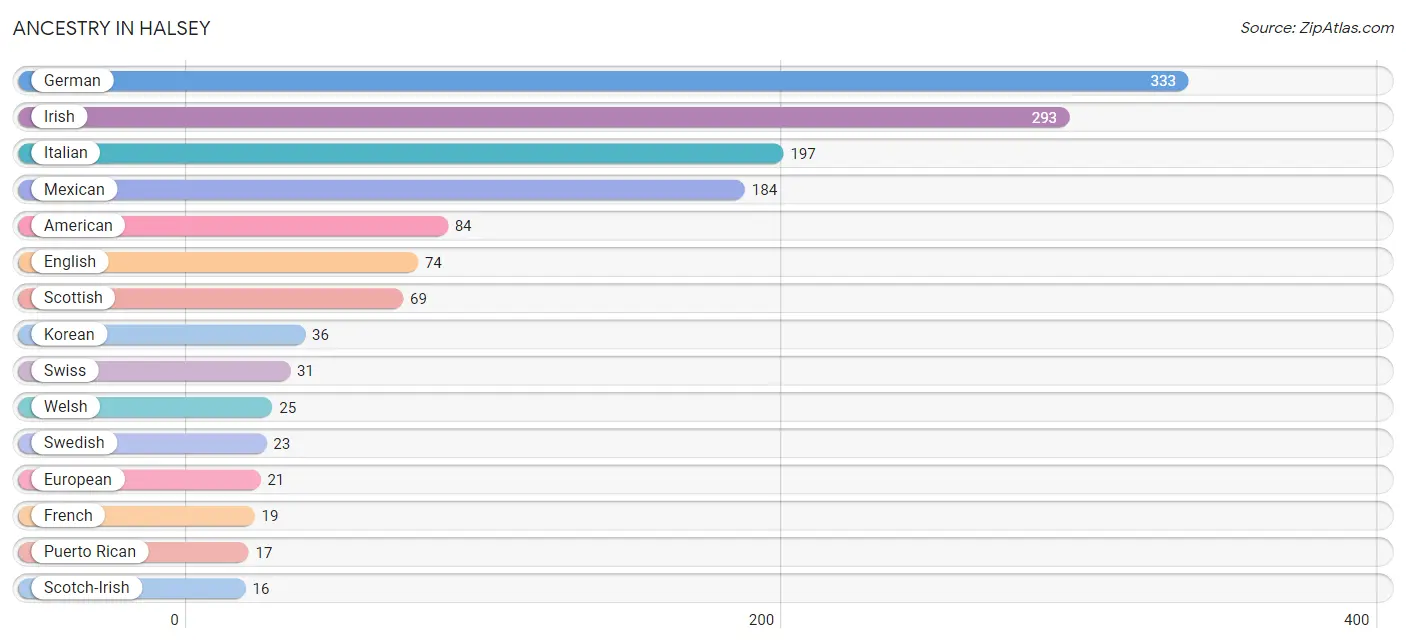
| Ancestry | # Population | % Population |
| American | 84 | 5.9% |
| Arab | 5 | 0.4% |
| Bhutanese | 12 | 0.9% |
| British | 2 | 0.1% |
| Celtic | 1 | 0.1% |
| Cherokee | 7 | 0.5% |
| Danish | 15 | 1.1% |
| Dutch | 13 | 0.9% |
| English | 74 | 5.2% |
| European | 21 | 1.5% |
| French | 19 | 1.3% |
| French Canadian | 7 | 0.5% |
| German | 333 | 23.5% |
| Hungarian | 2 | 0.1% |
| Irish | 293 | 20.6% |
| Italian | 197 | 13.9% |
| Korean | 36 | 2.5% |
| Lebanese | 2 | 0.1% |
| Mexican | 184 | 13.0% |
| Norwegian | 14 | 1.0% |
| Polish | 11 | 0.8% |
| Puerto Rican | 17 | 1.2% |
| Russian | 4 | 0.3% |
| Scotch-Irish | 16 | 1.1% |
| Scottish | 69 | 4.9% |
| Sioux | 2 | 0.1% |
| Spanish | 8 | 0.6% |
| Swedish | 23 | 1.6% |
| Swiss | 31 | 2.2% |
| Syrian | 3 | 0.2% |
| Turkish | 6 | 0.4% |
| Welsh | 25 | 1.8% |
| Yugoslavian | 4 | 0.3% | View All 33 Rows |
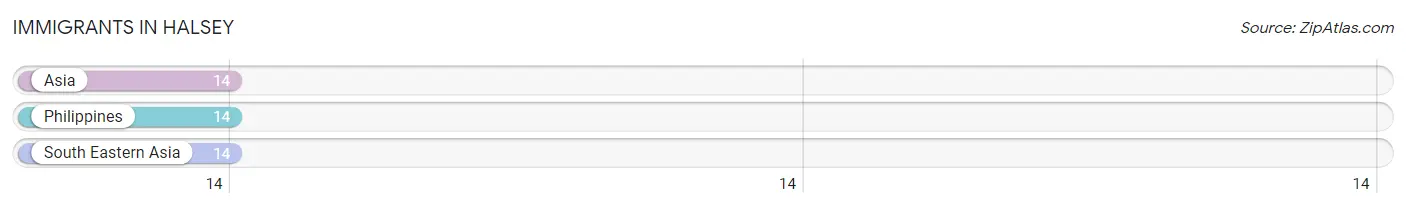
Immigrants in Halsey
The most numerous immigrant groups reported in Halsey came from Asia (14 | 1.0%), Philippines (14 | 1.0%), and South Eastern Asia (14 | 1.0%), together accounting for 3.0% of all Halsey residents.
| Immigration Origin | # Population | % Population |
| Asia | 14 | 1.0% |
| Philippines | 14 | 1.0% |
| South Eastern Asia | 14 | 1.0% | View All 3 Rows |
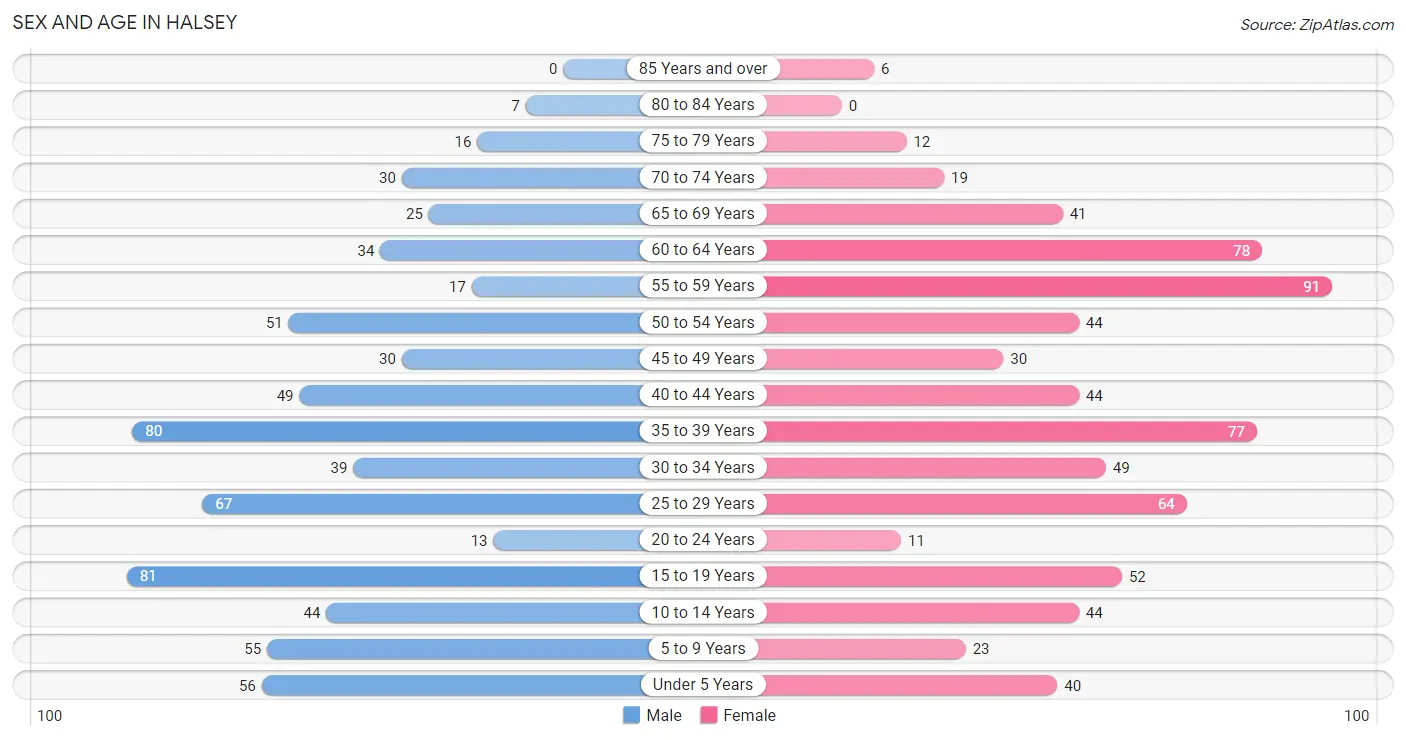
Sex and Age in Halsey
Sex and Age in Halsey
The most populous age groups in Halsey are 15 to 19 Years (81 | 11.7%) for men and 55 to 59 Years (91 | 12.6%) for women.
| Age Bracket | Male | Female |
| Under 5 Years | 56 (8.1%) | 40 (5.5%) |
| 5 to 9 Years | 55 (7.9%) | 23 (3.2%) |
| 10 to 14 Years | 44 (6.3%) | 44 (6.1%) |
| 15 to 19 Years | 81 (11.7%) | 52 (7.2%) |
| 20 to 24 Years | 13 (1.9%) | 11 (1.5%) |
| 25 to 29 Years | 67 (9.7%) | 64 (8.8%) |
| 30 to 34 Years | 39 (5.6%) | 49 (6.8%) |
| 35 to 39 Years | 80 (11.5%) | 77 (10.6%) |
| 40 to 44 Years | 49 (7.1%) | 44 (6.1%) |
| 45 to 49 Years | 30 (4.3%) | 30 (4.1%) |
| 50 to 54 Years | 51 (7.3%) | 44 (6.1%) |
| 55 to 59 Years | 17 (2.5%) | 91 (12.6%) |
| 60 to 64 Years | 34 (4.9%) | 78 (10.8%) |
| 65 to 69 Years | 25 (3.6%) | 41 (5.7%) |
| 70 to 74 Years | 30 (4.3%) | 19 (2.6%) |
| 75 to 79 Years | 16 (2.3%) | 12 (1.7%) |
| 80 to 84 Years | 7 (1.0%) | 0 (0.0%) |
| 85 Years and over | 0 (0.0%) | 6 (0.8%) |
| Total | 694 (100.0%) | 725 (100.0%) |
Families and Households in Halsey
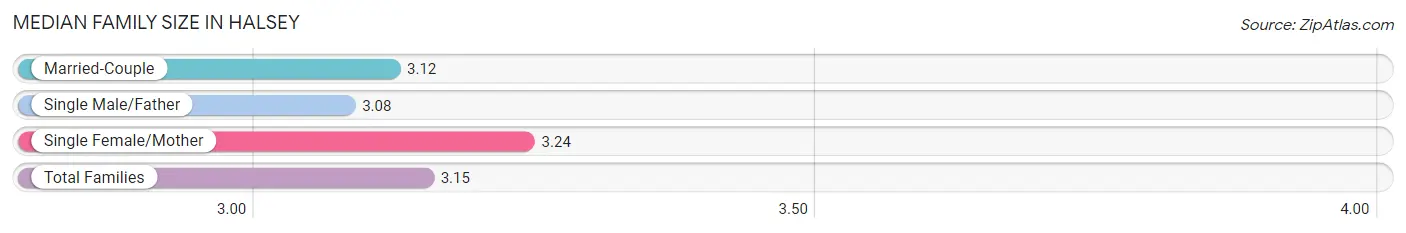
Median Family Size in Halsey
The median family size in Halsey is 3.15 persons per family, with single female/mother families (110 | 28.2%) accounting for the largest median family size of 3.24 persons per family. On the other hand, single male/father families (12 | 3.1%) represent the smallest median family size with 3.08 persons per family.
| Family Type | # Families | Family Size |
| Married-Couple | 268 (68.7%) | 3.12 |
| Single Male/Father | 12 (3.1%) | 3.08 |
| Single Female/Mother | 110 (28.2%) | 3.24 |
| Total Families | 390 (100.0%) | 3.15 |
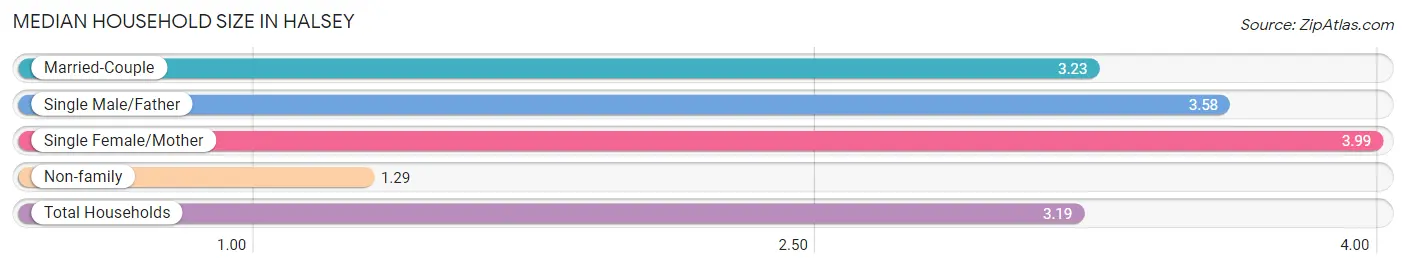
Median Household Size in Halsey
The median household size in Halsey is 3.19 persons per household, with single female/mother households (110 | 24.7%) accounting for the largest median household size of 3.99 persons per household. non-family households (55 | 12.4%) represent the smallest median household size with 1.29 persons per household.
| Household Type | # Households | Household Size |
| Married-Couple | 268 (60.2%) | 3.23 |
| Single Male/Father | 12 (2.7%) | 3.58 |
| Single Female/Mother | 110 (24.7%) | 3.99 |
| Non-family | 55 (12.4%) | 1.29 |
| Total Households | 445 (100.0%) | 3.19 |
Household Size by Marriage Status in Halsey
Out of a total of 445 households in Halsey, 390 (87.6%) are family households, while 55 (12.4%) are nonfamily households. The most numerous type of family households are 2-person households, comprising 164, and the most common type of nonfamily households are 1-person households, comprising 41.
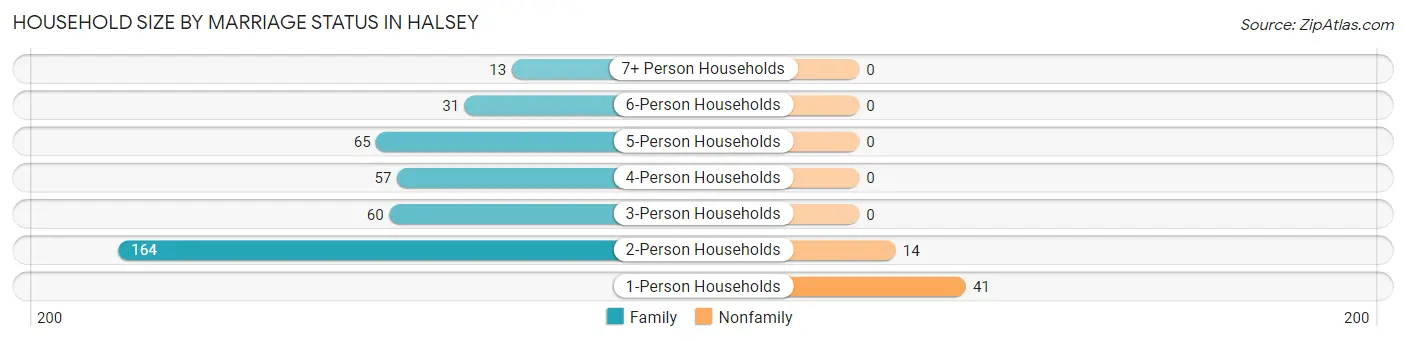
| Household Size | Family Households | Nonfamily Households |
| 1-Person Households | - | 41 (9.2%) |
| 2-Person Households | 164 (36.8%) | 14 (3.2%) |
| 3-Person Households | 60 (13.5%) | 0 (0.0%) |
| 4-Person Households | 57 (12.8%) | 0 (0.0%) |
| 5-Person Households | 65 (14.6%) | 0 (0.0%) |
| 6-Person Households | 31 (7.0%) | 0 (0.0%) |
| 7+ Person Households | 13 (2.9%) | 0 (0.0%) |
| Total | 390 (87.6%) | 55 (12.4%) |
Female Fertility in Halsey
Fertility by Age in Halsey
Average fertility rate in Halsey is 35.0 births per 1,000 women. Women in the age bracket of 20 to 34 years have the highest fertility rate with 97.0 births per 1,000 women. Women in the age bracket of 20 to 34 years acount for 100.0% of all women with births.
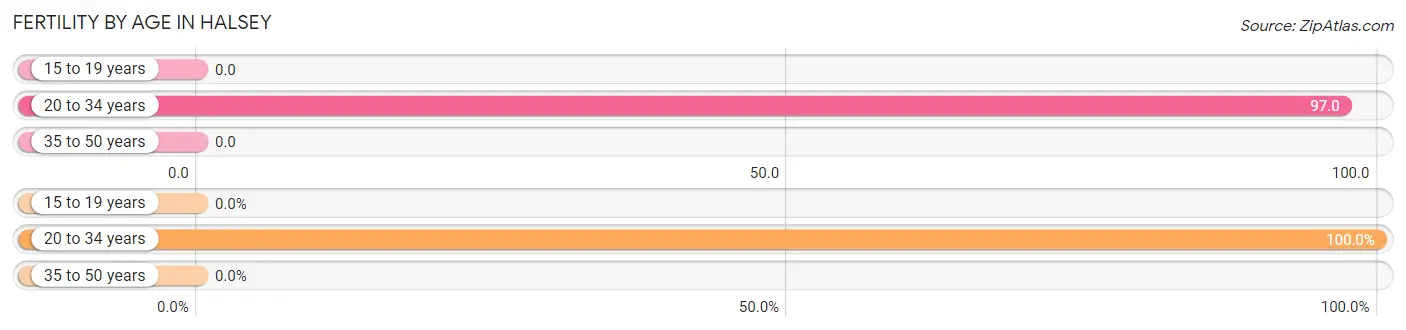
| Age Bracket | Women with Births | Births / 1,000 Women |
| 15 to 19 years | 0 (0.0%) | 0.0 |
| 20 to 34 years | 12 (100.0%) | 97.0 |
| 35 to 50 years | 0 (0.0%) | 0.0 |
| Total | 12 (100.0%) | 35.0 |
Fertility by Age by Marriage Status in Halsey
66.7% of women with births (12) in Halsey are married. The highest percentage of unmarried women with births falls into 20 to 34 years age bracket with 33.3% of them unmarried at the time of birth, while the lowest percentage of unmarried women with births belong to 20 to 34 years age bracket with 33.3% of them unmarried.
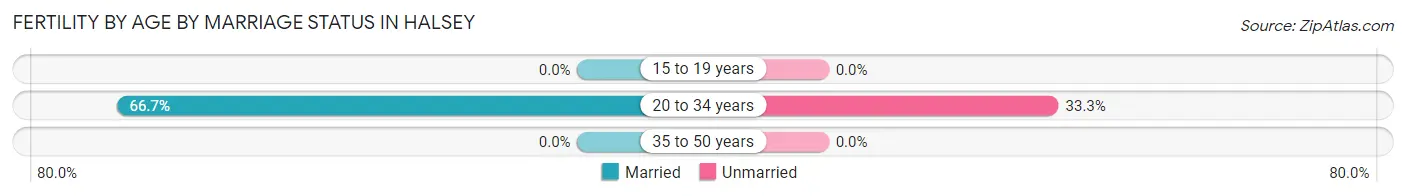
| Age Bracket | Married | Unmarried |
| 15 to 19 years | 0 (0.0%) | 0 (0.0%) |
| 20 to 34 years | 8 (66.7%) | 4 (33.3%) |
| 35 to 50 years | 0 (0.0%) | 0 (0.0%) |
| Total | 8 (66.7%) | 4 (33.3%) |
Fertility by Education in Halsey
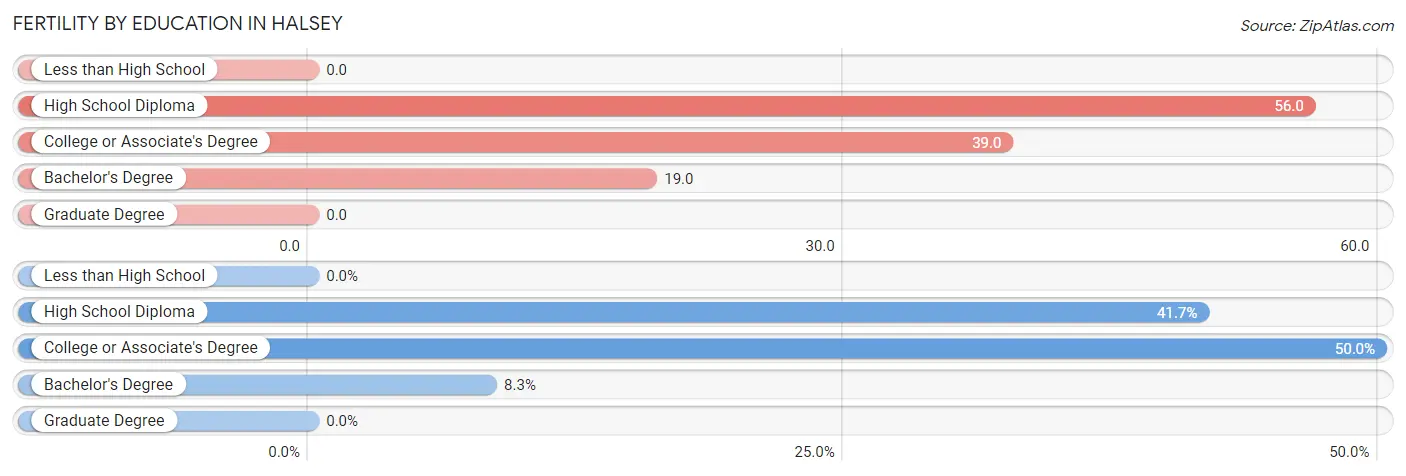
| Educational Attainment | Women with Births | Births / 1,000 Women |
| Less than High School | 0 (0.0%) | 0.0 |
| High School Diploma | 5 (41.7%) | 56.0 |
| College or Associate's Degree | 6 (50.0%) | 39.0 |
| Bachelor's Degree | 1 (8.3%) | 19.0 |
| Graduate Degree | 0 (0.0%) | 0.0 |
| Total | 12 (100.0%) | 35.0 |
Fertility by Education by Marriage Status in Halsey
33.3% of women with births in Halsey are unmarried. Women with the educational attainment of college or associate's degree are most likely to be married with 100.0% of them married at childbirth, while women with the educational attainment of high school diploma are least likely to be married with 80.0% of them unmarried at childbirth.
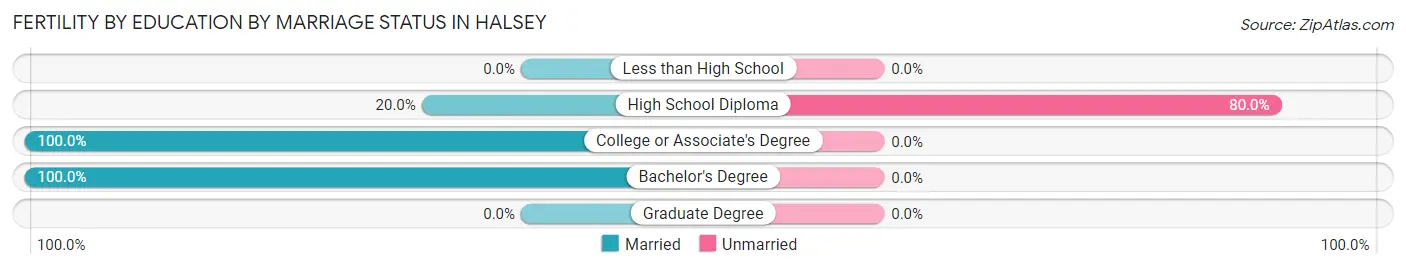
| Educational Attainment | Married | Unmarried |
| Less than High School | 0 (0.0%) | 0 (0.0%) |
| High School Diploma | 1 (20.0%) | 4 (80.0%) |
| College or Associate's Degree | 6 (100.0%) | 0 (0.0%) |
| Bachelor's Degree | 1 (100.0%) | 0 (0.0%) |
| Graduate Degree | 0 (0.0%) | 0 (0.0%) |
| Total | 8 (66.7%) | 4 (33.3%) |
Employment Characteristics in Halsey
Employment by Class of Employer in Halsey
Among the 753 employed individuals in Halsey, private company employees (515 | 68.4%), not-for-profit organizations (120 | 15.9%), and state government employees (47 | 6.2%) make up the most common classes of employment.
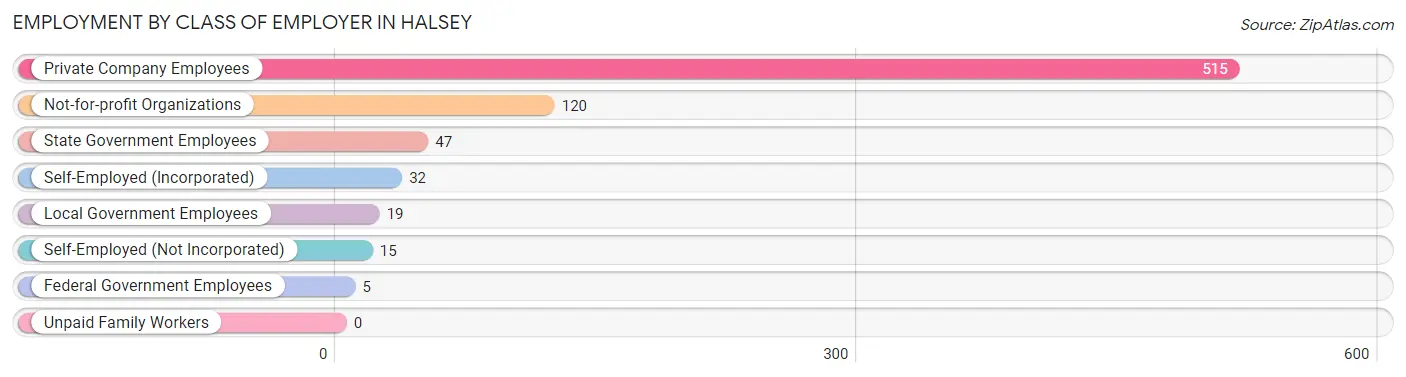
| Employer Class | # Employees | % Employees |
| Private Company Employees | 515 | 68.4% |
| Self-Employed (Incorporated) | 32 | 4.3% |
| Self-Employed (Not Incorporated) | 15 | 2.0% |
| Not-for-profit Organizations | 120 | 15.9% |
| Local Government Employees | 19 | 2.5% |
| State Government Employees | 47 | 6.2% |
| Federal Government Employees | 5 | 0.7% |
| Unpaid Family Workers | 0 | 0.0% |
| Total | 753 | 100.0% |
Employment Status by Age in Halsey
According to the labor force statistics for Halsey, out of the total population over 16 years of age (1,132), 71.0% or 804 individuals are in the labor force, with 5.3% or 43 of them unemployed. The age group with the highest labor force participation rate is 25 to 29 years, with 97.7% or 128 individuals in the labor force. Within the labor force, the 16 to 19 years age range has the highest percentage of unemployed individuals, with 24.4% or 10 of them being unemployed.
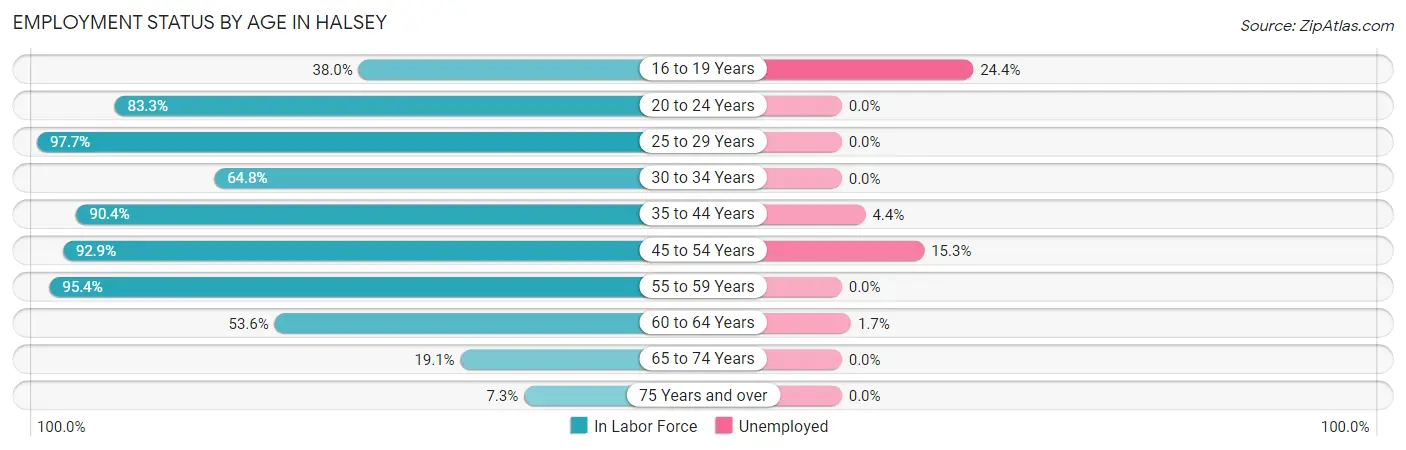
| Age Bracket | In Labor Force | Unemployed |
| 16 to 19 Years | 41 (38.0%) | 10 (24.4%) |
| 20 to 24 Years | 20 (83.3%) | 0 (0.0%) |
| 25 to 29 Years | 128 (97.7%) | 0 (0.0%) |
| 30 to 34 Years | 57 (64.8%) | 0 (0.0%) |
| 35 to 44 Years | 226 (90.4%) | 10 (4.4%) |
| 45 to 54 Years | 144 (92.9%) | 22 (15.3%) |
| 55 to 59 Years | 103 (95.4%) | 0 (0.0%) |
| 60 to 64 Years | 60 (53.6%) | 1 (1.7%) |
| 65 to 74 Years | 22 (19.1%) | 0 (0.0%) |
| 75 Years and over | 3 (7.3%) | 0 (0.0%) |
| Total | 804 (71.0%) | 43 (5.3%) |
Employment Status by Educational Attainment in Halsey
According to labor force statistics for Halsey, 85.1% of individuals (718) out of the total population between 25 and 64 years of age (844) are in the labor force, with 4.6% or 33 of them being unemployed. The group with the highest labor force participation rate are those with the educational attainment of less than high school, with 97.0% or 32 individuals in the labor force. Within the labor force, individuals with college / associate degree education have the highest percentage of unemployment, with 6.2% or 22 of them being unemployed.
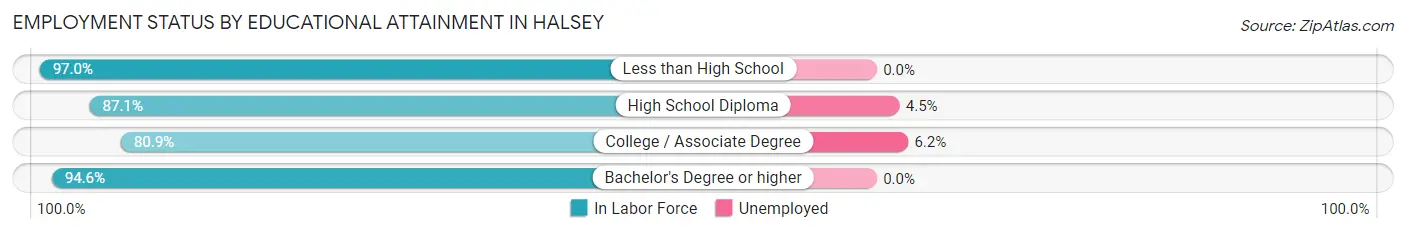
| Educational Attainment | In Labor Force | Unemployed |
| Less than High School | 32 (97.0%) | 0 (0.0%) |
| High School Diploma | 243 (87.1%) | 13 (4.5%) |
| College / Associate Degree | 356 (80.9%) | 27 (6.2%) |
| Bachelor's Degree or higher | 87 (94.6%) | 0 (0.0%) |
| Total | 718 (85.1%) | 39 (4.6%) |
Employment Occupations by Sex in Halsey
Management, Business, Science and Arts Occupations
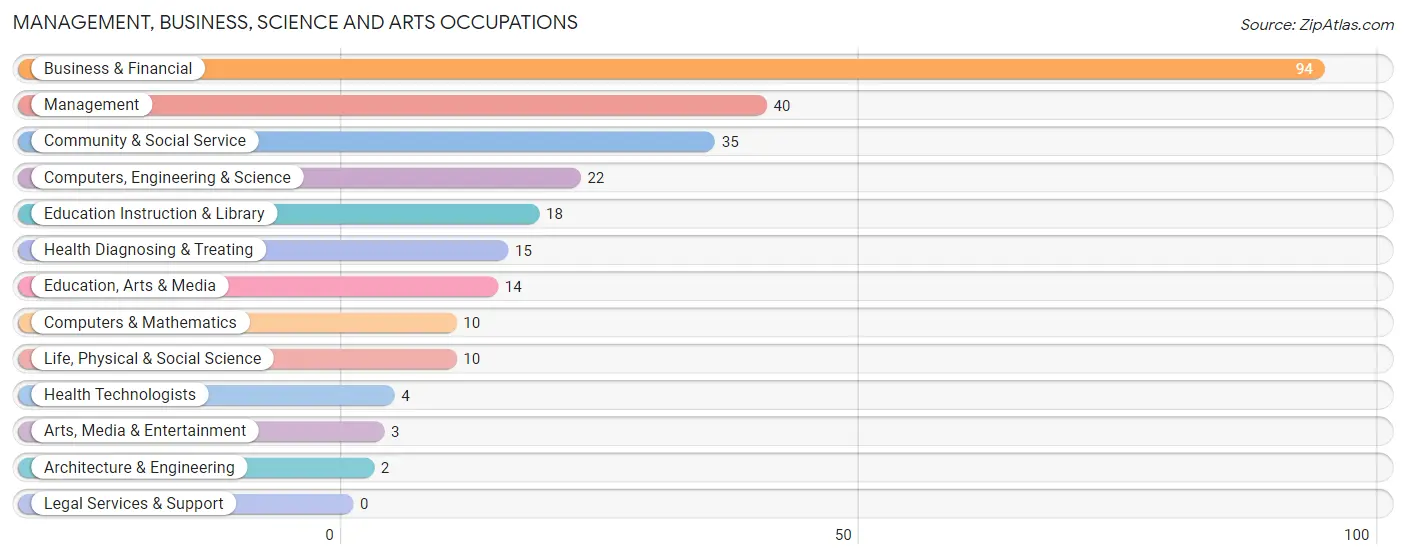
The most common Management, Business, Science and Arts occupations in Halsey are Business & Financial (94 | 12.3%), Management (40 | 5.3%), Community & Social Service (35 | 4.6%), Computers, Engineering & Science (22 | 2.9%), and Education Instruction & Library (18 | 2.4%).
Management, Business, Science and Arts Occupations by Sex
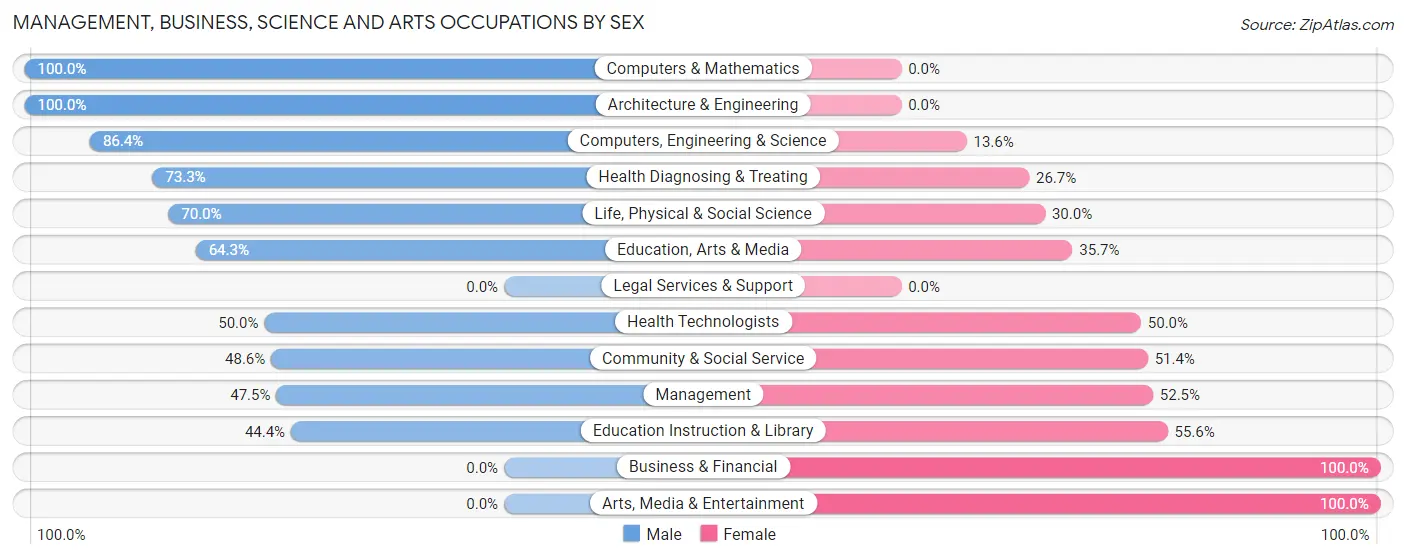
Within the Management, Business, Science and Arts occupations in Halsey, the most male-oriented occupations are Computers & Mathematics (100.0%), Architecture & Engineering (100.0%), and Computers, Engineering & Science (86.4%), while the most female-oriented occupations are Business & Financial (100.0%), Arts, Media & Entertainment (100.0%), and Education Instruction & Library (55.6%).
| Occupation | Male | Female |
| Management | 19 (47.5%) | 21 (52.5%) |
| Business & Financial | 0 (0.0%) | 94 (100.0%) |
| Computers, Engineering & Science | 19 (86.4%) | 3 (13.6%) |
| Computers & Mathematics | 10 (100.0%) | 0 (0.0%) |
| Architecture & Engineering | 2 (100.0%) | 0 (0.0%) |
| Life, Physical & Social Science | 7 (70.0%) | 3 (30.0%) |
| Community & Social Service | 17 (48.6%) | 18 (51.4%) |
| Education, Arts & Media | 9 (64.3%) | 5 (35.7%) |
| Legal Services & Support | 0 (0.0%) | 0 (0.0%) |
| Education Instruction & Library | 8 (44.4%) | 10 (55.6%) |
| Arts, Media & Entertainment | 0 (0.0%) | 3 (100.0%) |
| Health Diagnosing & Treating | 11 (73.3%) | 4 (26.7%) |
| Health Technologists | 2 (50.0%) | 2 (50.0%) |
| Total (Category) | 66 (32.0%) | 140 (68.0%) |
| Total (Overall) | 357 (46.9%) | 404 (53.1%) |
Services Occupations
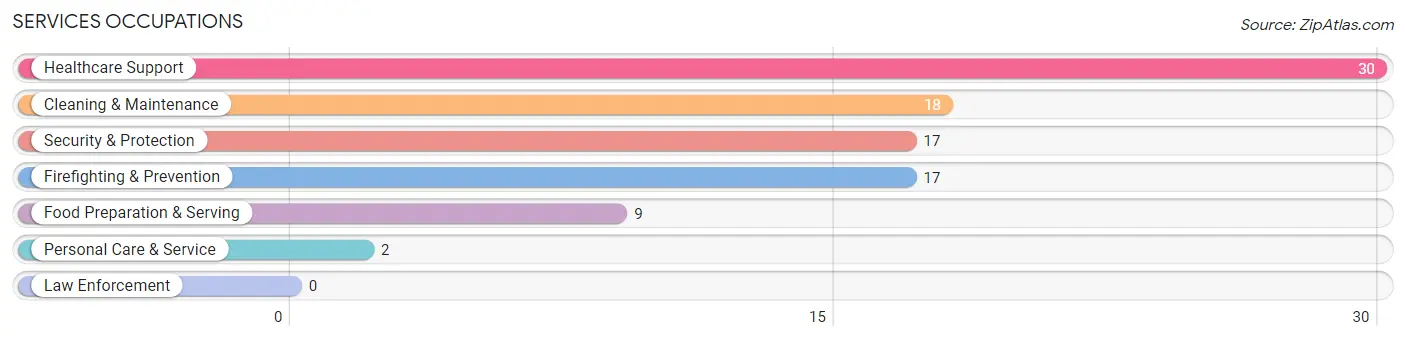
The most common Services occupations in Halsey are Healthcare Support (30 | 3.9%), Cleaning & Maintenance (18 | 2.4%), Security & Protection (17 | 2.2%), Firefighting & Prevention (17 | 2.2%), and Food Preparation & Serving (9 | 1.2%).
Services Occupations by Sex
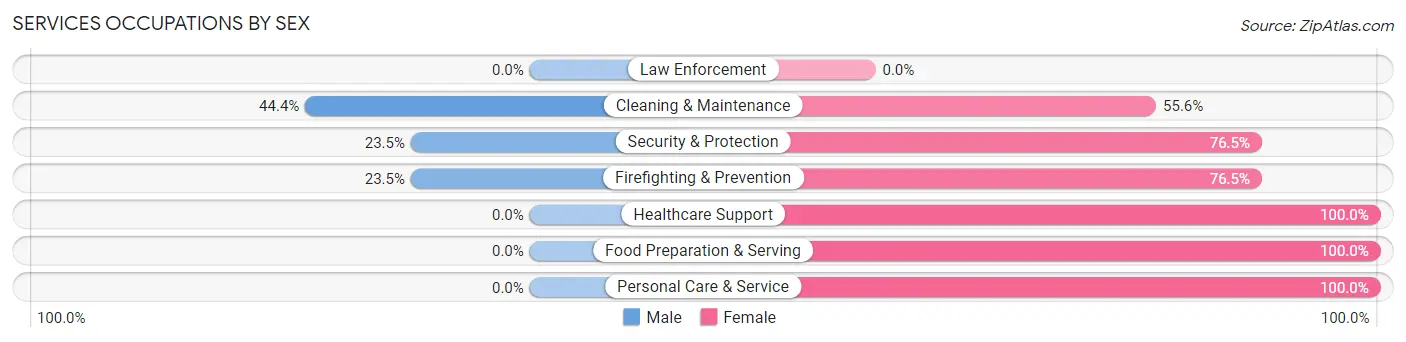
Within the Services occupations in Halsey, the most male-oriented occupations are Cleaning & Maintenance (44.4%), Security & Protection (23.5%), and Firefighting & Prevention (23.5%), while the most female-oriented occupations are Healthcare Support (100.0%), Food Preparation & Serving (100.0%), and Personal Care & Service (100.0%).
| Occupation | Male | Female |
| Healthcare Support | 0 (0.0%) | 30 (100.0%) |
| Security & Protection | 4 (23.5%) | 13 (76.5%) |
| Firefighting & Prevention | 4 (23.5%) | 13 (76.5%) |
| Law Enforcement | 0 (0.0%) | 0 (0.0%) |
| Food Preparation & Serving | 0 (0.0%) | 9 (100.0%) |
| Cleaning & Maintenance | 8 (44.4%) | 10 (55.6%) |
| Personal Care & Service | 0 (0.0%) | 2 (100.0%) |
| Total (Category) | 12 (15.8%) | 64 (84.2%) |
| Total (Overall) | 357 (46.9%) | 404 (53.1%) |
Sales and Office Occupations
The most common Sales and Office occupations in Halsey are Office & Administration (100 | 13.1%), and Sales & Related (71 | 9.3%).
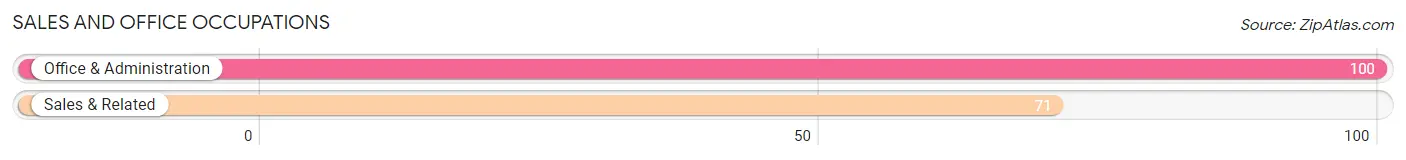
Sales and Office Occupations by Sex
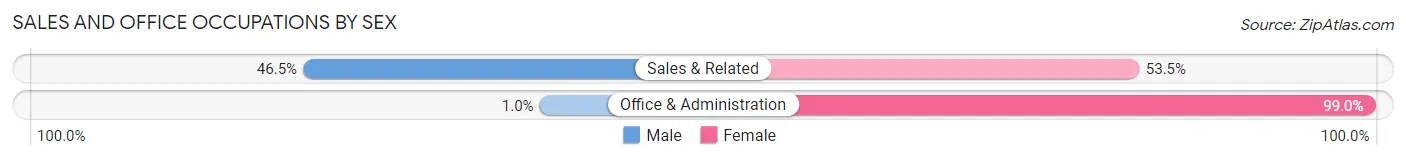
| Occupation | Male | Female |
| Sales & Related | 33 (46.5%) | 38 (53.5%) |
| Office & Administration | 1 (1.0%) | 99 (99.0%) |
| Total (Category) | 34 (19.9%) | 137 (80.1%) |
| Total (Overall) | 357 (46.9%) | 404 (53.1%) |
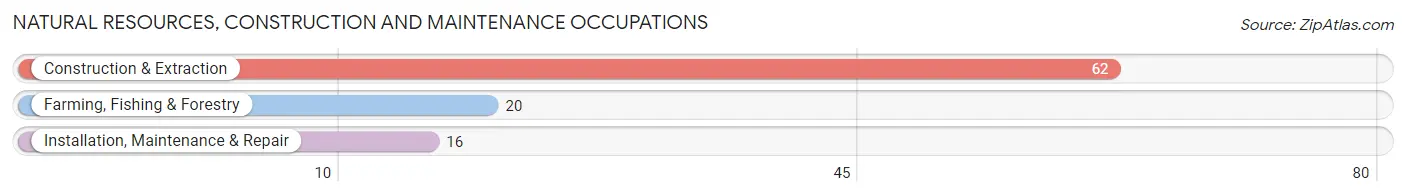
Natural Resources, Construction and Maintenance Occupations
The most common Natural Resources, Construction and Maintenance occupations in Halsey are Construction & Extraction (62 | 8.2%), Farming, Fishing & Forestry (20 | 2.6%), and Installation, Maintenance & Repair (16 | 2.1%).
Natural Resources, Construction and Maintenance Occupations by Sex
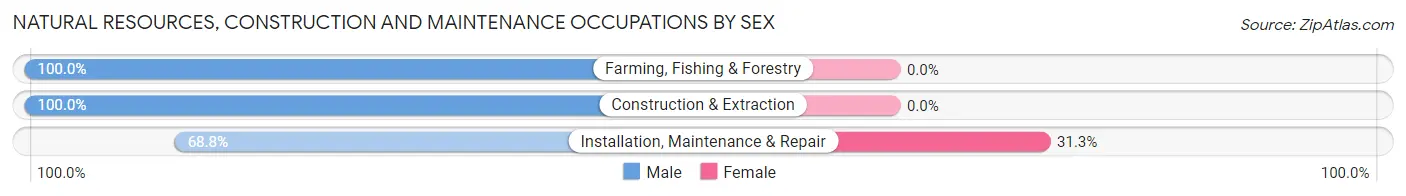
| Occupation | Male | Female |
| Farming, Fishing & Forestry | 20 (100.0%) | 0 (0.0%) |
| Construction & Extraction | 62 (100.0%) | 0 (0.0%) |
| Installation, Maintenance & Repair | 11 (68.8%) | 5 (31.2%) |
| Total (Category) | 93 (94.9%) | 5 (5.1%) |
| Total (Overall) | 357 (46.9%) | 404 (53.1%) |
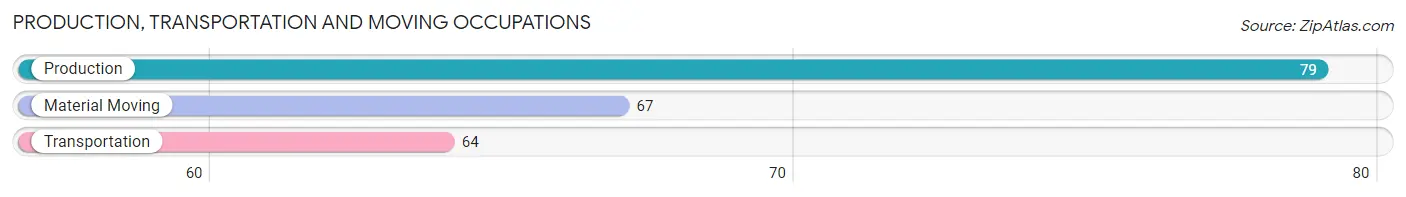
Production, Transportation and Moving Occupations
The most common Production, Transportation and Moving occupations in Halsey are Production (79 | 10.4%), Material Moving (67 | 8.8%), and Transportation (64 | 8.4%).
Production, Transportation and Moving Occupations by Sex
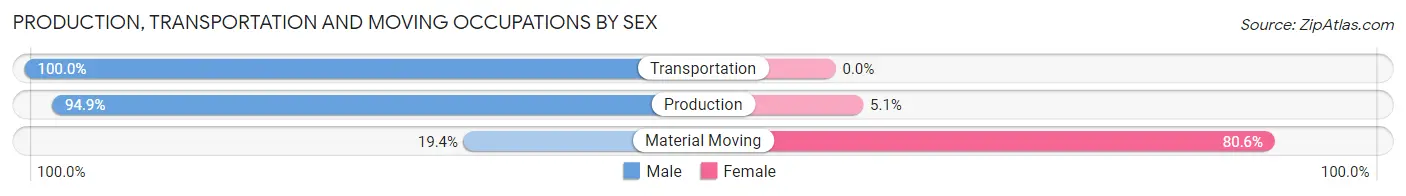
| Occupation | Male | Female |
| Production | 75 (94.9%) | 4 (5.1%) |
| Transportation | 64 (100.0%) | 0 (0.0%) |
| Material Moving | 13 (19.4%) | 54 (80.6%) |
| Total (Category) | 152 (72.4%) | 58 (27.6%) |
| Total (Overall) | 357 (46.9%) | 404 (53.1%) |
Employment Industries by Sex in Halsey
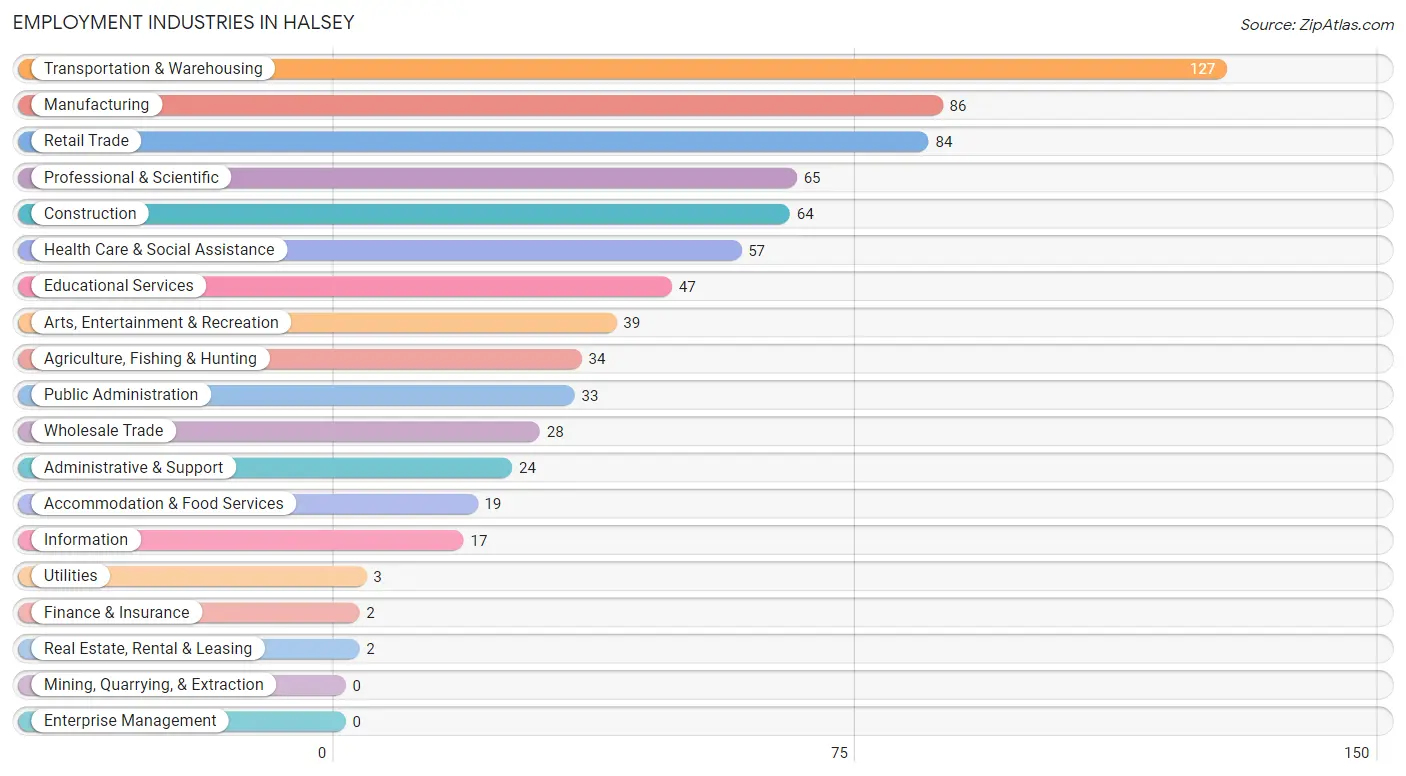
Employment Industries in Halsey
The major employment industries in Halsey include Transportation & Warehousing (127 | 16.7%), Manufacturing (86 | 11.3%), Retail Trade (84 | 11.0%), Professional & Scientific (65 | 8.5%), and Construction (64 | 8.4%).
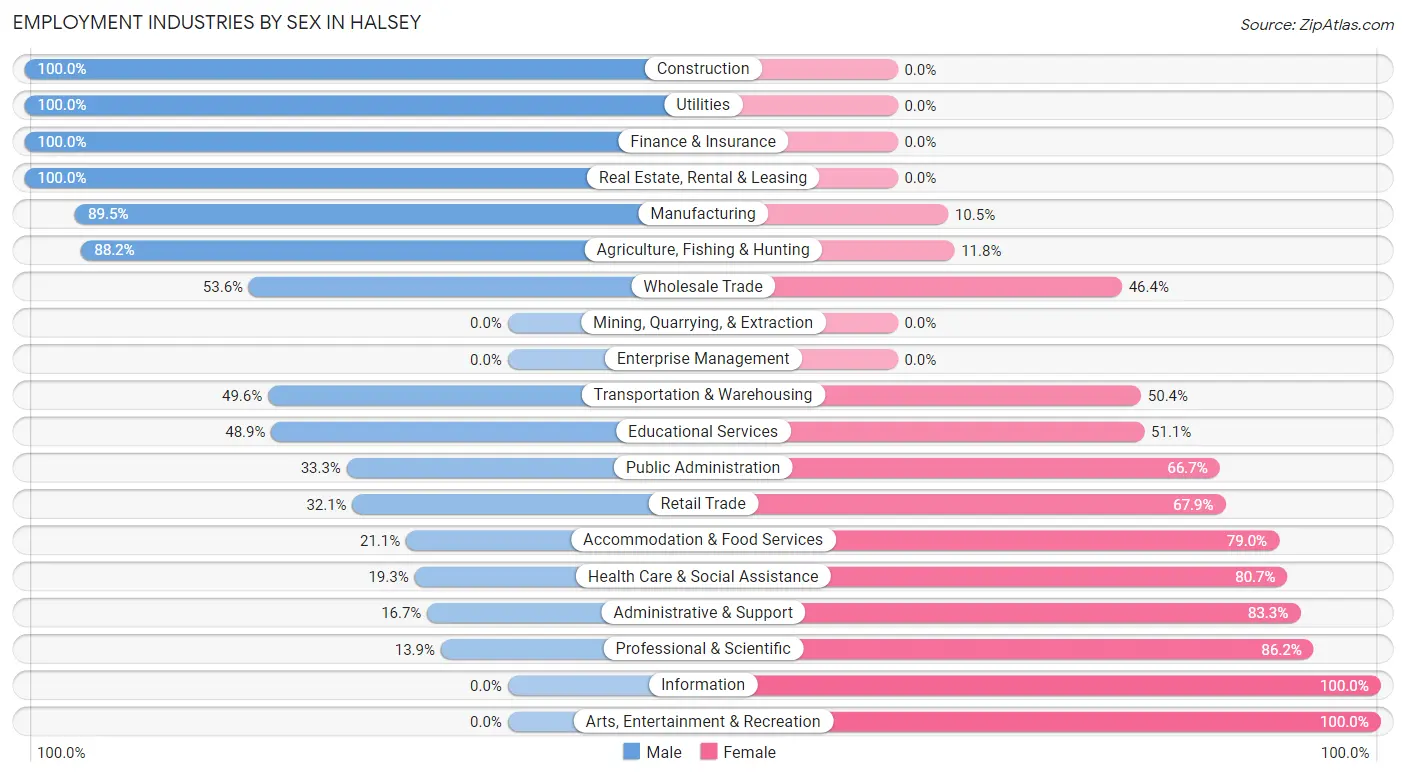
Employment Industries by Sex in Halsey
The Halsey industries that see more men than women are Construction (100.0%), Utilities (100.0%), and Finance & Insurance (100.0%), whereas the industries that tend to have a higher number of women are Information (100.0%), Arts, Entertainment & Recreation (100.0%), and Professional & Scientific (86.2%).
| Industry | Male | Female |
| Agriculture, Fishing & Hunting | 30 (88.2%) | 4 (11.8%) |
| Mining, Quarrying, & Extraction | 0 (0.0%) | 0 (0.0%) |
| Construction | 64 (100.0%) | 0 (0.0%) |
| Manufacturing | 77 (89.5%) | 9 (10.5%) |
| Wholesale Trade | 15 (53.6%) | 13 (46.4%) |
| Retail Trade | 27 (32.1%) | 57 (67.9%) |
| Transportation & Warehousing | 63 (49.6%) | 64 (50.4%) |
| Utilities | 3 (100.0%) | 0 (0.0%) |
| Information | 0 (0.0%) | 17 (100.0%) |
| Finance & Insurance | 2 (100.0%) | 0 (0.0%) |
| Real Estate, Rental & Leasing | 2 (100.0%) | 0 (0.0%) |
| Professional & Scientific | 9 (13.9%) | 56 (86.2%) |
| Enterprise Management | 0 (0.0%) | 0 (0.0%) |
| Administrative & Support | 4 (16.7%) | 20 (83.3%) |
| Educational Services | 23 (48.9%) | 24 (51.1%) |
| Health Care & Social Assistance | 11 (19.3%) | 46 (80.7%) |
| Arts, Entertainment & Recreation | 0 (0.0%) | 39 (100.0%) |
| Accommodation & Food Services | 4 (21.0%) | 15 (78.9%) |
| Public Administration | 11 (33.3%) | 22 (66.7%) |
| Total | 357 (46.9%) | 404 (53.1%) |
Education in Halsey
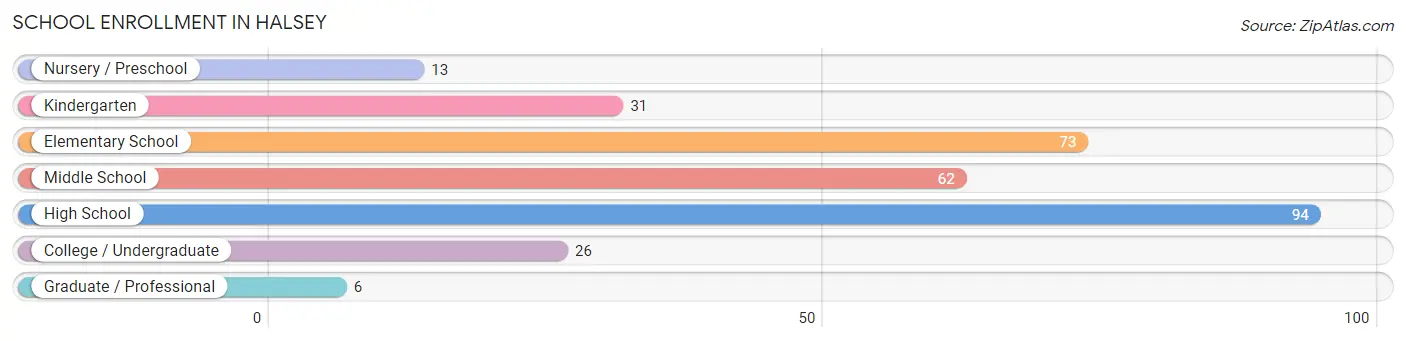
School Enrollment in Halsey
The most common levels of schooling among the 305 students in Halsey are high school (94 | 30.8%), elementary school (73 | 23.9%), and middle school (62 | 20.3%).
| School Level | # Students | % Students |
| Nursery / Preschool | 13 | 4.3% |
| Kindergarten | 31 | 10.2% |
| Elementary School | 73 | 23.9% |
| Middle School | 62 | 20.3% |
| High School | 94 | 30.8% |
| College / Undergraduate | 26 | 8.5% |
| Graduate / Professional | 6 | 2.0% |
| Total | 305 | 100.0% |
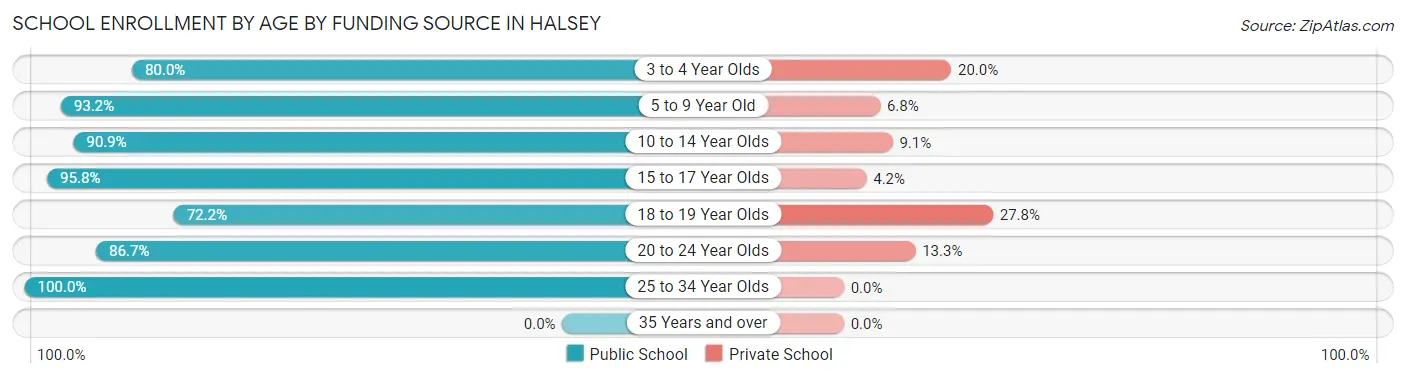
School Enrollment by Age by Funding Source in Halsey
Out of a total of 305 students who are enrolled in schools in Halsey, 26 (8.5%) attend a private institution, while the remaining 279 (91.5%) are enrolled in public schools. The age group of 18 to 19 year olds has the highest likelihood of being enrolled in private schools, with 5 (27.8% in the age bracket) enrolled. Conversely, the age group of 25 to 34 year olds has the lowest likelihood of being enrolled in a private school, with 5 (100.0% in the age bracket) attending a public institution.
| Age Bracket | Public School | Private School |
| 3 to 4 Year Olds | 8 (80.0%) | 2 (20.0%) |
| 5 to 9 Year Old | 69 (93.2%) | 5 (6.8%) |
| 10 to 14 Year Olds | 80 (90.9%) | 8 (9.1%) |
| 15 to 17 Year Olds | 91 (95.8%) | 4 (4.2%) |
| 18 to 19 Year Olds | 13 (72.2%) | 5 (27.8%) |
| 20 to 24 Year Olds | 13 (86.7%) | 2 (13.3%) |
| 25 to 34 Year Olds | 5 (100.0%) | 0 (0.0%) |
| 35 Years and over | 0 (0.0%) | 0 (0.0%) |
| Total | 279 (91.5%) | 26 (8.5%) |
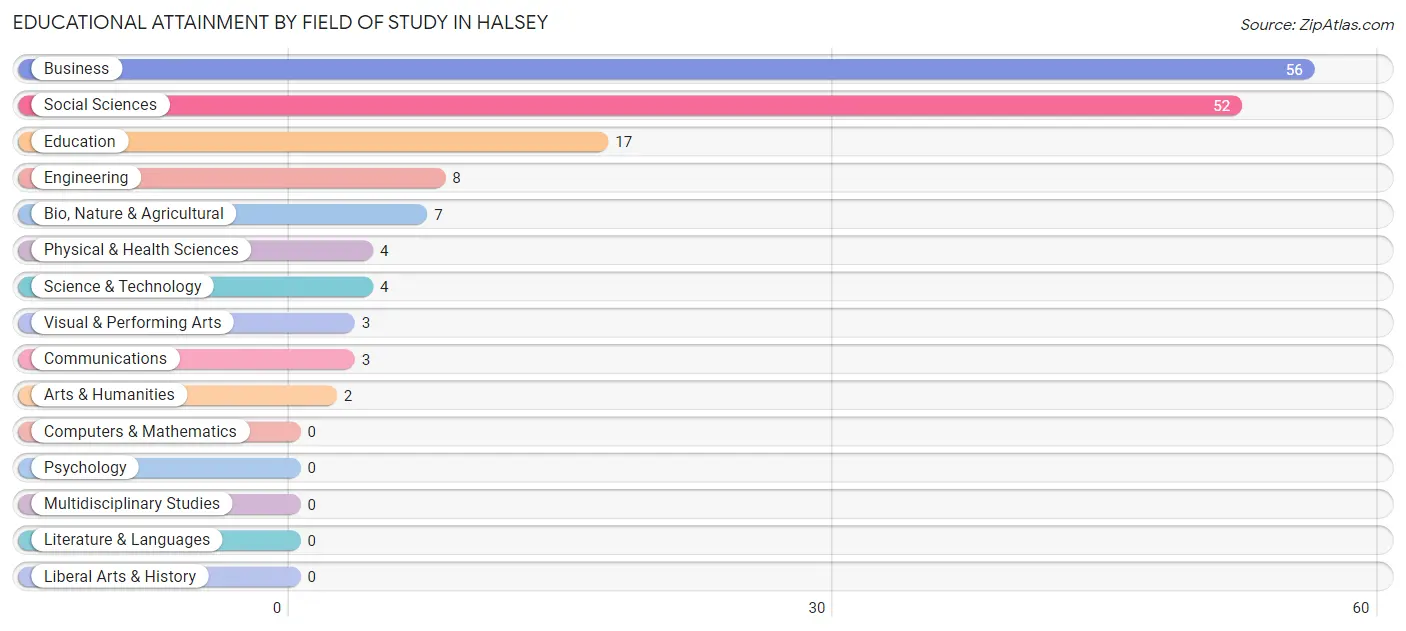
Educational Attainment by Field of Study in Halsey
Business (56 | 35.9%), social sciences (52 | 33.3%), education (17 | 10.9%), engineering (8 | 5.1%), and bio, nature & agricultural (7 | 4.5%) are the most common fields of study among 156 individuals in Halsey who have obtained a bachelor's degree or higher.
| Field of Study | # Graduates | % Graduates |
| Computers & Mathematics | 0 | 0.0% |
| Bio, Nature & Agricultural | 7 | 4.5% |
| Physical & Health Sciences | 4 | 2.6% |
| Psychology | 0 | 0.0% |
| Social Sciences | 52 | 33.3% |
| Engineering | 8 | 5.1% |
| Multidisciplinary Studies | 0 | 0.0% |
| Science & Technology | 4 | 2.6% |
| Business | 56 | 35.9% |
| Education | 17 | 10.9% |
| Literature & Languages | 0 | 0.0% |
| Liberal Arts & History | 0 | 0.0% |
| Visual & Performing Arts | 3 | 1.9% |
| Communications | 3 | 1.9% |
| Arts & Humanities | 2 | 1.3% |
| Total | 156 | 100.0% |
Transportation & Commute in Halsey
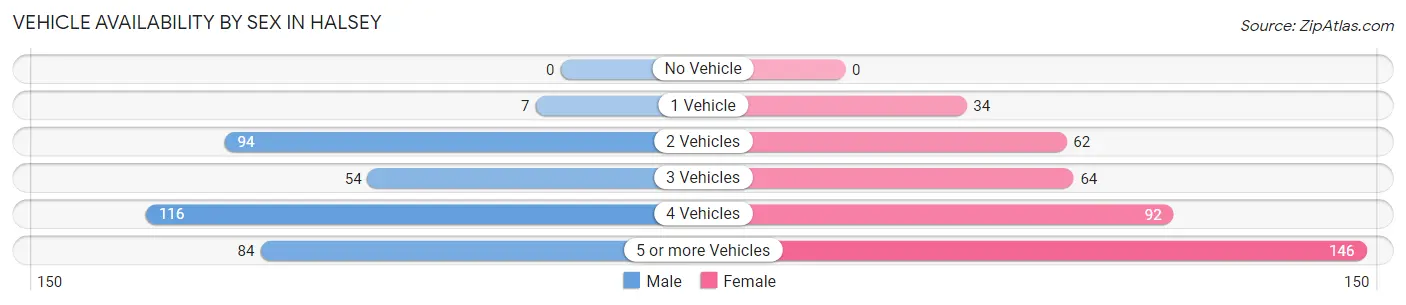
Vehicle Availability by Sex in Halsey
The most prevalent vehicle ownership categories in Halsey are males with 4 vehicles (116, accounting for 32.7%) and females with 4 vehicles (92, making up 29.1%).
| Vehicles Available | Male | Female |
| No Vehicle | 0 (0.0%) | 0 (0.0%) |
| 1 Vehicle | 7 (2.0%) | 34 (8.5%) |
| 2 Vehicles | 94 (26.5%) | 62 (15.6%) |
| 3 Vehicles | 54 (15.2%) | 64 (16.1%) |
| 4 Vehicles | 116 (32.7%) | 92 (23.1%) |
| 5 or more Vehicles | 84 (23.7%) | 146 (36.7%) |
| Total | 355 (100.0%) | 398 (100.0%) |
Commute Time in Halsey
The most frequently occuring commute durations in Halsey are 30 to 34 minutes (221 commuters, 29.9%), 25 to 29 minutes (143 commuters, 19.4%), and 20 to 24 minutes (128 commuters, 17.3%).
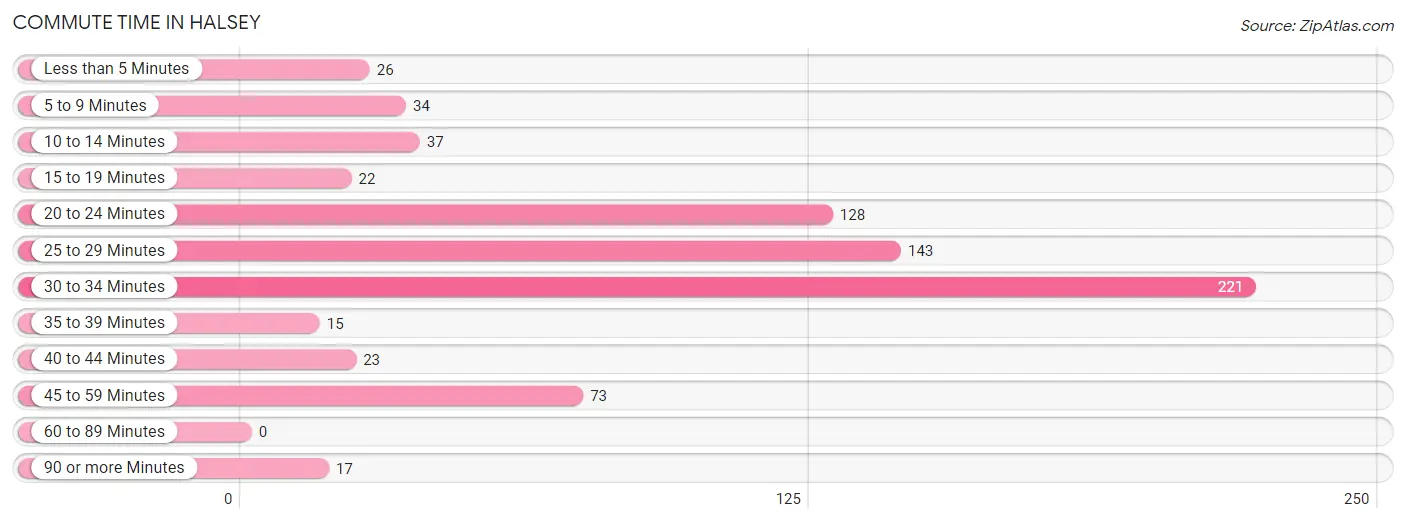
| Commute Time | # Commuters | % Commuters |
| Less than 5 Minutes | 26 | 3.5% |
| 5 to 9 Minutes | 34 | 4.6% |
| 10 to 14 Minutes | 37 | 5.0% |
| 15 to 19 Minutes | 22 | 3.0% |
| 20 to 24 Minutes | 128 | 17.3% |
| 25 to 29 Minutes | 143 | 19.4% |
| 30 to 34 Minutes | 221 | 29.9% |
| 35 to 39 Minutes | 15 | 2.0% |
| 40 to 44 Minutes | 23 | 3.1% |
| 45 to 59 Minutes | 73 | 9.9% |
| 60 to 89 Minutes | 0 | 0.0% |
| 90 or more Minutes | 17 | 2.3% |
Commute Time by Sex in Halsey
The most common commute times in Halsey are 30 to 34 minutes (173 commuters, 49.0%) for males and 25 to 29 minutes (107 commuters, 27.7%) for females.
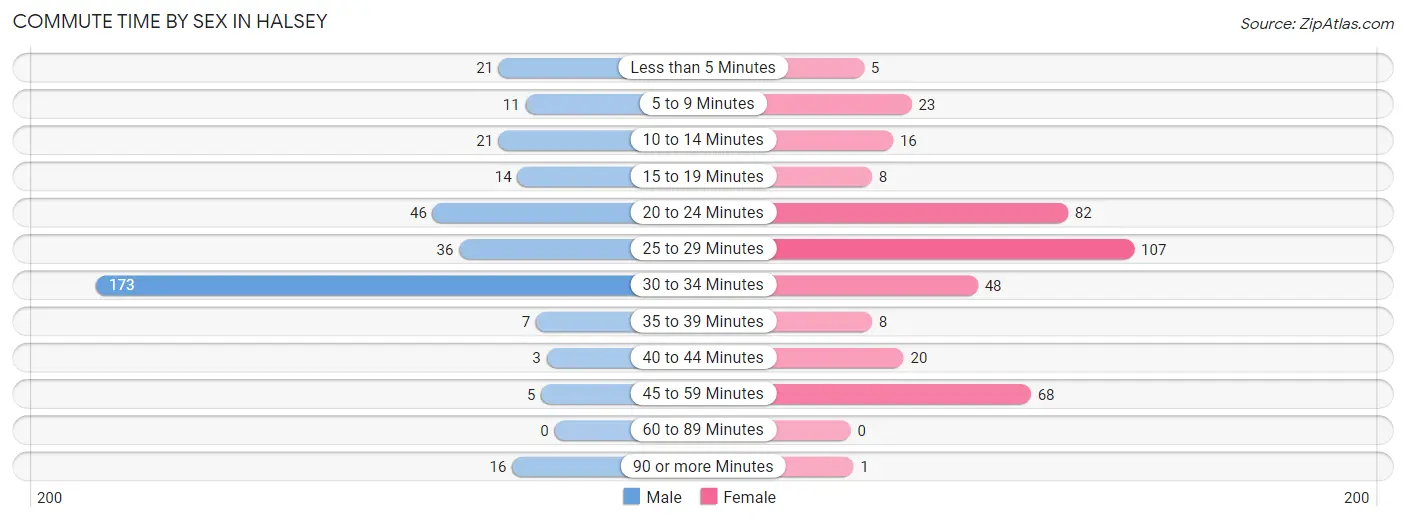
| Commute Time | Male | Female |
| Less than 5 Minutes | 21 (5.9%) | 5 (1.3%) |
| 5 to 9 Minutes | 11 (3.1%) | 23 (6.0%) |
| 10 to 14 Minutes | 21 (5.9%) | 16 (4.2%) |
| 15 to 19 Minutes | 14 (4.0%) | 8 (2.1%) |
| 20 to 24 Minutes | 46 (13.0%) | 82 (21.2%) |
| 25 to 29 Minutes | 36 (10.2%) | 107 (27.7%) |
| 30 to 34 Minutes | 173 (49.0%) | 48 (12.4%) |
| 35 to 39 Minutes | 7 (2.0%) | 8 (2.1%) |
| 40 to 44 Minutes | 3 (0.9%) | 20 (5.2%) |
| 45 to 59 Minutes | 5 (1.4%) | 68 (17.6%) |
| 60 to 89 Minutes | 0 (0.0%) | 0 (0.0%) |
| 90 or more Minutes | 16 (4.5%) | 1 (0.3%) |
Time of Departure to Work by Sex in Halsey
The most frequent times of departure to work in Halsey are 5:00 AM to 5:29 AM (87, 24.6%) for males and 5:30 AM to 5:59 AM (90, 23.3%) for females.
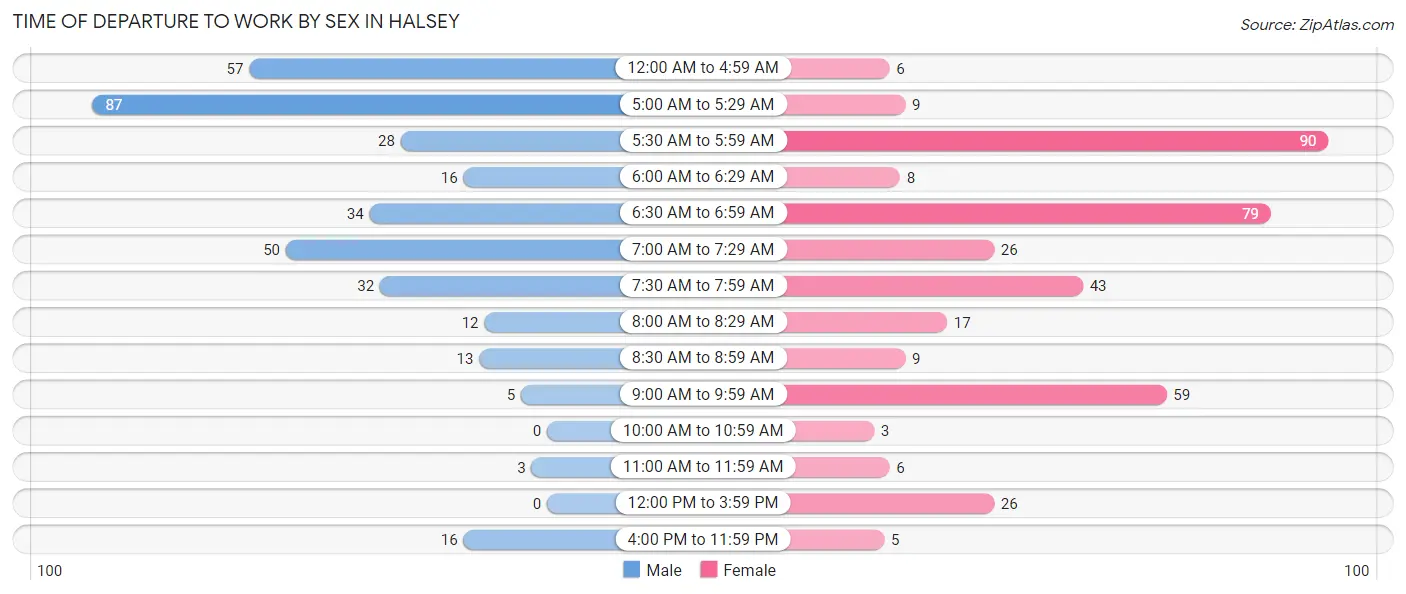
| Time of Departure | Male | Female |
| 12:00 AM to 4:59 AM | 57 (16.2%) | 6 (1.5%) |
| 5:00 AM to 5:29 AM | 87 (24.6%) | 9 (2.3%) |
| 5:30 AM to 5:59 AM | 28 (7.9%) | 90 (23.3%) |
| 6:00 AM to 6:29 AM | 16 (4.5%) | 8 (2.1%) |
| 6:30 AM to 6:59 AM | 34 (9.6%) | 79 (20.5%) |
| 7:00 AM to 7:29 AM | 50 (14.2%) | 26 (6.7%) |
| 7:30 AM to 7:59 AM | 32 (9.1%) | 43 (11.1%) |
| 8:00 AM to 8:29 AM | 12 (3.4%) | 17 (4.4%) |
| 8:30 AM to 8:59 AM | 13 (3.7%) | 9 (2.3%) |
| 9:00 AM to 9:59 AM | 5 (1.4%) | 59 (15.3%) |
| 10:00 AM to 10:59 AM | 0 (0.0%) | 3 (0.8%) |
| 11:00 AM to 11:59 AM | 3 (0.9%) | 6 (1.5%) |
| 12:00 PM to 3:59 PM | 0 (0.0%) | 26 (6.7%) |
| 4:00 PM to 11:59 PM | 16 (4.5%) | 5 (1.3%) |
| Total | 353 (100.0%) | 386 (100.0%) |
Housing Occupancy in Halsey
Occupancy by Ownership in Halsey
Of the total 445 dwellings in Halsey, owner-occupied units account for 329 (73.9%), while renter-occupied units make up 116 (26.1%).
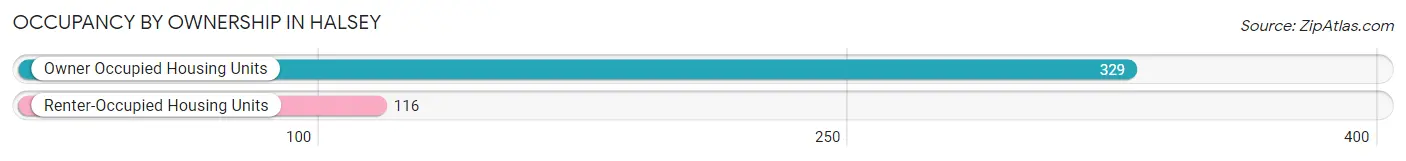
| Occupancy | # Housing Units | % Housing Units |
| Owner Occupied Housing Units | 329 | 73.9% |
| Renter-Occupied Housing Units | 116 | 26.1% |
| Total Occupied Housing Units | 445 | 100.0% |
Occupancy by Household Size in Halsey
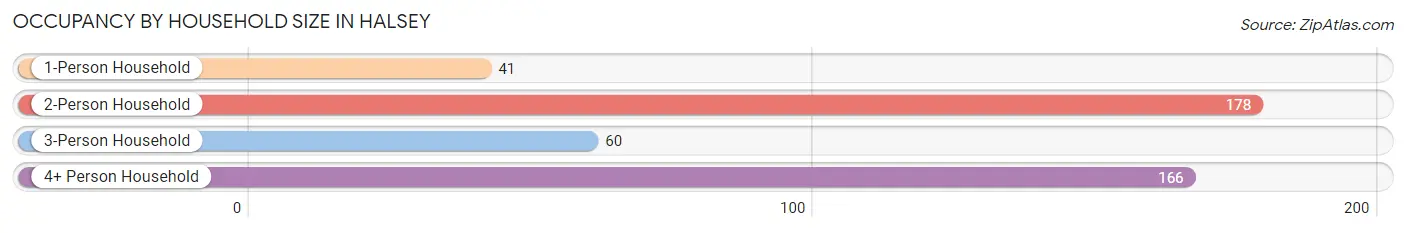
| Household Size | # Housing Units | % Housing Units |
| 1-Person Household | 41 | 9.2% |
| 2-Person Household | 178 | 40.0% |
| 3-Person Household | 60 | 13.5% |
| 4+ Person Household | 166 | 37.3% |
| Total Housing Units | 445 | 100.0% |
Occupancy by Ownership by Household Size in Halsey
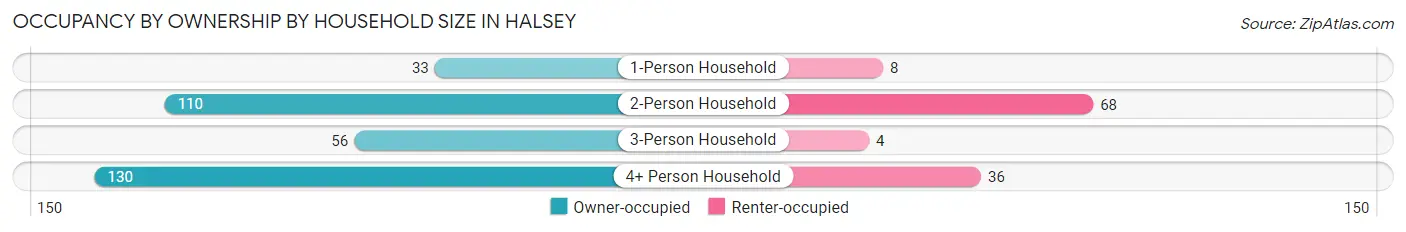
| Household Size | Owner-occupied | Renter-occupied |
| 1-Person Household | 33 (80.5%) | 8 (19.5%) |
| 2-Person Household | 110 (61.8%) | 68 (38.2%) |
| 3-Person Household | 56 (93.3%) | 4 (6.7%) |
| 4+ Person Household | 130 (78.3%) | 36 (21.7%) |
| Total Housing Units | 329 (73.9%) | 116 (26.1%) |
Occupancy by Educational Attainment in Halsey
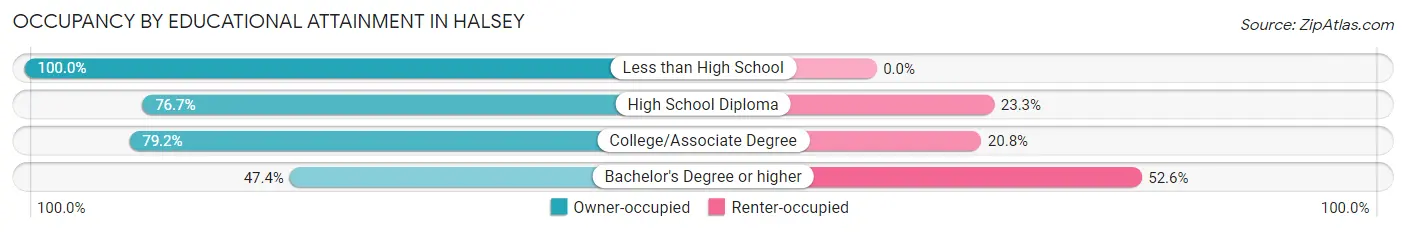
| Household Size | Owner-occupied | Renter-occupied |
| Less than High School | 17 (100.0%) | 0 (0.0%) |
| High School Diploma | 69 (76.7%) | 21 (23.3%) |
| College/Associate Degree | 206 (79.2%) | 54 (20.8%) |
| Bachelor's Degree or higher | 37 (47.4%) | 41 (52.6%) |
Occupancy by Age of Householder in Halsey
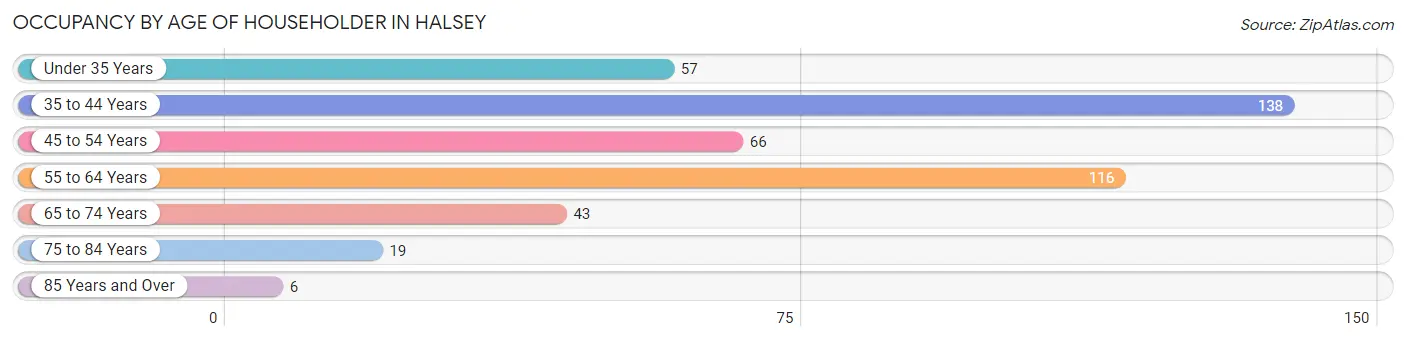
| Age Bracket | # Households | % Households |
| Under 35 Years | 57 | 12.8% |
| 35 to 44 Years | 138 | 31.0% |
| 45 to 54 Years | 66 | 14.8% |
| 55 to 64 Years | 116 | 26.1% |
| 65 to 74 Years | 43 | 9.7% |
| 75 to 84 Years | 19 | 4.3% |
| 85 Years and Over | 6 | 1.3% |
| Total | 445 | 100.0% |
Housing Finances in Halsey
Median Income by Occupancy in Halsey
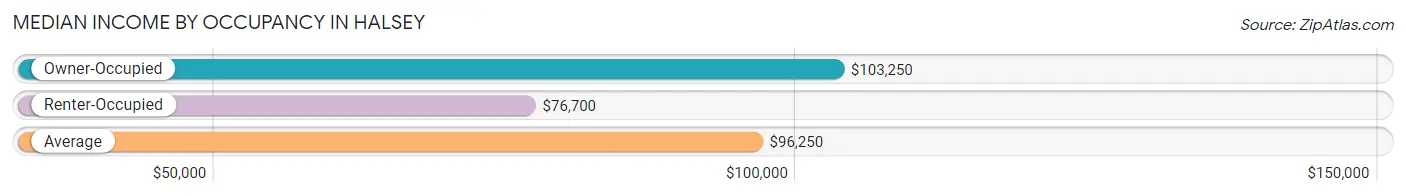
| Occupancy Type | # Households | Median Income |
| Owner-Occupied | 329 (73.9%) | $103,250 |
| Renter-Occupied | 116 (26.1%) | $76,700 |
| Average | 445 (100.0%) | $96,250 |
Occupancy by Householder Income Bracket in Halsey
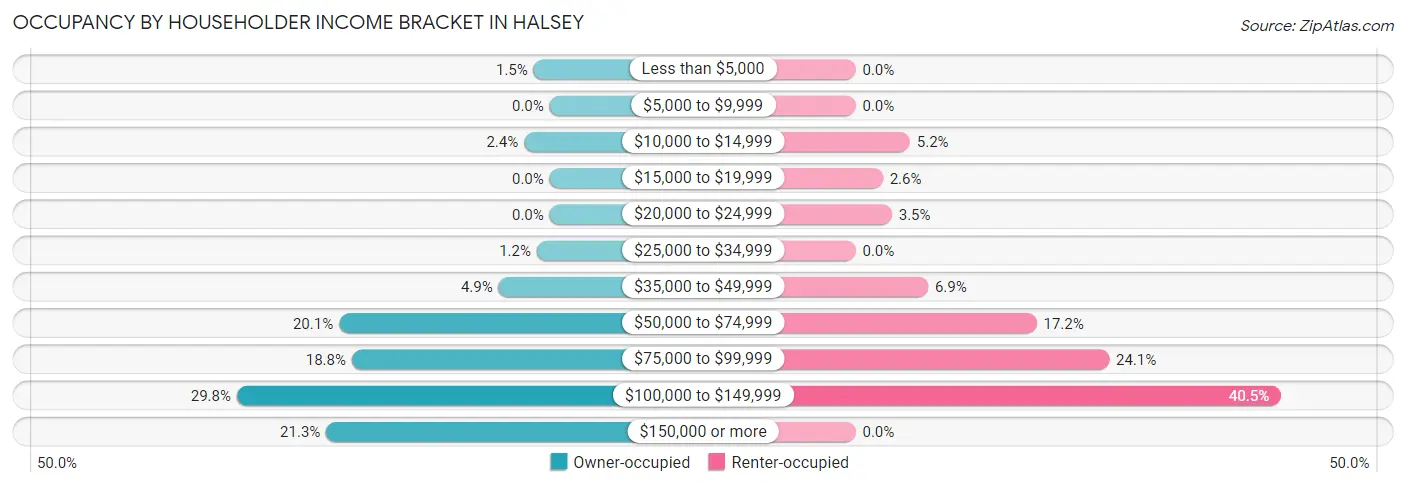
| Income Bracket | Owner-occupied | Renter-occupied |
| Less than $5,000 | 5 (1.5%) | 0 (0.0%) |
| $5,000 to $9,999 | 0 (0.0%) | 0 (0.0%) |
| $10,000 to $14,999 | 8 (2.4%) | 6 (5.2%) |
| $15,000 to $19,999 | 0 (0.0%) | 3 (2.6%) |
| $20,000 to $24,999 | 0 (0.0%) | 4 (3.5%) |
| $25,000 to $34,999 | 4 (1.2%) | 0 (0.0%) |
| $35,000 to $49,999 | 16 (4.9%) | 8 (6.9%) |
| $50,000 to $74,999 | 66 (20.1%) | 20 (17.2%) |
| $75,000 to $99,999 | 62 (18.8%) | 28 (24.1%) |
| $100,000 to $149,999 | 98 (29.8%) | 47 (40.5%) |
| $150,000 or more | 70 (21.3%) | 0 (0.0%) |
| Total | 329 (100.0%) | 116 (100.0%) |
Monthly Housing Cost Tiers in Halsey
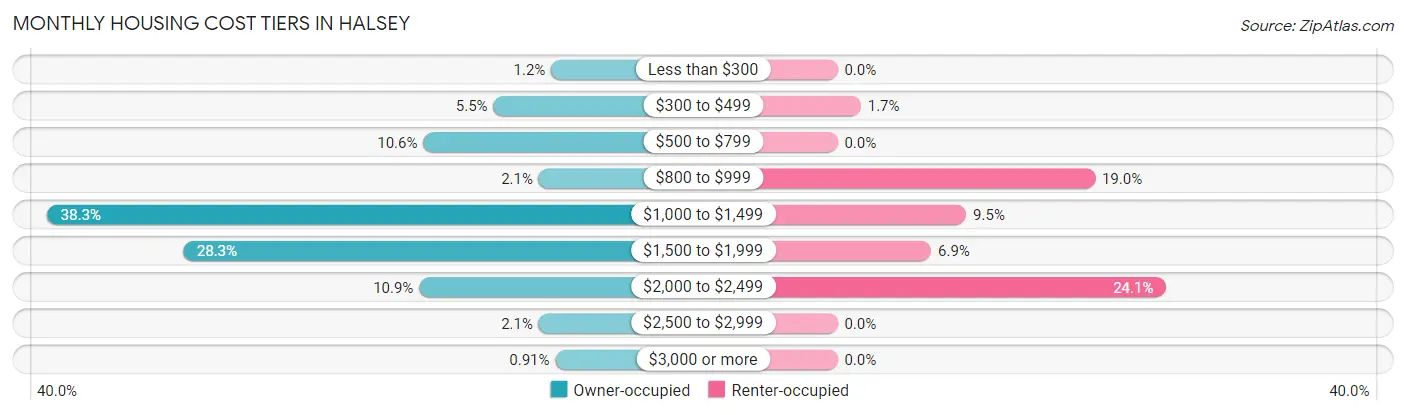
| Monthly Cost | Owner-occupied | Renter-occupied |
| Less than $300 | 4 (1.2%) | 0 (0.0%) |
| $300 to $499 | 18 (5.5%) | 2 (1.7%) |
| $500 to $799 | 35 (10.6%) | 0 (0.0%) |
| $800 to $999 | 7 (2.1%) | 22 (19.0%) |
| $1,000 to $1,499 | 126 (38.3%) | 11 (9.5%) |
| $1,500 to $1,999 | 93 (28.3%) | 8 (6.9%) |
| $2,000 to $2,499 | 36 (10.9%) | 28 (24.1%) |
| $2,500 to $2,999 | 7 (2.1%) | 0 (0.0%) |
| $3,000 or more | 3 (0.9%) | 0 (0.0%) |
| Total | 329 (100.0%) | 116 (100.0%) |
Physical Housing Characteristics in Halsey
Housing Structures in Halsey
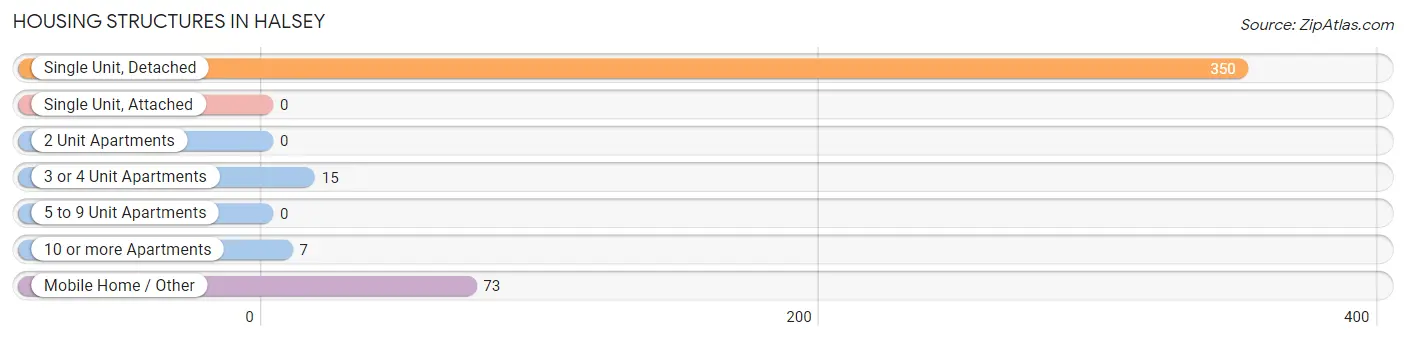
| Structure Type | # Housing Units | % Housing Units |
| Single Unit, Detached | 350 | 78.6% |
| Single Unit, Attached | 0 | 0.0% |
| 2 Unit Apartments | 0 | 0.0% |
| 3 or 4 Unit Apartments | 15 | 3.4% |
| 5 to 9 Unit Apartments | 0 | 0.0% |
| 10 or more Apartments | 7 | 1.6% |
| Mobile Home / Other | 73 | 16.4% |
| Total | 445 | 100.0% |
Housing Structures by Occupancy in Halsey
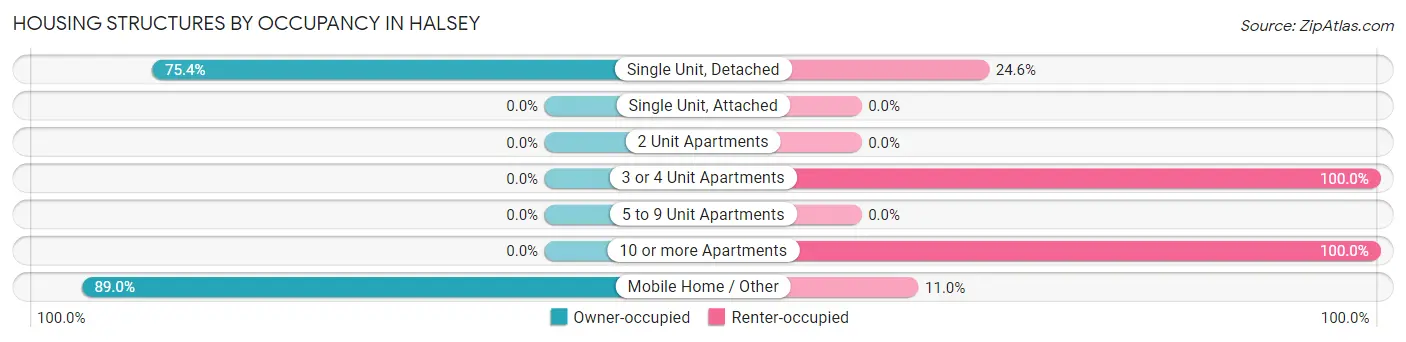
| Structure Type | Owner-occupied | Renter-occupied |
| Single Unit, Detached | 264 (75.4%) | 86 (24.6%) |
| Single Unit, Attached | 0 (0.0%) | 0 (0.0%) |
| 2 Unit Apartments | 0 (0.0%) | 0 (0.0%) |
| 3 or 4 Unit Apartments | 0 (0.0%) | 15 (100.0%) |
| 5 to 9 Unit Apartments | 0 (0.0%) | 0 (0.0%) |
| 10 or more Apartments | 0 (0.0%) | 7 (100.0%) |
| Mobile Home / Other | 65 (89.0%) | 8 (11.0%) |
| Total | 329 (73.9%) | 116 (26.1%) |
Housing Structures by Number of Rooms in Halsey
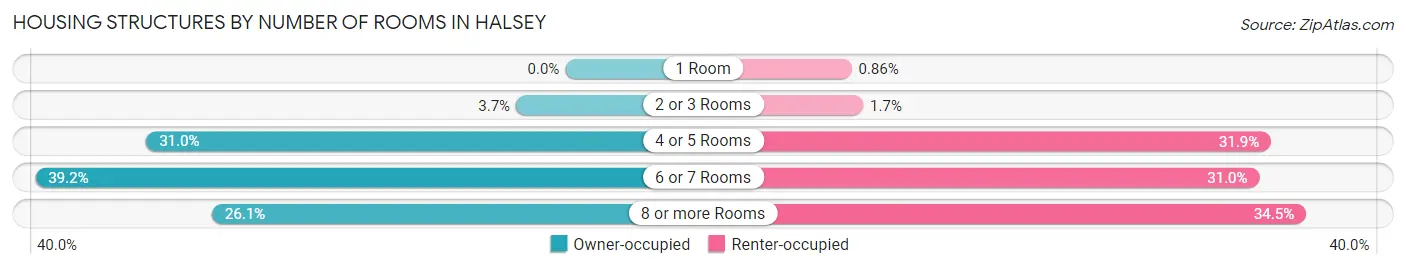
| Number of Rooms | Owner-occupied | Renter-occupied |
| 1 Room | 0 (0.0%) | 1 (0.9%) |
| 2 or 3 Rooms | 12 (3.6%) | 2 (1.7%) |
| 4 or 5 Rooms | 102 (31.0%) | 37 (31.9%) |
| 6 or 7 Rooms | 129 (39.2%) | 36 (31.0%) |
| 8 or more Rooms | 86 (26.1%) | 40 (34.5%) |
| Total | 329 (100.0%) | 116 (100.0%) |
Housing Structure by Heating Type in Halsey
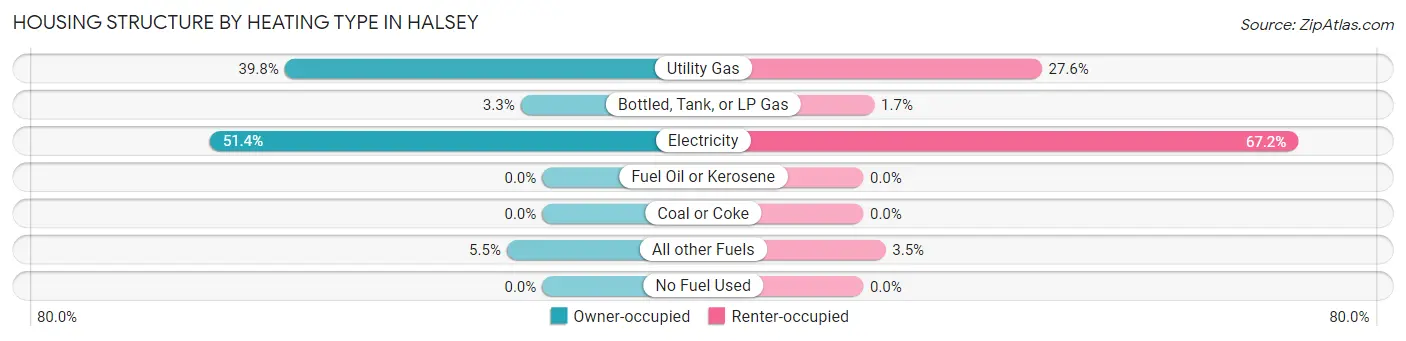
| Heating Type | Owner-occupied | Renter-occupied |
| Utility Gas | 131 (39.8%) | 32 (27.6%) |
| Bottled, Tank, or LP Gas | 11 (3.3%) | 2 (1.7%) |
| Electricity | 169 (51.4%) | 78 (67.2%) |
| Fuel Oil or Kerosene | 0 (0.0%) | 0 (0.0%) |
| Coal or Coke | 0 (0.0%) | 0 (0.0%) |
| All other Fuels | 18 (5.5%) | 4 (3.5%) |
| No Fuel Used | 0 (0.0%) | 0 (0.0%) |
| Total | 329 (100.0%) | 116 (100.0%) |
Household Vehicle Usage in Halsey
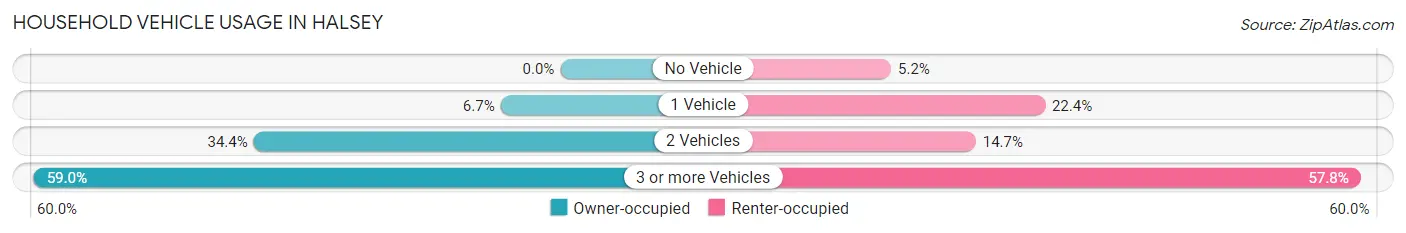
| Vehicles per Household | Owner-occupied | Renter-occupied |
| No Vehicle | 0 (0.0%) | 6 (5.2%) |
| 1 Vehicle | 22 (6.7%) | 26 (22.4%) |
| 2 Vehicles | 113 (34.4%) | 17 (14.7%) |
| 3 or more Vehicles | 194 (59.0%) | 67 (57.8%) |
| Total | 329 (100.0%) | 116 (100.0%) |
Real Estate & Mortgages in Halsey
Real Estate and Mortgage Overview in Halsey
| Characteristic | Without Mortgage | With Mortgage |
| Housing Units | 56 | 273 |
| Median Property Value | $275,000 | $258,000 |
| Median Household Income | $103,000 | $65 |
| Monthly Housing Costs | $525 | $3 |
| Real Estate Taxes | $2,378 | $0 |
Property Value by Mortgage Status in Halsey
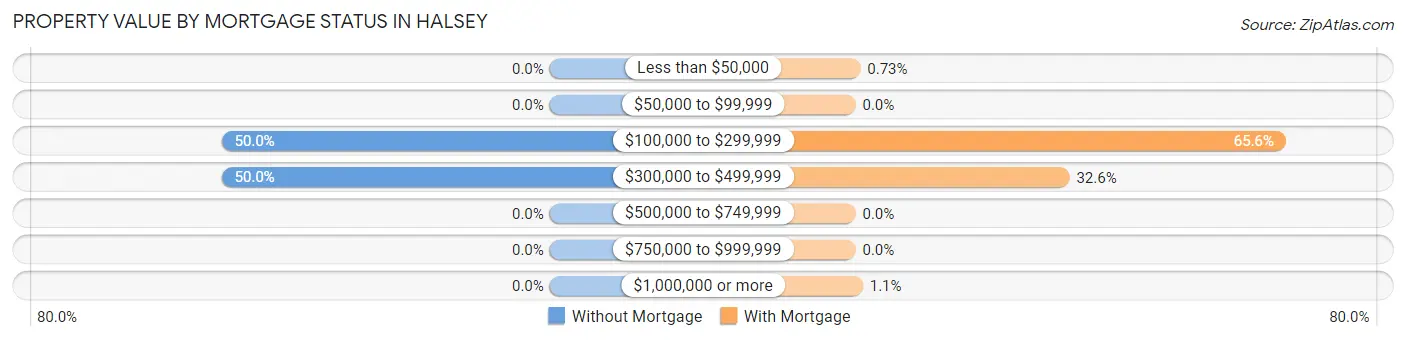
| Property Value | Without Mortgage | With Mortgage |
| Less than $50,000 | 0 (0.0%) | 2 (0.7%) |
| $50,000 to $99,999 | 0 (0.0%) | 0 (0.0%) |
| $100,000 to $299,999 | 28 (50.0%) | 179 (65.6%) |
| $300,000 to $499,999 | 28 (50.0%) | 89 (32.6%) |
| $500,000 to $749,999 | 0 (0.0%) | 0 (0.0%) |
| $750,000 to $999,999 | 0 (0.0%) | 0 (0.0%) |
| $1,000,000 or more | 0 (0.0%) | 3 (1.1%) |
| Total | 56 (100.0%) | 273 (100.0%) |
Household Income by Mortgage Status in Halsey
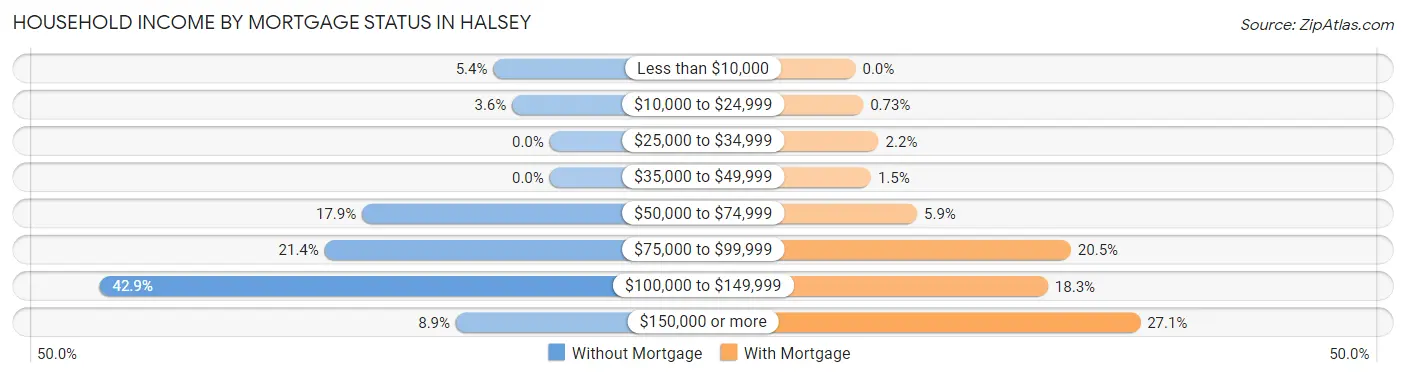
| Household Income | Without Mortgage | With Mortgage |
| Less than $10,000 | 3 (5.4%) | 0 (0.0%) |
| $10,000 to $24,999 | 2 (3.6%) | 2 (0.7%) |
| $25,000 to $34,999 | 0 (0.0%) | 6 (2.2%) |
| $35,000 to $49,999 | 0 (0.0%) | 4 (1.5%) |
| $50,000 to $74,999 | 10 (17.9%) | 16 (5.9%) |
| $75,000 to $99,999 | 12 (21.4%) | 56 (20.5%) |
| $100,000 to $149,999 | 24 (42.9%) | 50 (18.3%) |
| $150,000 or more | 5 (8.9%) | 74 (27.1%) |
| Total | 56 (100.0%) | 273 (100.0%) |
Property Value to Household Income Ratio in Halsey
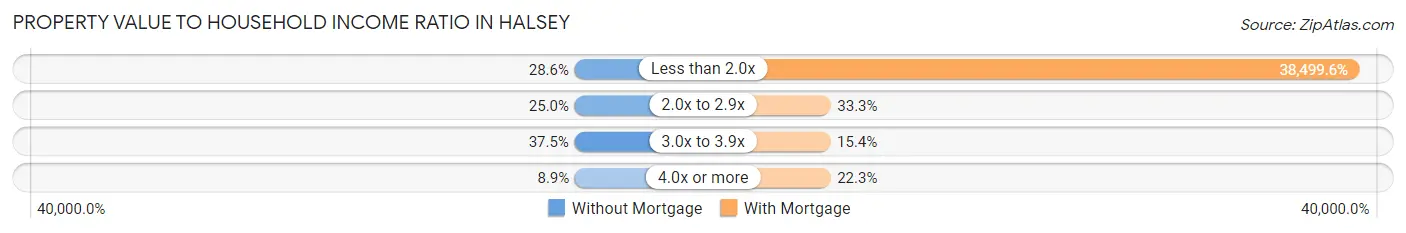
| Value-to-Income Ratio | Without Mortgage | With Mortgage |
| Less than 2.0x | 16 (28.6%) | 105,104 (38,499.6%) |
| 2.0x to 2.9x | 14 (25.0%) | 91 (33.3%) |
| 3.0x to 3.9x | 21 (37.5%) | 42 (15.4%) |
| 4.0x or more | 5 (8.9%) | 61 (22.3%) |
| Total | 56 (100.0%) | 273 (100.0%) |
Real Estate Taxes by Mortgage Status in Halsey
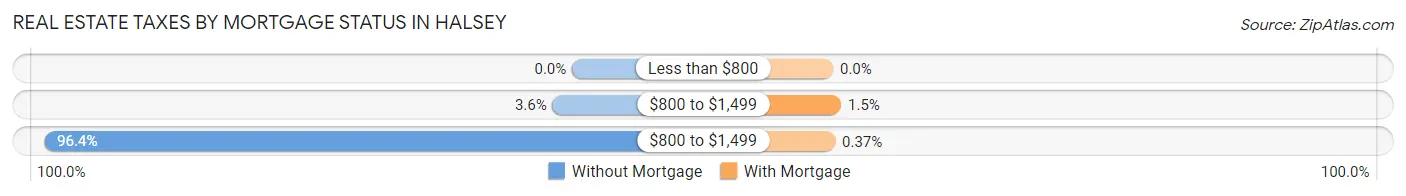
| Property Taxes | Without Mortgage | With Mortgage |
| Less than $800 | 0 (0.0%) | 0 (0.0%) |
| $800 to $1,499 | 2 (3.6%) | 4 (1.5%) |
| $800 to $1,499 | 54 (96.4%) | 1 (0.4%) |
| Total | 56 (100.0%) | 273 (100.0%) |
Health & Disability in Halsey
Health Insurance Coverage by Age in Halsey
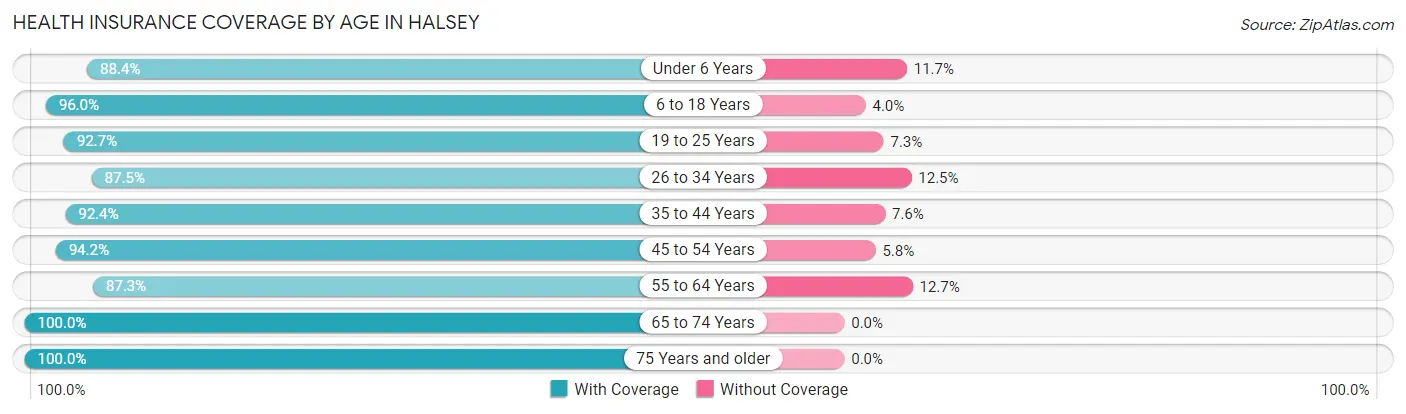
| Age Bracket | With Coverage | Without Coverage |
| Under 6 Years | 91 (88.3%) | 12 (11.7%) |
| 6 to 18 Years | 267 (96.0%) | 11 (4.0%) |
| 19 to 25 Years | 38 (92.7%) | 3 (7.3%) |
| 26 to 34 Years | 189 (87.5%) | 27 (12.5%) |
| 35 to 44 Years | 231 (92.4%) | 19 (7.6%) |
| 45 to 54 Years | 146 (94.2%) | 9 (5.8%) |
| 55 to 64 Years | 192 (87.3%) | 28 (12.7%) |
| 65 to 74 Years | 115 (100.0%) | 0 (0.0%) |
| 75 Years and older | 41 (100.0%) | 0 (0.0%) |
| Total | 1,310 (92.3%) | 109 (7.7%) |
Health Insurance Coverage by Citizenship Status in Halsey
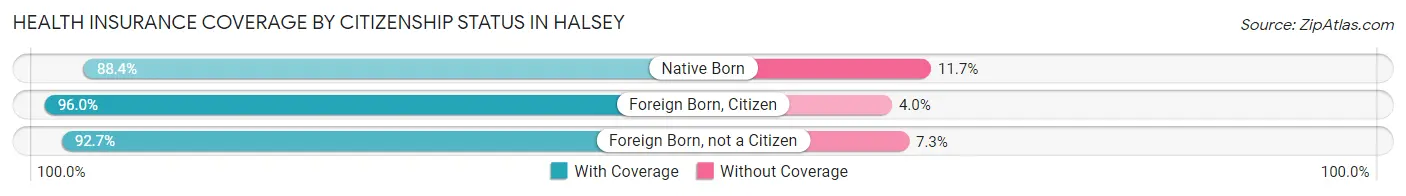
| Citizenship Status | With Coverage | Without Coverage |
| Native Born | 91 (88.3%) | 12 (11.7%) |
| Foreign Born, Citizen | 267 (96.0%) | 11 (4.0%) |
| Foreign Born, not a Citizen | 38 (92.7%) | 3 (7.3%) |
Health Insurance Coverage by Household Income in Halsey
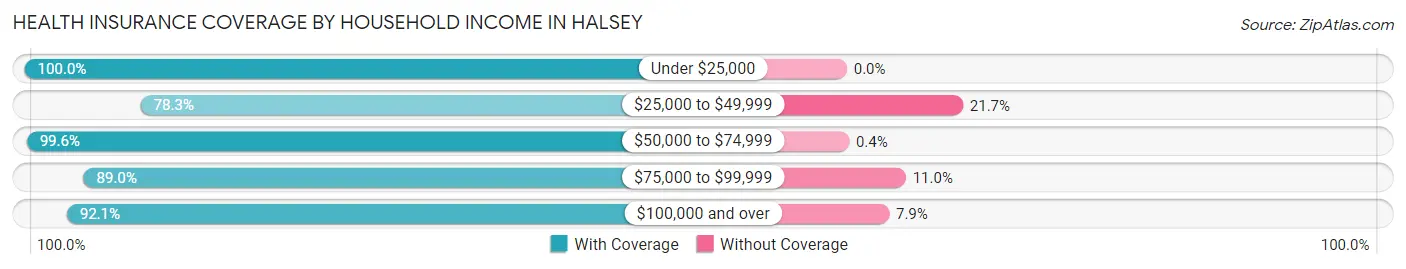
| Household Income | With Coverage | Without Coverage |
| Under $25,000 | 51 (100.0%) | 0 (0.0%) |
| $25,000 to $49,999 | 54 (78.3%) | 15 (21.7%) |
| $50,000 to $74,999 | 248 (99.6%) | 1 (0.4%) |
| $75,000 to $99,999 | 282 (89.0%) | 35 (11.0%) |
| $100,000 and over | 675 (92.1%) | 58 (7.9%) |
Public vs Private Health Insurance Coverage by Age in Halsey
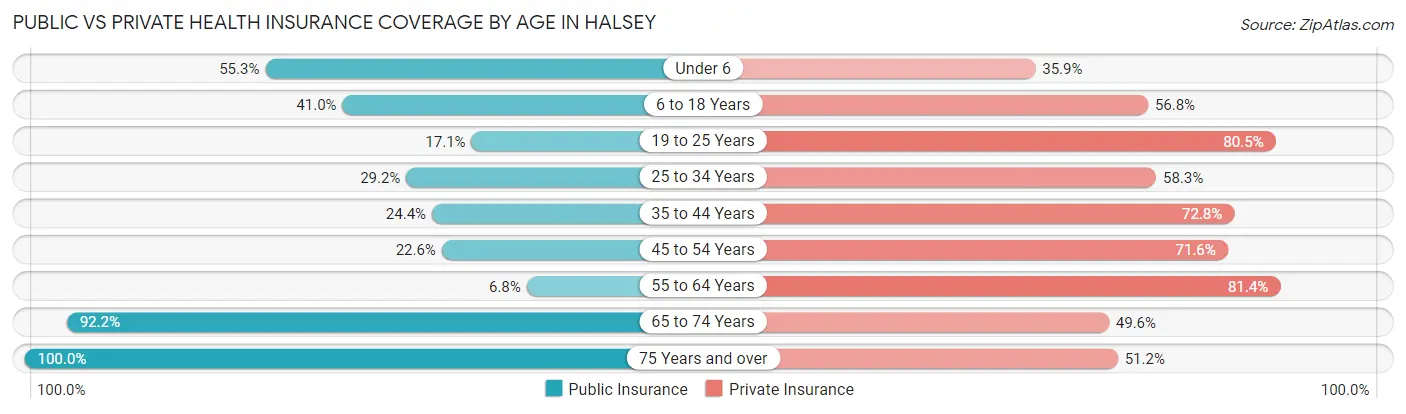
| Age Bracket | Public Insurance | Private Insurance |
| Under 6 | 57 (55.3%) | 37 (35.9%) |
| 6 to 18 Years | 114 (41.0%) | 158 (56.8%) |
| 19 to 25 Years | 7 (17.1%) | 33 (80.5%) |
| 25 to 34 Years | 63 (29.2%) | 126 (58.3%) |
| 35 to 44 Years | 61 (24.4%) | 182 (72.8%) |
| 45 to 54 Years | 35 (22.6%) | 111 (71.6%) |
| 55 to 64 Years | 15 (6.8%) | 179 (81.4%) |
| 65 to 74 Years | 106 (92.2%) | 57 (49.6%) |
| 75 Years and over | 41 (100.0%) | 21 (51.2%) |
| Total | 499 (35.2%) | 904 (63.7%) |
Disability Status by Sex by Age in Halsey
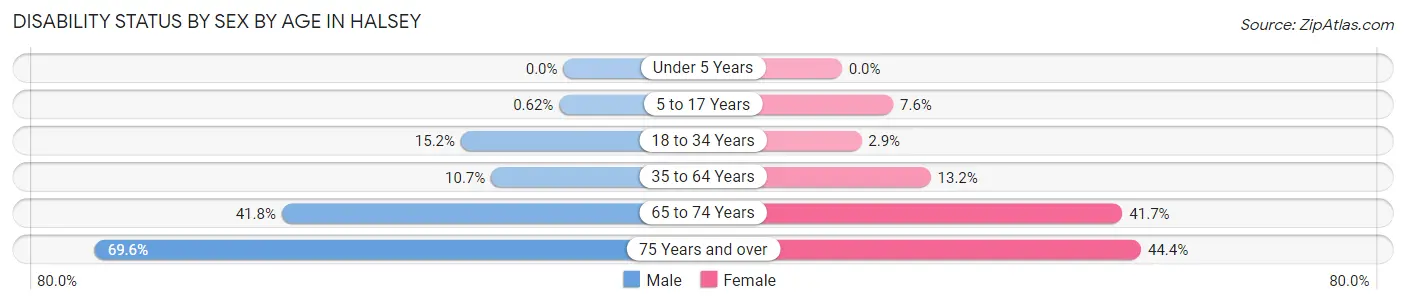
| Age Bracket | Male | Female |
| Under 5 Years | 0 (0.0%) | 0 (0.0%) |
| 5 to 17 Years | 1 (0.6%) | 8 (7.6%) |
| 18 to 34 Years | 21 (15.2%) | 4 (2.9%) |
| 35 to 64 Years | 28 (10.7%) | 48 (13.2%) |
| 65 to 74 Years | 23 (41.8%) | 25 (41.7%) |
| 75 Years and over | 16 (69.6%) | 8 (44.4%) |
Disability Class by Sex by Age in Halsey
Disability Class: Hearing Difficulty
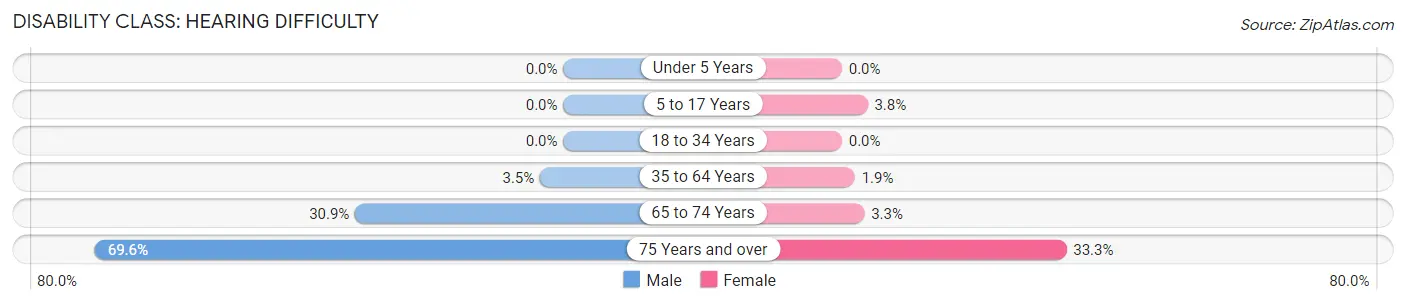
| Age Bracket | Male | Female |
| Under 5 Years | 0 (0.0%) | 0 (0.0%) |
| 5 to 17 Years | 0 (0.0%) | 4 (3.8%) |
| 18 to 34 Years | 0 (0.0%) | 0 (0.0%) |
| 35 to 64 Years | 9 (3.5%) | 7 (1.9%) |
| 65 to 74 Years | 17 (30.9%) | 2 (3.3%) |
| 75 Years and over | 16 (69.6%) | 6 (33.3%) |
Disability Class: Vision Difficulty
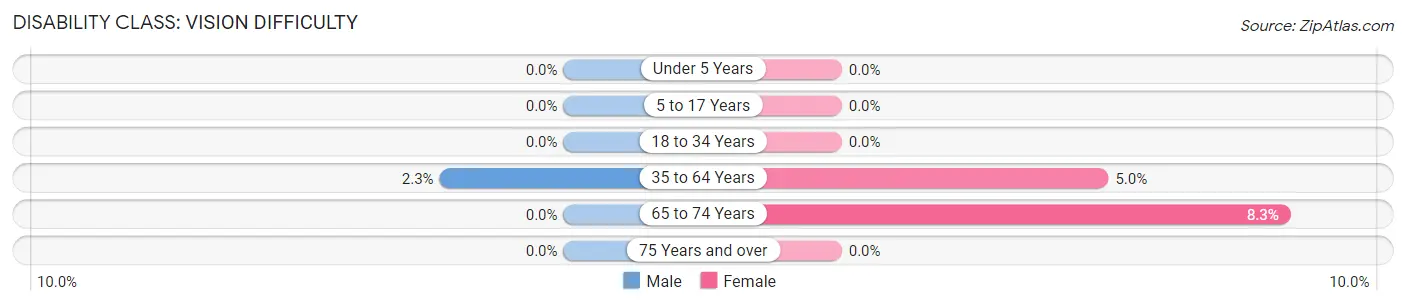
| Age Bracket | Male | Female |
| Under 5 Years | 0 (0.0%) | 0 (0.0%) |
| 5 to 17 Years | 0 (0.0%) | 0 (0.0%) |
| 18 to 34 Years | 0 (0.0%) | 0 (0.0%) |
| 35 to 64 Years | 6 (2.3%) | 18 (5.0%) |
| 65 to 74 Years | 0 (0.0%) | 5 (8.3%) |
| 75 Years and over | 0 (0.0%) | 0 (0.0%) |
Disability Class: Cognitive Difficulty
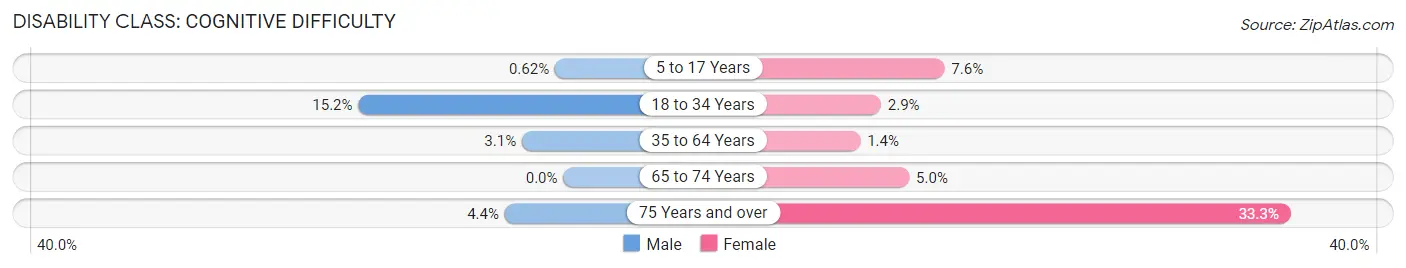
| Age Bracket | Male | Female |
| 5 to 17 Years | 1 (0.6%) | 8 (7.6%) |
| 18 to 34 Years | 21 (15.2%) | 4 (2.9%) |
| 35 to 64 Years | 8 (3.1%) | 5 (1.4%) |
| 65 to 74 Years | 0 (0.0%) | 3 (5.0%) |
| 75 Years and over | 1 (4.3%) | 6 (33.3%) |
Disability Class: Ambulatory Difficulty
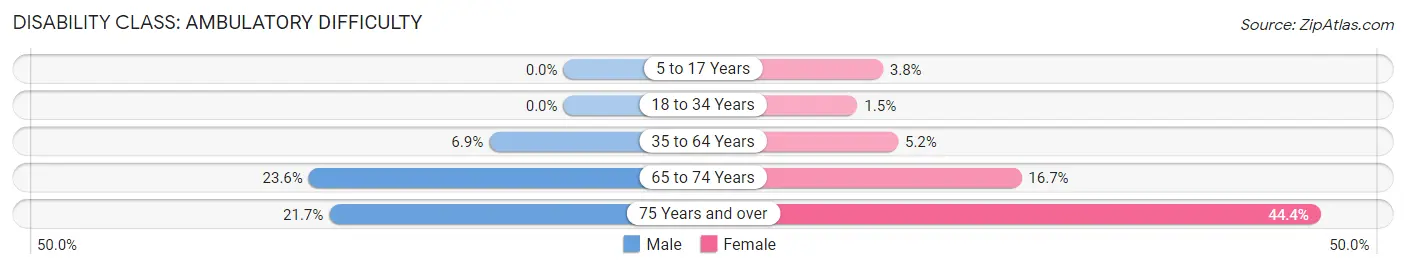
| Age Bracket | Male | Female |
| 5 to 17 Years | 0 (0.0%) | 4 (3.8%) |
| 18 to 34 Years | 0 (0.0%) | 2 (1.5%) |
| 35 to 64 Years | 18 (6.9%) | 19 (5.2%) |
| 65 to 74 Years | 13 (23.6%) | 10 (16.7%) |
| 75 Years and over | 5 (21.7%) | 8 (44.4%) |
Disability Class: Self-Care Difficulty
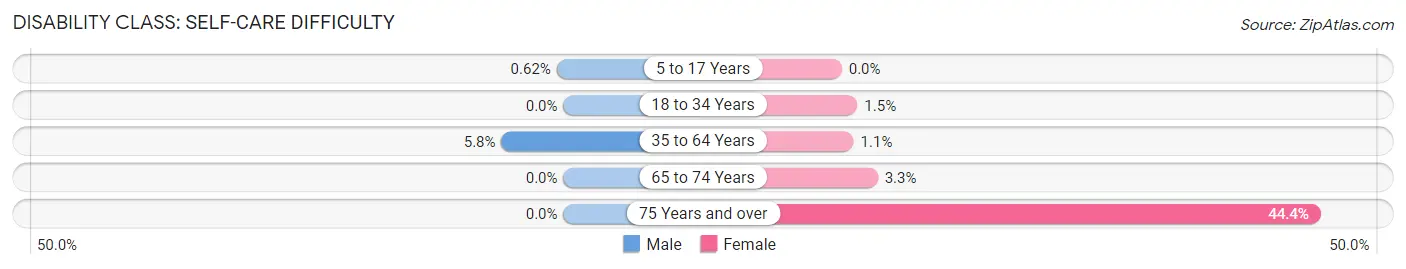
| Age Bracket | Male | Female |
| 5 to 17 Years | 1 (0.6%) | 0 (0.0%) |
| 18 to 34 Years | 0 (0.0%) | 2 (1.5%) |
| 35 to 64 Years | 15 (5.8%) | 4 (1.1%) |
| 65 to 74 Years | 0 (0.0%) | 2 (3.3%) |
| 75 Years and over | 0 (0.0%) | 8 (44.4%) |
Technology Access in Halsey
Computing Device Access in Halsey
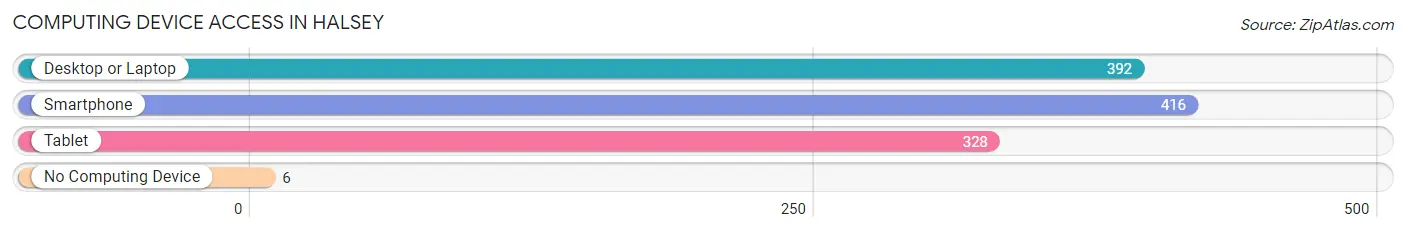
| Device Type | # Households | % Households |
| Desktop or Laptop | 392 | 88.1% |
| Smartphone | 416 | 93.5% |
| Tablet | 328 | 73.7% |
| No Computing Device | 6 | 1.3% |
| Total | 445 | 100.0% |
Internet Access in Halsey
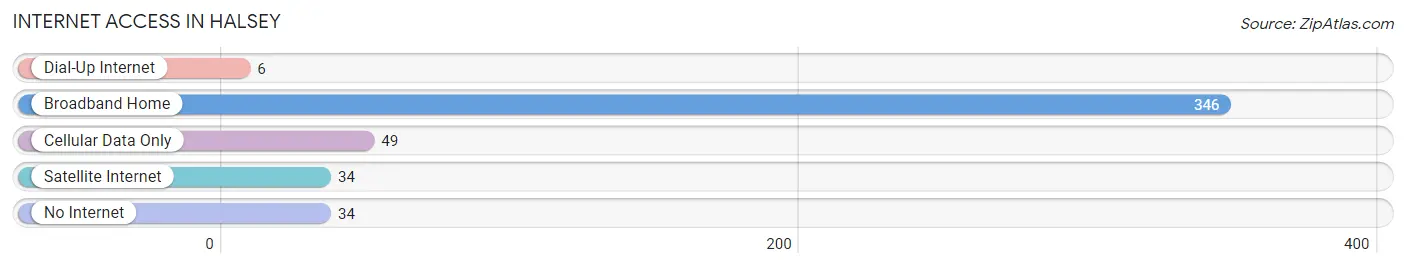
| Internet Type | # Households | % Households |
| Dial-Up Internet | 6 | 1.3% |
| Broadband Home | 346 | 77.7% |
| Cellular Data Only | 49 | 11.0% |
| Satellite Internet | 34 | 7.6% |
| No Internet | 34 | 7.6% |
| Total | 445 | 100.0% |
Halsey Summary
Halsey is a small city located in Linn County, Oregon, United States. It is situated on the banks of the Willamette River, about 10 miles south of Albany. The population was 1,845 at the 2010 census.
History
Halsey was founded in 1871 by William Halsey, a pioneer who had come to Oregon from Indiana. He named the town after himself and it was incorporated in 1891. The town was originally a farming community, but it soon became a center for the timber industry. The timber industry was the main source of employment for the town until the late 20th century.
In the early 20th century, Halsey was a popular destination for tourists. It was known for its scenic beauty and its many outdoor activities, such as fishing, hunting, and camping. The town also had a number of hotels and resorts.
Geography
Halsey is located at the confluence of the Willamette and Calapooia Rivers. The city is situated in the foothills of the Cascade Mountains, about 10 miles south of Albany. The city has a total area of 1.3 square miles, all of which is land.
Economy
Halsey’s economy is largely based on agriculture and timber. The city is home to several farms, which produce a variety of crops, including wheat, corn, and hay. The timber industry is also an important part of the local economy. The city is home to several sawmills and lumber yards.
In addition to agriculture and timber, Halsey is also home to a number of small businesses, including restaurants, retail stores, and service providers. The city is also home to a number of manufacturing companies, including a furniture factory and a metal fabrication plant.
Demographics
As of the 2010 census, there were 1,845 people, 745 households, and 486 families residing in the city. The population density was 1,420.3 people per square mile. The racial makeup of the city was 94.2% White, 0.3% African American, 0.7% Native American, 0.4% Asian, 0.1% Pacific Islander, 1.2% from other races, and 2.3% from two or more races. Hispanic or Latino of any race were 4.2% of the population.
The median income for a household in the city was $37,917, and the median income for a family was $45,000. Males had a median income of $35,000 versus $25,000 for females. The per capita income for the city was $17,845. About 10.2% of families and 13.2% of the population were below the poverty line, including 17.2% of those under age 18 and 8.2% of those age 65 or over.
Common Questions
What is Per Capita Income in Halsey?
Per Capita income in Halsey is $31,627.
What is the Median Family Income in Halsey?
Median Family Income in Halsey is $94,375.
What is the Median Household income in Halsey?
Median Household Income in Halsey is $96,250.
What is Income or Wage Gap in Halsey?
Income or Wage Gap in Halsey is 41.5%.
Women in Halsey earn 58.5 cents for every dollar earned by a man.
What is Inequality or Gini Index in Halsey?
Inequality or Gini Index in Halsey is 0.28.
What is the Total Population of Halsey?
Total Population of Halsey is 1,419.
What is the Total Male Population of Halsey?
Total Male Population of Halsey is 694.
What is the Total Female Population of Halsey?
Total Female Population of Halsey is 725.
What is the Ratio of Males per 100 Females in Halsey?
There are 95.72 Males per 100 Females in Halsey.
What is the Ratio of Females per 100 Males in Halsey?
There are 104.47 Females per 100 Males in Halsey.
What is the Median Population Age in Halsey?
Median Population Age in Halsey is 37.2 Years.
What is the Average Family Size in Halsey
Average Family Size in Halsey is 3.1 People.
What is the Average Household Size in Halsey
Average Household Size in Halsey is 3.2 People.
How Large is the Labor Force in Halsey?
There are 804 People in the Labor Forcein in Halsey.
What is the Percentage of People in the Labor Force in Halsey?
71.0% of People are in the Labor Force in Halsey.
What is the Unemployment Rate in Halsey?
Unemployment Rate in Halsey is 5.3%.