Myrtle Point, OR Map & Demographics
Myrtle Point Map
Myrtle Point Overview
$30,882
PER CAPITA INCOME
$53,839
AVG FAMILY INCOME
$44,716
AVG HOUSEHOLD INCOME
49.2%
WAGE / INCOME GAP [ % ]
50.8¢/ $1
WAGE / INCOME GAP [ $ ]
0.47
INEQUALITY / GINI INDEX
2,689
TOTAL POPULATION
1,301
MALE POPULATION
1,388
FEMALE POPULATION
93.73
MALES / 100 FEMALES
106.69
FEMALES / 100 MALES
48.1
MEDIAN AGE
3.0
AVG FAMILY SIZE
2.3
AVG HOUSEHOLD SIZE
964
LABOR FORCE [ PEOPLE ]
44.1%
PERCENT IN LABOR FORCE
10.3%
UNEMPLOYMENT RATE
Myrtle Point Zip Codes
Myrtle Point Area Codes
Income in Myrtle Point
Income Overview in Myrtle Point
Per Capita Income in Myrtle Point is $30,882, while median incomes of families and households are $53,839 and $44,716 respectively.
| Characteristic | Number | Measure |
| Per Capita Income | 2,689 | $30,882 |
| Median Family Income | 665 | $53,839 |
| Mean Family Income | 665 | $75,756 |
| Median Household Income | 1,127 | $44,716 |
| Mean Household Income | 1,127 | $62,275 |
| Income Deficit | 665 | $0 |
| Wage / Income Gap (%) | 2,689 | 49.25% |
| Wage / Income Gap ($) | 2,689 | 50.75¢ per $1 |
| Gini / Inequality Index | 2,689 | 0.47 |
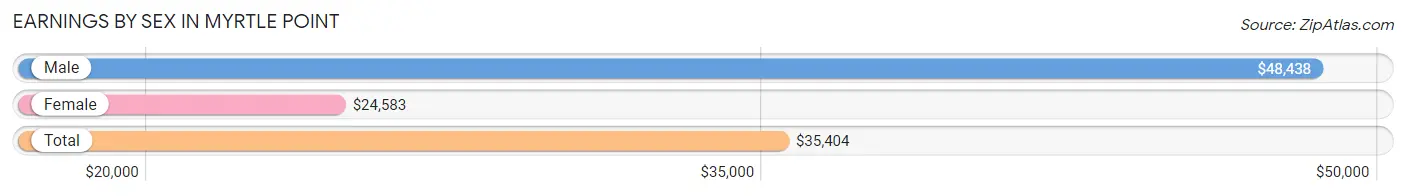
Earnings by Sex in Myrtle Point
Average Earnings in Myrtle Point are $35,404, $48,438 for men and $24,583 for women, a difference of 49.2%.
| Sex | Number | Average Earnings |
| Male | 496 (49.6%) | $48,438 |
| Female | 503 (50.3%) | $24,583 |
| Total | 999 (100.0%) | $35,404 |
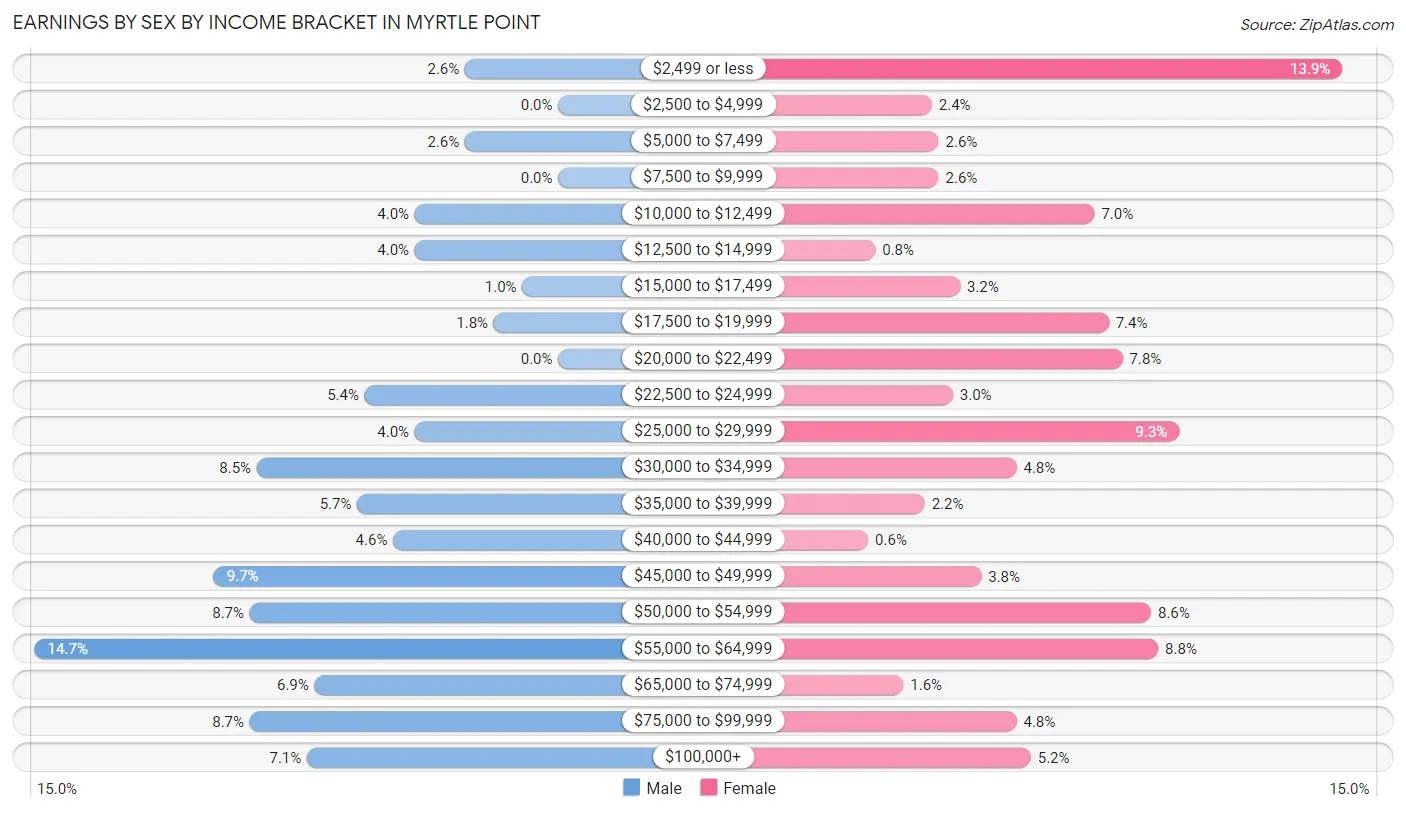
Earnings by Sex by Income Bracket in Myrtle Point
The most common earnings brackets in Myrtle Point are $55,000 to $64,999 for men (73 | 14.7%) and $2,499 or less for women (70 | 13.9%).
| Income | Male | Female |
| $2,499 or less | 13 (2.6%) | 70 (13.9%) |
| $2,500 to $4,999 | 0 (0.0%) | 12 (2.4%) |
| $5,000 to $7,499 | 13 (2.6%) | 13 (2.6%) |
| $7,500 to $9,999 | 0 (0.0%) | 13 (2.6%) |
| $10,000 to $12,499 | 20 (4.0%) | 35 (7.0%) |
| $12,500 to $14,999 | 20 (4.0%) | 4 (0.8%) |
| $15,000 to $17,499 | 5 (1.0%) | 16 (3.2%) |
| $17,500 to $19,999 | 9 (1.8%) | 37 (7.4%) |
| $20,000 to $22,499 | 0 (0.0%) | 39 (7.7%) |
| $22,500 to $24,999 | 27 (5.4%) | 15 (3.0%) |
| $25,000 to $29,999 | 20 (4.0%) | 47 (9.3%) |
| $30,000 to $34,999 | 42 (8.5%) | 24 (4.8%) |
| $35,000 to $39,999 | 28 (5.7%) | 11 (2.2%) |
| $40,000 to $44,999 | 23 (4.6%) | 3 (0.6%) |
| $45,000 to $49,999 | 48 (9.7%) | 19 (3.8%) |
| $50,000 to $54,999 | 43 (8.7%) | 43 (8.6%) |
| $55,000 to $64,999 | 73 (14.7%) | 44 (8.7%) |
| $65,000 to $74,999 | 34 (6.9%) | 8 (1.6%) |
| $75,000 to $99,999 | 43 (8.7%) | 24 (4.8%) |
| $100,000+ | 35 (7.1%) | 26 (5.2%) |
| Total | 496 (100.0%) | 503 (100.0%) |
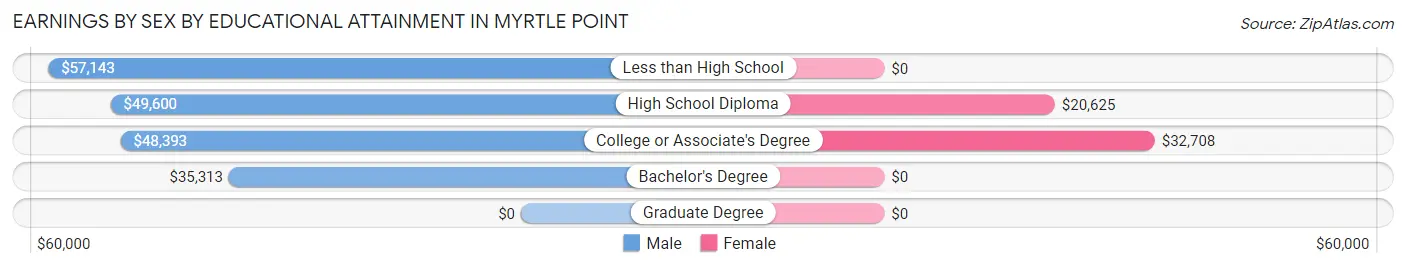
Earnings by Sex by Educational Attainment in Myrtle Point
Average earnings in Myrtle Point are $49,219 for men and $25,032 for women, a difference of 49.1%. Men with an educational attainment of less than high school enjoy the highest average annual earnings of $57,143, while those with bachelor's degree education earn the least with $35,313. Women with an educational attainment of college or associate's degree earn the most with the average annual earnings of $32,708, while those with high school diploma education have the smallest earnings of $20,625.
| Educational Attainment | Male Income | Female Income |
| Less than High School | $57,143 | $0 |
| High School Diploma | $49,600 | $20,625 |
| College or Associate's Degree | $48,393 | $32,708 |
| Bachelor's Degree | $35,313 | $0 |
| Graduate Degree | - | - |
| Total | $49,219 | $25,032 |
Family Income in Myrtle Point
Family Income Brackets in Myrtle Point
According to the Myrtle Point family income data, there are 156 families falling into the $35,000 to $49,999 income range, which is the most common income bracket and makes up 23.5% of all families. Conversely, the $200,000+ income bracket is the least frequent group with only 23 families (3.5%) belonging to this category.
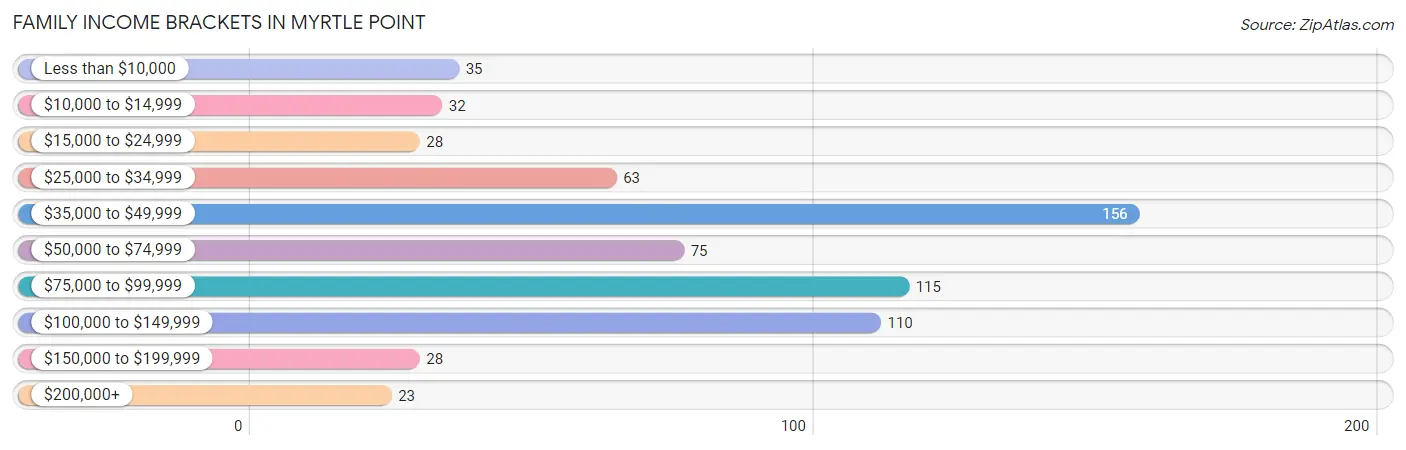
| Income Bracket | # Families | % Families |
| Less than $10,000 | 35 | 5.3% |
| $10,000 to $14,999 | 32 | 4.8% |
| $15,000 to $24,999 | 28 | 4.2% |
| $25,000 to $34,999 | 63 | 9.5% |
| $35,000 to $49,999 | 156 | 23.5% |
| $50,000 to $74,999 | 75 | 11.3% |
| $75,000 to $99,999 | 115 | 17.3% |
| $100,000 to $149,999 | 110 | 16.5% |
| $150,000 to $199,999 | 28 | 4.2% |
| $200,000+ | 23 | 3.5% |
Family Income by Famaliy Size in Myrtle Point
4-person families (99 | 14.9%) account for the highest median family income in Myrtle Point with $106,607 per family, while 3-person families (115 | 17.3%) have the highest median income of $30,104 per family member.
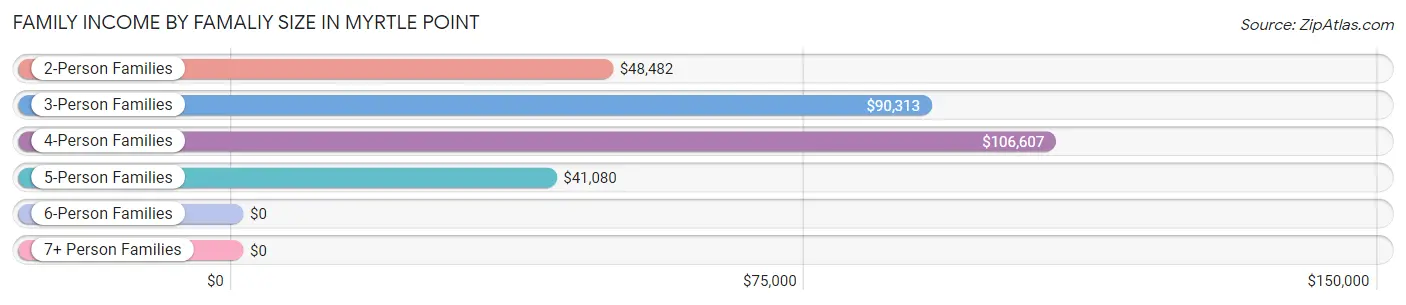
| Income Bracket | # Families | Median Income |
| 2-Person Families | 387 (58.2%) | $48,482 |
| 3-Person Families | 115 (17.3%) | $90,313 |
| 4-Person Families | 99 (14.9%) | $106,607 |
| 5-Person Families | 27 (4.1%) | $41,080 |
| 6-Person Families | 37 (5.6%) | $0 |
| 7+ Person Families | 0 (0.0%) | $0 |
| Total | 665 (100.0%) | $53,839 |
Family Income by Number of Earners in Myrtle Point
The median family income in Myrtle Point is $53,839, with families comprising 3+ earners (39) having the highest median family income of $150,288, while families with no earners (226) have the lowest median family income of $43,750, accounting for 5.9% and 34.0% of families, respectively.
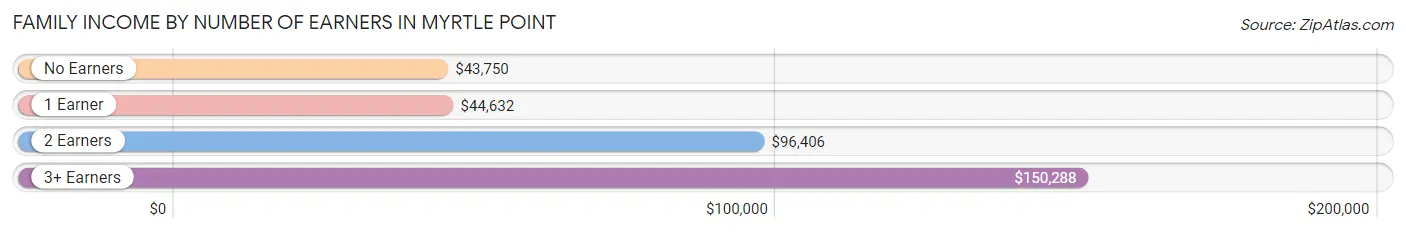
| Number of Earners | # Families | Median Income |
| No Earners | 226 (34.0%) | $43,750 |
| 1 Earner | 209 (31.4%) | $44,632 |
| 2 Earners | 191 (28.7%) | $96,406 |
| 3+ Earners | 39 (5.9%) | $150,288 |
| Total | 665 (100.0%) | $53,839 |
Household Income in Myrtle Point
Household Income Brackets in Myrtle Point
With 175 households falling in the category, the $35,000 to $49,999 income range is the most frequent in Myrtle Point, accounting for 15.5% of all households. In contrast, only 35 households (3.1%) fall into the $150,000 to $199,999 income bracket, making it the least populous group.
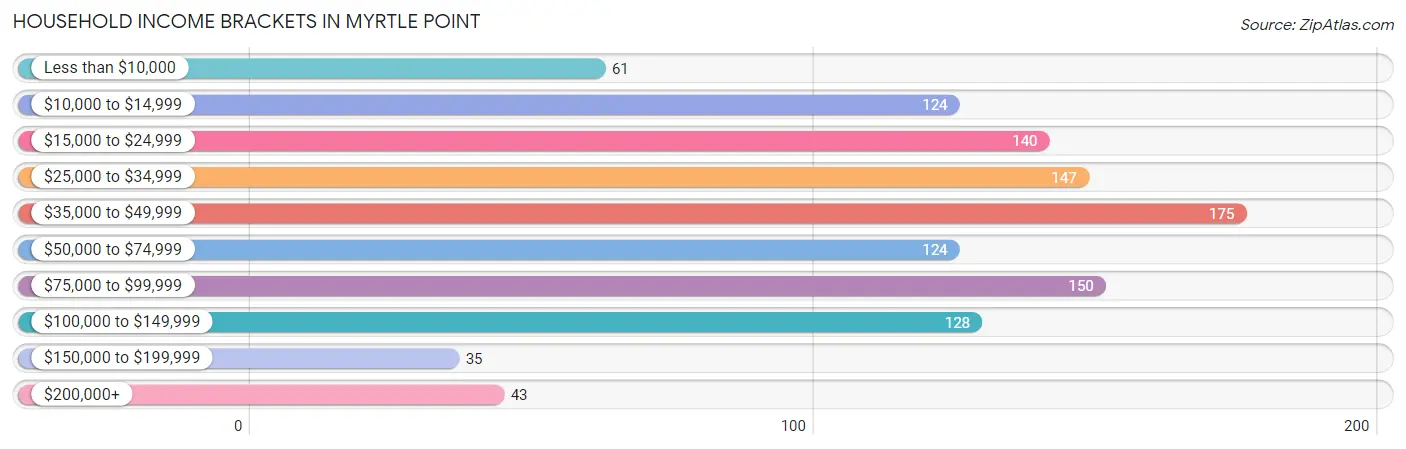
| Income Bracket | # Households | % Households |
| Less than $10,000 | 61 | 5.4% |
| $10,000 to $14,999 | 124 | 11.0% |
| $15,000 to $24,999 | 140 | 12.4% |
| $25,000 to $34,999 | 147 | 13.0% |
| $35,000 to $49,999 | 175 | 15.5% |
| $50,000 to $74,999 | 124 | 11.0% |
| $75,000 to $99,999 | 150 | 13.3% |
| $100,000 to $149,999 | 128 | 11.4% |
| $150,000 to $199,999 | 35 | 3.1% |
| $200,000+ | 43 | 3.8% |
Household Income by Householder Age in Myrtle Point
The median household income in Myrtle Point is $44,716, with the highest median household income of $55,670 found in the 25 to 44 years age bracket for the primary householder. A total of 245 households (21.7%) fall into this category. Meanwhile, the 15 to 24 years age bracket for the primary householder has the lowest median household income of $26,250, with 64 households (5.7%) in this group.
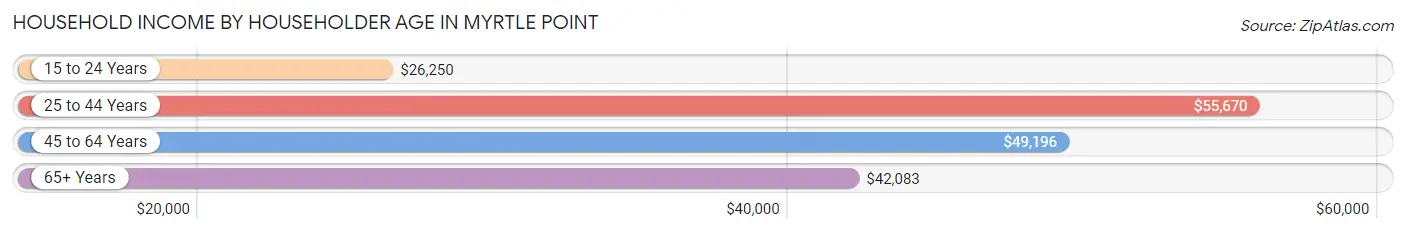
| Income Bracket | # Households | Median Income |
| 15 to 24 Years | 64 (5.7%) | $26,250 |
| 25 to 44 Years | 245 (21.7%) | $55,670 |
| 45 to 64 Years | 399 (35.4%) | $49,196 |
| 65+ Years | 419 (37.2%) | $42,083 |
| Total | 1,127 (100.0%) | $44,716 |
Poverty in Myrtle Point
Income Below Poverty by Sex and Age in Myrtle Point
With 19.8% poverty level for males and 25.8% for females among the residents of Myrtle Point, 35 to 44 year old males and 15 year old females are the most vulnerable to poverty, with 43 males (46.7%) and 32 females (100.0%) in their respective age groups living below the poverty level.
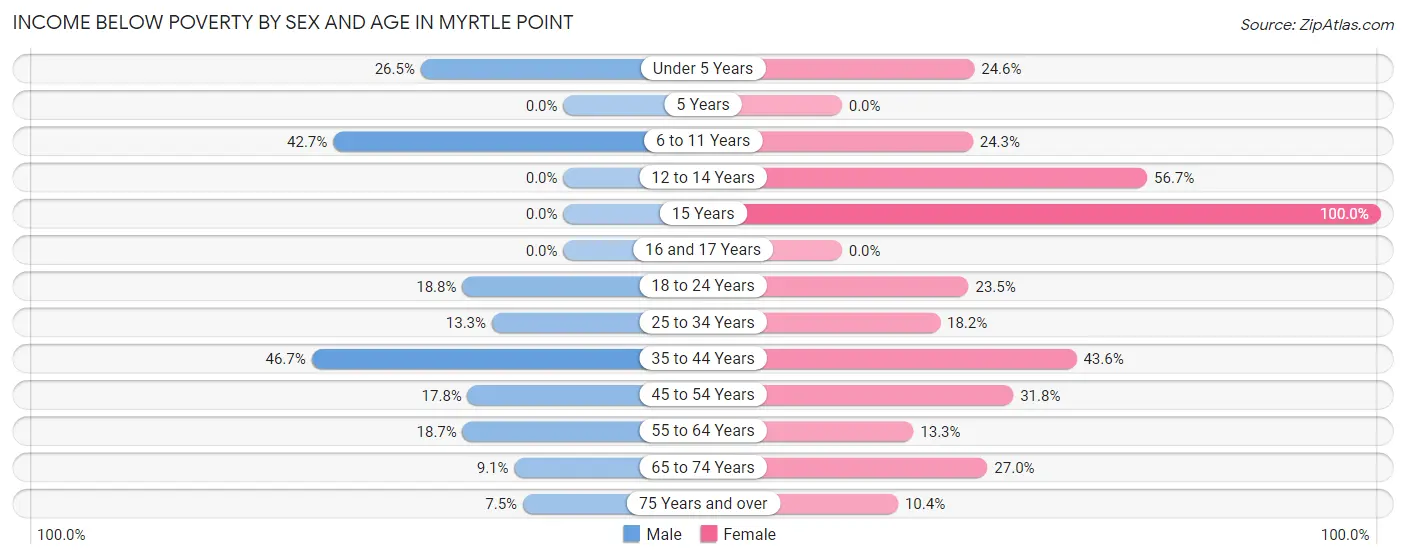
| Age Bracket | Male | Female |
| Under 5 Years | 18 (26.5%) | 30 (24.6%) |
| 5 Years | 0 (0.0%) | 0 (0.0%) |
| 6 to 11 Years | 50 (42.7%) | 9 (24.3%) |
| 12 to 14 Years | 0 (0.0%) | 34 (56.7%) |
| 15 Years | 0 (0.0%) | 32 (100.0%) |
| 16 and 17 Years | 0 (0.0%) | 0 (0.0%) |
| 18 to 24 Years | 15 (18.8%) | 28 (23.5%) |
| 25 to 34 Years | 26 (13.3%) | 27 (18.2%) |
| 35 to 44 Years | 43 (46.7%) | 44 (43.6%) |
| 45 to 54 Years | 27 (17.8%) | 42 (31.8%) |
| 55 to 64 Years | 49 (18.7%) | 32 (13.3%) |
| 65 to 74 Years | 12 (9.1%) | 50 (27.0%) |
| 75 Years and over | 12 (7.5%) | 12 (10.4%) |
| Total | 252 (19.8%) | 340 (25.8%) |
Income Above Poverty by Sex and Age in Myrtle Point
According to the poverty statistics in Myrtle Point, males aged 5 years and females aged 16 and 17 years are the age groups that are most secure financially, with 100.0% of males and 100.0% of females in these age groups living above the poverty line.
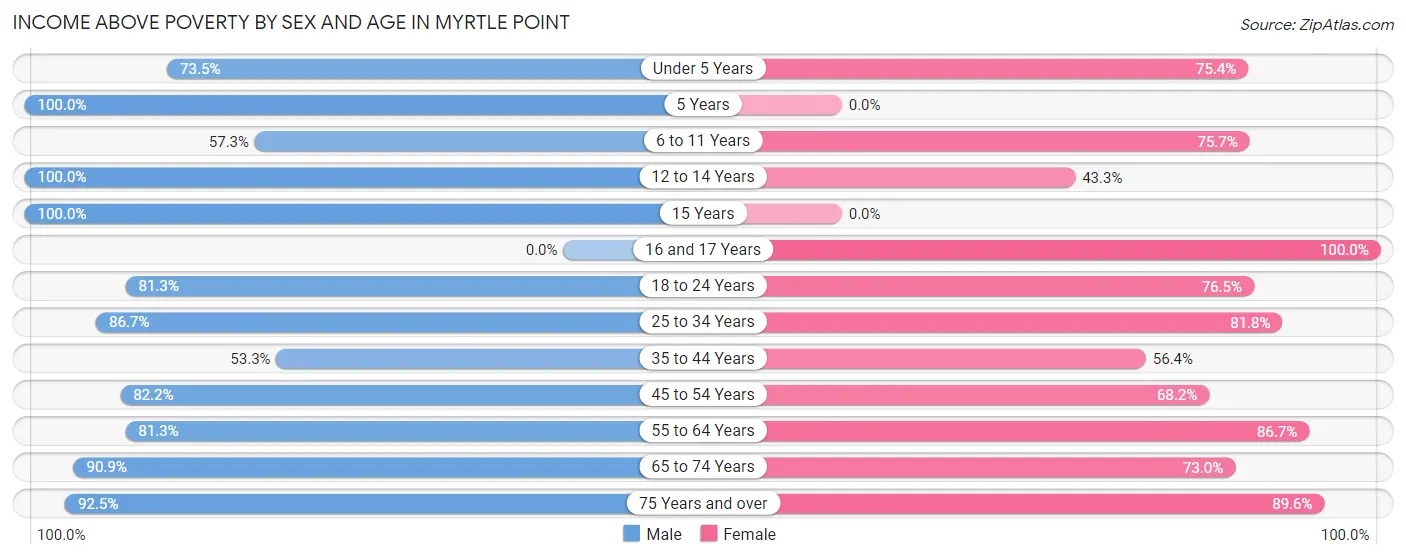
| Age Bracket | Male | Female |
| Under 5 Years | 50 (73.5%) | 92 (75.4%) |
| 5 Years | 4 (100.0%) | 0 (0.0%) |
| 6 to 11 Years | 67 (57.3%) | 28 (75.7%) |
| 12 to 14 Years | 4 (100.0%) | 26 (43.3%) |
| 15 Years | 7 (100.0%) | 0 (0.0%) |
| 16 and 17 Years | 0 (0.0%) | 24 (100.0%) |
| 18 to 24 Years | 65 (81.2%) | 91 (76.5%) |
| 25 to 34 Years | 170 (86.7%) | 121 (81.8%) |
| 35 to 44 Years | 49 (53.3%) | 57 (56.4%) |
| 45 to 54 Years | 125 (82.2%) | 90 (68.2%) |
| 55 to 64 Years | 213 (81.3%) | 209 (86.7%) |
| 65 to 74 Years | 120 (90.9%) | 135 (73.0%) |
| 75 Years and over | 148 (92.5%) | 103 (89.6%) |
| Total | 1,022 (80.2%) | 976 (74.2%) |
Income Below Poverty Among Married-Couple Families in Myrtle Point
The poverty statistics for married-couple families in Myrtle Point show that 12.1% or 61 of the total 504 families live below the poverty line. Families with 3 or 4 children have the highest poverty rate of 76.3%, comprising of 29 families. On the other hand, families with 1 or 2 children have the lowest poverty rate of 4.2%, which includes 5 families.
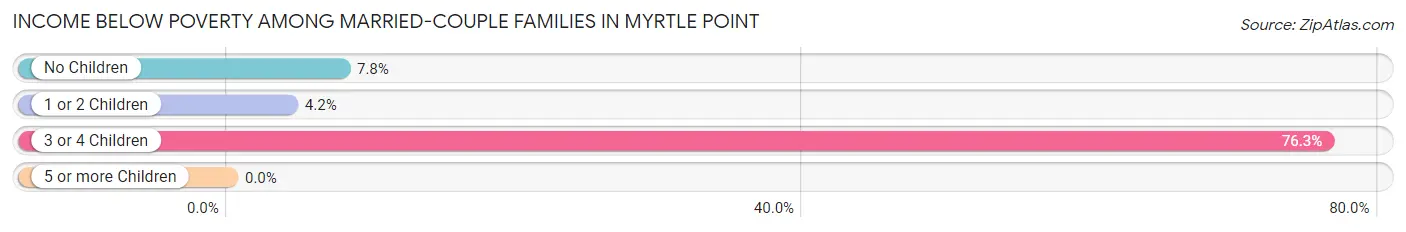
| Children | Above Poverty | Below Poverty |
| No Children | 319 (92.2%) | 27 (7.8%) |
| 1 or 2 Children | 115 (95.8%) | 5 (4.2%) |
| 3 or 4 Children | 9 (23.7%) | 29 (76.3%) |
| 5 or more Children | 0 (0.0%) | 0 (0.0%) |
| Total | 443 (87.9%) | 61 (12.1%) |
Income Below Poverty Among Single-Parent Households in Myrtle Point
According to the poverty data in Myrtle Point, 9.3% or 8 single-father households and 48.0% or 36 single-mother households are living below the poverty line. Among single-father households, those with 1 or 2 children have the highest poverty rate, with 6 households (33.3%) experiencing poverty. Likewise, among single-mother households, those with 1 or 2 children have the highest poverty rate, with 28 households (73.7%) falling below the poverty line.
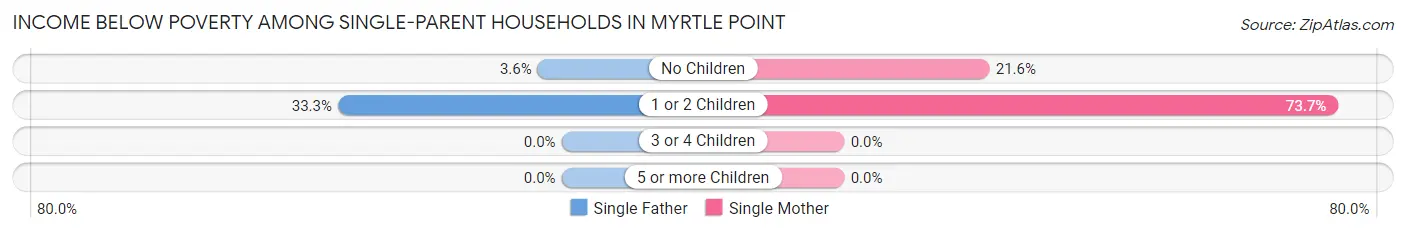
| Children | Single Father | Single Mother |
| No Children | 2 (3.6%) | 8 (21.6%) |
| 1 or 2 Children | 6 (33.3%) | 28 (73.7%) |
| 3 or 4 Children | 0 (0.0%) | 0 (0.0%) |
| 5 or more Children | 0 (0.0%) | 0 (0.0%) |
| Total | 8 (9.3%) | 36 (48.0%) |
Income Below Poverty Among Married-Couple vs Single-Parent Households in Myrtle Point
The poverty data for Myrtle Point shows that 61 of the married-couple family households (12.1%) and 44 of the single-parent households (27.3%) are living below the poverty level. Within the married-couple family households, those with 3 or 4 children have the highest poverty rate, with 29 households (76.3%) falling below the poverty line. Among the single-parent households, those with 1 or 2 children have the highest poverty rate, with 34 household (60.7%) living below poverty.
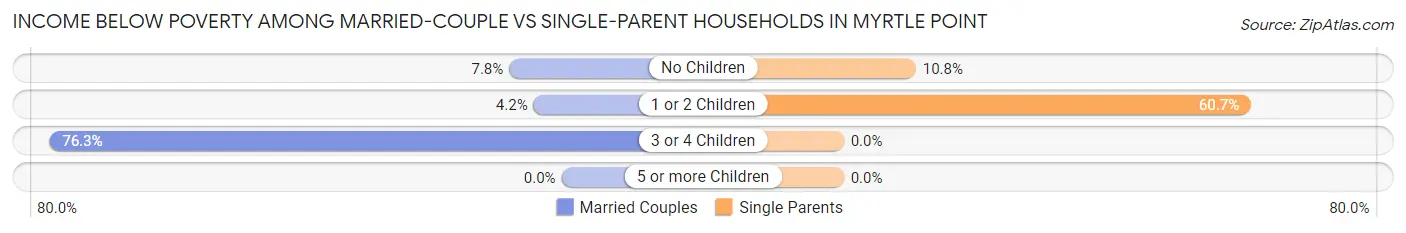
| Children | Married-Couple Families | Single-Parent Households |
| No Children | 27 (7.8%) | 10 (10.7%) |
| 1 or 2 Children | 5 (4.2%) | 34 (60.7%) |
| 3 or 4 Children | 29 (76.3%) | 0 (0.0%) |
| 5 or more Children | 0 (0.0%) | 0 (0.0%) |
| Total | 61 (12.1%) | 44 (27.3%) |
Race in Myrtle Point
The most populous races in Myrtle Point are White / Caucasian (2,284 | 84.9%), Two or more Races (290 | 10.8%), and Hispanic or Latino (137 | 5.1%).
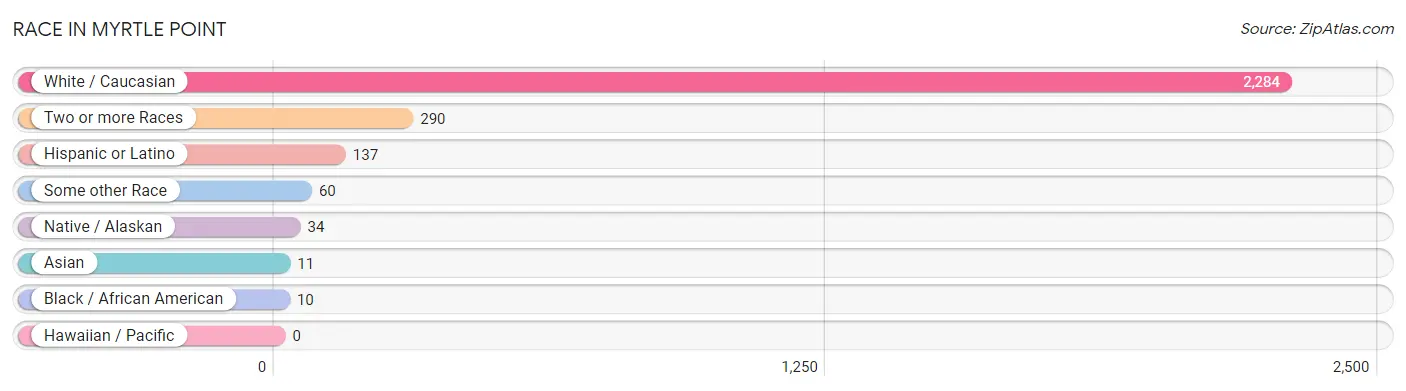
| Race | # Population | % Population |
| Asian | 11 | 0.4% |
| Black / African American | 10 | 0.4% |
| Hawaiian / Pacific | 0 | 0.0% |
| Hispanic or Latino | 137 | 5.1% |
| Native / Alaskan | 34 | 1.3% |
| White / Caucasian | 2,284 | 84.9% |
| Two or more Races | 290 | 10.8% |
| Some other Race | 60 | 2.2% |
| Total | 2,689 | 100.0% |
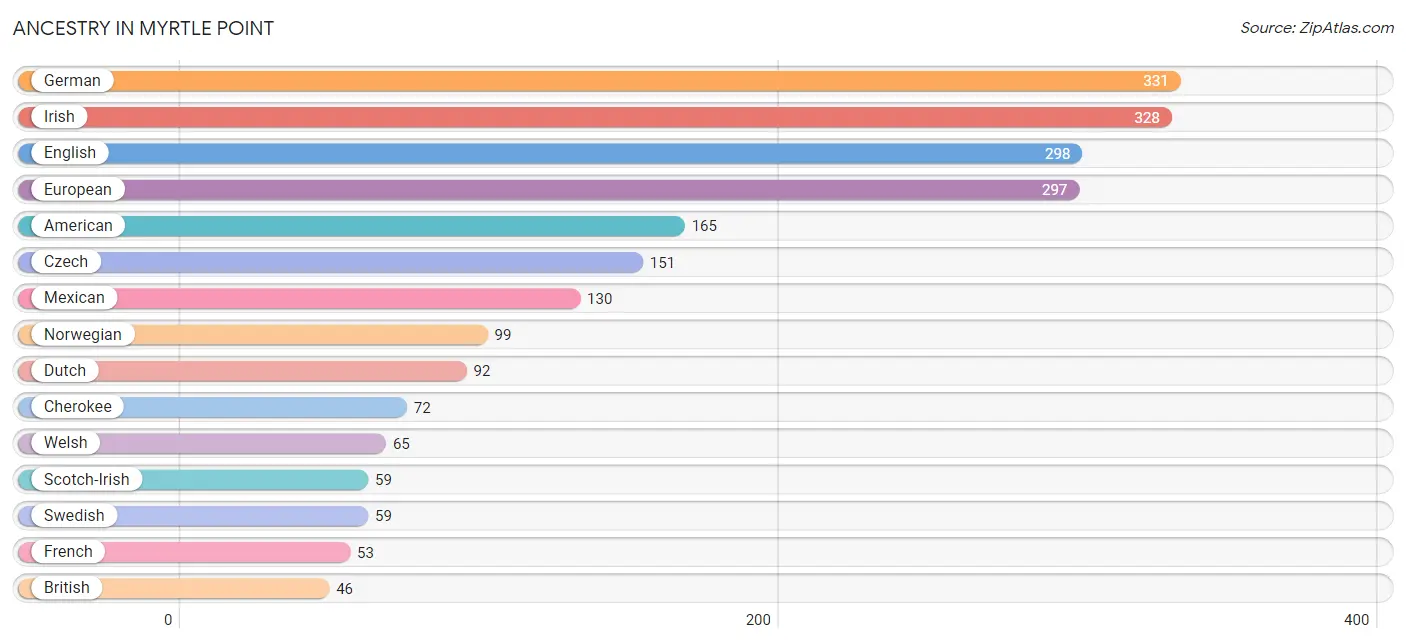
Ancestry in Myrtle Point
The most populous ancestries reported in Myrtle Point are German (331 | 12.3%), Irish (328 | 12.2%), English (298 | 11.1%), European (297 | 11.0%), and American (165 | 6.1%), together accounting for 52.8% of all Myrtle Point residents.
| Ancestry | # Population | % Population |
| American | 165 | 6.1% |
| Belgian | 8 | 0.3% |
| Blackfeet | 25 | 0.9% |
| British | 46 | 1.7% |
| Canadian | 6 | 0.2% |
| Cherokee | 72 | 2.7% |
| Chickasaw | 5 | 0.2% |
| Czech | 151 | 5.6% |
| Danish | 18 | 0.7% |
| Dutch | 92 | 3.4% |
| Eastern European | 7 | 0.3% |
| English | 298 | 11.1% |
| European | 297 | 11.0% |
| Fijian | 9 | 0.3% |
| French | 53 | 2.0% |
| French Canadian | 3 | 0.1% |
| German | 331 | 12.3% |
| Inupiat | 6 | 0.2% |
| Irish | 328 | 12.2% |
| Israeli | 7 | 0.3% |
| Italian | 18 | 0.7% |
| Korean | 11 | 0.4% |
| Mexican | 130 | 4.8% |
| Navajo | 1 | 0.0% |
| Norwegian | 99 | 3.7% |
| Polish | 21 | 0.8% |
| Puerto Rican | 6 | 0.2% |
| Russian | 6 | 0.2% |
| Scandinavian | 20 | 0.7% |
| Scotch-Irish | 59 | 2.2% |
| Scottish | 39 | 1.5% |
| Sioux | 17 | 0.6% |
| Spanish | 1 | 0.0% |
| Swedish | 59 | 2.2% |
| Thai | 7 | 0.3% |
| Ute | 1 | 0.0% |
| Welsh | 65 | 2.4% | View All 37 Rows |
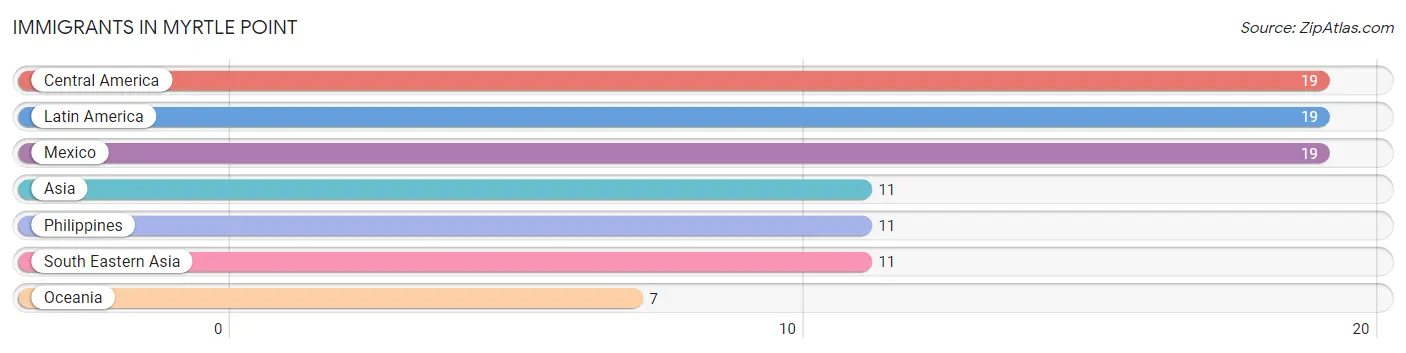
Immigrants in Myrtle Point
The most numerous immigrant groups reported in Myrtle Point came from Central America (19 | 0.7%), Latin America (19 | 0.7%), Mexico (19 | 0.7%), Asia (11 | 0.4%), and Philippines (11 | 0.4%), together accounting for 2.9% of all Myrtle Point residents.
| Immigration Origin | # Population | % Population |
| Asia | 11 | 0.4% |
| Central America | 19 | 0.7% |
| Latin America | 19 | 0.7% |
| Mexico | 19 | 0.7% |
| Oceania | 7 | 0.3% |
| Philippines | 11 | 0.4% |
| South Eastern Asia | 11 | 0.4% | View All 7 Rows |
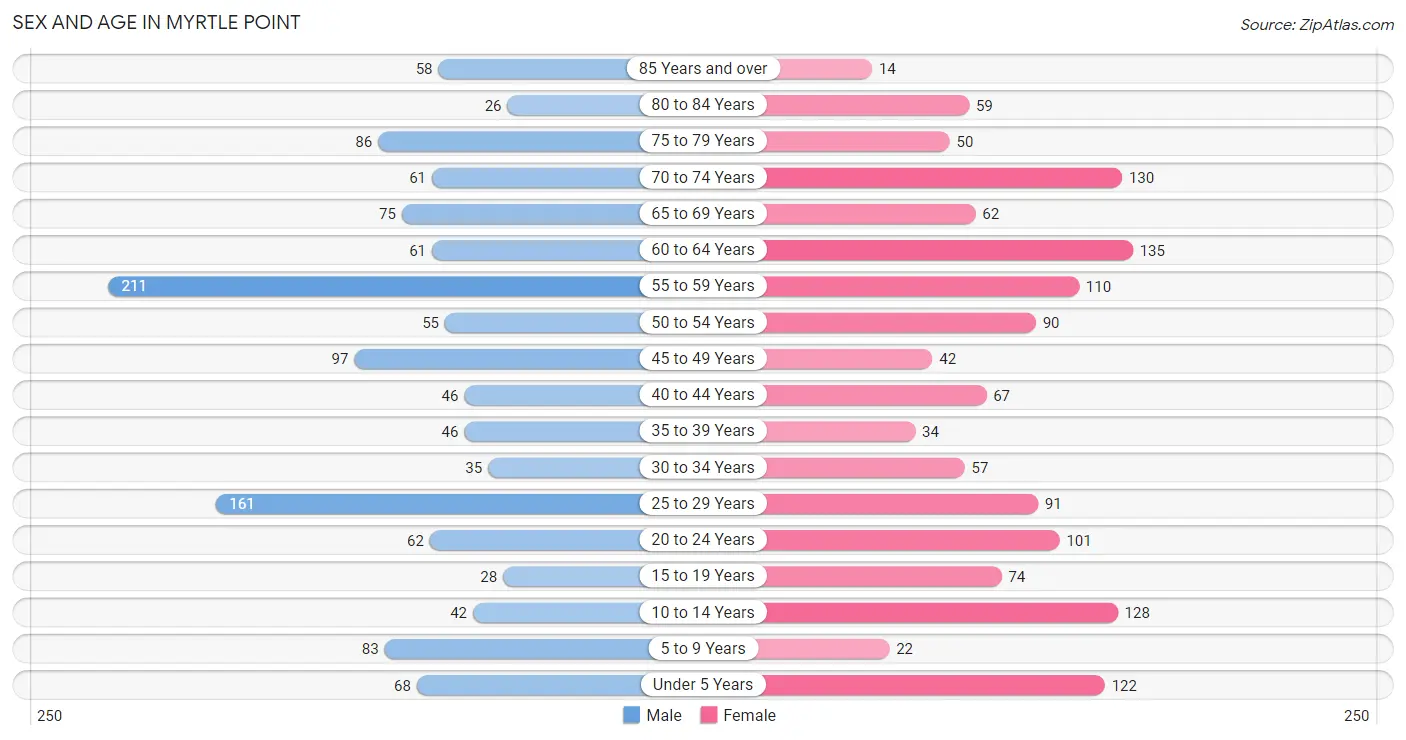
Sex and Age in Myrtle Point
Sex and Age in Myrtle Point
The most populous age groups in Myrtle Point are 55 to 59 Years (211 | 16.2%) for men and 60 to 64 Years (135 | 9.7%) for women.
| Age Bracket | Male | Female |
| Under 5 Years | 68 (5.2%) | 122 (8.8%) |
| 5 to 9 Years | 83 (6.4%) | 22 (1.6%) |
| 10 to 14 Years | 42 (3.2%) | 128 (9.2%) |
| 15 to 19 Years | 28 (2.1%) | 74 (5.3%) |
| 20 to 24 Years | 62 (4.8%) | 101 (7.3%) |
| 25 to 29 Years | 161 (12.4%) | 91 (6.6%) |
| 30 to 34 Years | 35 (2.7%) | 57 (4.1%) |
| 35 to 39 Years | 46 (3.5%) | 34 (2.5%) |
| 40 to 44 Years | 46 (3.5%) | 67 (4.8%) |
| 45 to 49 Years | 97 (7.5%) | 42 (3.0%) |
| 50 to 54 Years | 55 (4.2%) | 90 (6.5%) |
| 55 to 59 Years | 211 (16.2%) | 110 (7.9%) |
| 60 to 64 Years | 61 (4.7%) | 135 (9.7%) |
| 65 to 69 Years | 75 (5.8%) | 62 (4.5%) |
| 70 to 74 Years | 61 (4.7%) | 130 (9.4%) |
| 75 to 79 Years | 86 (6.6%) | 50 (3.6%) |
| 80 to 84 Years | 26 (2.0%) | 59 (4.3%) |
| 85 Years and over | 58 (4.5%) | 14 (1.0%) |
| Total | 1,301 (100.0%) | 1,388 (100.0%) |
Families and Households in Myrtle Point
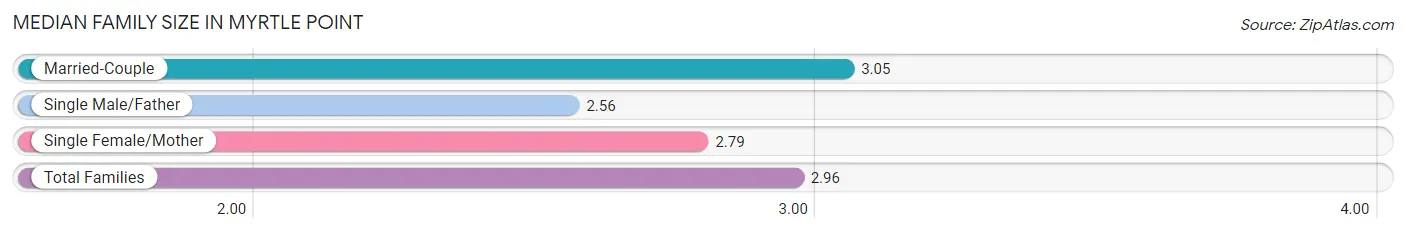
Median Family Size in Myrtle Point
The median family size in Myrtle Point is 2.96 persons per family, with married-couple families (504 | 75.8%) accounting for the largest median family size of 3.05 persons per family. On the other hand, single male/father families (86 | 12.9%) represent the smallest median family size with 2.56 persons per family.
| Family Type | # Families | Family Size |
| Married-Couple | 504 (75.8%) | 3.05 |
| Single Male/Father | 86 (12.9%) | 2.56 |
| Single Female/Mother | 75 (11.3%) | 2.79 |
| Total Families | 665 (100.0%) | 2.96 |
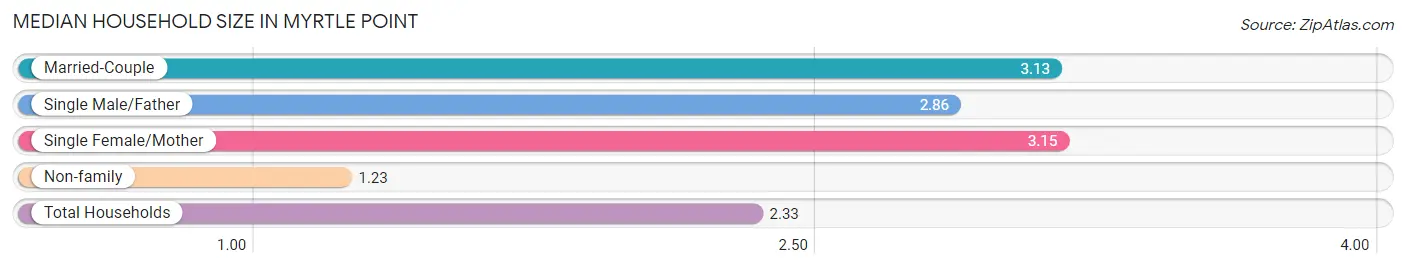
Median Household Size in Myrtle Point
The median household size in Myrtle Point is 2.33 persons per household, with single female/mother households (75 | 6.7%) accounting for the largest median household size of 3.15 persons per household. non-family households (462 | 41.0%) represent the smallest median household size with 1.23 persons per household.
| Household Type | # Households | Household Size |
| Married-Couple | 504 (44.7%) | 3.13 |
| Single Male/Father | 86 (7.6%) | 2.86 |
| Single Female/Mother | 75 (6.7%) | 3.15 |
| Non-family | 462 (41.0%) | 1.23 |
| Total Households | 1,127 (100.0%) | 2.33 |
Household Size by Marriage Status in Myrtle Point
Out of a total of 1,127 households in Myrtle Point, 665 (59.0%) are family households, while 462 (41.0%) are nonfamily households. The most numerous type of family households are 2-person households, comprising 354, and the most common type of nonfamily households are 1-person households, comprising 346.
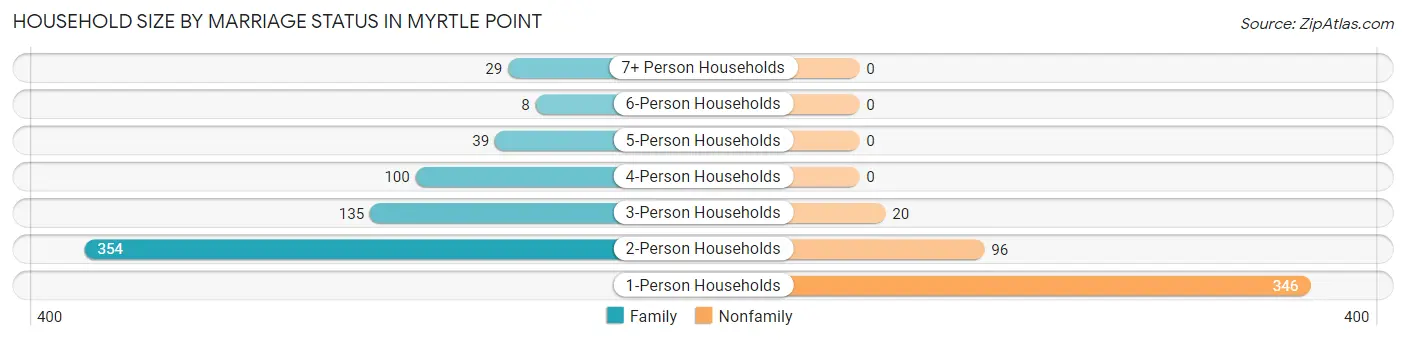
| Household Size | Family Households | Nonfamily Households |
| 1-Person Households | - | 346 (30.7%) |
| 2-Person Households | 354 (31.4%) | 96 (8.5%) |
| 3-Person Households | 135 (12.0%) | 20 (1.8%) |
| 4-Person Households | 100 (8.9%) | 0 (0.0%) |
| 5-Person Households | 39 (3.5%) | 0 (0.0%) |
| 6-Person Households | 8 (0.7%) | 0 (0.0%) |
| 7+ Person Households | 29 (2.6%) | 0 (0.0%) |
| Total | 665 (59.0%) | 462 (41.0%) |
Female Fertility in Myrtle Point
Fertility by Age in Myrtle Point
Average fertility rate in Myrtle Point is 33.0 births per 1,000 women. Women in the age bracket of 15 to 19 years have the highest fertility rate with 108.0 births per 1,000 women. Women in the age bracket of 15 to 19 years acount for 50.0% of all women with births.
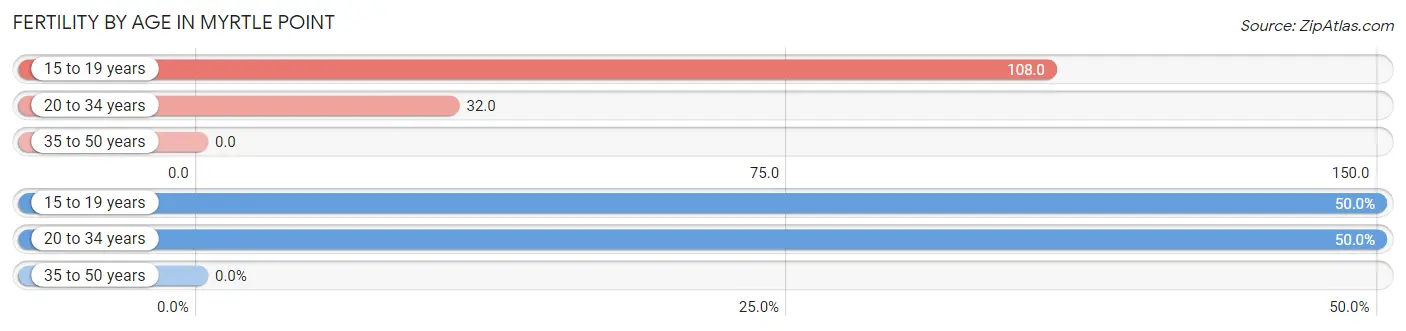
| Age Bracket | Women with Births | Births / 1,000 Women |
| 15 to 19 years | 8 (50.0%) | 108.0 |
| 20 to 34 years | 8 (50.0%) | 32.0 |
| 35 to 50 years | 0 (0.0%) | 0.0 |
| Total | 16 (100.0%) | 33.0 |
Fertility by Age by Marriage Status in Myrtle Point
50.0% of women with births (16) in Myrtle Point are married. The highest percentage of unmarried women with births falls into 15 to 19 years age bracket with 100.0% of them unmarried at the time of birth, while the lowest percentage of unmarried women with births belong to 20 to 34 years age bracket with 0.0% of them unmarried.
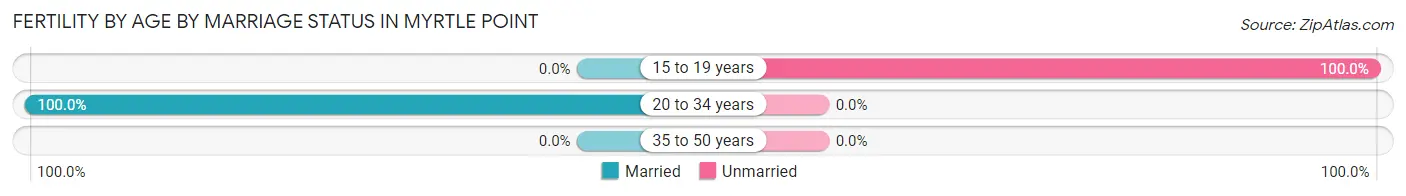
| Age Bracket | Married | Unmarried |
| 15 to 19 years | 0 (0.0%) | 8 (100.0%) |
| 20 to 34 years | 8 (100.0%) | 0 (0.0%) |
| 35 to 50 years | 0 (0.0%) | 0 (0.0%) |
| Total | 8 (50.0%) | 8 (50.0%) |
Fertility by Education in Myrtle Point
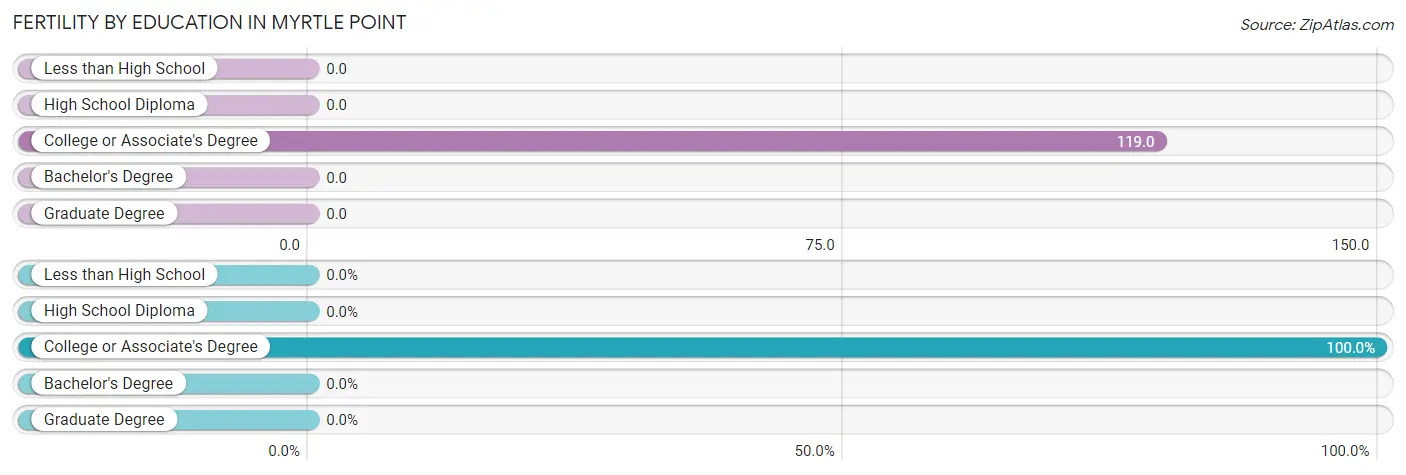
| Educational Attainment | Women with Births | Births / 1,000 Women |
| Less than High School | 0 (0.0%) | 0.0 |
| High School Diploma | 0 (0.0%) | 0.0 |
| College or Associate's Degree | 16 (100.0%) | 119.0 |
| Bachelor's Degree | 0 (0.0%) | 0.0 |
| Graduate Degree | 0 (0.0%) | 0.0 |
| Total | 16 (100.0%) | 33.0 |
Fertility by Education by Marriage Status in Myrtle Point
50.0% of women with births in Myrtle Point are unmarried. Women with the educational attainment of college or associate's degree are most likely to be married with 50.0% of them married at childbirth, while women with the educational attainment of college or associate's degree are least likely to be married with 50.0% of them unmarried at childbirth.
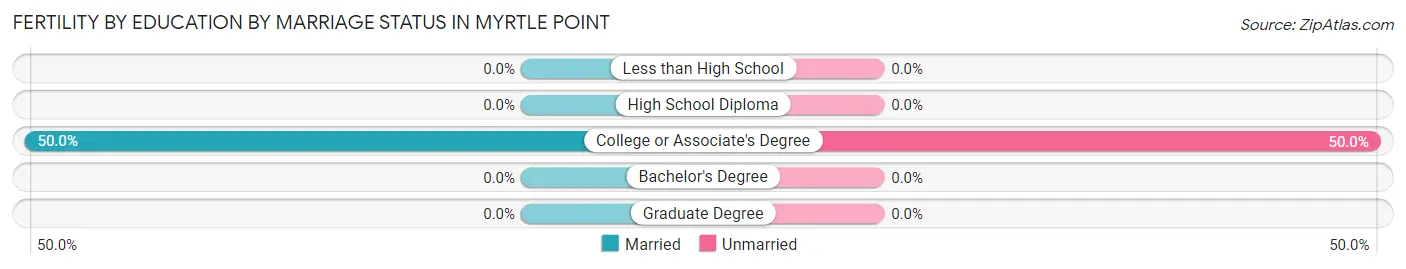
| Educational Attainment | Married | Unmarried |
| Less than High School | 0 (0.0%) | 0 (0.0%) |
| High School Diploma | 0 (0.0%) | 0 (0.0%) |
| College or Associate's Degree | 8 (50.0%) | 8 (50.0%) |
| Bachelor's Degree | 0 (0.0%) | 0 (0.0%) |
| Graduate Degree | 0 (0.0%) | 0 (0.0%) |
| Total | 8 (50.0%) | 8 (50.0%) |
Employment Characteristics in Myrtle Point
Employment by Class of Employer in Myrtle Point
Among the 864 employed individuals in Myrtle Point, private company employees (581 | 67.2%), not-for-profit organizations (91 | 10.5%), and self-employed (not incorporated) (66 | 7.6%) make up the most common classes of employment.
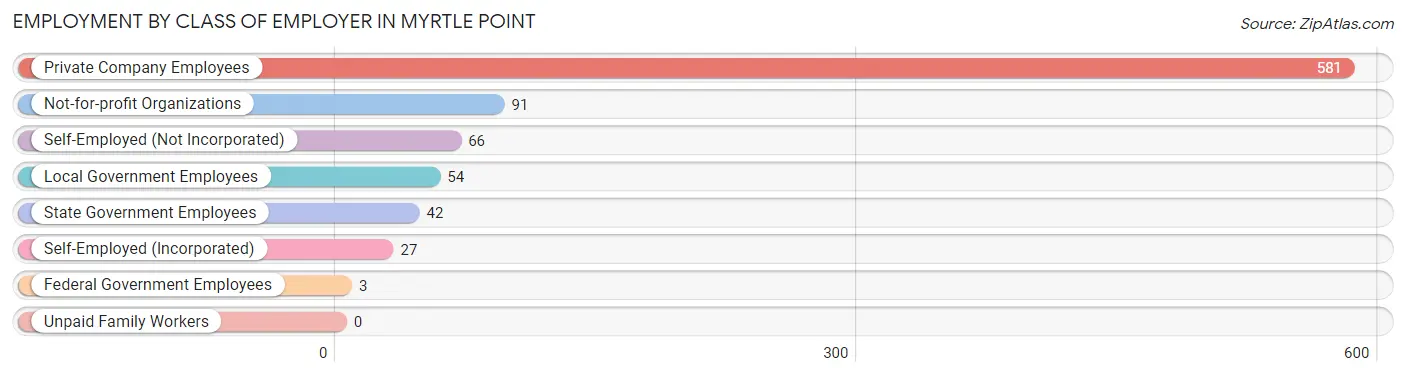
| Employer Class | # Employees | % Employees |
| Private Company Employees | 581 | 67.2% |
| Self-Employed (Incorporated) | 27 | 3.1% |
| Self-Employed (Not Incorporated) | 66 | 7.6% |
| Not-for-profit Organizations | 91 | 10.5% |
| Local Government Employees | 54 | 6.2% |
| State Government Employees | 42 | 4.9% |
| Federal Government Employees | 3 | 0.4% |
| Unpaid Family Workers | 0 | 0.0% |
| Total | 864 | 100.0% |
Employment Status by Age in Myrtle Point
According to the labor force statistics for Myrtle Point, out of the total population over 16 years of age (2,185), 44.1% or 964 individuals are in the labor force, with 10.3% or 99 of them unemployed. The age group with the highest labor force participation rate is 30 to 34 years, with 96.7% or 89 individuals in the labor force. Within the labor force, the 16 to 19 years age range has the highest percentage of unemployed individuals, with 33.3% or 6 of them being unemployed.
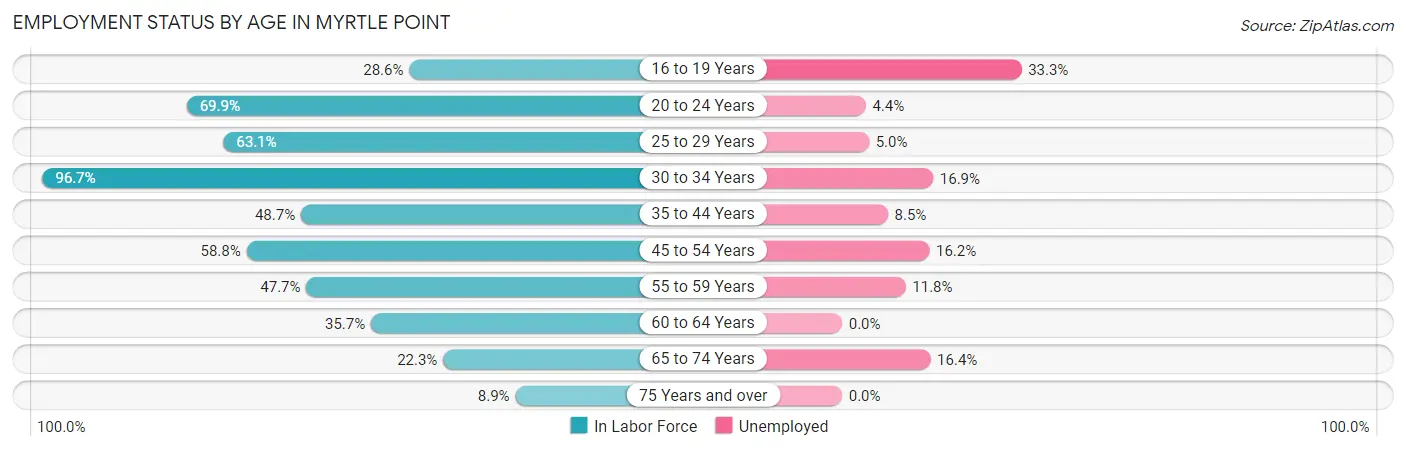
| Age Bracket | In Labor Force | Unemployed |
| 16 to 19 Years | 18 (28.6%) | 6 (33.3%) |
| 20 to 24 Years | 114 (69.9%) | 5 (4.4%) |
| 25 to 29 Years | 159 (63.1%) | 8 (5.0%) |
| 30 to 34 Years | 89 (96.7%) | 15 (16.9%) |
| 35 to 44 Years | 94 (48.7%) | 8 (8.5%) |
| 45 to 54 Years | 167 (58.8%) | 27 (16.2%) |
| 55 to 59 Years | 153 (47.7%) | 18 (11.8%) |
| 60 to 64 Years | 70 (35.7%) | 0 (0.0%) |
| 65 to 74 Years | 73 (22.3%) | 12 (16.4%) |
| 75 Years and over | 26 (8.9%) | 0 (0.0%) |
| Total | 964 (44.1%) | 99 (10.3%) |
Employment Status by Educational Attainment in Myrtle Point
According to labor force statistics for Myrtle Point, 54.7% of individuals (732) out of the total population between 25 and 64 years of age (1,338) are in the labor force, with 10.4% or 76 of them being unemployed. The group with the highest labor force participation rate are those with the educational attainment of bachelor's degree or higher, with 69.9% or 153 individuals in the labor force. Within the labor force, individuals with less than high school education have the highest percentage of unemployment, with 33.3% or 21 of them being unemployed.
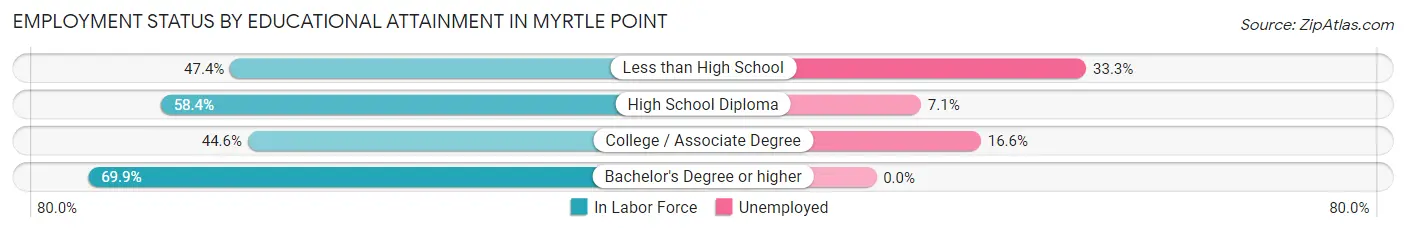
| Educational Attainment | In Labor Force | Unemployed |
| Less than High School | 63 (47.4%) | 44 (33.3%) |
| High School Diploma | 323 (58.4%) | 39 (7.1%) |
| College / Associate Degree | 193 (44.6%) | 72 (16.6%) |
| Bachelor's Degree or higher | 153 (69.9%) | 0 (0.0%) |
| Total | 732 (54.7%) | 139 (10.4%) |
Employment Occupations by Sex in Myrtle Point
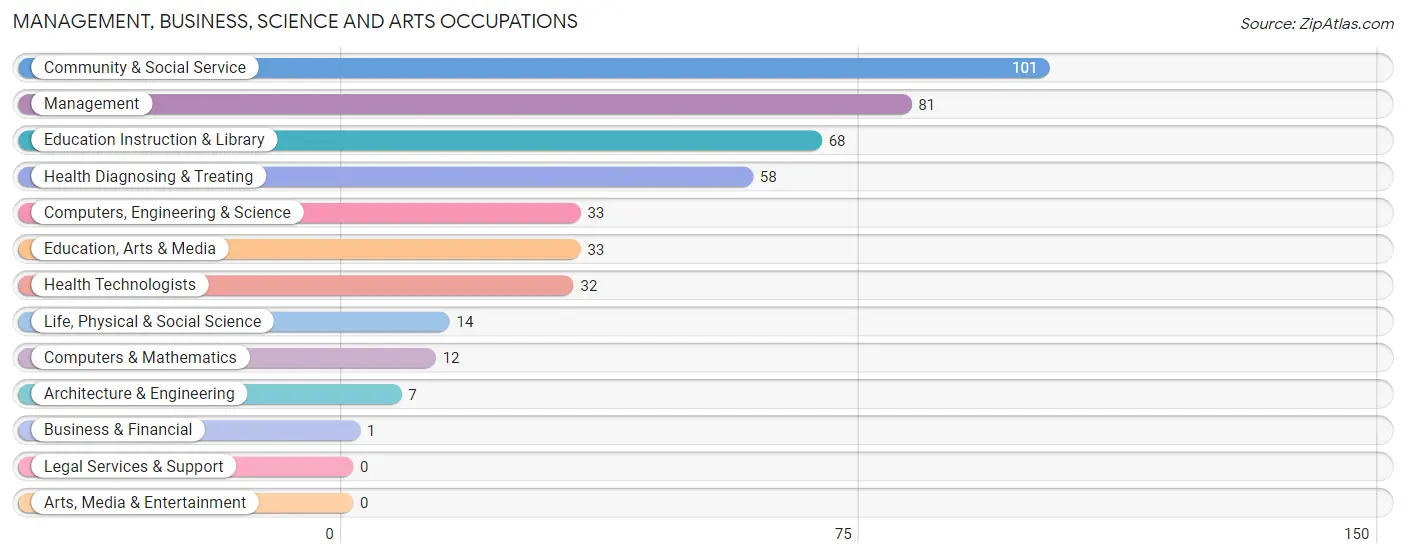
Management, Business, Science and Arts Occupations
The most common Management, Business, Science and Arts occupations in Myrtle Point are Community & Social Service (101 | 11.7%), Management (81 | 9.4%), Education Instruction & Library (68 | 7.9%), Health Diagnosing & Treating (58 | 6.7%), and Computers, Engineering & Science (33 | 3.8%).
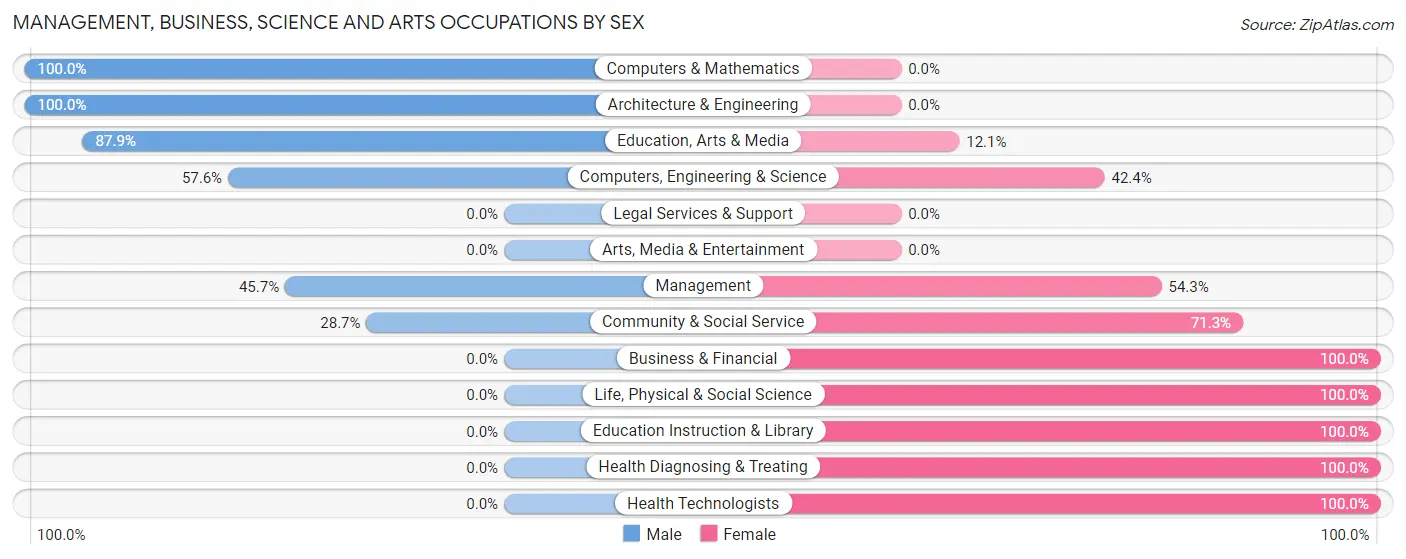
Management, Business, Science and Arts Occupations by Sex
Within the Management, Business, Science and Arts occupations in Myrtle Point, the most male-oriented occupations are Computers & Mathematics (100.0%), Architecture & Engineering (100.0%), and Education, Arts & Media (87.9%), while the most female-oriented occupations are Business & Financial (100.0%), Life, Physical & Social Science (100.0%), and Education Instruction & Library (100.0%).
| Occupation | Male | Female |
| Management | 37 (45.7%) | 44 (54.3%) |
| Business & Financial | 0 (0.0%) | 1 (100.0%) |
| Computers, Engineering & Science | 19 (57.6%) | 14 (42.4%) |
| Computers & Mathematics | 12 (100.0%) | 0 (0.0%) |
| Architecture & Engineering | 7 (100.0%) | 0 (0.0%) |
| Life, Physical & Social Science | 0 (0.0%) | 14 (100.0%) |
| Community & Social Service | 29 (28.7%) | 72 (71.3%) |
| Education, Arts & Media | 29 (87.9%) | 4 (12.1%) |
| Legal Services & Support | 0 (0.0%) | 0 (0.0%) |
| Education Instruction & Library | 0 (0.0%) | 68 (100.0%) |
| Arts, Media & Entertainment | 0 (0.0%) | 0 (0.0%) |
| Health Diagnosing & Treating | 0 (0.0%) | 58 (100.0%) |
| Health Technologists | 0 (0.0%) | 32 (100.0%) |
| Total (Category) | 85 (31.0%) | 189 (69.0%) |
| Total (Overall) | 450 (52.1%) | 414 (47.9%) |
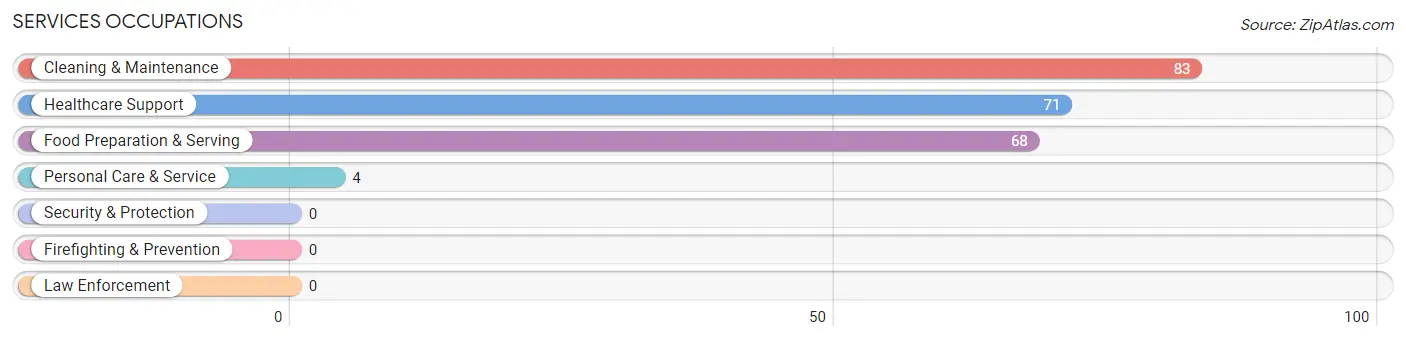
Services Occupations
The most common Services occupations in Myrtle Point are Cleaning & Maintenance (83 | 9.6%), Healthcare Support (71 | 8.2%), Food Preparation & Serving (68 | 7.9%), and Personal Care & Service (4 | 0.5%).
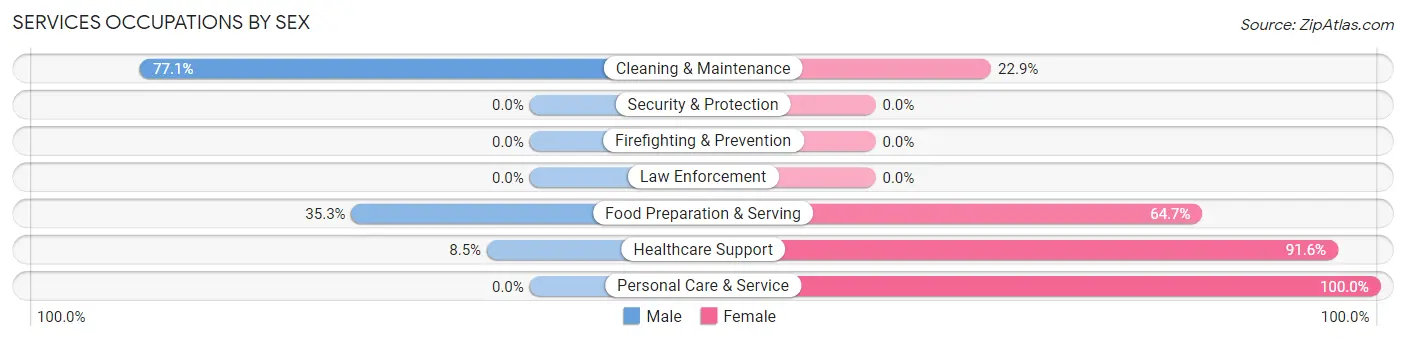
Services Occupations by Sex
Within the Services occupations in Myrtle Point, the most male-oriented occupations are Cleaning & Maintenance (77.1%), Food Preparation & Serving (35.3%), and Healthcare Support (8.5%), while the most female-oriented occupations are Personal Care & Service (100.0%), Healthcare Support (91.5%), and Food Preparation & Serving (64.7%).
| Occupation | Male | Female |
| Healthcare Support | 6 (8.5%) | 65 (91.5%) |
| Security & Protection | 0 (0.0%) | 0 (0.0%) |
| Firefighting & Prevention | 0 (0.0%) | 0 (0.0%) |
| Law Enforcement | 0 (0.0%) | 0 (0.0%) |
| Food Preparation & Serving | 24 (35.3%) | 44 (64.7%) |
| Cleaning & Maintenance | 64 (77.1%) | 19 (22.9%) |
| Personal Care & Service | 0 (0.0%) | 4 (100.0%) |
| Total (Category) | 94 (41.6%) | 132 (58.4%) |
| Total (Overall) | 450 (52.1%) | 414 (47.9%) |
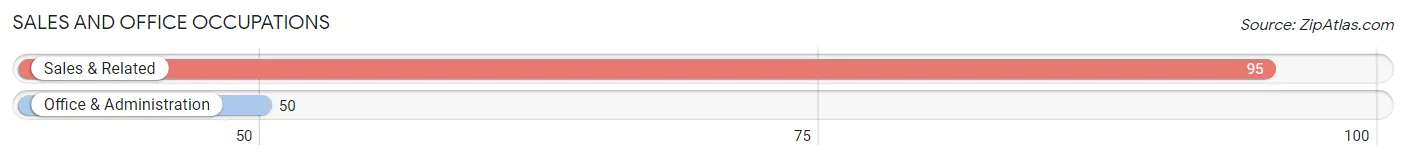
Sales and Office Occupations
The most common Sales and Office occupations in Myrtle Point are Sales & Related (95 | 11.0%), and Office & Administration (50 | 5.8%).
Sales and Office Occupations by Sex
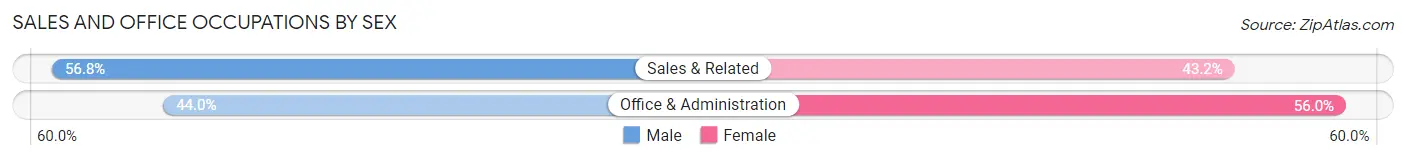
| Occupation | Male | Female |
| Sales & Related | 54 (56.8%) | 41 (43.2%) |
| Office & Administration | 22 (44.0%) | 28 (56.0%) |
| Total (Category) | 76 (52.4%) | 69 (47.6%) |
| Total (Overall) | 450 (52.1%) | 414 (47.9%) |
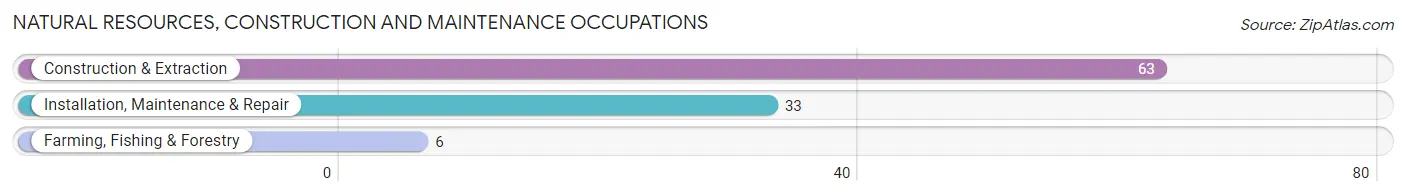
Natural Resources, Construction and Maintenance Occupations
The most common Natural Resources, Construction and Maintenance occupations in Myrtle Point are Construction & Extraction (63 | 7.3%), Installation, Maintenance & Repair (33 | 3.8%), and Farming, Fishing & Forestry (6 | 0.7%).
Natural Resources, Construction and Maintenance Occupations by Sex
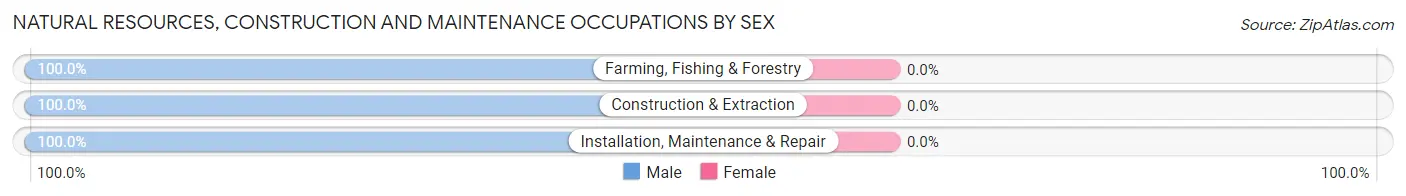
| Occupation | Male | Female |
| Farming, Fishing & Forestry | 6 (100.0%) | 0 (0.0%) |
| Construction & Extraction | 63 (100.0%) | 0 (0.0%) |
| Installation, Maintenance & Repair | 33 (100.0%) | 0 (0.0%) |
| Total (Category) | 102 (100.0%) | 0 (0.0%) |
| Total (Overall) | 450 (52.1%) | 414 (47.9%) |
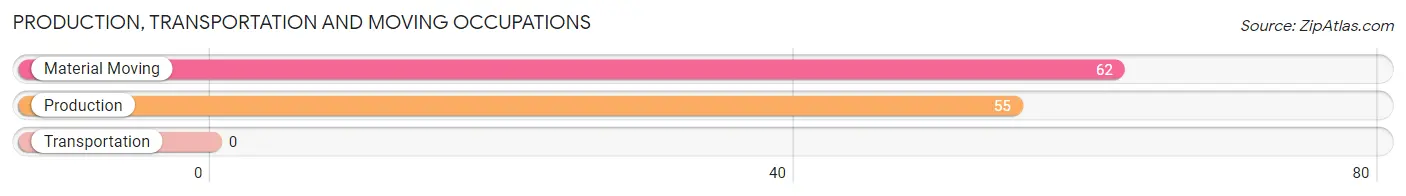
Production, Transportation and Moving Occupations
The most common Production, Transportation and Moving occupations in Myrtle Point are Material Moving (62 | 7.2%), and Production (55 | 6.4%).
Production, Transportation and Moving Occupations by Sex
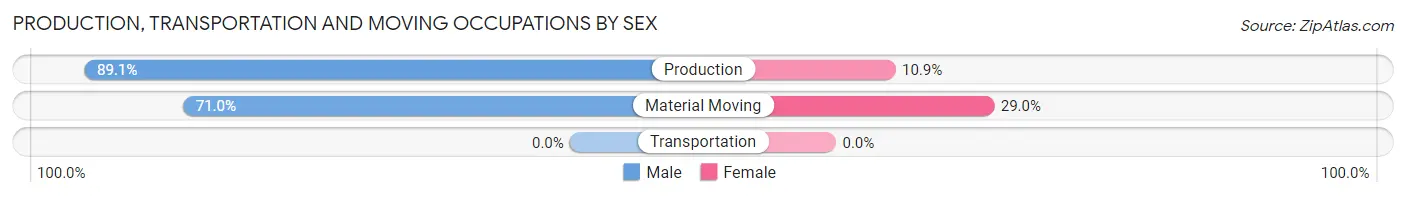
| Occupation | Male | Female |
| Production | 49 (89.1%) | 6 (10.9%) |
| Transportation | 0 (0.0%) | 0 (0.0%) |
| Material Moving | 44 (71.0%) | 18 (29.0%) |
| Total (Category) | 93 (79.5%) | 24 (20.5%) |
| Total (Overall) | 450 (52.1%) | 414 (47.9%) |
Employment Industries by Sex in Myrtle Point
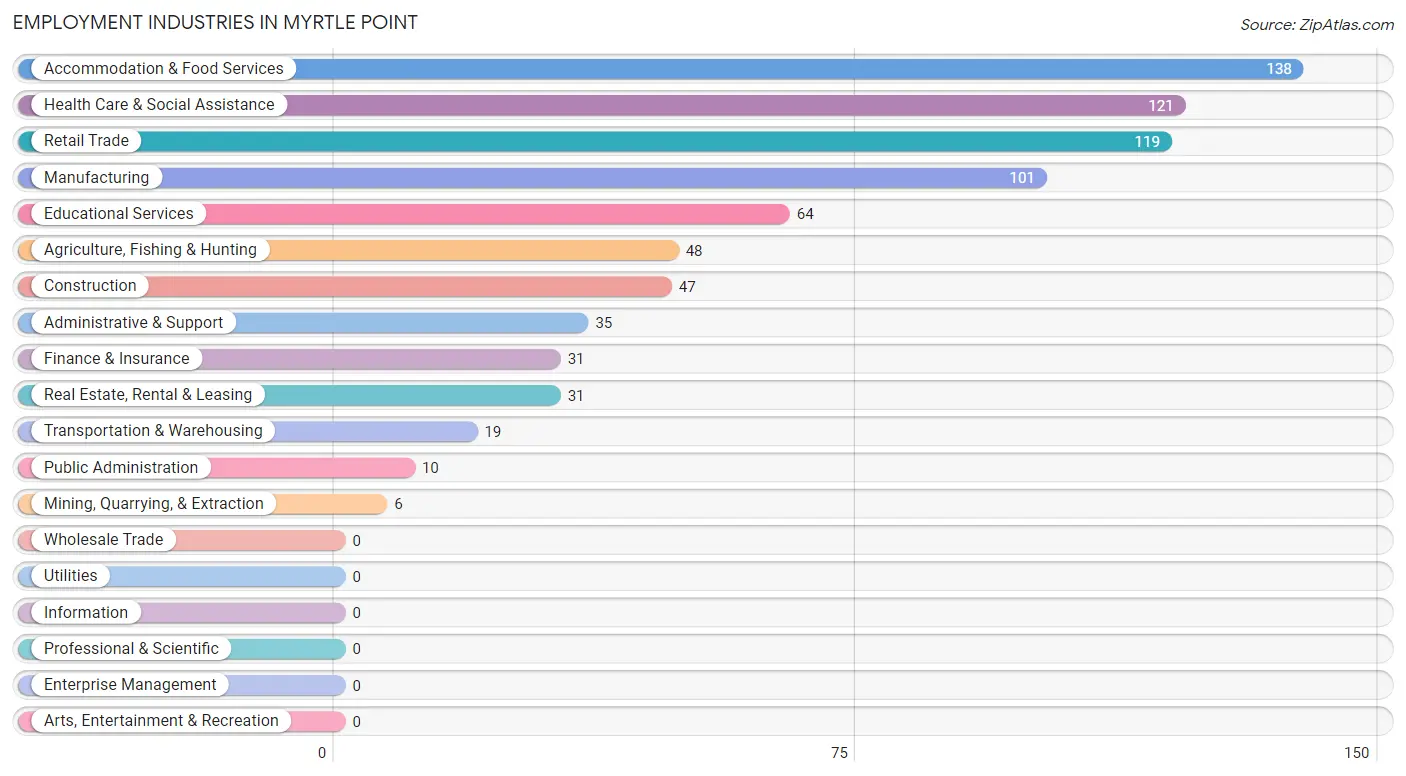
Employment Industries in Myrtle Point
The major employment industries in Myrtle Point include Accommodation & Food Services (138 | 16.0%), Health Care & Social Assistance (121 | 14.0%), Retail Trade (119 | 13.8%), Manufacturing (101 | 11.7%), and Educational Services (64 | 7.4%).
Employment Industries by Sex in Myrtle Point
The Myrtle Point industries that see more men than women are Agriculture, Fishing & Hunting (100.0%), Mining, Quarrying, & Extraction (100.0%), and Construction (100.0%), whereas the industries that tend to have a higher number of women are Educational Services (100.0%), Public Administration (100.0%), and Health Care & Social Assistance (95.0%).
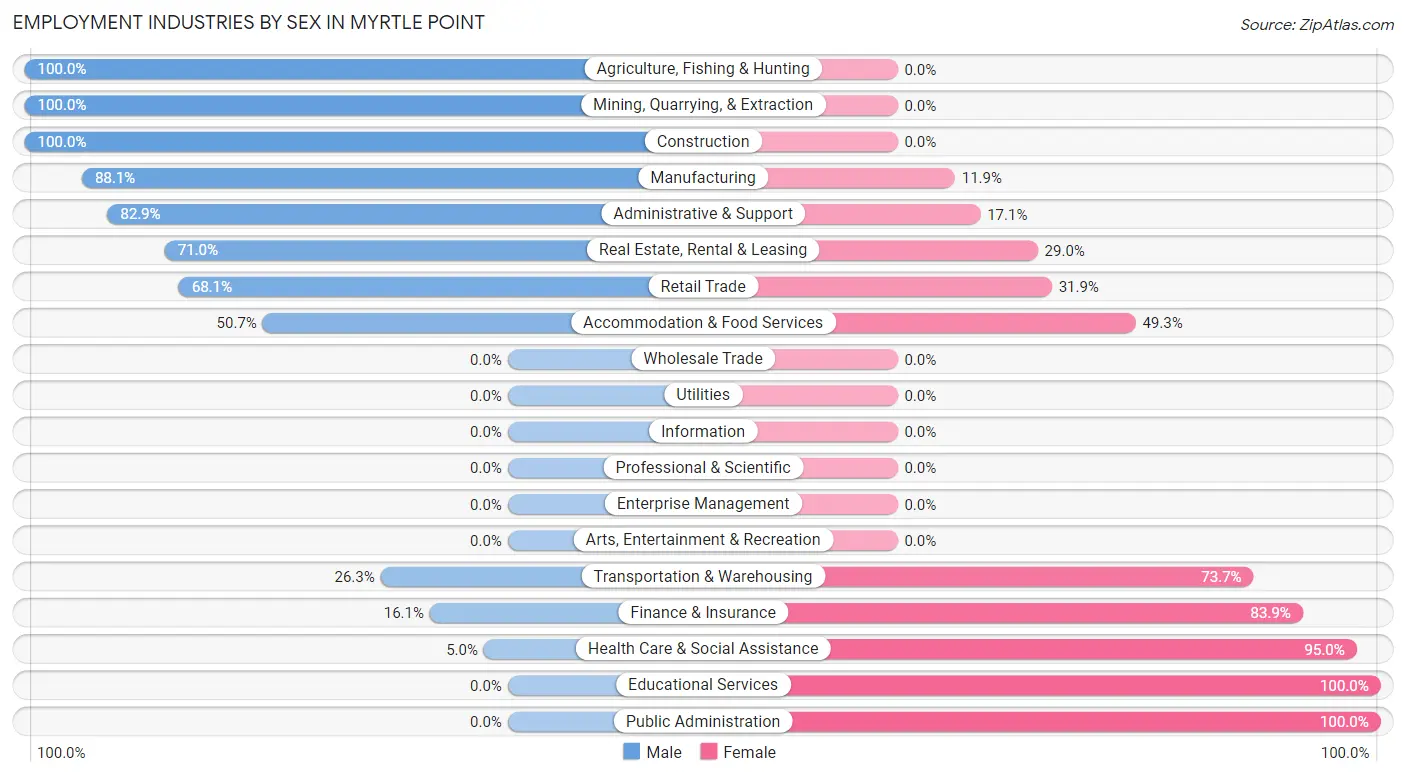
| Industry | Male | Female |
| Agriculture, Fishing & Hunting | 48 (100.0%) | 0 (0.0%) |
| Mining, Quarrying, & Extraction | 6 (100.0%) | 0 (0.0%) |
| Construction | 47 (100.0%) | 0 (0.0%) |
| Manufacturing | 89 (88.1%) | 12 (11.9%) |
| Wholesale Trade | 0 (0.0%) | 0 (0.0%) |
| Retail Trade | 81 (68.1%) | 38 (31.9%) |
| Transportation & Warehousing | 5 (26.3%) | 14 (73.7%) |
| Utilities | 0 (0.0%) | 0 (0.0%) |
| Information | 0 (0.0%) | 0 (0.0%) |
| Finance & Insurance | 5 (16.1%) | 26 (83.9%) |
| Real Estate, Rental & Leasing | 22 (71.0%) | 9 (29.0%) |
| Professional & Scientific | 0 (0.0%) | 0 (0.0%) |
| Enterprise Management | 0 (0.0%) | 0 (0.0%) |
| Administrative & Support | 29 (82.9%) | 6 (17.1%) |
| Educational Services | 0 (0.0%) | 64 (100.0%) |
| Health Care & Social Assistance | 6 (5.0%) | 115 (95.0%) |
| Arts, Entertainment & Recreation | 0 (0.0%) | 0 (0.0%) |
| Accommodation & Food Services | 70 (50.7%) | 68 (49.3%) |
| Public Administration | 0 (0.0%) | 10 (100.0%) |
| Total | 450 (52.1%) | 414 (47.9%) |
Education in Myrtle Point
School Enrollment in Myrtle Point
The most common levels of schooling among the 404 students in Myrtle Point are middle school (107 | 26.5%), elementary school (102 | 25.3%), and high school (82 | 20.3%).
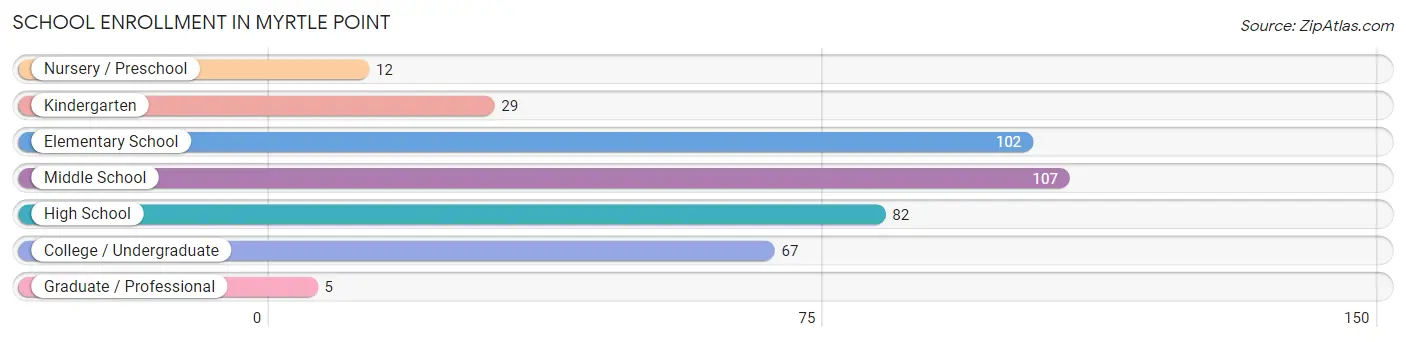
| School Level | # Students | % Students |
| Nursery / Preschool | 12 | 3.0% |
| Kindergarten | 29 | 7.2% |
| Elementary School | 102 | 25.3% |
| Middle School | 107 | 26.5% |
| High School | 82 | 20.3% |
| College / Undergraduate | 67 | 16.6% |
| Graduate / Professional | 5 | 1.2% |
| Total | 404 | 100.0% |
School Enrollment by Age by Funding Source in Myrtle Point
Out of a total of 404 students who are enrolled in schools in Myrtle Point, 47 (11.6%) attend a private institution, while the remaining 357 (88.4%) are enrolled in public schools. The age group of 25 to 34 year olds has the highest likelihood of being enrolled in private schools, with 4 (100.0% in the age bracket) enrolled. Conversely, the age group of 3 to 4 year olds has the lowest likelihood of being enrolled in a private school, with 12 (100.0% in the age bracket) attending a public institution.
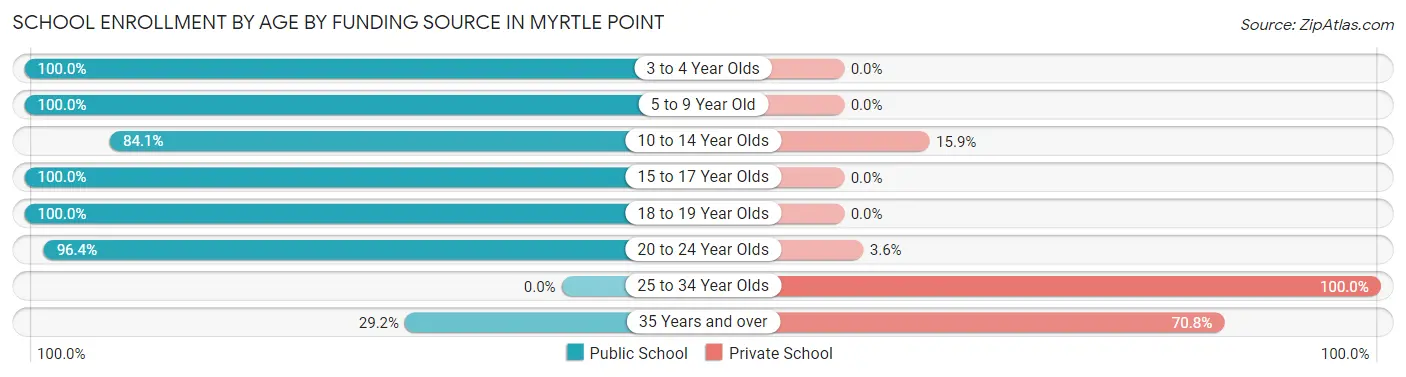
| Age Bracket | Public School | Private School |
| 3 to 4 Year Olds | 12 (100.0%) | 0 (0.0%) |
| 5 to 9 Year Old | 93 (100.0%) | 0 (0.0%) |
| 10 to 14 Year Olds | 132 (84.1%) | 25 (15.9%) |
| 15 to 17 Year Olds | 63 (100.0%) | 0 (0.0%) |
| 18 to 19 Year Olds | 23 (100.0%) | 0 (0.0%) |
| 20 to 24 Year Olds | 27 (96.4%) | 1 (3.6%) |
| 25 to 34 Year Olds | 0 (0.0%) | 4 (100.0%) |
| 35 Years and over | 7 (29.2%) | 17 (70.8%) |
| Total | 357 (88.4%) | 47 (11.6%) |
Educational Attainment by Field of Study in Myrtle Point
Psychology (80 | 22.7%), business (54 | 15.3%), education (49 | 13.9%), social sciences (37 | 10.5%), and liberal arts & history (37 | 10.5%) are the most common fields of study among 352 individuals in Myrtle Point who have obtained a bachelor's degree or higher.
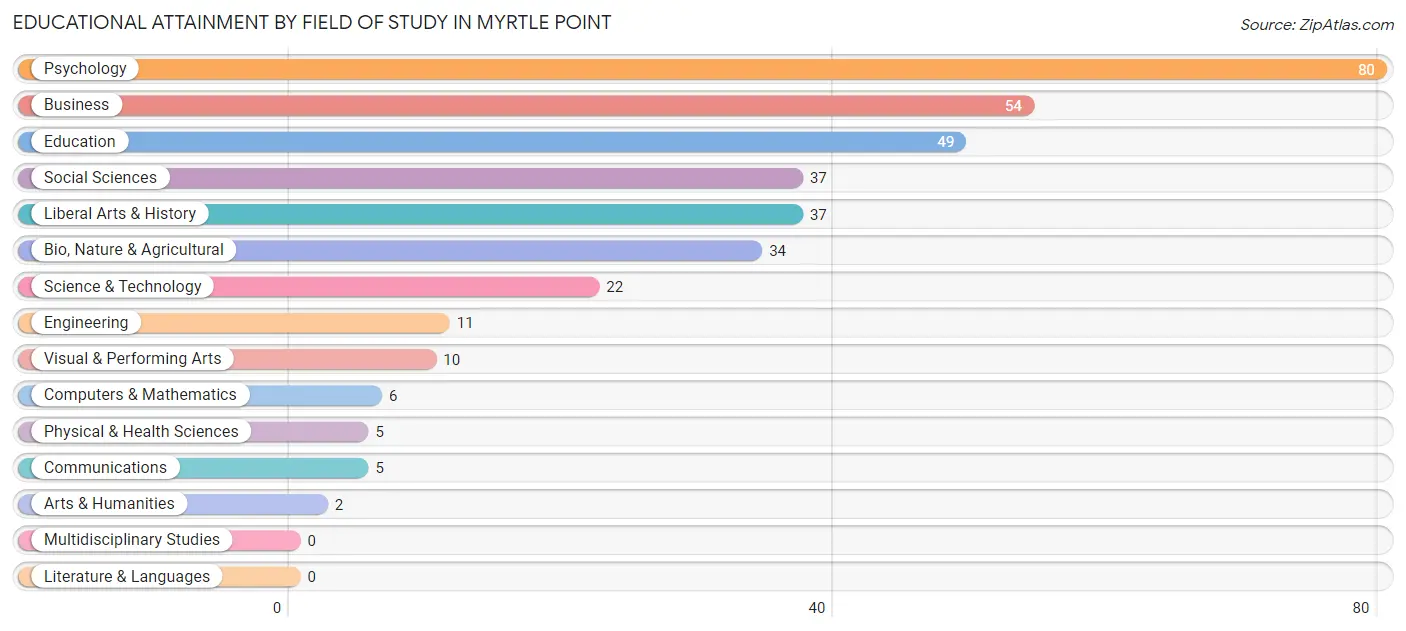
| Field of Study | # Graduates | % Graduates |
| Computers & Mathematics | 6 | 1.7% |
| Bio, Nature & Agricultural | 34 | 9.7% |
| Physical & Health Sciences | 5 | 1.4% |
| Psychology | 80 | 22.7% |
| Social Sciences | 37 | 10.5% |
| Engineering | 11 | 3.1% |
| Multidisciplinary Studies | 0 | 0.0% |
| Science & Technology | 22 | 6.2% |
| Business | 54 | 15.3% |
| Education | 49 | 13.9% |
| Literature & Languages | 0 | 0.0% |
| Liberal Arts & History | 37 | 10.5% |
| Visual & Performing Arts | 10 | 2.8% |
| Communications | 5 | 1.4% |
| Arts & Humanities | 2 | 0.6% |
| Total | 352 | 100.0% |
Transportation & Commute in Myrtle Point
Vehicle Availability by Sex in Myrtle Point
The most prevalent vehicle ownership categories in Myrtle Point are males with 2 vehicles (191, accounting for 42.4%) and females with 2 vehicles (125, making up 46.1%).
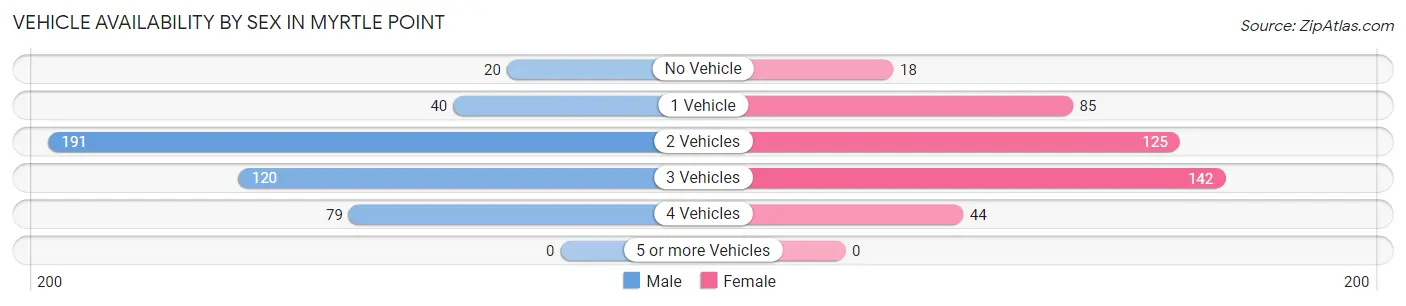
| Vehicles Available | Male | Female |
| No Vehicle | 20 (4.4%) | 18 (4.3%) |
| 1 Vehicle | 40 (8.9%) | 85 (20.5%) |
| 2 Vehicles | 191 (42.4%) | 125 (30.2%) |
| 3 Vehicles | 120 (26.7%) | 142 (34.3%) |
| 4 Vehicles | 79 (17.6%) | 44 (10.6%) |
| 5 or more Vehicles | 0 (0.0%) | 0 (0.0%) |
| Total | 450 (100.0%) | 414 (100.0%) |
Commute Time in Myrtle Point
The most frequently occuring commute durations in Myrtle Point are 15 to 19 minutes (146 commuters, 19.0%), 5 to 9 minutes (141 commuters, 18.3%), and 30 to 34 minutes (135 commuters, 17.5%).
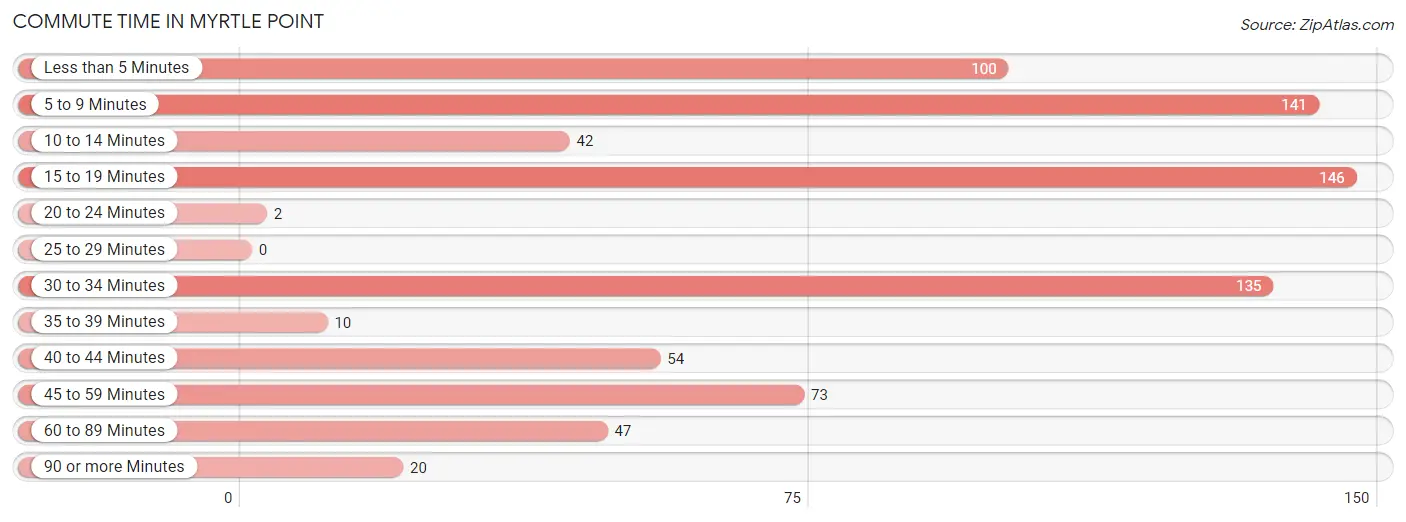
| Commute Time | # Commuters | % Commuters |
| Less than 5 Minutes | 100 | 13.0% |
| 5 to 9 Minutes | 141 | 18.3% |
| 10 to 14 Minutes | 42 | 5.4% |
| 15 to 19 Minutes | 146 | 19.0% |
| 20 to 24 Minutes | 2 | 0.3% |
| 25 to 29 Minutes | 0 | 0.0% |
| 30 to 34 Minutes | 135 | 17.5% |
| 35 to 39 Minutes | 10 | 1.3% |
| 40 to 44 Minutes | 54 | 7.0% |
| 45 to 59 Minutes | 73 | 9.5% |
| 60 to 89 Minutes | 47 | 6.1% |
| 90 or more Minutes | 20 | 2.6% |
Commute Time by Sex in Myrtle Point
The most common commute times in Myrtle Point are 15 to 19 minutes (81 commuters, 19.9%) for males and 5 to 9 minutes (79 commuters, 21.8%) for females.
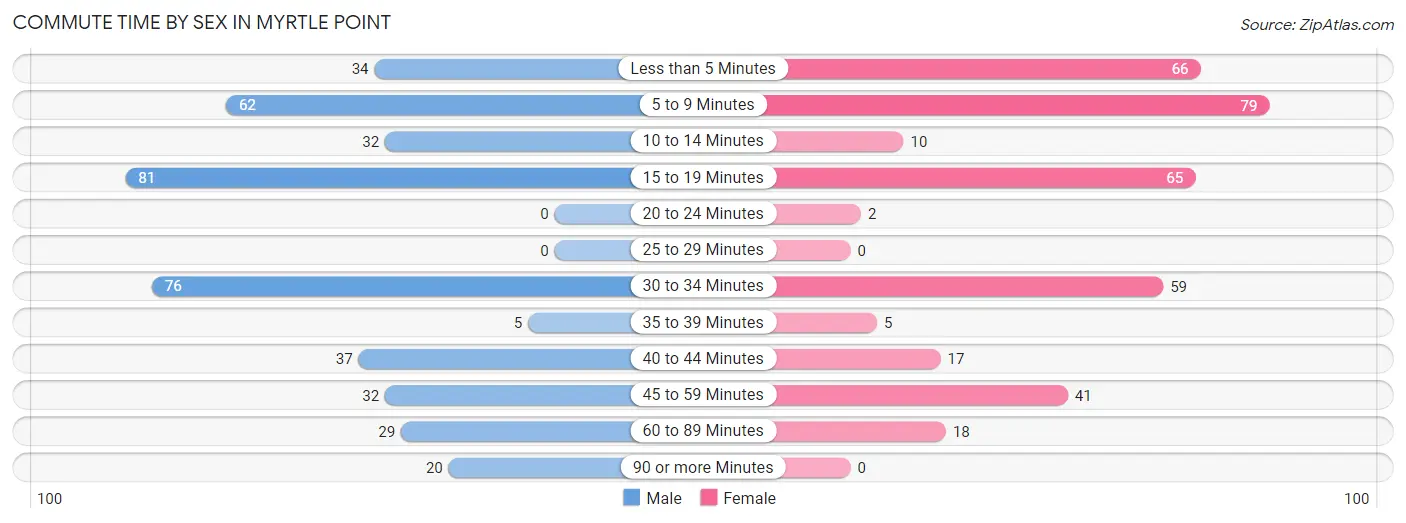
| Commute Time | Male | Female |
| Less than 5 Minutes | 34 (8.3%) | 66 (18.2%) |
| 5 to 9 Minutes | 62 (15.2%) | 79 (21.8%) |
| 10 to 14 Minutes | 32 (7.8%) | 10 (2.8%) |
| 15 to 19 Minutes | 81 (19.9%) | 65 (18.0%) |
| 20 to 24 Minutes | 0 (0.0%) | 2 (0.5%) |
| 25 to 29 Minutes | 0 (0.0%) | 0 (0.0%) |
| 30 to 34 Minutes | 76 (18.6%) | 59 (16.3%) |
| 35 to 39 Minutes | 5 (1.2%) | 5 (1.4%) |
| 40 to 44 Minutes | 37 (9.1%) | 17 (4.7%) |
| 45 to 59 Minutes | 32 (7.8%) | 41 (11.3%) |
| 60 to 89 Minutes | 29 (7.1%) | 18 (5.0%) |
| 90 or more Minutes | 20 (4.9%) | 0 (0.0%) |
Time of Departure to Work by Sex in Myrtle Point
The most frequent times of departure to work in Myrtle Point are 12:00 AM to 4:59 AM (106, 26.0%) for males and 8:00 AM to 8:29 AM (90, 24.9%) for females.
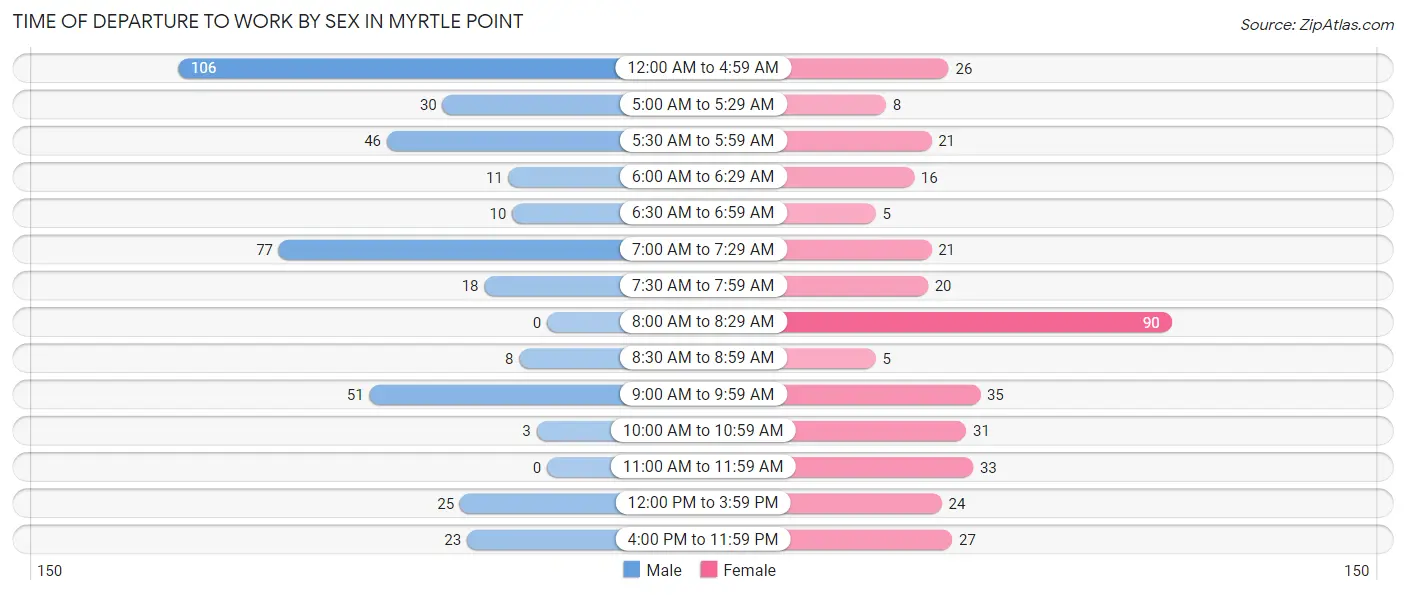
| Time of Departure | Male | Female |
| 12:00 AM to 4:59 AM | 106 (26.0%) | 26 (7.2%) |
| 5:00 AM to 5:29 AM | 30 (7.3%) | 8 (2.2%) |
| 5:30 AM to 5:59 AM | 46 (11.3%) | 21 (5.8%) |
| 6:00 AM to 6:29 AM | 11 (2.7%) | 16 (4.4%) |
| 6:30 AM to 6:59 AM | 10 (2.5%) | 5 (1.4%) |
| 7:00 AM to 7:29 AM | 77 (18.9%) | 21 (5.8%) |
| 7:30 AM to 7:59 AM | 18 (4.4%) | 20 (5.5%) |
| 8:00 AM to 8:29 AM | 0 (0.0%) | 90 (24.9%) |
| 8:30 AM to 8:59 AM | 8 (2.0%) | 5 (1.4%) |
| 9:00 AM to 9:59 AM | 51 (12.5%) | 35 (9.7%) |
| 10:00 AM to 10:59 AM | 3 (0.7%) | 31 (8.6%) |
| 11:00 AM to 11:59 AM | 0 (0.0%) | 33 (9.1%) |
| 12:00 PM to 3:59 PM | 25 (6.1%) | 24 (6.6%) |
| 4:00 PM to 11:59 PM | 23 (5.6%) | 27 (7.5%) |
| Total | 408 (100.0%) | 362 (100.0%) |
Housing Occupancy in Myrtle Point
Occupancy by Ownership in Myrtle Point
Of the total 1,127 dwellings in Myrtle Point, owner-occupied units account for 756 (67.1%), while renter-occupied units make up 371 (32.9%).
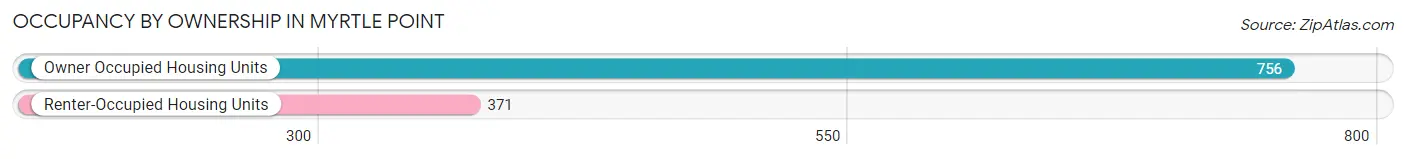
| Occupancy | # Housing Units | % Housing Units |
| Owner Occupied Housing Units | 756 | 67.1% |
| Renter-Occupied Housing Units | 371 | 32.9% |
| Total Occupied Housing Units | 1,127 | 100.0% |
Occupancy by Household Size in Myrtle Point
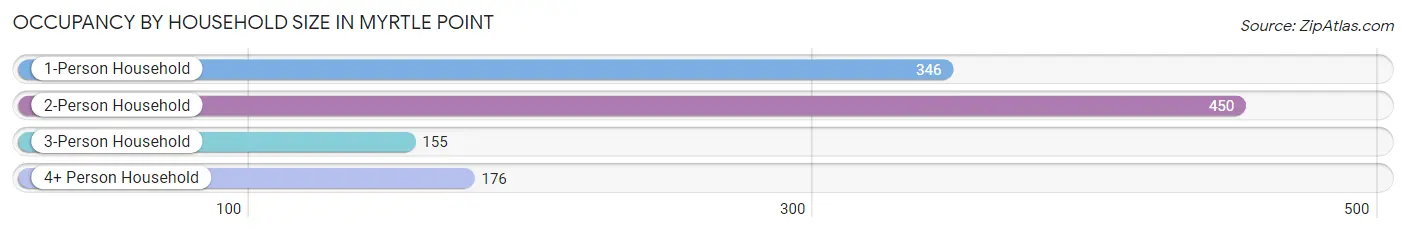
| Household Size | # Housing Units | % Housing Units |
| 1-Person Household | 346 | 30.7% |
| 2-Person Household | 450 | 39.9% |
| 3-Person Household | 155 | 13.8% |
| 4+ Person Household | 176 | 15.6% |
| Total Housing Units | 1,127 | 100.0% |
Occupancy by Ownership by Household Size in Myrtle Point
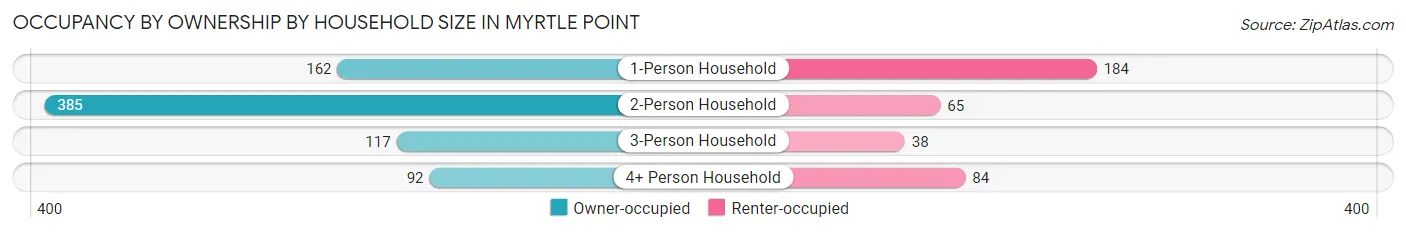
| Household Size | Owner-occupied | Renter-occupied |
| 1-Person Household | 162 (46.8%) | 184 (53.2%) |
| 2-Person Household | 385 (85.6%) | 65 (14.4%) |
| 3-Person Household | 117 (75.5%) | 38 (24.5%) |
| 4+ Person Household | 92 (52.3%) | 84 (47.7%) |
| Total Housing Units | 756 (67.1%) | 371 (32.9%) |
Occupancy by Educational Attainment in Myrtle Point
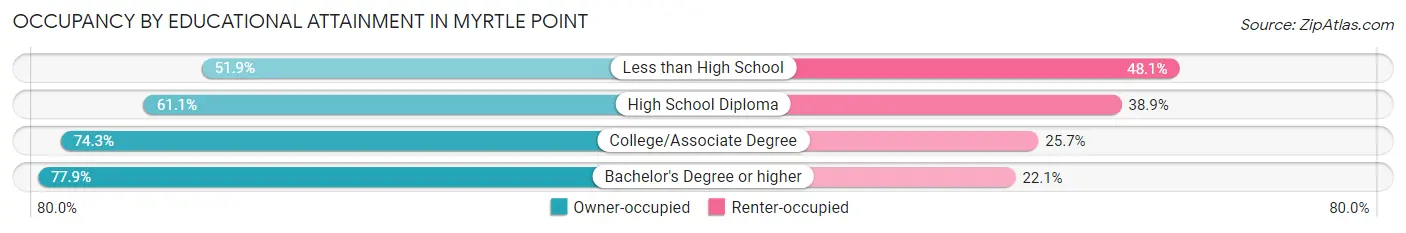
| Household Size | Owner-occupied | Renter-occupied |
| Less than High School | 54 (51.9%) | 50 (48.1%) |
| High School Diploma | 295 (61.1%) | 188 (38.9%) |
| College/Associate Degree | 280 (74.3%) | 97 (25.7%) |
| Bachelor's Degree or higher | 127 (77.9%) | 36 (22.1%) |
Occupancy by Age of Householder in Myrtle Point
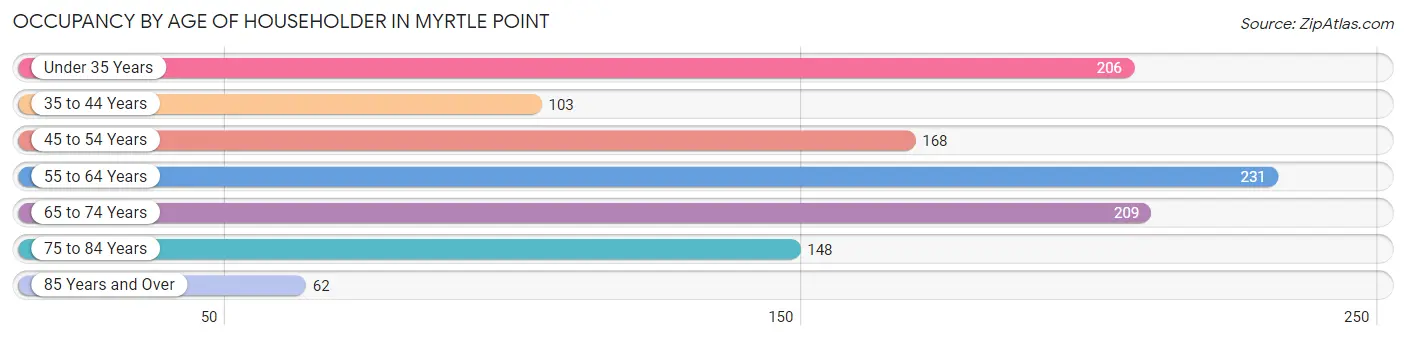
| Age Bracket | # Households | % Households |
| Under 35 Years | 206 | 18.3% |
| 35 to 44 Years | 103 | 9.1% |
| 45 to 54 Years | 168 | 14.9% |
| 55 to 64 Years | 231 | 20.5% |
| 65 to 74 Years | 209 | 18.5% |
| 75 to 84 Years | 148 | 13.1% |
| 85 Years and Over | 62 | 5.5% |
| Total | 1,127 | 100.0% |
Housing Finances in Myrtle Point
Median Income by Occupancy in Myrtle Point
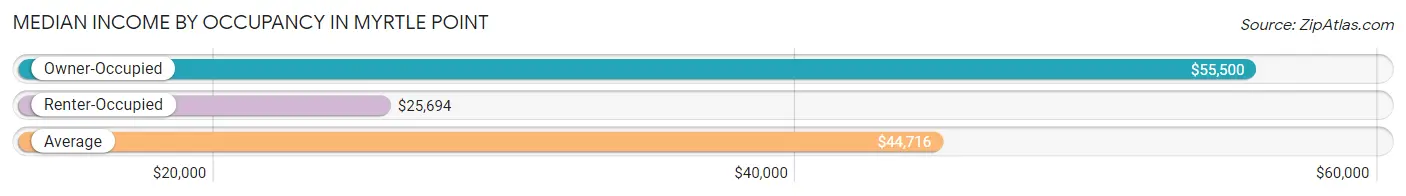
| Occupancy Type | # Households | Median Income |
| Owner-Occupied | 756 (67.1%) | $55,500 |
| Renter-Occupied | 371 (32.9%) | $25,694 |
| Average | 1,127 (100.0%) | $44,716 |
Occupancy by Householder Income Bracket in Myrtle Point
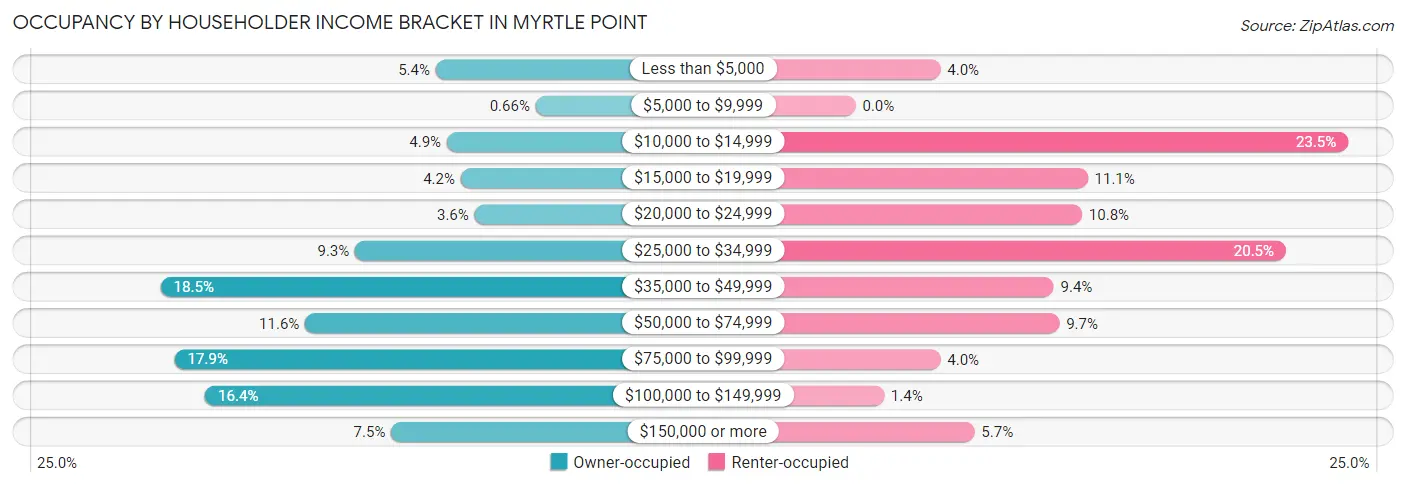
| Income Bracket | Owner-occupied | Renter-occupied |
| Less than $5,000 | 41 (5.4%) | 15 (4.0%) |
| $5,000 to $9,999 | 5 (0.7%) | 0 (0.0%) |
| $10,000 to $14,999 | 37 (4.9%) | 87 (23.4%) |
| $15,000 to $19,999 | 32 (4.2%) | 41 (11.1%) |
| $20,000 to $24,999 | 27 (3.6%) | 40 (10.8%) |
| $25,000 to $34,999 | 70 (9.3%) | 76 (20.5%) |
| $35,000 to $49,999 | 140 (18.5%) | 35 (9.4%) |
| $50,000 to $74,999 | 88 (11.6%) | 36 (9.7%) |
| $75,000 to $99,999 | 135 (17.9%) | 15 (4.0%) |
| $100,000 to $149,999 | 124 (16.4%) | 5 (1.3%) |
| $150,000 or more | 57 (7.5%) | 21 (5.7%) |
| Total | 756 (100.0%) | 371 (100.0%) |
Monthly Housing Cost Tiers in Myrtle Point
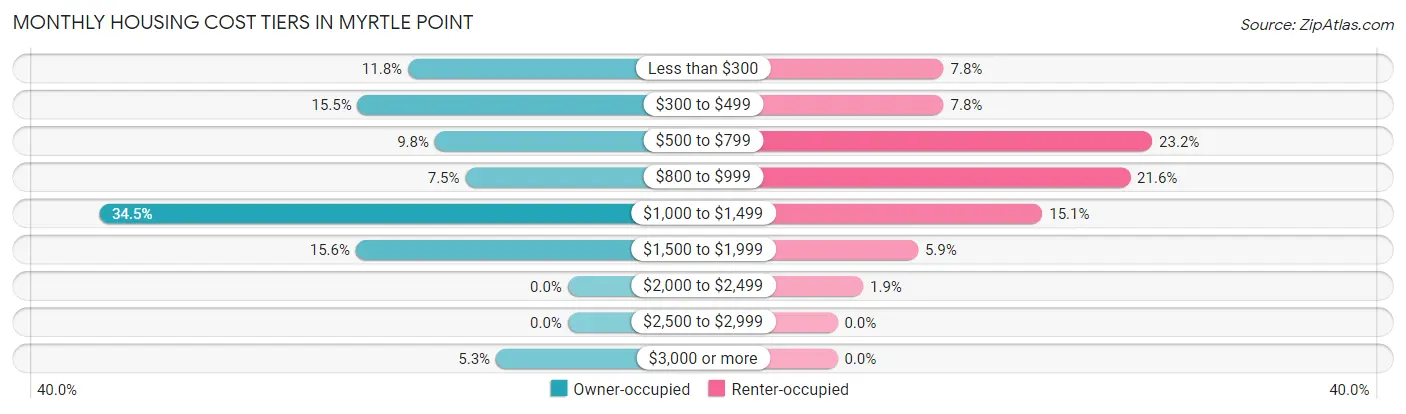
| Monthly Cost | Owner-occupied | Renter-occupied |
| Less than $300 | 89 (11.8%) | 29 (7.8%) |
| $300 to $499 | 117 (15.5%) | 29 (7.8%) |
| $500 to $799 | 74 (9.8%) | 86 (23.2%) |
| $800 to $999 | 57 (7.5%) | 80 (21.6%) |
| $1,000 to $1,499 | 261 (34.5%) | 56 (15.1%) |
| $1,500 to $1,999 | 118 (15.6%) | 22 (5.9%) |
| $2,000 to $2,499 | 0 (0.0%) | 7 (1.9%) |
| $2,500 to $2,999 | 0 (0.0%) | 0 (0.0%) |
| $3,000 or more | 40 (5.3%) | 0 (0.0%) |
| Total | 756 (100.0%) | 371 (100.0%) |
Physical Housing Characteristics in Myrtle Point
Housing Structures in Myrtle Point
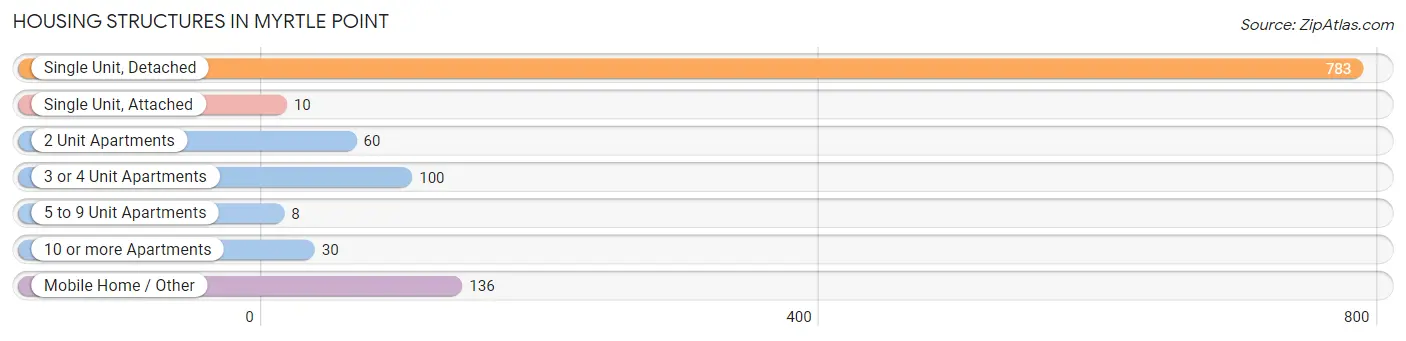
| Structure Type | # Housing Units | % Housing Units |
| Single Unit, Detached | 783 | 69.5% |
| Single Unit, Attached | 10 | 0.9% |
| 2 Unit Apartments | 60 | 5.3% |
| 3 or 4 Unit Apartments | 100 | 8.9% |
| 5 to 9 Unit Apartments | 8 | 0.7% |
| 10 or more Apartments | 30 | 2.7% |
| Mobile Home / Other | 136 | 12.1% |
| Total | 1,127 | 100.0% |
Housing Structures by Occupancy in Myrtle Point
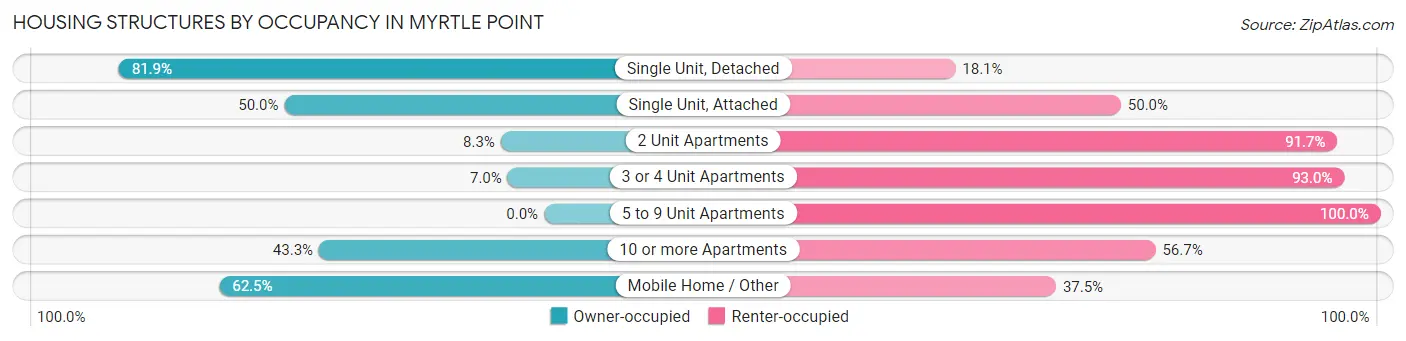
| Structure Type | Owner-occupied | Renter-occupied |
| Single Unit, Detached | 641 (81.9%) | 142 (18.1%) |
| Single Unit, Attached | 5 (50.0%) | 5 (50.0%) |
| 2 Unit Apartments | 5 (8.3%) | 55 (91.7%) |
| 3 or 4 Unit Apartments | 7 (7.0%) | 93 (93.0%) |
| 5 to 9 Unit Apartments | 0 (0.0%) | 8 (100.0%) |
| 10 or more Apartments | 13 (43.3%) | 17 (56.7%) |
| Mobile Home / Other | 85 (62.5%) | 51 (37.5%) |
| Total | 756 (67.1%) | 371 (32.9%) |
Housing Structures by Number of Rooms in Myrtle Point
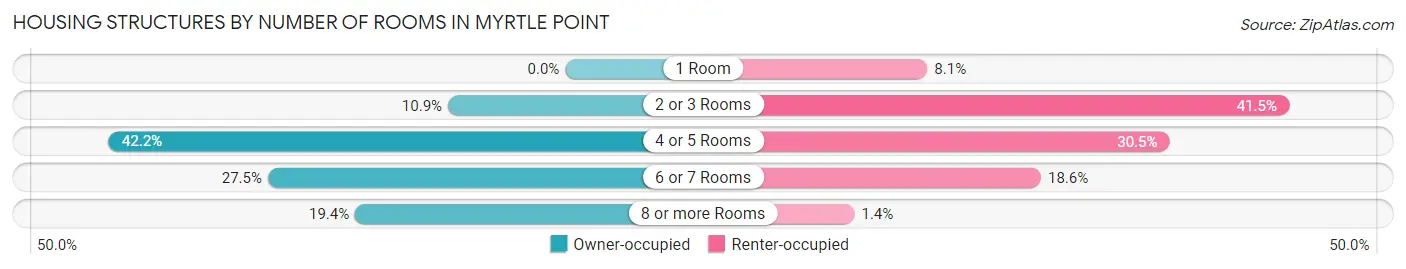
| Number of Rooms | Owner-occupied | Renter-occupied |
| 1 Room | 0 (0.0%) | 30 (8.1%) |
| 2 or 3 Rooms | 82 (10.8%) | 154 (41.5%) |
| 4 or 5 Rooms | 319 (42.2%) | 113 (30.5%) |
| 6 or 7 Rooms | 208 (27.5%) | 69 (18.6%) |
| 8 or more Rooms | 147 (19.4%) | 5 (1.3%) |
| Total | 756 (100.0%) | 371 (100.0%) |
Housing Structure by Heating Type in Myrtle Point
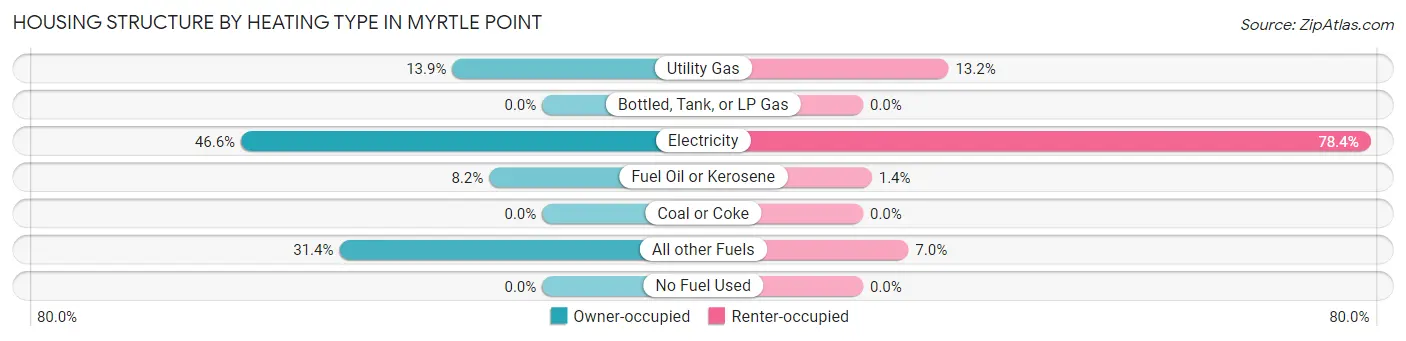
| Heating Type | Owner-occupied | Renter-occupied |
| Utility Gas | 105 (13.9%) | 49 (13.2%) |
| Bottled, Tank, or LP Gas | 0 (0.0%) | 0 (0.0%) |
| Electricity | 352 (46.6%) | 291 (78.4%) |
| Fuel Oil or Kerosene | 62 (8.2%) | 5 (1.3%) |
| Coal or Coke | 0 (0.0%) | 0 (0.0%) |
| All other Fuels | 237 (31.4%) | 26 (7.0%) |
| No Fuel Used | 0 (0.0%) | 0 (0.0%) |
| Total | 756 (100.0%) | 371 (100.0%) |
Household Vehicle Usage in Myrtle Point
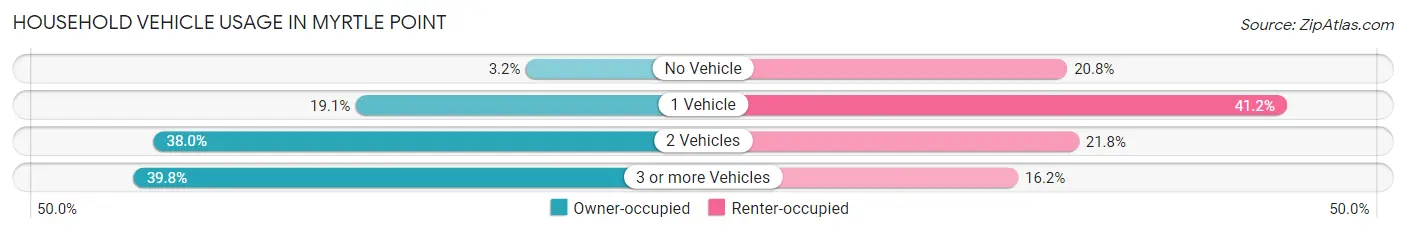
| Vehicles per Household | Owner-occupied | Renter-occupied |
| No Vehicle | 24 (3.2%) | 77 (20.7%) |
| 1 Vehicle | 144 (19.1%) | 153 (41.2%) |
| 2 Vehicles | 287 (38.0%) | 81 (21.8%) |
| 3 or more Vehicles | 301 (39.8%) | 60 (16.2%) |
| Total | 756 (100.0%) | 371 (100.0%) |
Real Estate & Mortgages in Myrtle Point
Real Estate and Mortgage Overview in Myrtle Point
| Characteristic | Without Mortgage | With Mortgage |
| Housing Units | 270 | 486 |
| Median Property Value | $167,900 | $225,000 |
| Median Household Income | $41,250 | $56 |
| Monthly Housing Costs | $392 | $36 |
| Real Estate Taxes | $1,683 | $4 |
Property Value by Mortgage Status in Myrtle Point
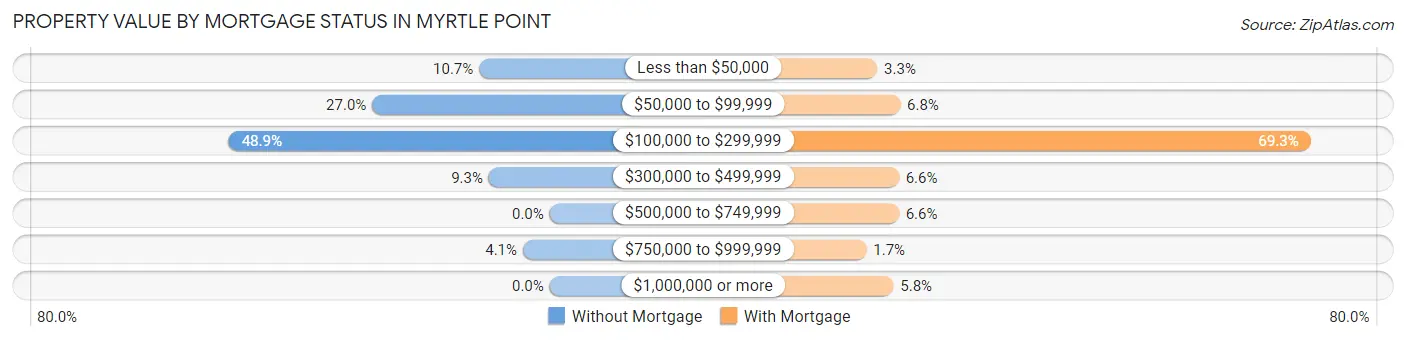
| Property Value | Without Mortgage | With Mortgage |
| Less than $50,000 | 29 (10.7%) | 16 (3.3%) |
| $50,000 to $99,999 | 73 (27.0%) | 33 (6.8%) |
| $100,000 to $299,999 | 132 (48.9%) | 337 (69.3%) |
| $300,000 to $499,999 | 25 (9.3%) | 32 (6.6%) |
| $500,000 to $749,999 | 0 (0.0%) | 32 (6.6%) |
| $750,000 to $999,999 | 11 (4.1%) | 8 (1.7%) |
| $1,000,000 or more | 0 (0.0%) | 28 (5.8%) |
| Total | 270 (100.0%) | 486 (100.0%) |
Household Income by Mortgage Status in Myrtle Point
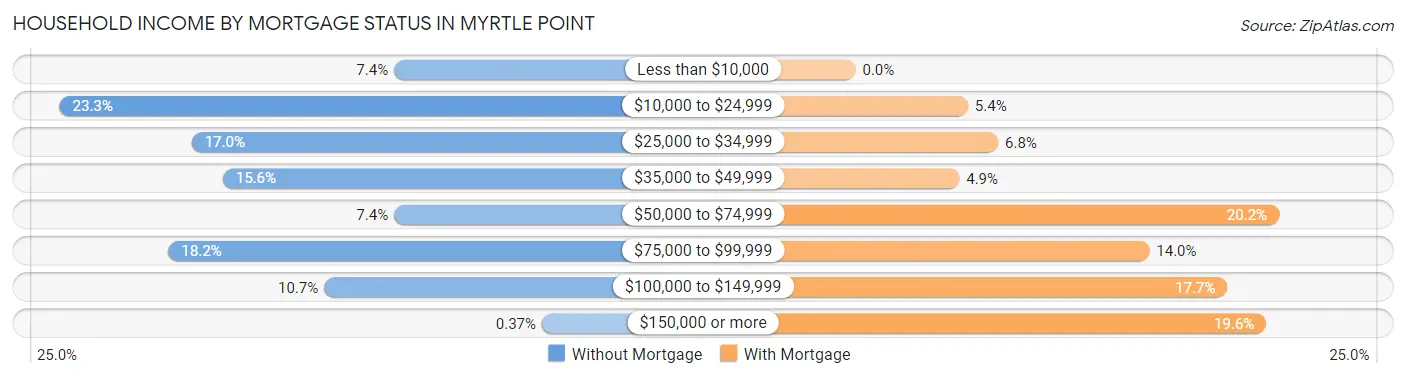
| Household Income | Without Mortgage | With Mortgage |
| Less than $10,000 | 20 (7.4%) | 0 (0.0%) |
| $10,000 to $24,999 | 63 (23.3%) | 26 (5.3%) |
| $25,000 to $34,999 | 46 (17.0%) | 33 (6.8%) |
| $35,000 to $49,999 | 42 (15.6%) | 24 (4.9%) |
| $50,000 to $74,999 | 20 (7.4%) | 98 (20.2%) |
| $75,000 to $99,999 | 49 (18.1%) | 68 (14.0%) |
| $100,000 to $149,999 | 29 (10.7%) | 86 (17.7%) |
| $150,000 or more | 1 (0.4%) | 95 (19.6%) |
| Total | 270 (100.0%) | 486 (100.0%) |
Property Value to Household Income Ratio in Myrtle Point
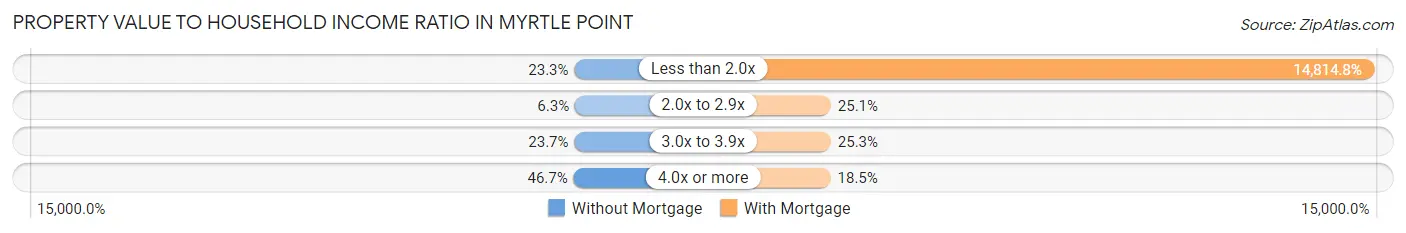
| Value-to-Income Ratio | Without Mortgage | With Mortgage |
| Less than 2.0x | 63 (23.3%) | 72,000 (14,814.8%) |
| 2.0x to 2.9x | 17 (6.3%) | 122 (25.1%) |
| 3.0x to 3.9x | 64 (23.7%) | 123 (25.3%) |
| 4.0x or more | 126 (46.7%) | 90 (18.5%) |
| Total | 270 (100.0%) | 486 (100.0%) |
Real Estate Taxes by Mortgage Status in Myrtle Point
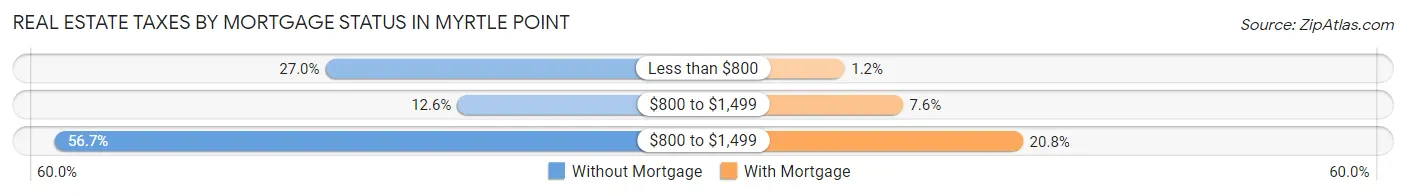
| Property Taxes | Without Mortgage | With Mortgage |
| Less than $800 | 73 (27.0%) | 6 (1.2%) |
| $800 to $1,499 | 34 (12.6%) | 37 (7.6%) |
| $800 to $1,499 | 153 (56.7%) | 101 (20.8%) |
| Total | 270 (100.0%) | 486 (100.0%) |
Health & Disability in Myrtle Point
Health Insurance Coverage by Age in Myrtle Point
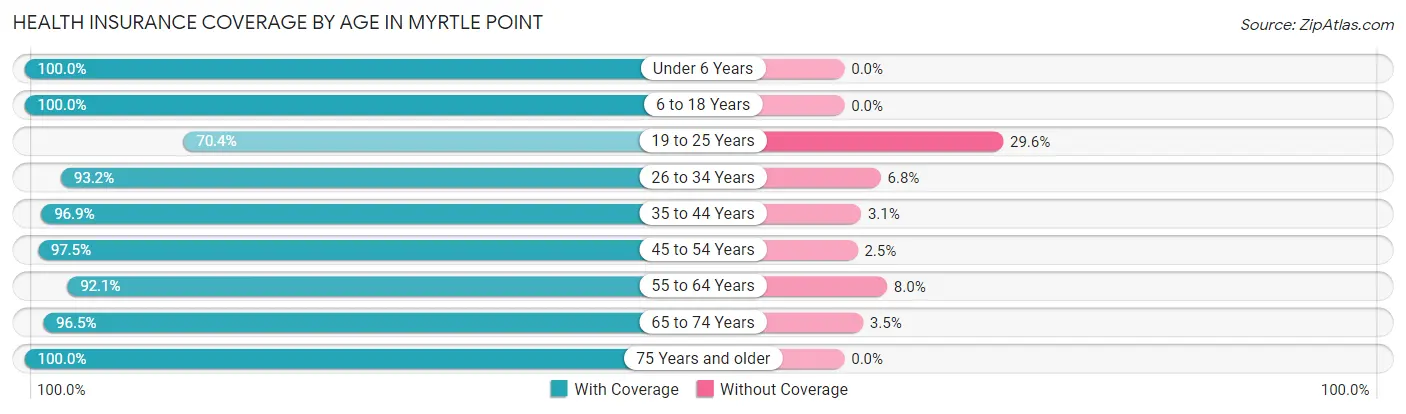
| Age Bracket | With Coverage | Without Coverage |
| Under 6 Years | 194 (100.0%) | 0 (0.0%) |
| 6 to 18 Years | 361 (100.0%) | 0 (0.0%) |
| 19 to 25 Years | 176 (70.4%) | 74 (29.6%) |
| 26 to 34 Years | 248 (93.2%) | 18 (6.8%) |
| 35 to 44 Years | 187 (96.9%) | 6 (3.1%) |
| 45 to 54 Years | 277 (97.5%) | 7 (2.5%) |
| 55 to 64 Years | 463 (92.0%) | 40 (8.0%) |
| 65 to 74 Years | 306 (96.5%) | 11 (3.5%) |
| 75 Years and older | 275 (100.0%) | 0 (0.0%) |
| Total | 2,487 (94.1%) | 156 (5.9%) |
Health Insurance Coverage by Citizenship Status in Myrtle Point
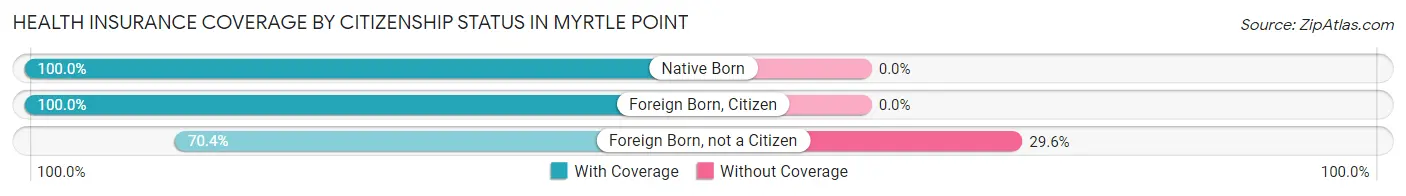
| Citizenship Status | With Coverage | Without Coverage |
| Native Born | 194 (100.0%) | 0 (0.0%) |
| Foreign Born, Citizen | 361 (100.0%) | 0 (0.0%) |
| Foreign Born, not a Citizen | 176 (70.4%) | 74 (29.6%) |
Health Insurance Coverage by Household Income in Myrtle Point
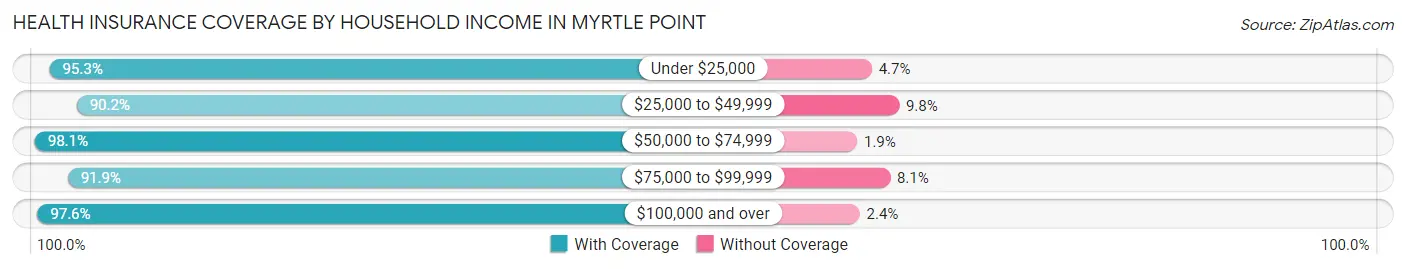
| Household Income | With Coverage | Without Coverage |
| Under $25,000 | 449 (95.3%) | 22 (4.7%) |
| $25,000 to $49,999 | 776 (90.2%) | 84 (9.8%) |
| $50,000 to $74,999 | 307 (98.1%) | 6 (1.9%) |
| $75,000 to $99,999 | 330 (91.9%) | 29 (8.1%) |
| $100,000 and over | 611 (97.6%) | 15 (2.4%) |
Public vs Private Health Insurance Coverage by Age in Myrtle Point
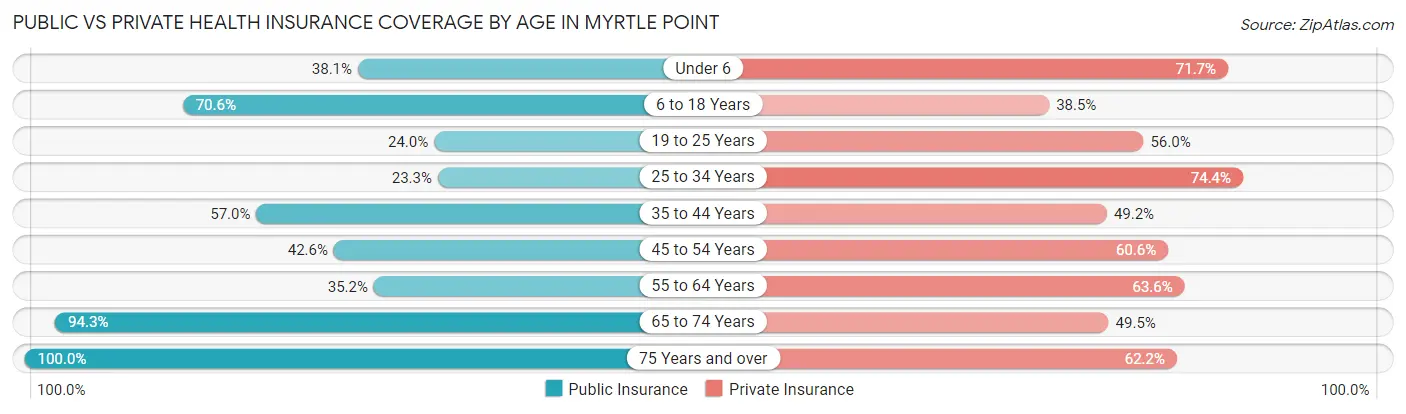
| Age Bracket | Public Insurance | Private Insurance |
| Under 6 | 74 (38.1%) | 139 (71.7%) |
| 6 to 18 Years | 255 (70.6%) | 139 (38.5%) |
| 19 to 25 Years | 60 (24.0%) | 140 (56.0%) |
| 25 to 34 Years | 62 (23.3%) | 198 (74.4%) |
| 35 to 44 Years | 110 (57.0%) | 95 (49.2%) |
| 45 to 54 Years | 121 (42.6%) | 172 (60.6%) |
| 55 to 64 Years | 177 (35.2%) | 320 (63.6%) |
| 65 to 74 Years | 299 (94.3%) | 157 (49.5%) |
| 75 Years and over | 275 (100.0%) | 171 (62.2%) |
| Total | 1,433 (54.2%) | 1,531 (57.9%) |
Disability Status by Sex by Age in Myrtle Point
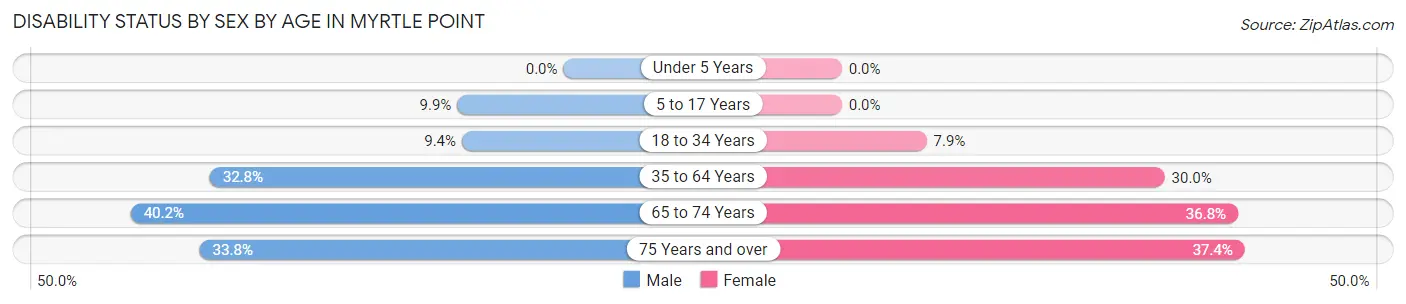
| Age Bracket | Male | Female |
| Under 5 Years | 0 (0.0%) | 0 (0.0%) |
| 5 to 17 Years | 13 (9.9%) | 0 (0.0%) |
| 18 to 34 Years | 26 (9.4%) | 21 (7.9%) |
| 35 to 64 Years | 166 (32.8%) | 142 (30.0%) |
| 65 to 74 Years | 53 (40.2%) | 68 (36.8%) |
| 75 Years and over | 54 (33.8%) | 43 (37.4%) |
Disability Class by Sex by Age in Myrtle Point
Disability Class: Hearing Difficulty
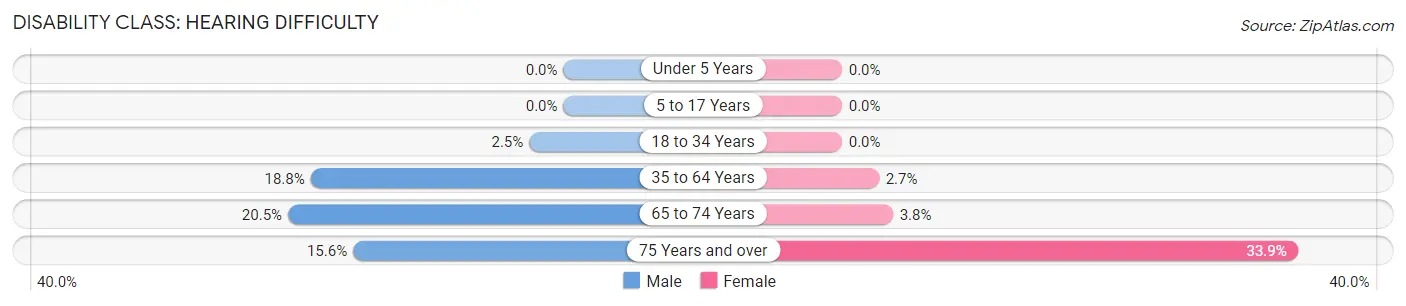
| Age Bracket | Male | Female |
| Under 5 Years | 0 (0.0%) | 0 (0.0%) |
| 5 to 17 Years | 0 (0.0%) | 0 (0.0%) |
| 18 to 34 Years | 7 (2.5%) | 0 (0.0%) |
| 35 to 64 Years | 95 (18.8%) | 13 (2.7%) |
| 65 to 74 Years | 27 (20.4%) | 7 (3.8%) |
| 75 Years and over | 25 (15.6%) | 39 (33.9%) |
Disability Class: Vision Difficulty
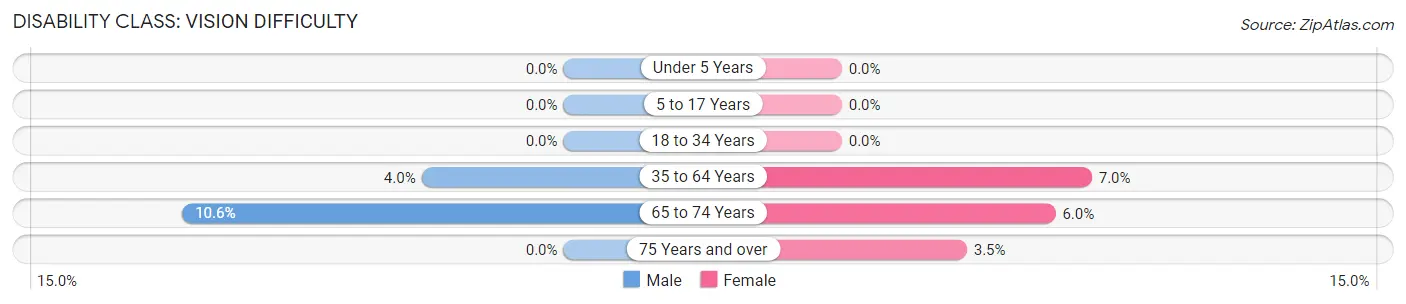
| Age Bracket | Male | Female |
| Under 5 Years | 0 (0.0%) | 0 (0.0%) |
| 5 to 17 Years | 0 (0.0%) | 0 (0.0%) |
| 18 to 34 Years | 0 (0.0%) | 0 (0.0%) |
| 35 to 64 Years | 20 (4.0%) | 33 (7.0%) |
| 65 to 74 Years | 14 (10.6%) | 11 (5.9%) |
| 75 Years and over | 0 (0.0%) | 4 (3.5%) |
Disability Class: Cognitive Difficulty
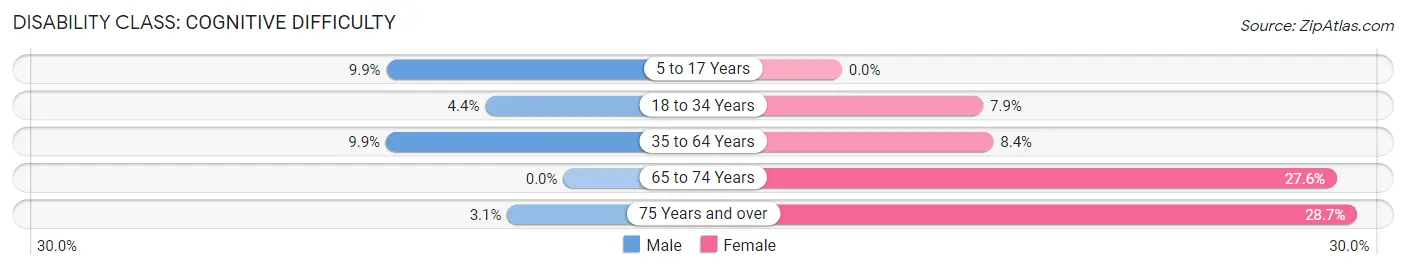
| Age Bracket | Male | Female |
| 5 to 17 Years | 13 (9.9%) | 0 (0.0%) |
| 18 to 34 Years | 12 (4.3%) | 21 (7.9%) |
| 35 to 64 Years | 50 (9.9%) | 40 (8.4%) |
| 65 to 74 Years | 0 (0.0%) | 51 (27.6%) |
| 75 Years and over | 5 (3.1%) | 33 (28.7%) |
Disability Class: Ambulatory Difficulty
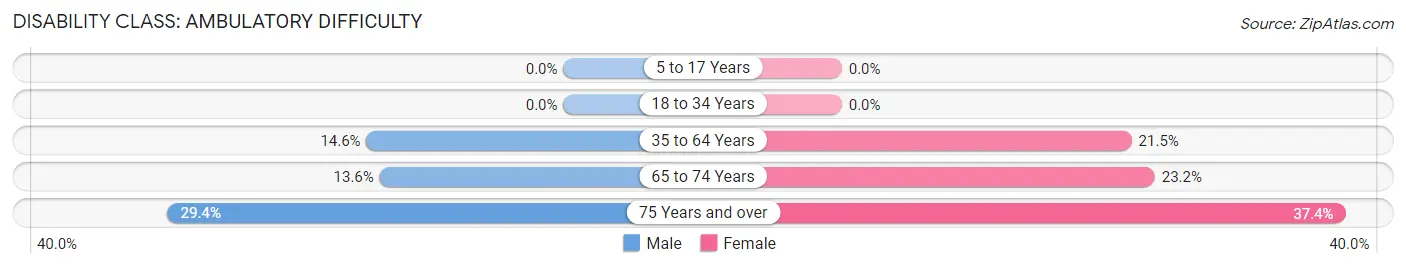
| Age Bracket | Male | Female |
| 5 to 17 Years | 0 (0.0%) | 0 (0.0%) |
| 18 to 34 Years | 0 (0.0%) | 0 (0.0%) |
| 35 to 64 Years | 74 (14.6%) | 102 (21.5%) |
| 65 to 74 Years | 18 (13.6%) | 43 (23.2%) |
| 75 Years and over | 47 (29.4%) | 43 (37.4%) |
Disability Class: Self-Care Difficulty
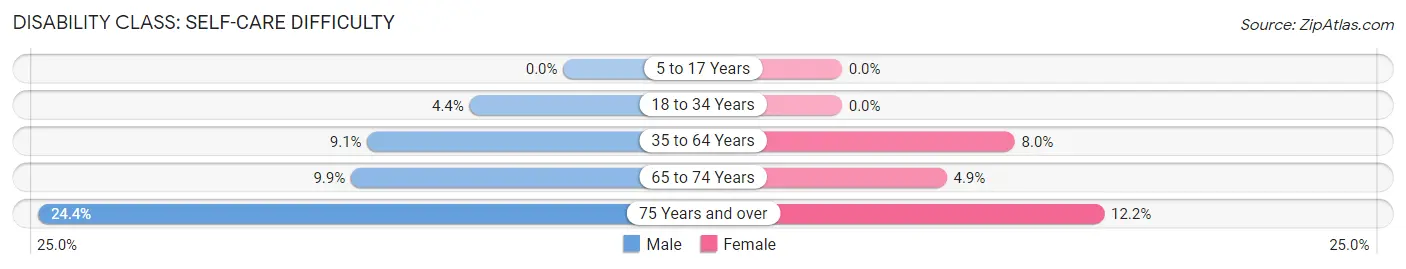
| Age Bracket | Male | Female |
| 5 to 17 Years | 0 (0.0%) | 0 (0.0%) |
| 18 to 34 Years | 12 (4.3%) | 0 (0.0%) |
| 35 to 64 Years | 46 (9.1%) | 38 (8.0%) |
| 65 to 74 Years | 13 (9.9%) | 9 (4.9%) |
| 75 Years and over | 39 (24.4%) | 14 (12.2%) |
Technology Access in Myrtle Point
Computing Device Access in Myrtle Point
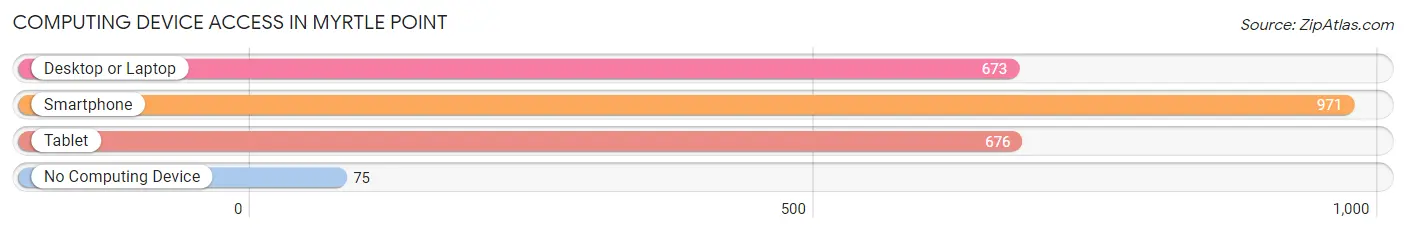
| Device Type | # Households | % Households |
| Desktop or Laptop | 673 | 59.7% |
| Smartphone | 971 | 86.2% |
| Tablet | 676 | 60.0% |
| No Computing Device | 75 | 6.7% |
| Total | 1,127 | 100.0% |
Internet Access in Myrtle Point
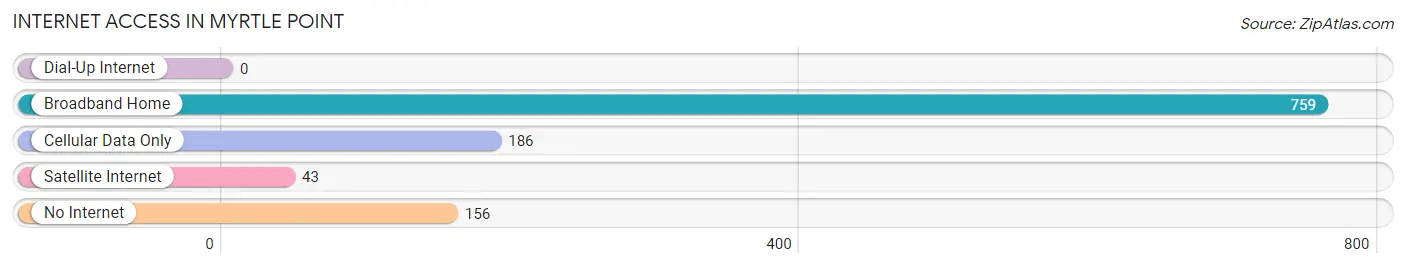
| Internet Type | # Households | % Households |
| Dial-Up Internet | 0 | 0.0% |
| Broadband Home | 759 | 67.3% |
| Cellular Data Only | 186 | 16.5% |
| Satellite Internet | 43 | 3.8% |
| No Internet | 156 | 13.8% |
| Total | 1,127 | 100.0% |
Myrtle Point Summary
Myrtle Point is a small city located in Coos County, Oregon, United States. It is situated on the Coquille River, approximately 20 miles east of Coos Bay. The city has a population of approximately 2,000 people and is the county seat of Coos County.
History
Myrtle Point was founded in 1851 by a group of settlers from the Willamette Valley. The settlers were attracted to the area by the abundance of timber and the potential for farming. The town was originally named "Myrtle Grove" after the abundance of myrtle trees in the area. The name was later changed to Myrtle Point in 1853.
In 1854, the first post office was established in Myrtle Point. The town was incorporated in 1891 and the first mayor was elected in 1892.
In the early 1900s, Myrtle Point was a thriving logging and lumber town. The town was home to several sawmills and lumber companies, including the Coos Bay Lumber Company, which was the largest employer in the area.
In the 1950s, the timber industry began to decline and the town's economy shifted to agriculture. Today, Myrtle Point is a small, rural community with a strong agricultural base.
Geography
Myrtle Point is located in the Coos Bay region of Oregon, approximately 20 miles east of Coos Bay. The city is situated on the Coquille River and is surrounded by rolling hills and forests. The climate in Myrtle Point is mild and temperate, with an average annual temperature of 54 degrees Fahrenheit.
The city covers an area of 2.3 square miles and has a population of approximately 2,000 people. The population density is 845 people per square mile.
Economy
Myrtle Point's economy is largely based on agriculture. The city is home to several farms and ranches, as well as a number of agricultural-related businesses. The city is also home to several small businesses, including restaurants, retail stores, and service providers.
The city is also home to a number of manufacturing companies, including a wood products plant and a metal fabrication plant.
Demographics
Myrtle Point has a population of approximately 2,000 people. The population is predominantly white (94.3%), with small percentages of Hispanic (2.2%), African American (1.2%), and Native American (0.7%) residents.
The median household income in Myrtle Point is $41,000, and the median home value is $150,000. The city has a poverty rate of 16.3%.
Conclusion
Myrtle Point is a small city located in Coos County, Oregon. It is situated on the Coquille River and is surrounded by rolling hills and forests. The city has a population of approximately 2,000 people and is the county seat of Coos County. The city's economy is largely based on agriculture, with a number of small businesses and manufacturing companies also located in the area. The population is predominantly white, with small percentages of Hispanic, African American, and Native American residents. The median household income in Myrtle Point is $41,000, and the median home value is $150,000.
Common Questions
What is Per Capita Income in Myrtle Point?
Per Capita income in Myrtle Point is $30,882.
What is the Median Family Income in Myrtle Point?
Median Family Income in Myrtle Point is $53,839.
What is the Median Household income in Myrtle Point?
Median Household Income in Myrtle Point is $44,716.
What is Income or Wage Gap in Myrtle Point?
Income or Wage Gap in Myrtle Point is 49.2%.
Women in Myrtle Point earn 50.8 cents for every dollar earned by a man.
What is Inequality or Gini Index in Myrtle Point?
Inequality or Gini Index in Myrtle Point is 0.47.
What is the Total Population of Myrtle Point?
Total Population of Myrtle Point is 2,689.
What is the Total Male Population of Myrtle Point?
Total Male Population of Myrtle Point is 1,301.
What is the Total Female Population of Myrtle Point?
Total Female Population of Myrtle Point is 1,388.
What is the Ratio of Males per 100 Females in Myrtle Point?
There are 93.73 Males per 100 Females in Myrtle Point.
What is the Ratio of Females per 100 Males in Myrtle Point?
There are 106.69 Females per 100 Males in Myrtle Point.
What is the Median Population Age in Myrtle Point?
Median Population Age in Myrtle Point is 48.1 Years.
What is the Average Family Size in Myrtle Point
Average Family Size in Myrtle Point is 3.0 People.
What is the Average Household Size in Myrtle Point
Average Household Size in Myrtle Point is 2.3 People.
How Large is the Labor Force in Myrtle Point?
There are 964 People in the Labor Forcein in Myrtle Point.
What is the Percentage of People in the Labor Force in Myrtle Point?
44.1% of People are in the Labor Force in Myrtle Point.
What is the Unemployment Rate in Myrtle Point?
Unemployment Rate in Myrtle Point is 10.3%.