Glasgow, OR Map & Demographics
Glasgow Map
Glasgow Overview
$38,587
PER CAPITA INCOME
$81,128
AVG FAMILY INCOME
$82,043
AVG HOUSEHOLD INCOME
0.37
INEQUALITY / GINI INDEX
920
TOTAL POPULATION
464
MALE POPULATION
456
FEMALE POPULATION
101.75
MALES / 100 FEMALES
98.28
FEMALES / 100 MALES
57.4
MEDIAN AGE
3.1
AVG FAMILY SIZE
2.5
AVG HOUSEHOLD SIZE
308
LABOR FORCE [ PEOPLE ]
47.5%
PERCENT IN LABOR FORCE
Income in Glasgow
Income Overview in Glasgow
Per Capita Income in Glasgow is $38,587, while median incomes of families and households are $81,128 and $82,043 respectively.
| Characteristic | Number | Measure |
| Per Capita Income | 920 | $38,587 |
| Median Family Income | 223 | $81,128 |
| Mean Family Income | 223 | $83,190 |
| Median Household Income | 367 | $82,043 |
| Mean Household Income | 367 | $94,944 |
| Income Deficit | 223 | $0 |
| Wage / Income Gap (%) | 920 | 0.00% |
| Wage / Income Gap ($) | 920 | 100.00¢ per $1 |
| Gini / Inequality Index | 920 | 0.37 |
Earnings by Sex in Glasgow
| Sex | Number | Average Earnings |
| Male | 212 (66.5%) | $0 |
| Female | 107 (33.5%) | $0 |
| Total | 319 (100.0%) | $0 |
Earnings by Sex by Income Bracket in Glasgow
The most common earnings brackets in Glasgow are $75,000 to $99,999 for men (76 | 35.8%) and $10,000 to $12,499 for women (46 | 43.0%).
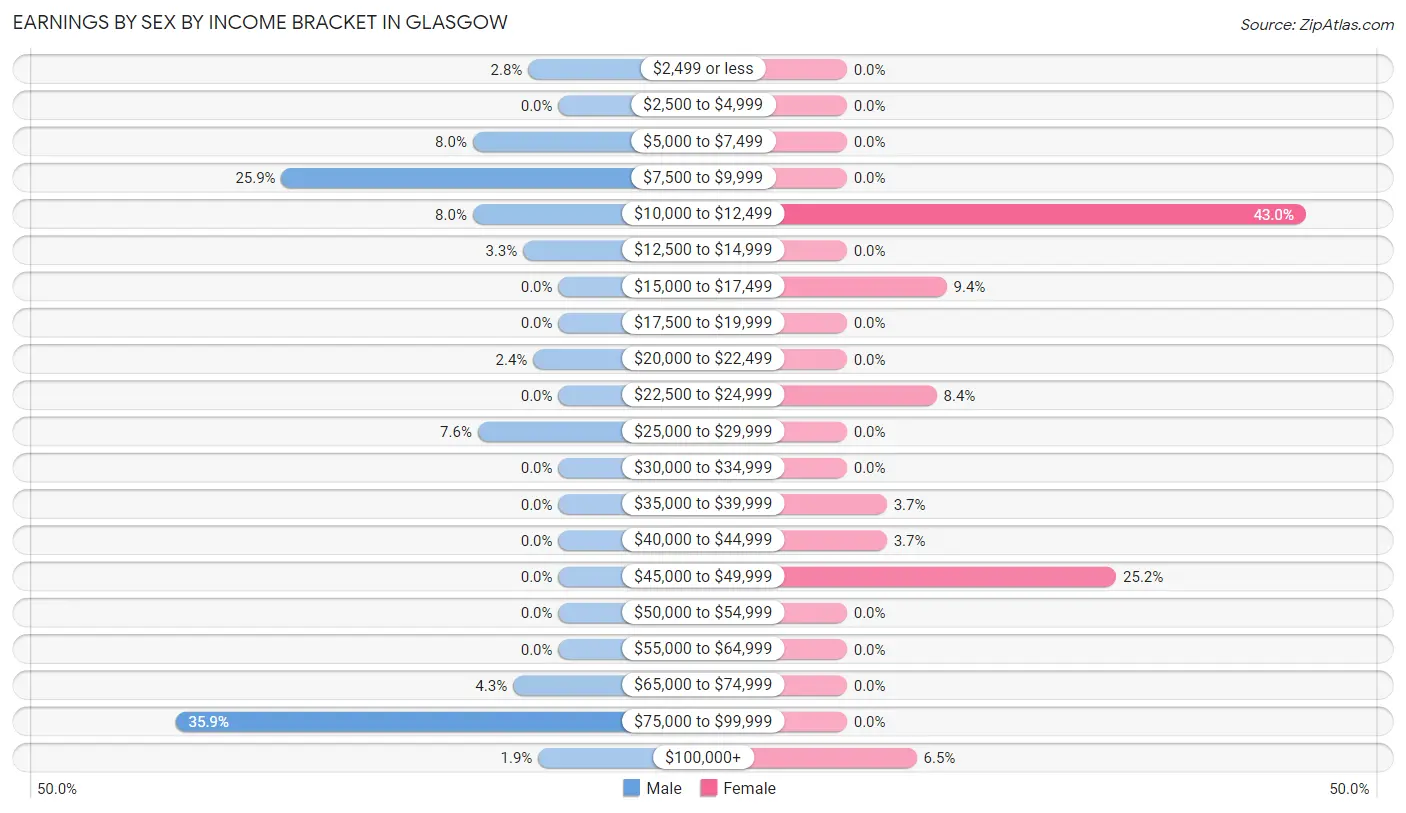
| Income | Male | Female |
| $2,499 or less | 6 (2.8%) | 0 (0.0%) |
| $2,500 to $4,999 | 0 (0.0%) | 0 (0.0%) |
| $5,000 to $7,499 | 17 (8.0%) | 0 (0.0%) |
| $7,500 to $9,999 | 55 (25.9%) | 0 (0.0%) |
| $10,000 to $12,499 | 17 (8.0%) | 46 (43.0%) |
| $12,500 to $14,999 | 7 (3.3%) | 0 (0.0%) |
| $15,000 to $17,499 | 0 (0.0%) | 10 (9.3%) |
| $17,500 to $19,999 | 0 (0.0%) | 0 (0.0%) |
| $20,000 to $22,499 | 5 (2.4%) | 0 (0.0%) |
| $22,500 to $24,999 | 0 (0.0%) | 9 (8.4%) |
| $25,000 to $29,999 | 16 (7.5%) | 0 (0.0%) |
| $30,000 to $34,999 | 0 (0.0%) | 0 (0.0%) |
| $35,000 to $39,999 | 0 (0.0%) | 4 (3.7%) |
| $40,000 to $44,999 | 0 (0.0%) | 4 (3.7%) |
| $45,000 to $49,999 | 0 (0.0%) | 27 (25.2%) |
| $50,000 to $54,999 | 0 (0.0%) | 0 (0.0%) |
| $55,000 to $64,999 | 0 (0.0%) | 0 (0.0%) |
| $65,000 to $74,999 | 9 (4.3%) | 0 (0.0%) |
| $75,000 to $99,999 | 76 (35.8%) | 0 (0.0%) |
| $100,000+ | 4 (1.9%) | 7 (6.5%) |
| Total | 212 (100.0%) | 107 (100.0%) |
Earnings by Sex by Educational Attainment in Glasgow
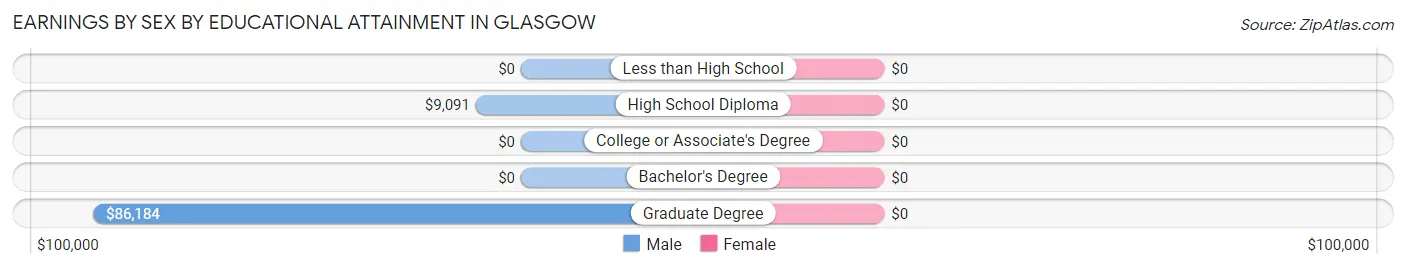
| Educational Attainment | Male Income | Female Income |
| Less than High School | - | - |
| High School Diploma | $9,091 | $0 |
| College or Associate's Degree | - | - |
| Bachelor's Degree | - | - |
| Graduate Degree | $86,184 | $0 |
| Total | - | - |
Family Income in Glasgow
Family Income Brackets in Glasgow
According to the Glasgow family income data, there are 63 families falling into the $100,000 to $149,999 income range, which is the most common income bracket and makes up 28.2% of all families.
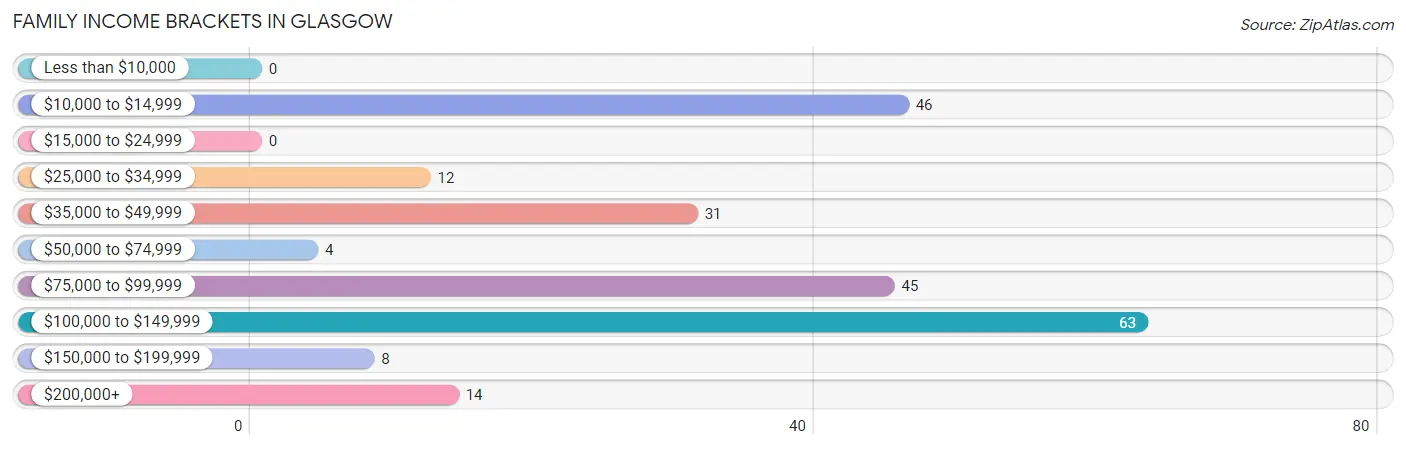
| Income Bracket | # Families | % Families |
| Less than $10,000 | 0 | 0.0% |
| $10,000 to $14,999 | 46 | 20.6% |
| $15,000 to $24,999 | 0 | 0.0% |
| $25,000 to $34,999 | 12 | 5.4% |
| $35,000 to $49,999 | 31 | 13.9% |
| $50,000 to $74,999 | 4 | 1.8% |
| $75,000 to $99,999 | 45 | 20.2% |
| $100,000 to $149,999 | 63 | 28.3% |
| $150,000 to $199,999 | 8 | 3.6% |
| $200,000+ | 14 | 6.3% |
Family Income by Famaliy Size in Glasgow
2-person families (163 | 73.1%) account for the highest median family income in Glasgow with $82,104 per family, while 2-person families (163 | 73.1%) have the highest median income of $41,052 per family member.
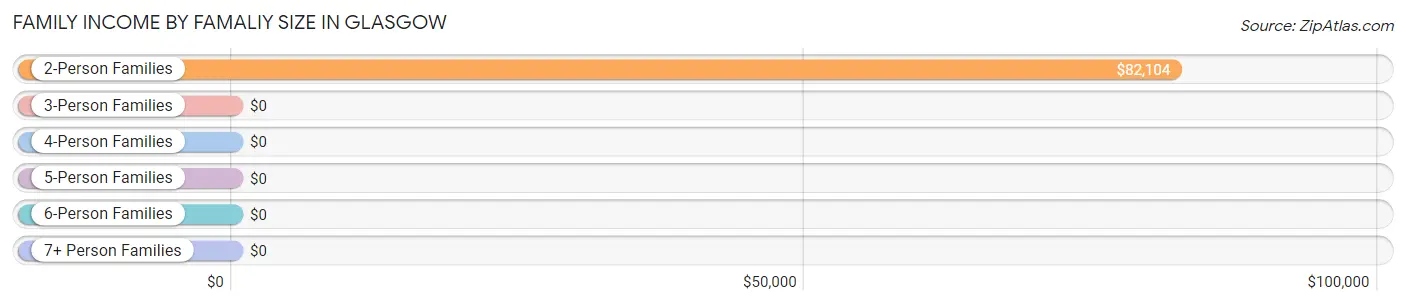
| Income Bracket | # Families | Median Income |
| 2-Person Families | 163 (73.1%) | $82,104 |
| 3-Person Families | 6 (2.7%) | $0 |
| 4-Person Families | 8 (3.6%) | $0 |
| 5-Person Families | 0 (0.0%) | $0 |
| 6-Person Families | 46 (20.6%) | $0 |
| 7+ Person Families | 0 (0.0%) | $0 |
| Total | 223 (100.0%) | $81,128 |
Family Income by Number of Earners in Glasgow
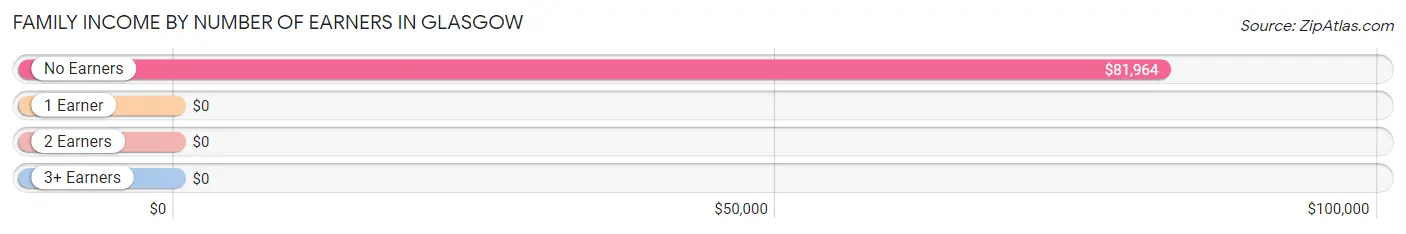
| Number of Earners | # Families | Median Income |
| No Earners | 46 (20.6%) | $81,964 |
| 1 Earner | 161 (72.2%) | $0 |
| 2 Earners | 16 (7.2%) | $0 |
| 3+ Earners | 0 (0.0%) | $0 |
| Total | 223 (100.0%) | $81,128 |
Household Income in Glasgow
Household Income Brackets in Glasgow
With 83 households falling in the category, the $75,000 to $99,999 income range is the most frequent in Glasgow, accounting for 22.6% of all households.
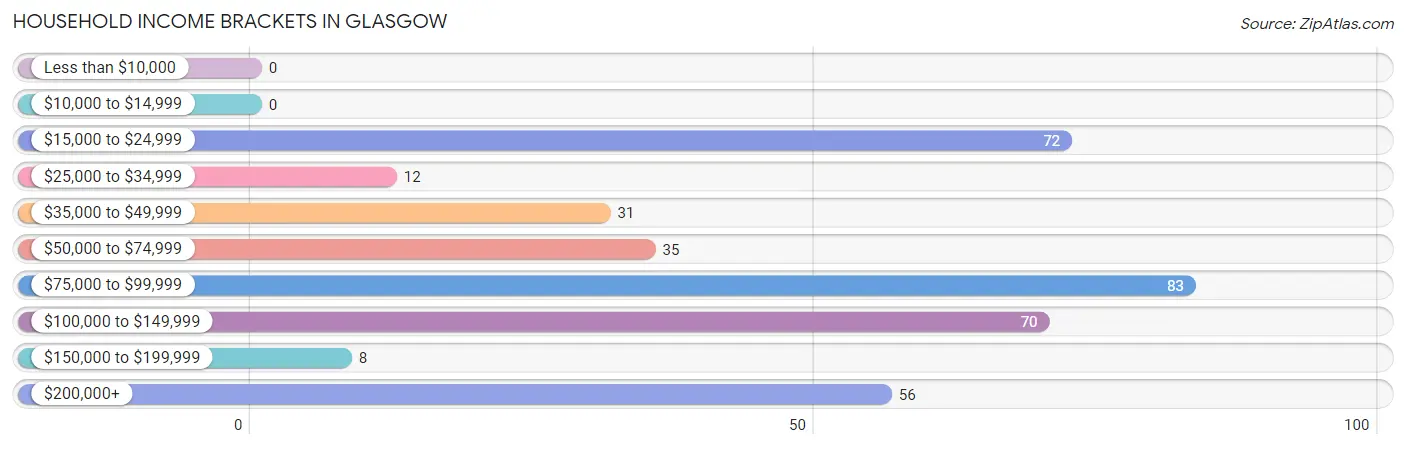
| Income Bracket | # Households | % Households |
| Less than $10,000 | 0 | 0.0% |
| $10,000 to $14,999 | 0 | 0.0% |
| $15,000 to $24,999 | 72 | 19.6% |
| $25,000 to $34,999 | 12 | 3.3% |
| $35,000 to $49,999 | 31 | 8.4% |
| $50,000 to $74,999 | 35 | 9.5% |
| $75,000 to $99,999 | 83 | 22.6% |
| $100,000 to $149,999 | 70 | 19.1% |
| $150,000 to $199,999 | 8 | 2.2% |
| $200,000+ | 56 | 15.3% |
Household Income by Householder Age in Glasgow
The median household income in Glasgow is $82,043, with the highest median household income of $80,694 found in the 45 to 64 years age bracket for the primary householder. A total of 205 households (55.9%) fall into this category.
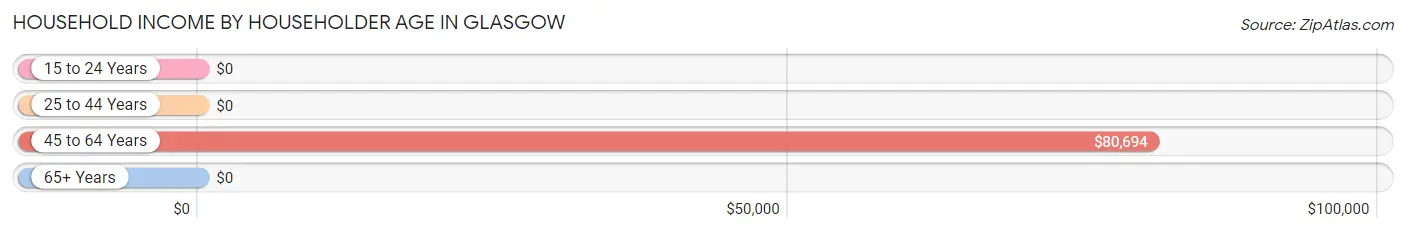
| Income Bracket | # Households | Median Income |
| 15 to 24 Years | 0 (0.0%) | $0 |
| 25 to 44 Years | 0 (0.0%) | $0 |
| 45 to 64 Years | 205 (55.9%) | $80,694 |
| 65+ Years | 162 (44.1%) | $0 |
| Total | 367 (100.0%) | $82,043 |
Poverty in Glasgow
Income Below Poverty by Sex and Age in Glasgow
With 31.0% poverty level for males and 57.0% for females among the residents of Glasgow, 6 to 11 year old males and 6 to 11 year old females are the most vulnerable to poverty, with 89 males (100.0%) and 61 females (100.0%) in their respective age groups living below the poverty level.
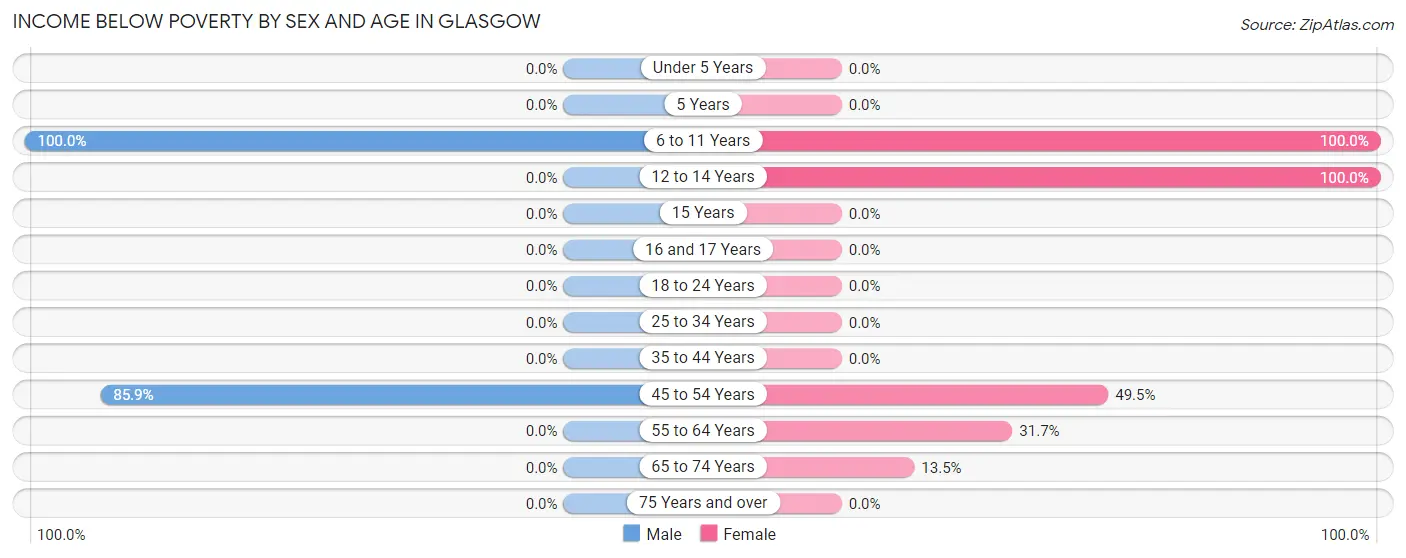
| Age Bracket | Male | Female |
| Under 5 Years | 0 (0.0%) | 0 (0.0%) |
| 5 Years | 0 (0.0%) | 0 (0.0%) |
| 6 to 11 Years | 89 (100.0%) | 61 (100.0%) |
| 12 to 14 Years | 0 (0.0%) | 122 (100.0%) |
| 15 Years | 0 (0.0%) | 0 (0.0%) |
| 16 and 17 Years | 0 (0.0%) | 0 (0.0%) |
| 18 to 24 Years | 0 (0.0%) | 0 (0.0%) |
| 25 to 34 Years | 0 (0.0%) | 0 (0.0%) |
| 35 to 44 Years | 0 (0.0%) | 0 (0.0%) |
| 45 to 54 Years | 55 (85.9%) | 46 (49.5%) |
| 55 to 64 Years | 0 (0.0%) | 19 (31.7%) |
| 65 to 74 Years | 0 (0.0%) | 12 (13.5%) |
| 75 Years and over | 0 (0.0%) | 0 (0.0%) |
| Total | 144 (31.0%) | 260 (57.0%) |
Income Above Poverty by Sex and Age in Glasgow
According to the poverty statistics in Glasgow, males aged 18 to 24 years and females aged 75 years and over are the age groups that are most secure financially, with 100.0% of males and 100.0% of females in these age groups living above the poverty line.
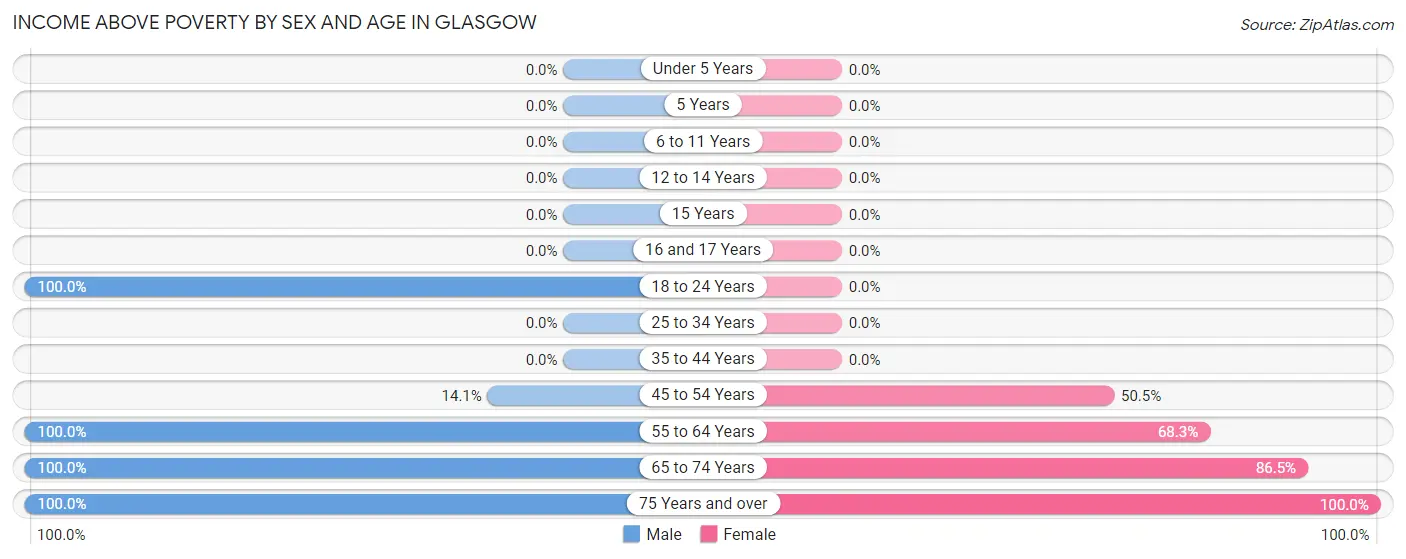
| Age Bracket | Male | Female |
| Under 5 Years | 0 (0.0%) | 0 (0.0%) |
| 5 Years | 0 (0.0%) | 0 (0.0%) |
| 6 to 11 Years | 0 (0.0%) | 0 (0.0%) |
| 12 to 14 Years | 0 (0.0%) | 0 (0.0%) |
| 15 Years | 0 (0.0%) | 0 (0.0%) |
| 16 and 17 Years | 0 (0.0%) | 0 (0.0%) |
| 18 to 24 Years | 14 (100.0%) | 0 (0.0%) |
| 25 to 34 Years | 0 (0.0%) | 0 (0.0%) |
| 35 to 44 Years | 0 (0.0%) | 0 (0.0%) |
| 45 to 54 Years | 9 (14.1%) | 47 (50.5%) |
| 55 to 64 Years | 111 (100.0%) | 41 (68.3%) |
| 65 to 74 Years | 103 (100.0%) | 77 (86.5%) |
| 75 Years and over | 83 (100.0%) | 31 (100.0%) |
| Total | 320 (69.0%) | 196 (43.0%) |
Income Below Poverty Among Married-Couple Families in Glasgow
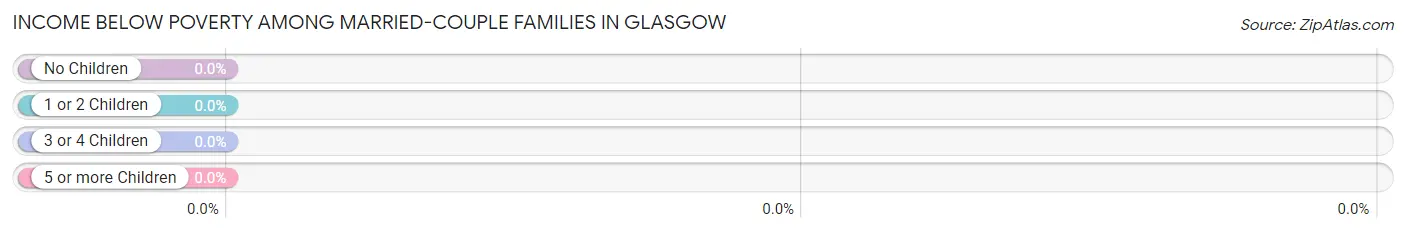
| Children | Above Poverty | Below Poverty |
| No Children | 158 (100.0%) | 0 (0.0%) |
| 1 or 2 Children | 0 (0.0%) | 0 (0.0%) |
| 3 or 4 Children | 0 (0.0%) | 0 (0.0%) |
| 5 or more Children | 0 (0.0%) | 0 (0.0%) |
| Total | 158 (100.0%) | 0 (0.0%) |
Income Below Poverty Among Single-Parent Households in Glasgow
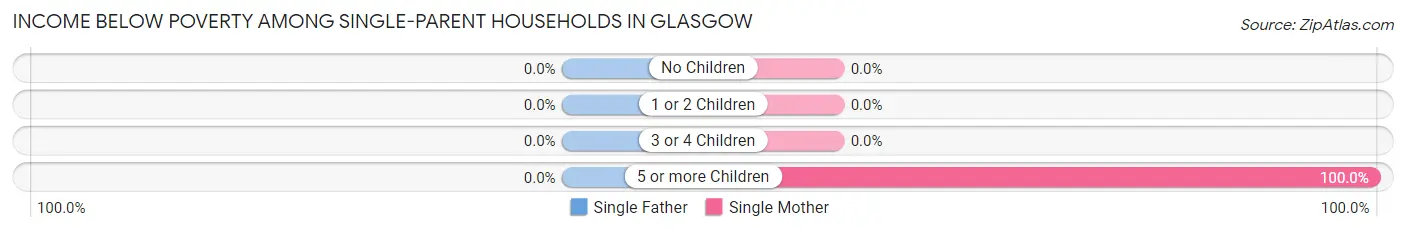
| Children | Single Father | Single Mother |
| No Children | 0 (0.0%) | 0 (0.0%) |
| 1 or 2 Children | 0 (0.0%) | 0 (0.0%) |
| 3 or 4 Children | 0 (0.0%) | 0 (0.0%) |
| 5 or more Children | 0 (0.0%) | 46 (100.0%) |
| Total | 0 (0.0%) | 46 (70.8%) |
Income Below Poverty Among Married-Couple vs Single-Parent Households in Glasgow
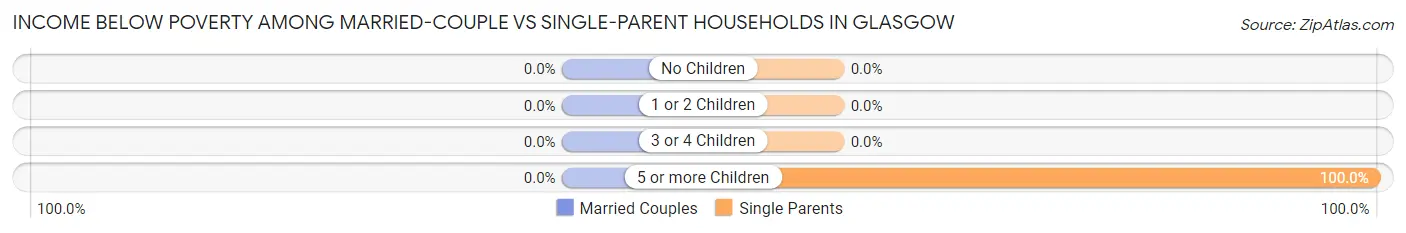
| Children | Married-Couple Families | Single-Parent Households |
| No Children | 0 (0.0%) | 0 (0.0%) |
| 1 or 2 Children | 0 (0.0%) | 0 (0.0%) |
| 3 or 4 Children | 0 (0.0%) | 0 (0.0%) |
| 5 or more Children | 0 (0.0%) | 46 (100.0%) |
| Total | 0 (0.0%) | 46 (70.8%) |
Race in Glasgow
The most populous races in Glasgow are White / Caucasian (875 | 95.1%), Two or more Races (38 | 4.1%), and Hispanic or Latino (19 | 2.1%).
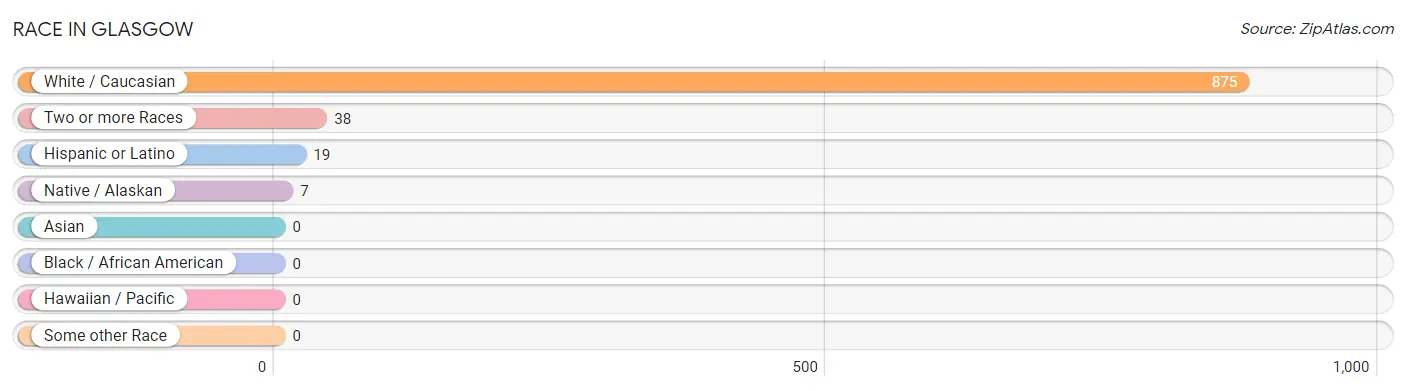
| Race | # Population | % Population |
| Asian | 0 | 0.0% |
| Black / African American | 0 | 0.0% |
| Hawaiian / Pacific | 0 | 0.0% |
| Hispanic or Latino | 19 | 2.1% |
| Native / Alaskan | 7 | 0.8% |
| White / Caucasian | 875 | 95.1% |
| Two or more Races | 38 | 4.1% |
| Some other Race | 0 | 0.0% |
| Total | 920 | 100.0% |
Ancestry in Glasgow
The most populous ancestries reported in Glasgow are Irish (184 | 20.0%), German (128 | 13.9%), Swedish (80 | 8.7%), French Canadian (52 | 5.7%), and Norwegian (43 | 4.7%), together accounting for 52.9% of all Glasgow residents.
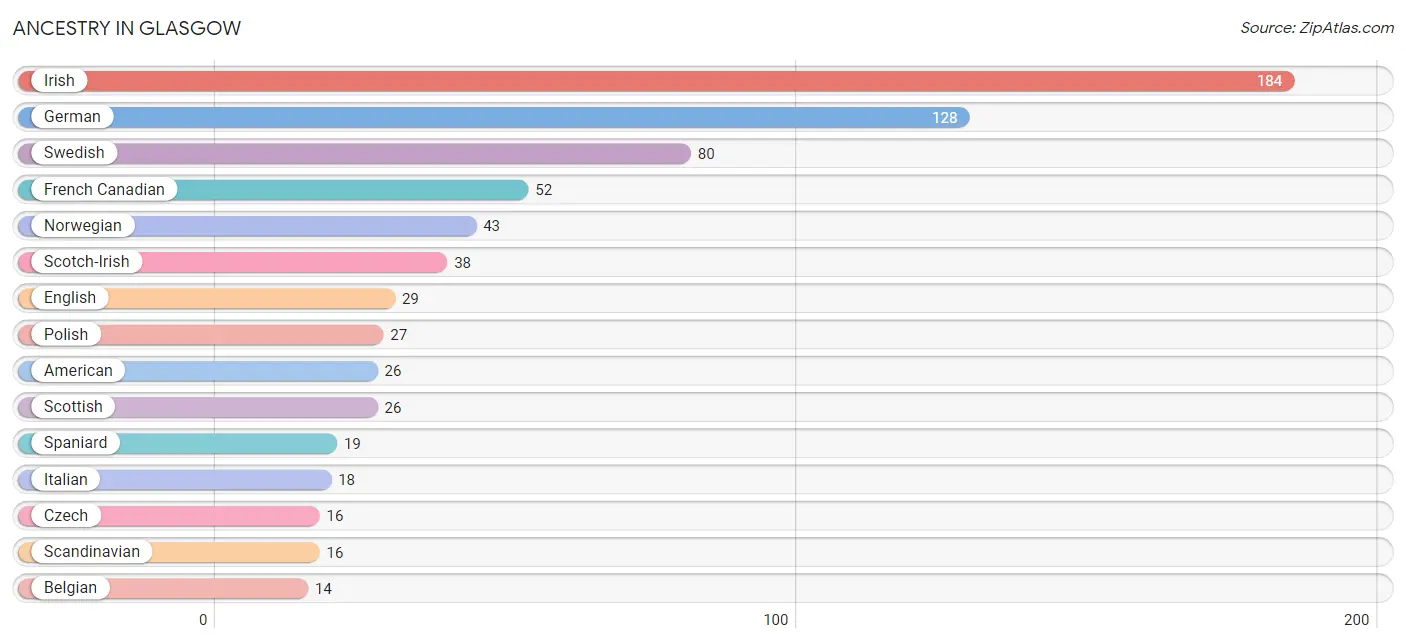
| Ancestry | # Population | % Population |
| American | 26 | 2.8% |
| Belgian | 14 | 1.5% |
| Choctaw | 7 | 0.8% |
| Czech | 16 | 1.7% |
| English | 29 | 3.2% |
| European | 4 | 0.4% |
| French | 5 | 0.5% |
| French Canadian | 52 | 5.7% |
| German | 128 | 13.9% |
| Irish | 184 | 20.0% |
| Italian | 18 | 2.0% |
| Norwegian | 43 | 4.7% |
| Polish | 27 | 2.9% |
| Russian | 10 | 1.1% |
| Scandinavian | 16 | 1.7% |
| Scotch-Irish | 38 | 4.1% |
| Scottish | 26 | 2.8% |
| Spaniard | 19 | 2.1% |
| Swedish | 80 | 8.7% |
| Yugoslavian | 10 | 1.1% | View All 20 Rows |
Immigrants in Glasgow
The most numerous immigrant groups reported in Glasgow came from Latin America (19 | 2.1%), Peru (19 | 2.1%), South America (19 | 2.1%), Europe (10 | 1.1%), and Northern Europe (10 | 1.1%), together accounting for 8.4% of all Glasgow residents.
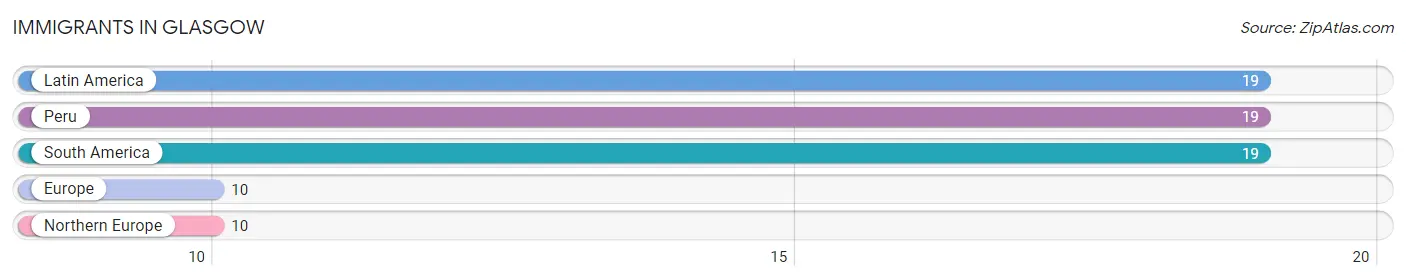
| Immigration Origin | # Population | % Population |
| Europe | 10 | 1.1% |
| Latin America | 19 | 2.1% |
| Northern Europe | 10 | 1.1% |
| Peru | 19 | 2.1% |
| South America | 19 | 2.1% | View All 5 Rows |
Sex and Age in Glasgow
Sex and Age in Glasgow
The most populous age groups in Glasgow are 5 to 9 Years (89 | 19.2%) for men and 10 to 14 Years (183 | 40.1%) for women.
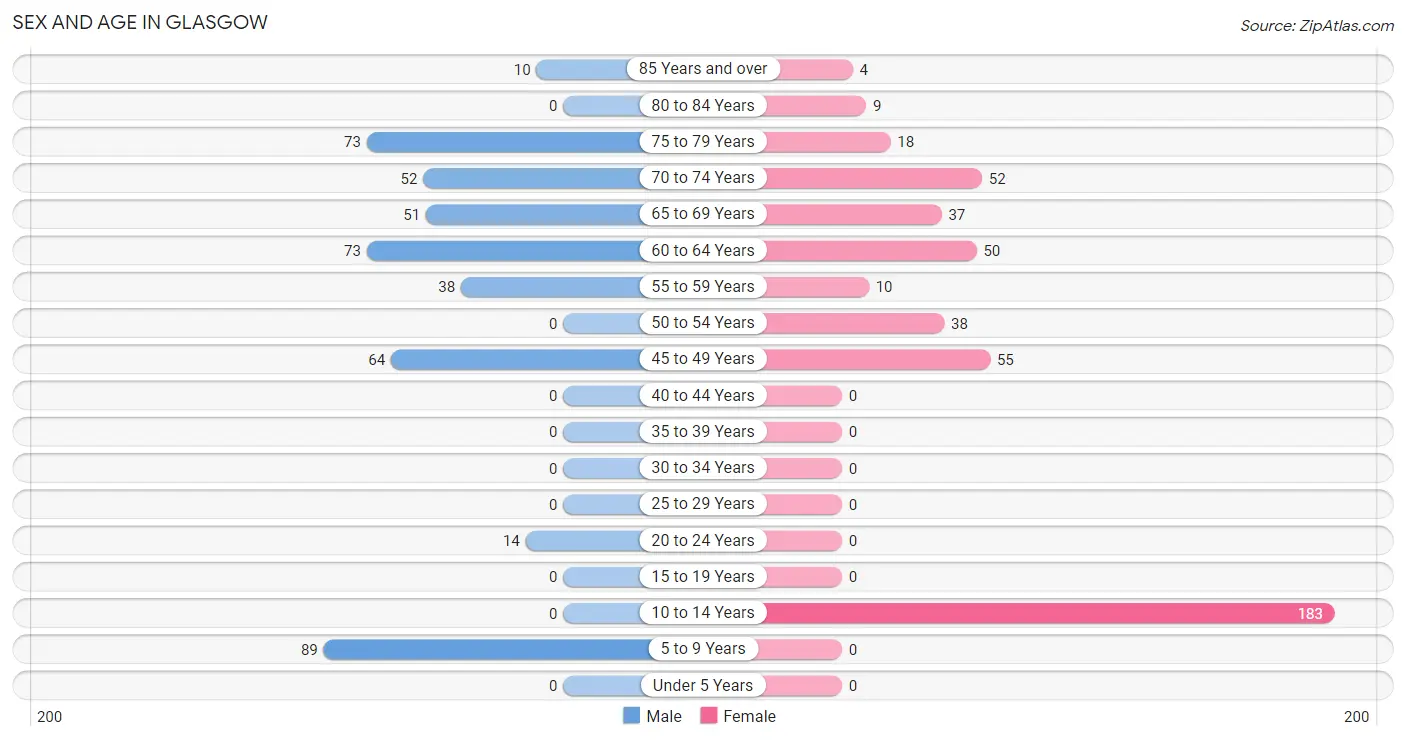
| Age Bracket | Male | Female |
| Under 5 Years | 0 (0.0%) | 0 (0.0%) |
| 5 to 9 Years | 89 (19.2%) | 0 (0.0%) |
| 10 to 14 Years | 0 (0.0%) | 183 (40.1%) |
| 15 to 19 Years | 0 (0.0%) | 0 (0.0%) |
| 20 to 24 Years | 14 (3.0%) | 0 (0.0%) |
| 25 to 29 Years | 0 (0.0%) | 0 (0.0%) |
| 30 to 34 Years | 0 (0.0%) | 0 (0.0%) |
| 35 to 39 Years | 0 (0.0%) | 0 (0.0%) |
| 40 to 44 Years | 0 (0.0%) | 0 (0.0%) |
| 45 to 49 Years | 64 (13.8%) | 55 (12.1%) |
| 50 to 54 Years | 0 (0.0%) | 38 (8.3%) |
| 55 to 59 Years | 38 (8.2%) | 10 (2.2%) |
| 60 to 64 Years | 73 (15.7%) | 50 (11.0%) |
| 65 to 69 Years | 51 (11.0%) | 37 (8.1%) |
| 70 to 74 Years | 52 (11.2%) | 52 (11.4%) |
| 75 to 79 Years | 73 (15.7%) | 18 (4.0%) |
| 80 to 84 Years | 0 (0.0%) | 9 (2.0%) |
| 85 Years and over | 10 (2.2%) | 4 (0.9%) |
| Total | 464 (100.0%) | 456 (100.0%) |
Families and Households in Glasgow
Median Family Size in Glasgow
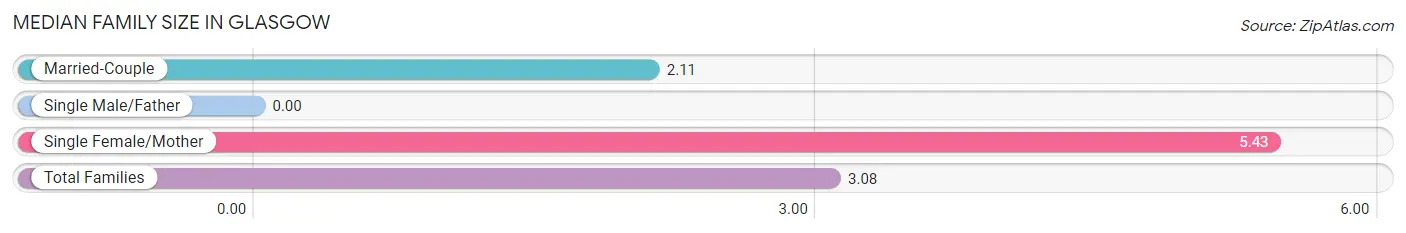
| Family Type | # Families | Family Size |
| Married-Couple | 158 (70.9%) | 2.11 |
| Single Male/Father | 0 (0.0%) | - |
| Single Female/Mother | 65 (29.1%) | 5.43 |
| Total Families | 223 (100.0%) | 3.08 |
Median Household Size in Glasgow
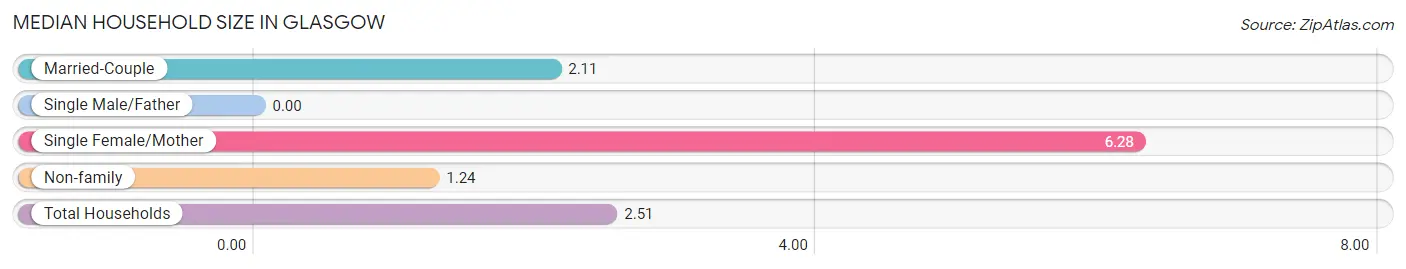
| Household Type | # Households | Household Size |
| Married-Couple | 158 (43.0%) | 2.11 |
| Single Male/Father | 0 (0.0%) | - |
| Single Female/Mother | 65 (17.7%) | 6.28 |
| Non-family | 144 (39.2%) | 1.24 |
| Total Households | 367 (100.0%) | 2.51 |
Household Size by Marriage Status in Glasgow
Out of a total of 367 households in Glasgow, 223 (60.8%) are family households, while 144 (39.2%) are nonfamily households. The most numerous type of family households are 2-person households, comprising 163, and the most common type of nonfamily households are 1-person households, comprising 113.
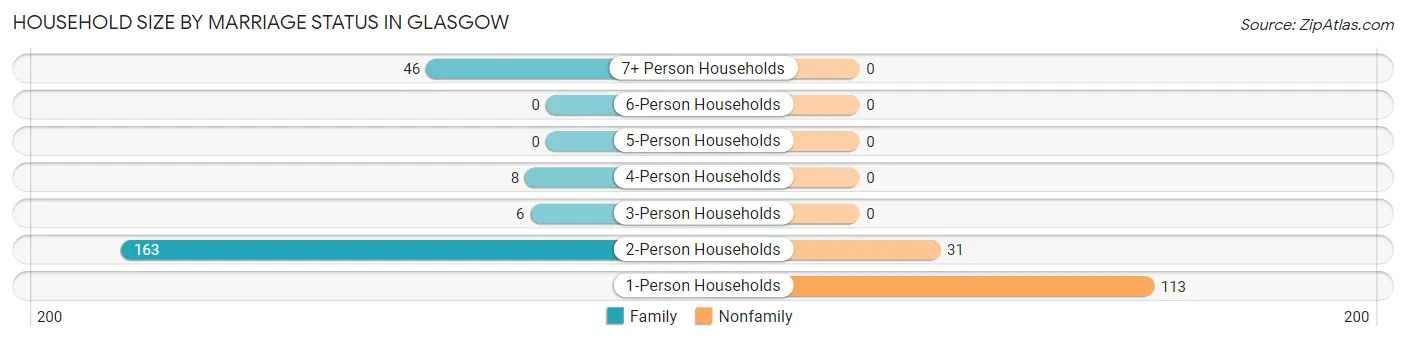
| Household Size | Family Households | Nonfamily Households |
| 1-Person Households | - | 113 (30.8%) |
| 2-Person Households | 163 (44.4%) | 31 (8.5%) |
| 3-Person Households | 6 (1.6%) | 0 (0.0%) |
| 4-Person Households | 8 (2.2%) | 0 (0.0%) |
| 5-Person Households | 0 (0.0%) | 0 (0.0%) |
| 6-Person Households | 0 (0.0%) | 0 (0.0%) |
| 7+ Person Households | 46 (12.5%) | 0 (0.0%) |
| Total | 223 (60.8%) | 144 (39.2%) |
Female Fertility in Glasgow
Fertility by Age in Glasgow
| Age Bracket | Women with Births | Births / 1,000 Women |
| 15 to 19 years | 0 (0.0%) | 0.0 |
| 20 to 34 years | 0 (0.0%) | 0.0 |
| 35 to 50 years | 0 (0.0%) | 0.0 |
| Total | 0 (0.0%) | 0.0 |
Fertility by Age by Marriage Status in Glasgow
| Age Bracket | Married | Unmarried |
| 15 to 19 years | 0 (0.0%) | 0 (0.0%) |
| 20 to 34 years | 0 (0.0%) | 0 (0.0%) |
| 35 to 50 years | 0 (0.0%) | 0 (0.0%) |
| Total | 0 (0.0%) | 0 (0.0%) |
Fertility by Education in Glasgow
| Educational Attainment | Women with Births | Births / 1,000 Women |
| Less than High School | 0 (0.0%) | 0.0 |
| High School Diploma | 0 (0.0%) | 0.0 |
| College or Associate's Degree | 0 (0.0%) | 0.0 |
| Bachelor's Degree | 0 (0.0%) | 0.0 |
| Graduate Degree | 0 (0.0%) | 0.0 |
| Total | 0 (0.0%) | 0.0 |
Fertility by Education by Marriage Status in Glasgow
| Educational Attainment | Married | Unmarried |
| Less than High School | 0 (0.0%) | 0 (0.0%) |
| High School Diploma | 0 (0.0%) | 0 (0.0%) |
| College or Associate's Degree | 0 (0.0%) | 0 (0.0%) |
| Bachelor's Degree | 0 (0.0%) | 0 (0.0%) |
| Graduate Degree | 0 (0.0%) | 0 (0.0%) |
| Total | 0 (0.0%) | 0 (0.0%) |
Employment Characteristics in Glasgow
Employment by Class of Employer in Glasgow
Among the 308 employed individuals in Glasgow, private company employees (160 | 51.9%), federal government employees (50 | 16.2%), and local government employees (38 | 12.3%) make up the most common classes of employment.
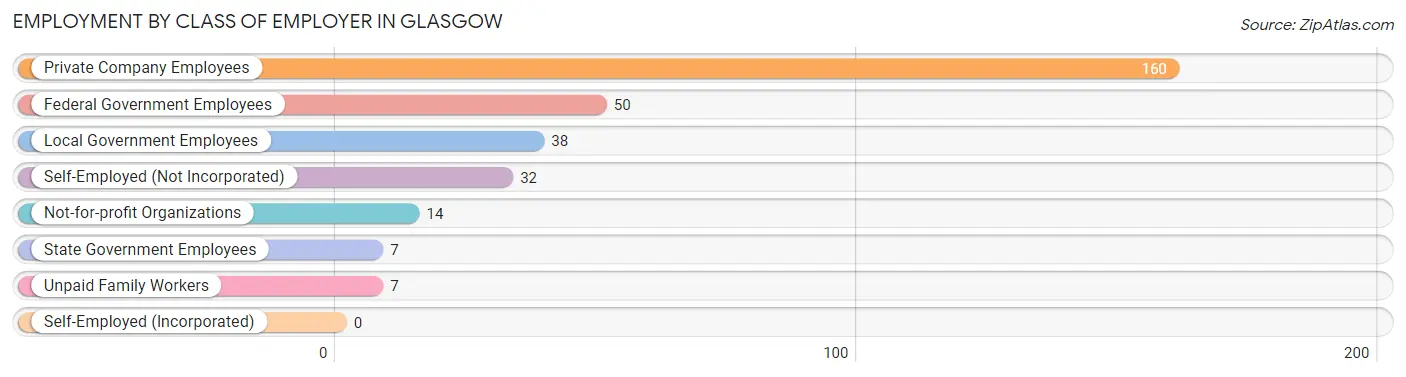
| Employer Class | # Employees | % Employees |
| Private Company Employees | 160 | 51.9% |
| Self-Employed (Incorporated) | 0 | 0.0% |
| Self-Employed (Not Incorporated) | 32 | 10.4% |
| Not-for-profit Organizations | 14 | 4.5% |
| Local Government Employees | 38 | 12.3% |
| State Government Employees | 7 | 2.3% |
| Federal Government Employees | 50 | 16.2% |
| Unpaid Family Workers | 7 | 2.3% |
| Total | 308 | 100.0% |
Employment Status by Age in Glasgow
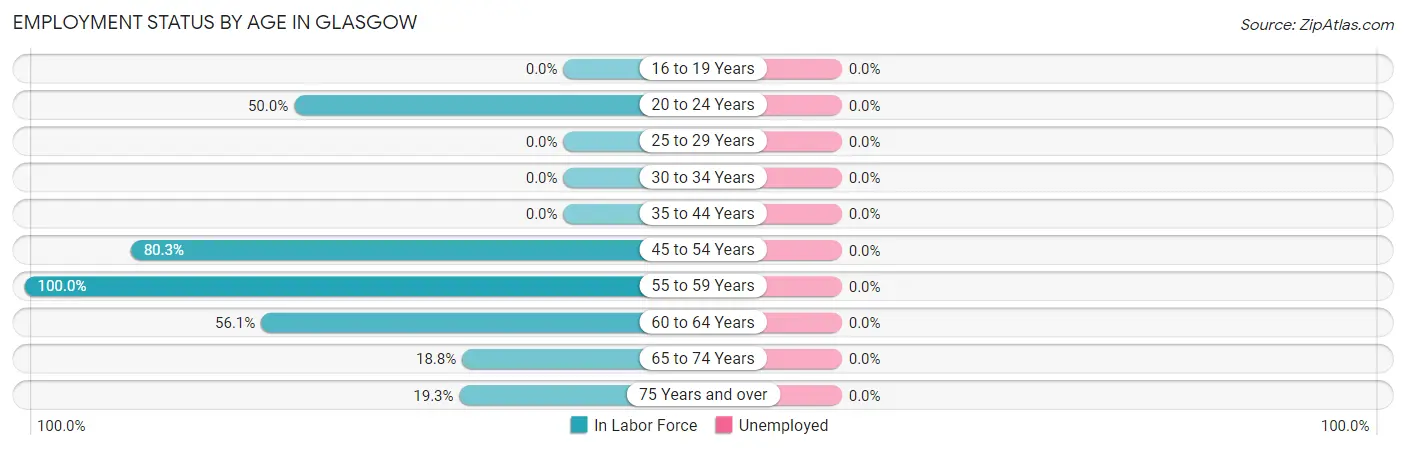
| Age Bracket | In Labor Force | Unemployed |
| 16 to 19 Years | 0 (0.0%) | 0 (0.0%) |
| 20 to 24 Years | 7 (50.0%) | 0 (0.0%) |
| 25 to 29 Years | 0 (0.0%) | 0 (0.0%) |
| 30 to 34 Years | 0 (0.0%) | 0 (0.0%) |
| 35 to 44 Years | 0 (0.0%) | 0 (0.0%) |
| 45 to 54 Years | 126 (80.3%) | 0 (0.0%) |
| 55 to 59 Years | 48 (100.0%) | 0 (0.0%) |
| 60 to 64 Years | 69 (56.1%) | 0 (0.0%) |
| 65 to 74 Years | 36 (18.8%) | 0 (0.0%) |
| 75 Years and over | 22 (19.3%) | 0 (0.0%) |
| Total | 308 (47.5%) | 0 (0.0%) |
Employment Status by Educational Attainment in Glasgow
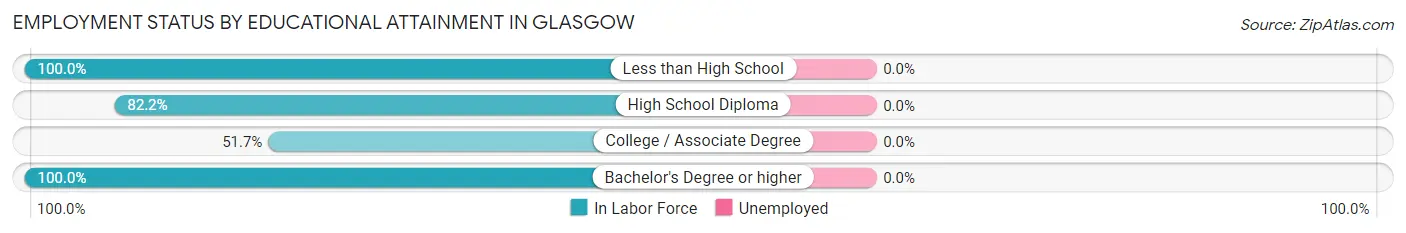
| Educational Attainment | In Labor Force | Unemployed |
| Less than High School | 50 (100.0%) | 0 (0.0%) |
| High School Diploma | 74 (82.2%) | 0 (0.0%) |
| College / Associate Degree | 74 (51.7%) | 0 (0.0%) |
| Bachelor's Degree or higher | 45 (100.0%) | 0 (0.0%) |
| Total | 243 (74.1%) | 0 (0.0%) |
Employment Occupations by Sex in Glasgow
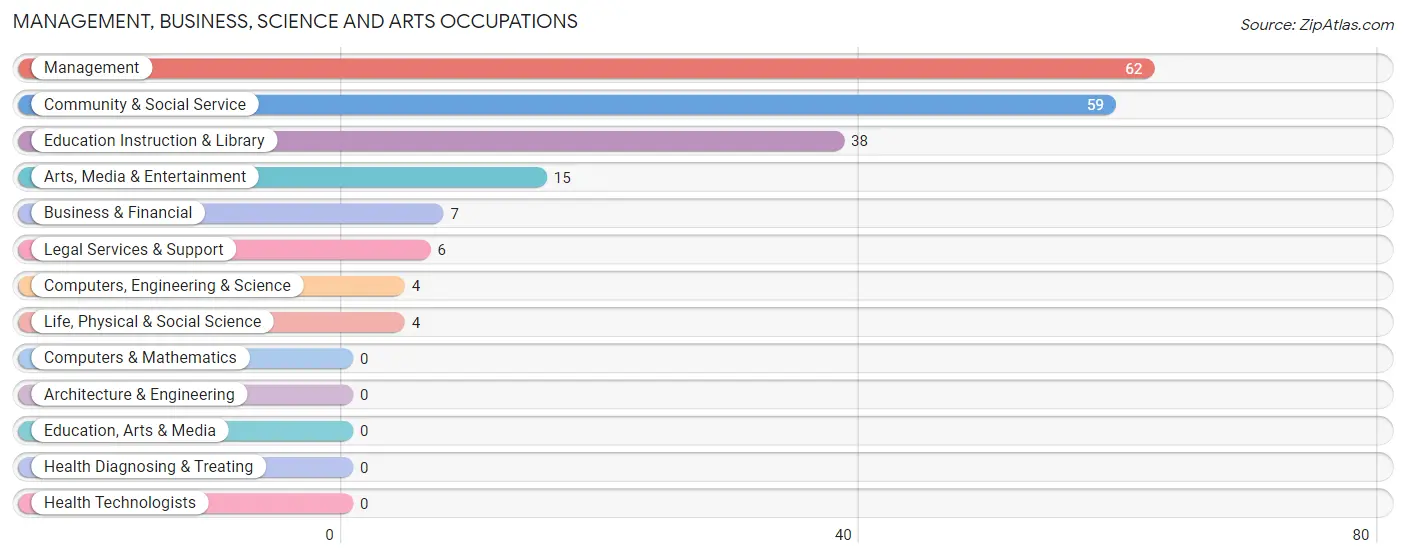
Management, Business, Science and Arts Occupations
The most common Management, Business, Science and Arts occupations in Glasgow are Management (62 | 20.1%), Community & Social Service (59 | 19.2%), Education Instruction & Library (38 | 12.3%), Arts, Media & Entertainment (15 | 4.9%), and Business & Financial (7 | 2.3%).
Management, Business, Science and Arts Occupations by Sex
Within the Management, Business, Science and Arts occupations in Glasgow, the most male-oriented occupations are Computers, Engineering & Science (100.0%), Life, Physical & Social Science (100.0%), and Legal Services & Support (100.0%), while the most female-oriented occupations are Business & Financial (100.0%), Management (74.2%), and Arts, Media & Entertainment (66.7%).
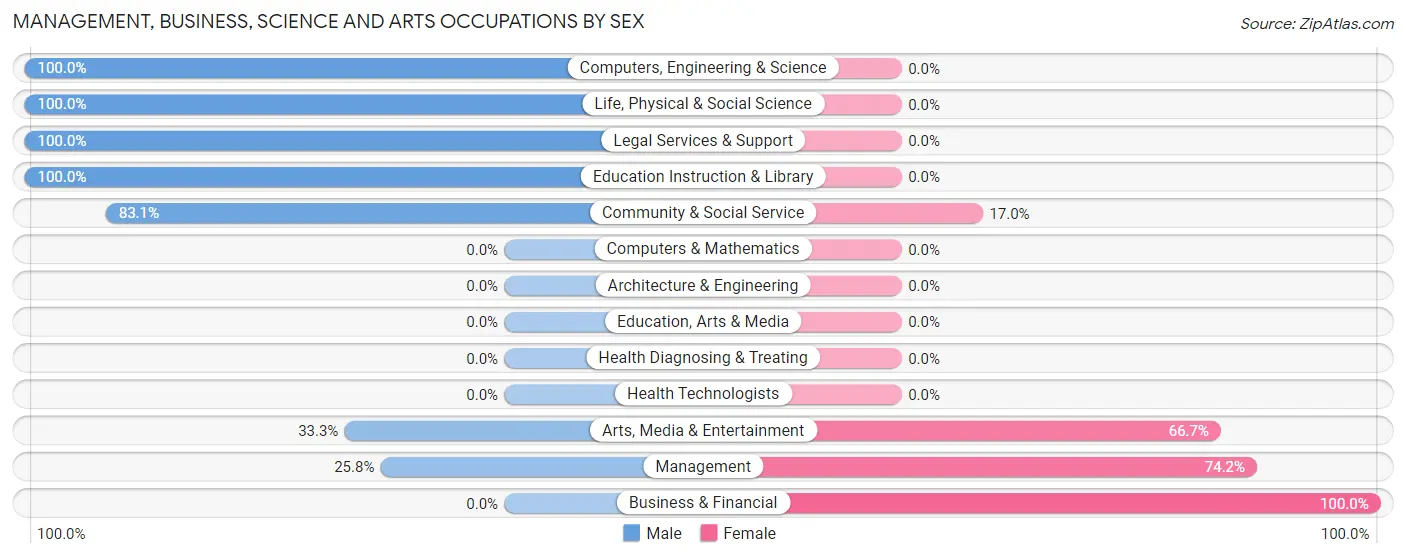
| Occupation | Male | Female |
| Management | 16 (25.8%) | 46 (74.2%) |
| Business & Financial | 0 (0.0%) | 7 (100.0%) |
| Computers, Engineering & Science | 4 (100.0%) | 0 (0.0%) |
| Computers & Mathematics | 0 (0.0%) | 0 (0.0%) |
| Architecture & Engineering | 0 (0.0%) | 0 (0.0%) |
| Life, Physical & Social Science | 4 (100.0%) | 0 (0.0%) |
| Community & Social Service | 49 (83.1%) | 10 (17.0%) |
| Education, Arts & Media | 0 (0.0%) | 0 (0.0%) |
| Legal Services & Support | 6 (100.0%) | 0 (0.0%) |
| Education Instruction & Library | 38 (100.0%) | 0 (0.0%) |
| Arts, Media & Entertainment | 5 (33.3%) | 10 (66.7%) |
| Health Diagnosing & Treating | 0 (0.0%) | 0 (0.0%) |
| Health Technologists | 0 (0.0%) | 0 (0.0%) |
| Total (Category) | 69 (52.3%) | 63 (47.7%) |
| Total (Overall) | 205 (66.6%) | 103 (33.4%) |
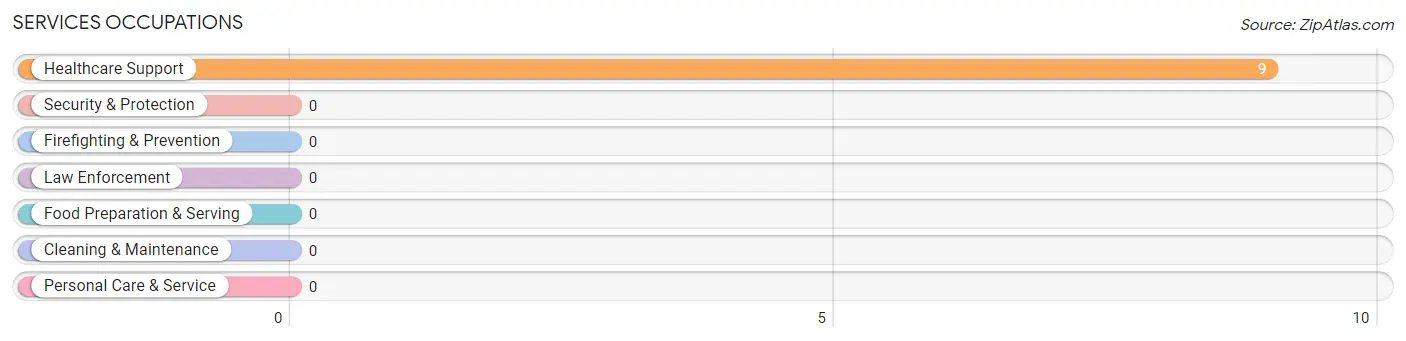
Services Occupations
The most common Services occupations in Glasgow are , and Healthcare Support (9 | 2.9%).
Services Occupations by Sex
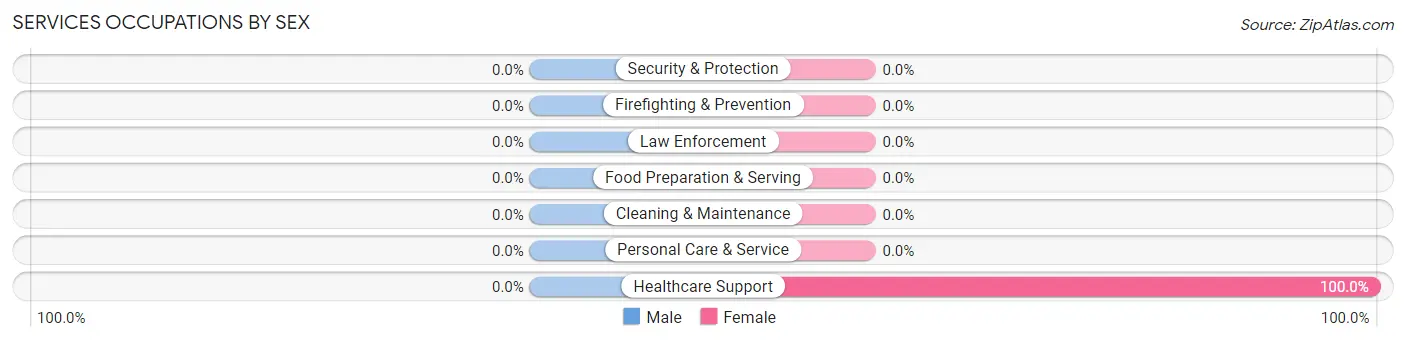
| Occupation | Male | Female |
| Healthcare Support | 0 (0.0%) | 9 (100.0%) |
| Security & Protection | 0 (0.0%) | 0 (0.0%) |
| Firefighting & Prevention | 0 (0.0%) | 0 (0.0%) |
| Law Enforcement | 0 (0.0%) | 0 (0.0%) |
| Food Preparation & Serving | 0 (0.0%) | 0 (0.0%) |
| Cleaning & Maintenance | 0 (0.0%) | 0 (0.0%) |
| Personal Care & Service | 0 (0.0%) | 0 (0.0%) |
| Total (Category) | 0 (0.0%) | 9 (100.0%) |
| Total (Overall) | 205 (66.6%) | 103 (33.4%) |
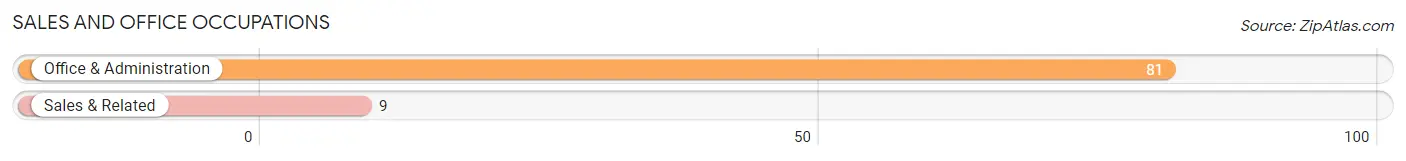
Sales and Office Occupations
The most common Sales and Office occupations in Glasgow are Office & Administration (81 | 26.3%), and Sales & Related (9 | 2.9%).
Sales and Office Occupations by Sex
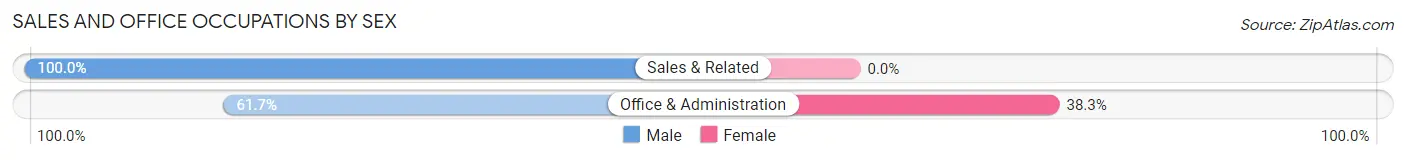
| Occupation | Male | Female |
| Sales & Related | 9 (100.0%) | 0 (0.0%) |
| Office & Administration | 50 (61.7%) | 31 (38.3%) |
| Total (Category) | 59 (65.6%) | 31 (34.4%) |
| Total (Overall) | 205 (66.6%) | 103 (33.4%) |
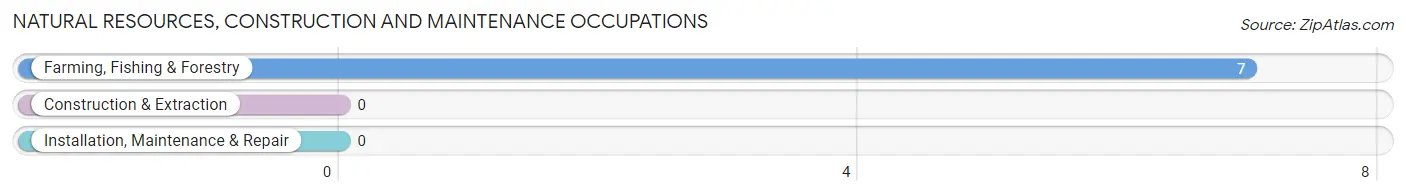
Natural Resources, Construction and Maintenance Occupations
The most common Natural Resources, Construction and Maintenance occupations in Glasgow are , and Farming, Fishing & Forestry (7 | 2.3%).
Natural Resources, Construction and Maintenance Occupations by Sex
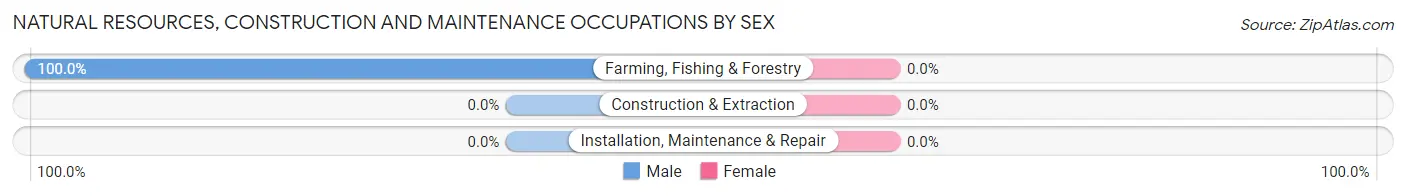
| Occupation | Male | Female |
| Farming, Fishing & Forestry | 7 (100.0%) | 0 (0.0%) |
| Construction & Extraction | 0 (0.0%) | 0 (0.0%) |
| Installation, Maintenance & Repair | 0 (0.0%) | 0 (0.0%) |
| Total (Category) | 7 (100.0%) | 0 (0.0%) |
| Total (Overall) | 205 (66.6%) | 103 (33.4%) |
Production, Transportation and Moving Occupations
The most common Production, Transportation and Moving occupations in Glasgow are Production (55 | 17.9%), Transportation (10 | 3.3%), and Material Moving (5 | 1.6%).
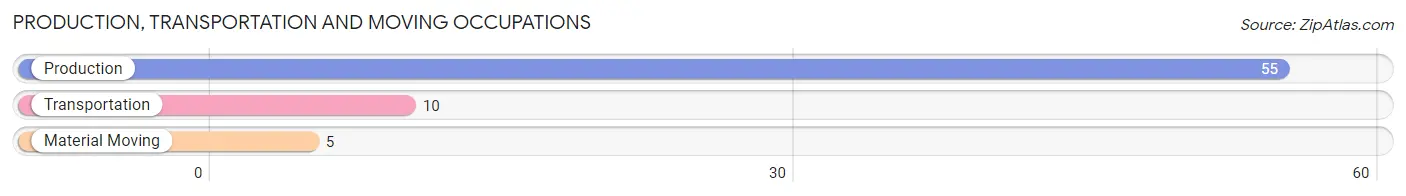
Production, Transportation and Moving Occupations by Sex
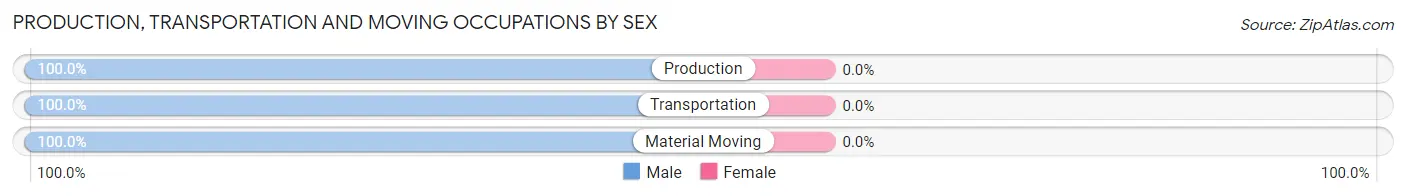
| Occupation | Male | Female |
| Production | 55 (100.0%) | 0 (0.0%) |
| Transportation | 10 (100.0%) | 0 (0.0%) |
| Material Moving | 5 (100.0%) | 0 (0.0%) |
| Total (Category) | 70 (100.0%) | 0 (0.0%) |
| Total (Overall) | 205 (66.6%) | 103 (33.4%) |
Employment Industries by Sex in Glasgow
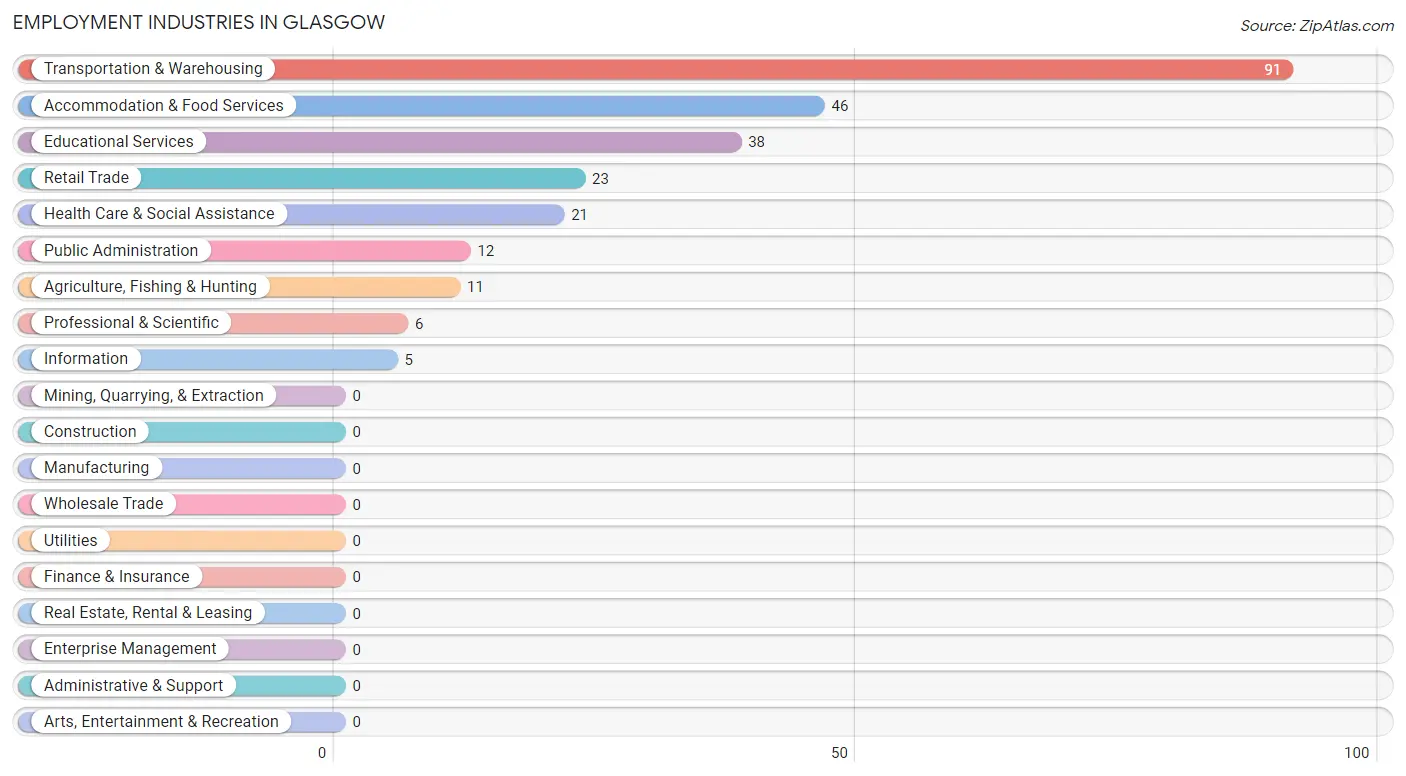
Employment Industries in Glasgow
The major employment industries in Glasgow include Transportation & Warehousing (91 | 29.5%), Accommodation & Food Services (46 | 14.9%), Educational Services (38 | 12.3%), Retail Trade (23 | 7.5%), and Health Care & Social Assistance (21 | 6.8%).
Employment Industries by Sex in Glasgow
The Glasgow industries that see more men than women are Agriculture, Fishing & Hunting (100.0%), Information (100.0%), and Professional & Scientific (100.0%), whereas the industries that tend to have a higher number of women are Accommodation & Food Services (100.0%), Health Care & Social Assistance (76.2%), and Retail Trade (60.9%).
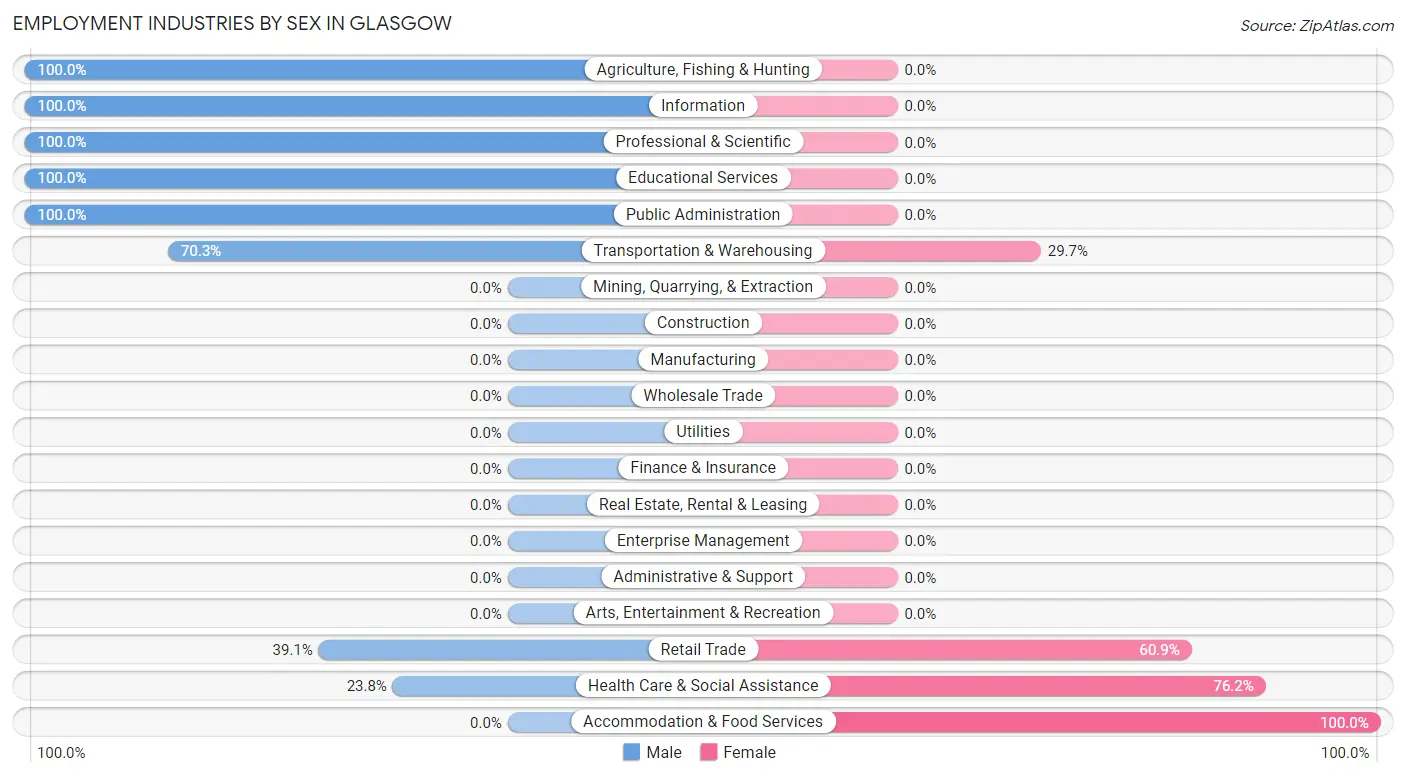
| Industry | Male | Female |
| Agriculture, Fishing & Hunting | 11 (100.0%) | 0 (0.0%) |
| Mining, Quarrying, & Extraction | 0 (0.0%) | 0 (0.0%) |
| Construction | 0 (0.0%) | 0 (0.0%) |
| Manufacturing | 0 (0.0%) | 0 (0.0%) |
| Wholesale Trade | 0 (0.0%) | 0 (0.0%) |
| Retail Trade | 9 (39.1%) | 14 (60.9%) |
| Transportation & Warehousing | 64 (70.3%) | 27 (29.7%) |
| Utilities | 0 (0.0%) | 0 (0.0%) |
| Information | 5 (100.0%) | 0 (0.0%) |
| Finance & Insurance | 0 (0.0%) | 0 (0.0%) |
| Real Estate, Rental & Leasing | 0 (0.0%) | 0 (0.0%) |
| Professional & Scientific | 6 (100.0%) | 0 (0.0%) |
| Enterprise Management | 0 (0.0%) | 0 (0.0%) |
| Administrative & Support | 0 (0.0%) | 0 (0.0%) |
| Educational Services | 38 (100.0%) | 0 (0.0%) |
| Health Care & Social Assistance | 5 (23.8%) | 16 (76.2%) |
| Arts, Entertainment & Recreation | 0 (0.0%) | 0 (0.0%) |
| Accommodation & Food Services | 0 (0.0%) | 46 (100.0%) |
| Public Administration | 12 (100.0%) | 0 (0.0%) |
| Total | 205 (66.6%) | 103 (33.4%) |
Education in Glasgow
School Enrollment in Glasgow
The most common levels of schooling among the 272 students in Glasgow are middle school (122 | 44.9%), elementary school (89 | 32.7%), and high school (61 | 22.4%).
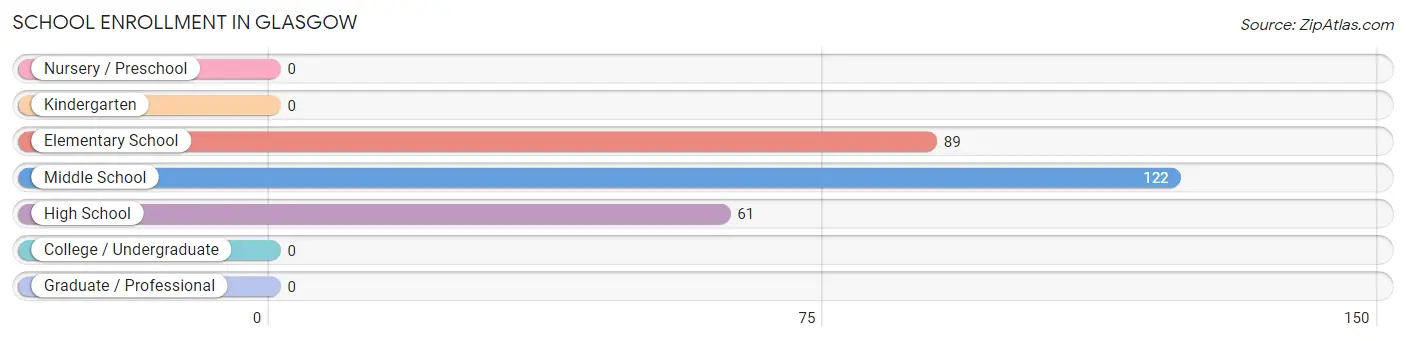
| School Level | # Students | % Students |
| Nursery / Preschool | 0 | 0.0% |
| Kindergarten | 0 | 0.0% |
| Elementary School | 89 | 32.7% |
| Middle School | 122 | 44.9% |
| High School | 61 | 22.4% |
| College / Undergraduate | 0 | 0.0% |
| Graduate / Professional | 0 | 0.0% |
| Total | 272 | 100.0% |
School Enrollment by Age by Funding Source in Glasgow
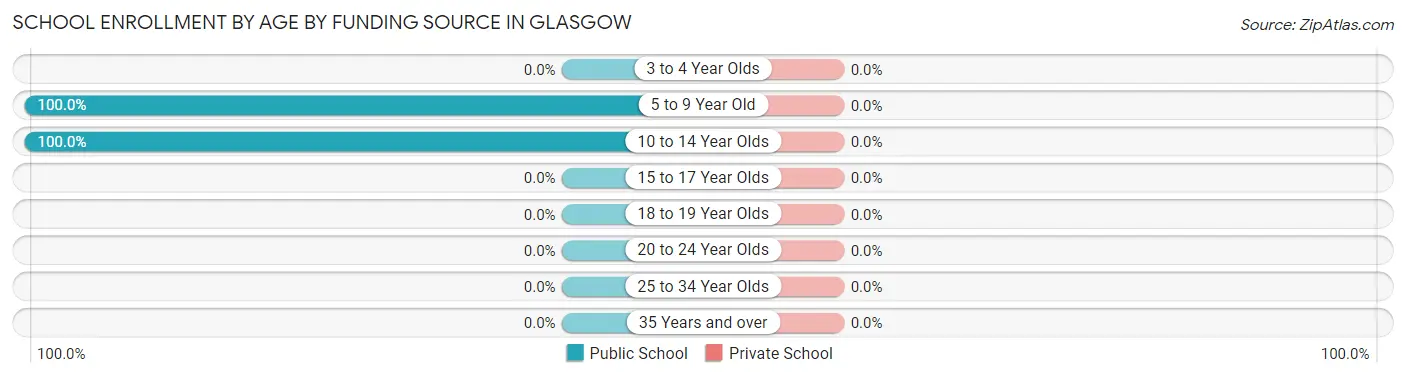
| Age Bracket | Public School | Private School |
| 3 to 4 Year Olds | 0 (0.0%) | 0 (0.0%) |
| 5 to 9 Year Old | 89 (100.0%) | 0 (0.0%) |
| 10 to 14 Year Olds | 183 (100.0%) | 0 (0.0%) |
| 15 to 17 Year Olds | 0 (0.0%) | 0 (0.0%) |
| 18 to 19 Year Olds | 0 (0.0%) | 0 (0.0%) |
| 20 to 24 Year Olds | 0 (0.0%) | 0 (0.0%) |
| 25 to 34 Year Olds | 0 (0.0%) | 0 (0.0%) |
| 35 Years and over | 0 (0.0%) | 0 (0.0%) |
| Total | 272 (100.0%) | 0 (0.0%) |
Educational Attainment by Field of Study in Glasgow
Science & technology (48 | 43.2%), liberal arts & history (33 | 29.7%), psychology (7 | 6.3%), social sciences (6 | 5.4%), and business (5 | 4.5%) are the most common fields of study among 111 individuals in Glasgow who have obtained a bachelor's degree or higher.
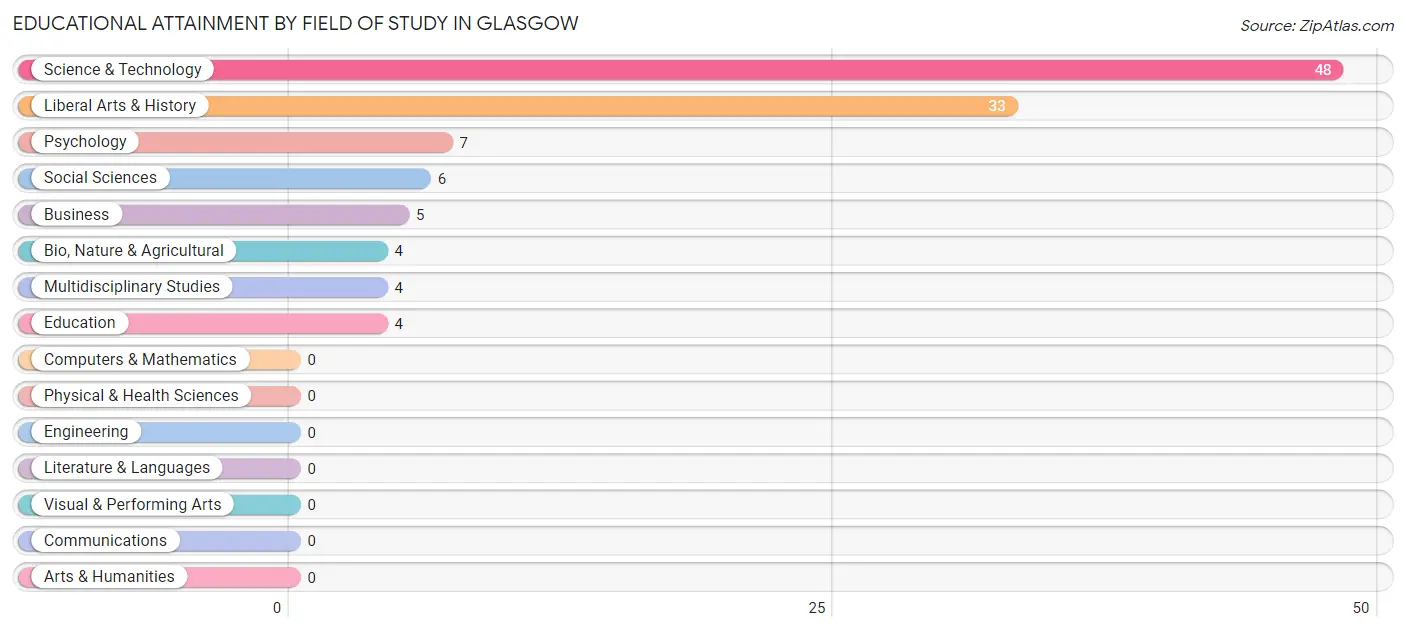
| Field of Study | # Graduates | % Graduates |
| Computers & Mathematics | 0 | 0.0% |
| Bio, Nature & Agricultural | 4 | 3.6% |
| Physical & Health Sciences | 0 | 0.0% |
| Psychology | 7 | 6.3% |
| Social Sciences | 6 | 5.4% |
| Engineering | 0 | 0.0% |
| Multidisciplinary Studies | 4 | 3.6% |
| Science & Technology | 48 | 43.2% |
| Business | 5 | 4.5% |
| Education | 4 | 3.6% |
| Literature & Languages | 0 | 0.0% |
| Liberal Arts & History | 33 | 29.7% |
| Visual & Performing Arts | 0 | 0.0% |
| Communications | 0 | 0.0% |
| Arts & Humanities | 0 | 0.0% |
| Total | 111 | 100.0% |
Transportation & Commute in Glasgow
Vehicle Availability by Sex in Glasgow
The most prevalent vehicle ownership categories in Glasgow are males with 2 vehicles (110, accounting for 53.7%) and females with 2 vehicles (9, making up 106.8%).
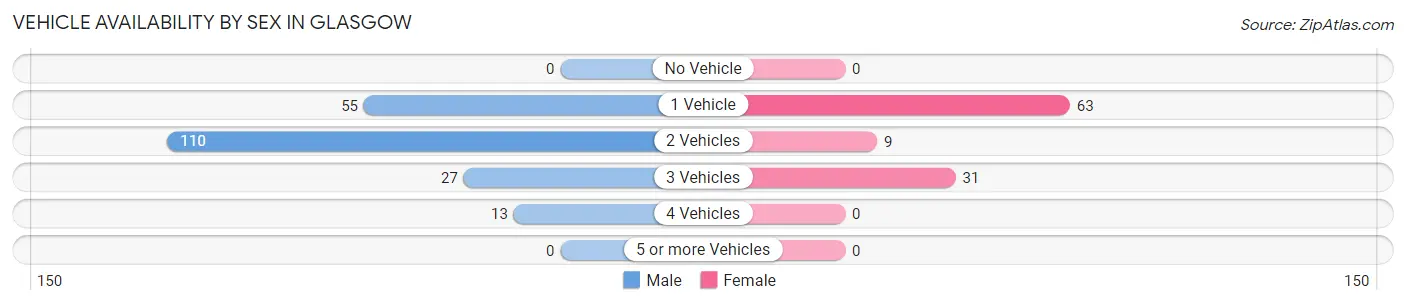
| Vehicles Available | Male | Female |
| No Vehicle | 0 (0.0%) | 0 (0.0%) |
| 1 Vehicle | 55 (26.8%) | 63 (61.2%) |
| 2 Vehicles | 110 (53.7%) | 9 (8.7%) |
| 3 Vehicles | 27 (13.2%) | 31 (30.1%) |
| 4 Vehicles | 13 (6.3%) | 0 (0.0%) |
| 5 or more Vehicles | 0 (0.0%) | 0 (0.0%) |
| Total | 205 (100.0%) | 103 (100.0%) |
Commute Time in Glasgow
The most frequently occuring commute durations in Glasgow are 10 to 14 minutes (140 commuters, 60.1%), 15 to 19 minutes (36 commuters, 15.4%), and 90 or more minutes (27 commuters, 11.6%).
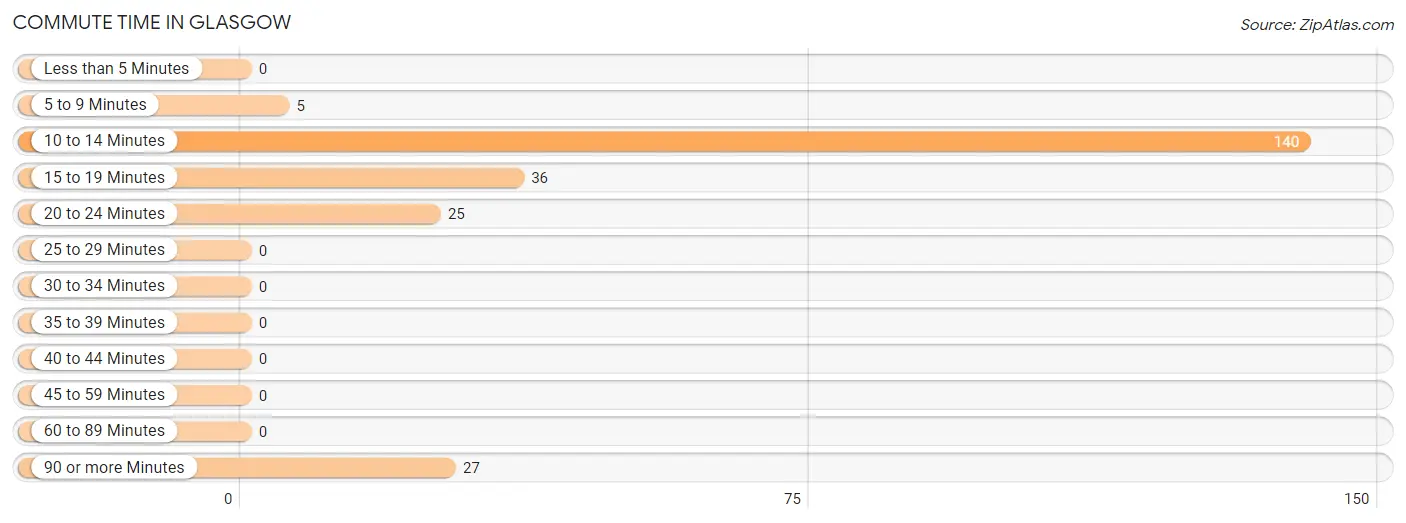
| Commute Time | # Commuters | % Commuters |
| Less than 5 Minutes | 0 | 0.0% |
| 5 to 9 Minutes | 5 | 2.1% |
| 10 to 14 Minutes | 140 | 60.1% |
| 15 to 19 Minutes | 36 | 15.4% |
| 20 to 24 Minutes | 25 | 10.7% |
| 25 to 29 Minutes | 0 | 0.0% |
| 30 to 34 Minutes | 0 | 0.0% |
| 35 to 39 Minutes | 0 | 0.0% |
| 40 to 44 Minutes | 0 | 0.0% |
| 45 to 59 Minutes | 0 | 0.0% |
| 60 to 89 Minutes | 0 | 0.0% |
| 90 or more Minutes | 27 | 11.6% |
Commute Time by Sex in Glasgow
The most common commute times in Glasgow are 10 to 14 minutes (140 commuters, 79.5%) for males and 90 or more minutes (27 commuters, 47.4%) for females.
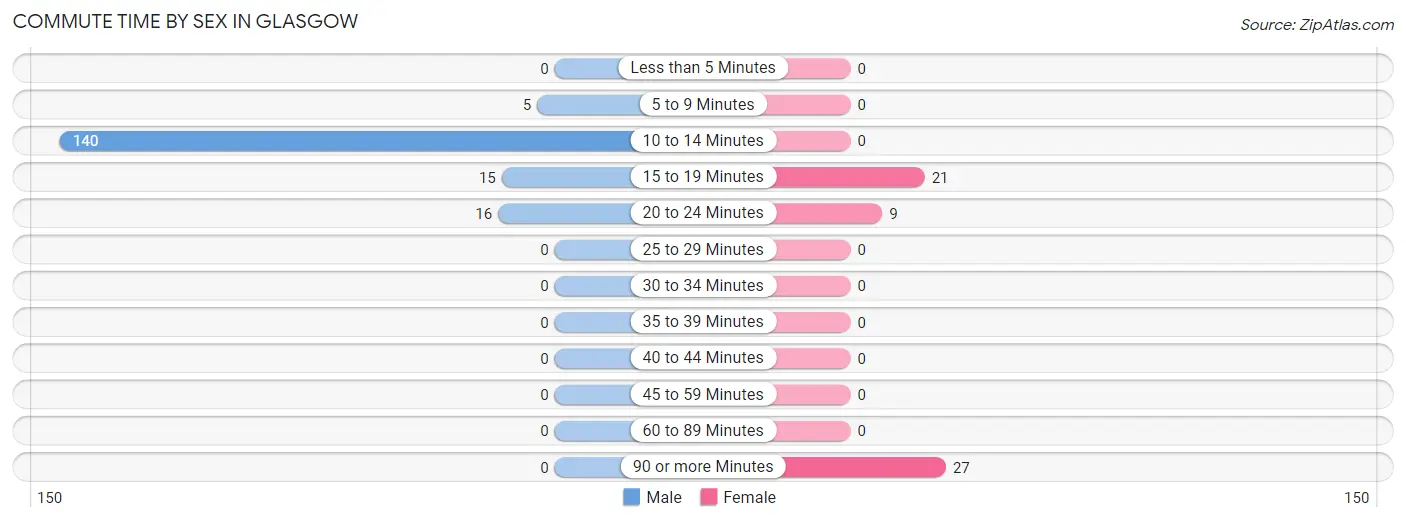
| Commute Time | Male | Female |
| Less than 5 Minutes | 0 (0.0%) | 0 (0.0%) |
| 5 to 9 Minutes | 5 (2.8%) | 0 (0.0%) |
| 10 to 14 Minutes | 140 (79.5%) | 0 (0.0%) |
| 15 to 19 Minutes | 15 (8.5%) | 21 (36.8%) |
| 20 to 24 Minutes | 16 (9.1%) | 9 (15.8%) |
| 25 to 29 Minutes | 0 (0.0%) | 0 (0.0%) |
| 30 to 34 Minutes | 0 (0.0%) | 0 (0.0%) |
| 35 to 39 Minutes | 0 (0.0%) | 0 (0.0%) |
| 40 to 44 Minutes | 0 (0.0%) | 0 (0.0%) |
| 45 to 59 Minutes | 0 (0.0%) | 0 (0.0%) |
| 60 to 89 Minutes | 0 (0.0%) | 0 (0.0%) |
| 90 or more Minutes | 0 (0.0%) | 27 (47.4%) |
Time of Departure to Work by Sex in Glasgow
The most frequent times of departure to work in Glasgow are 12:00 AM to 4:59 AM (55, 31.2%) for males and 12:00 PM to 3:59 PM (27, 47.4%) for females.
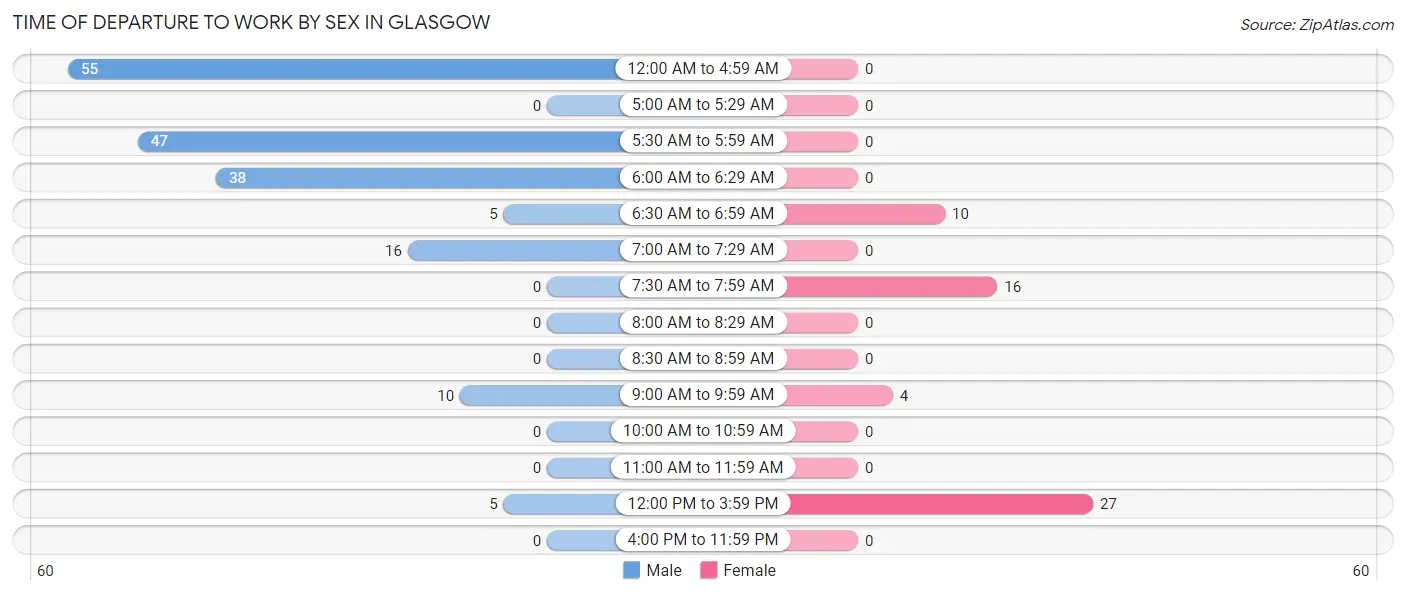
| Time of Departure | Male | Female |
| 12:00 AM to 4:59 AM | 55 (31.2%) | 0 (0.0%) |
| 5:00 AM to 5:29 AM | 0 (0.0%) | 0 (0.0%) |
| 5:30 AM to 5:59 AM | 47 (26.7%) | 0 (0.0%) |
| 6:00 AM to 6:29 AM | 38 (21.6%) | 0 (0.0%) |
| 6:30 AM to 6:59 AM | 5 (2.8%) | 10 (17.5%) |
| 7:00 AM to 7:29 AM | 16 (9.1%) | 0 (0.0%) |
| 7:30 AM to 7:59 AM | 0 (0.0%) | 16 (28.1%) |
| 8:00 AM to 8:29 AM | 0 (0.0%) | 0 (0.0%) |
| 8:30 AM to 8:59 AM | 0 (0.0%) | 0 (0.0%) |
| 9:00 AM to 9:59 AM | 10 (5.7%) | 4 (7.0%) |
| 10:00 AM to 10:59 AM | 0 (0.0%) | 0 (0.0%) |
| 11:00 AM to 11:59 AM | 0 (0.0%) | 0 (0.0%) |
| 12:00 PM to 3:59 PM | 5 (2.8%) | 27 (47.4%) |
| 4:00 PM to 11:59 PM | 0 (0.0%) | 0 (0.0%) |
| Total | 176 (100.0%) | 57 (100.0%) |
Housing Occupancy in Glasgow
Occupancy by Ownership in Glasgow
Of the total 367 dwellings in Glasgow, owner-occupied units account for 304 (82.8%), while renter-occupied units make up 63 (17.2%).
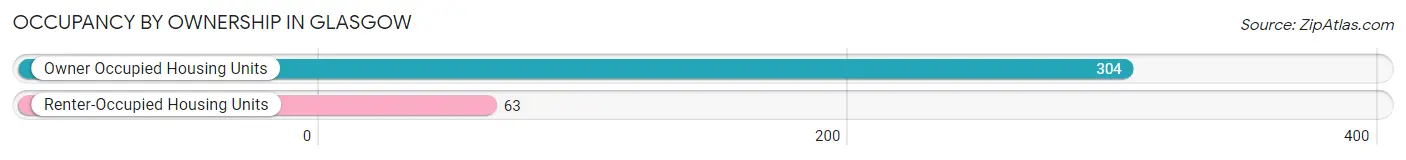
| Occupancy | # Housing Units | % Housing Units |
| Owner Occupied Housing Units | 304 | 82.8% |
| Renter-Occupied Housing Units | 63 | 17.2% |
| Total Occupied Housing Units | 367 | 100.0% |
Occupancy by Household Size in Glasgow
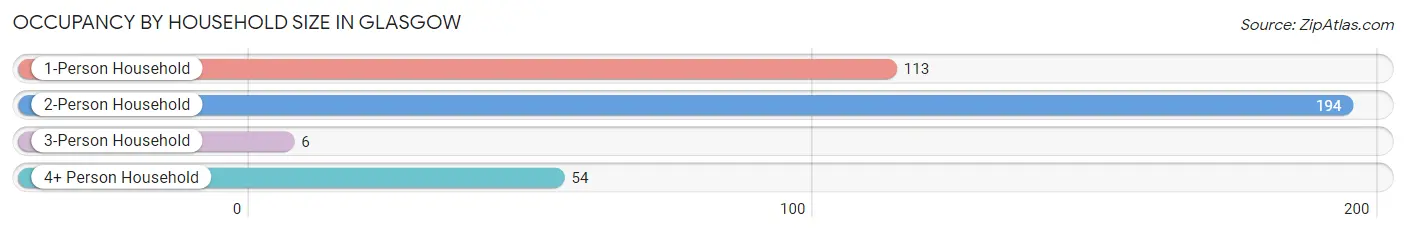
| Household Size | # Housing Units | % Housing Units |
| 1-Person Household | 113 | 30.8% |
| 2-Person Household | 194 | 52.9% |
| 3-Person Household | 6 | 1.6% |
| 4+ Person Household | 54 | 14.7% |
| Total Housing Units | 367 | 100.0% |
Occupancy by Ownership by Household Size in Glasgow
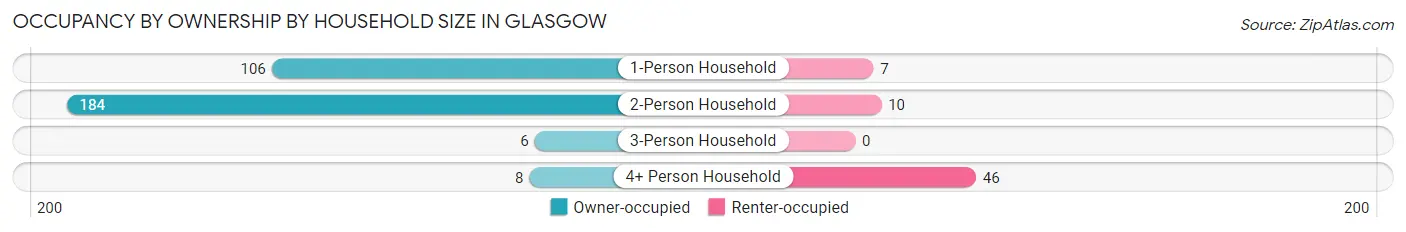
| Household Size | Owner-occupied | Renter-occupied |
| 1-Person Household | 106 (93.8%) | 7 (6.2%) |
| 2-Person Household | 184 (94.9%) | 10 (5.1%) |
| 3-Person Household | 6 (100.0%) | 0 (0.0%) |
| 4+ Person Household | 8 (14.8%) | 46 (85.2%) |
| Total Housing Units | 304 (82.8%) | 63 (17.2%) |
Occupancy by Educational Attainment in Glasgow
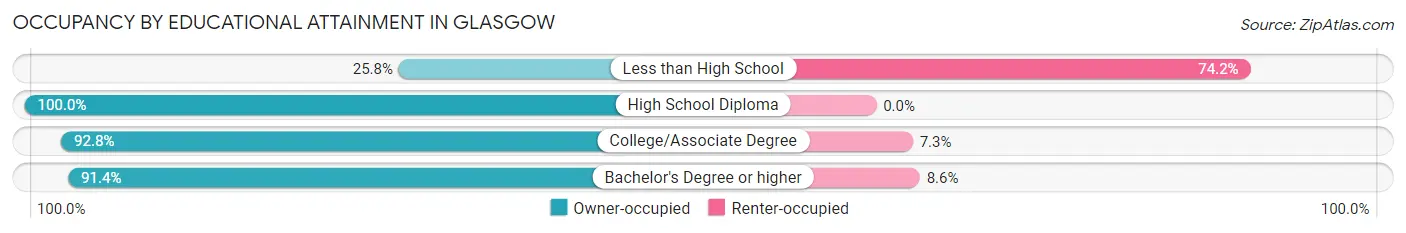
| Household Size | Owner-occupied | Renter-occupied |
| Less than High School | 16 (25.8%) | 46 (74.2%) |
| High School Diploma | 86 (100.0%) | 0 (0.0%) |
| College/Associate Degree | 128 (92.7%) | 10 (7.2%) |
| Bachelor's Degree or higher | 74 (91.4%) | 7 (8.6%) |
Occupancy by Age of Householder in Glasgow
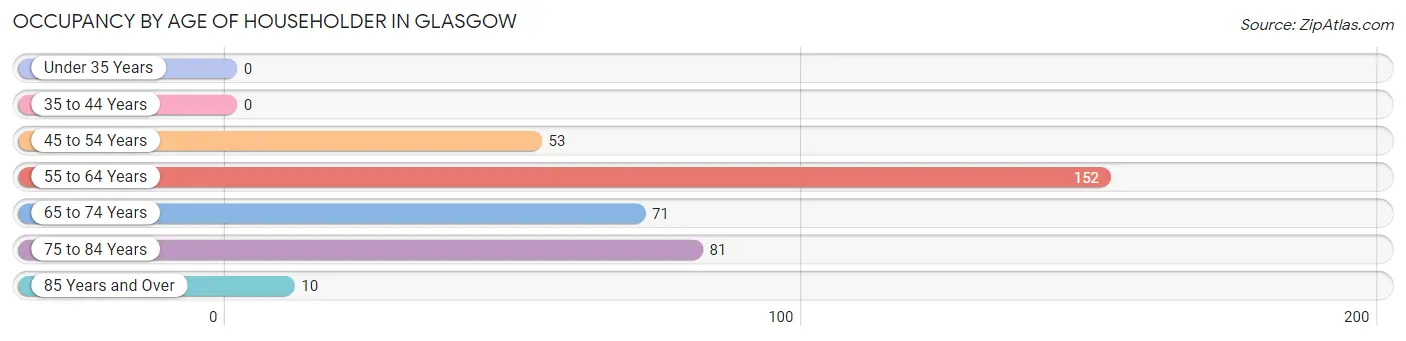
| Age Bracket | # Households | % Households |
| Under 35 Years | 0 | 0.0% |
| 35 to 44 Years | 0 | 0.0% |
| 45 to 54 Years | 53 | 14.4% |
| 55 to 64 Years | 152 | 41.4% |
| 65 to 74 Years | 71 | 19.4% |
| 75 to 84 Years | 81 | 22.1% |
| 85 Years and Over | 10 | 2.7% |
| Total | 367 | 100.0% |
Housing Finances in Glasgow
Median Income by Occupancy in Glasgow
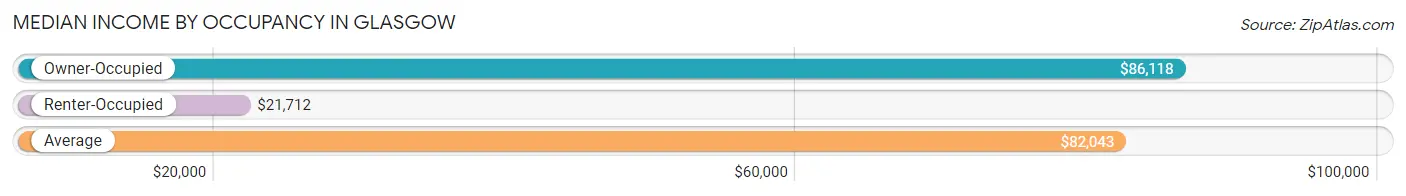
| Occupancy Type | # Households | Median Income |
| Owner-Occupied | 304 (82.8%) | $86,118 |
| Renter-Occupied | 63 (17.2%) | $21,712 |
| Average | 367 (100.0%) | $82,043 |
Occupancy by Householder Income Bracket in Glasgow
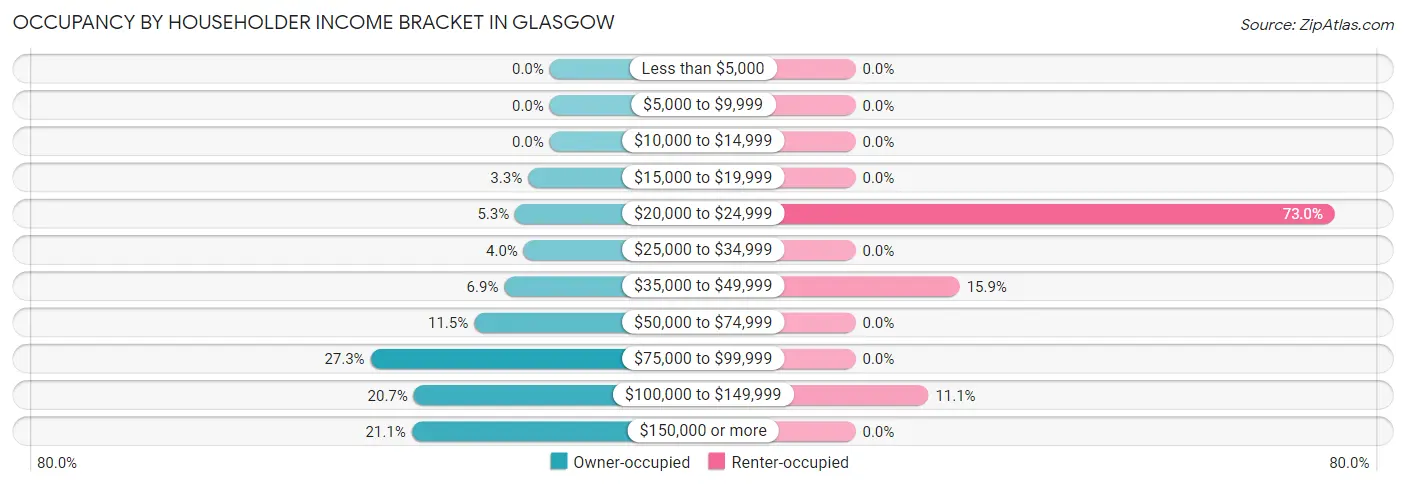
| Income Bracket | Owner-occupied | Renter-occupied |
| Less than $5,000 | 0 (0.0%) | 0 (0.0%) |
| $5,000 to $9,999 | 0 (0.0%) | 0 (0.0%) |
| $10,000 to $14,999 | 0 (0.0%) | 0 (0.0%) |
| $15,000 to $19,999 | 10 (3.3%) | 0 (0.0%) |
| $20,000 to $24,999 | 16 (5.3%) | 46 (73.0%) |
| $25,000 to $34,999 | 12 (4.0%) | 0 (0.0%) |
| $35,000 to $49,999 | 21 (6.9%) | 10 (15.9%) |
| $50,000 to $74,999 | 35 (11.5%) | 0 (0.0%) |
| $75,000 to $99,999 | 83 (27.3%) | 0 (0.0%) |
| $100,000 to $149,999 | 63 (20.7%) | 7 (11.1%) |
| $150,000 or more | 64 (21.0%) | 0 (0.0%) |
| Total | 304 (100.0%) | 63 (100.0%) |
Monthly Housing Cost Tiers in Glasgow
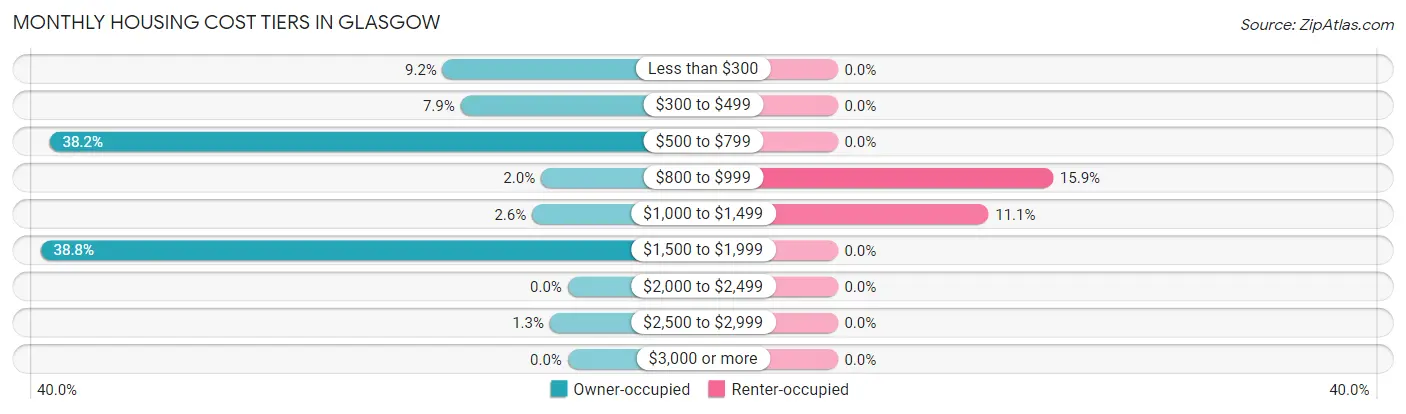
| Monthly Cost | Owner-occupied | Renter-occupied |
| Less than $300 | 28 (9.2%) | 0 (0.0%) |
| $300 to $499 | 24 (7.9%) | 0 (0.0%) |
| $500 to $799 | 116 (38.2%) | 0 (0.0%) |
| $800 to $999 | 6 (2.0%) | 10 (15.9%) |
| $1,000 to $1,499 | 8 (2.6%) | 7 (11.1%) |
| $1,500 to $1,999 | 118 (38.8%) | 0 (0.0%) |
| $2,000 to $2,499 | 0 (0.0%) | 0 (0.0%) |
| $2,500 to $2,999 | 4 (1.3%) | 0 (0.0%) |
| $3,000 or more | 0 (0.0%) | 0 (0.0%) |
| Total | 304 (100.0%) | 63 (100.0%) |
Physical Housing Characteristics in Glasgow
Housing Structures in Glasgow
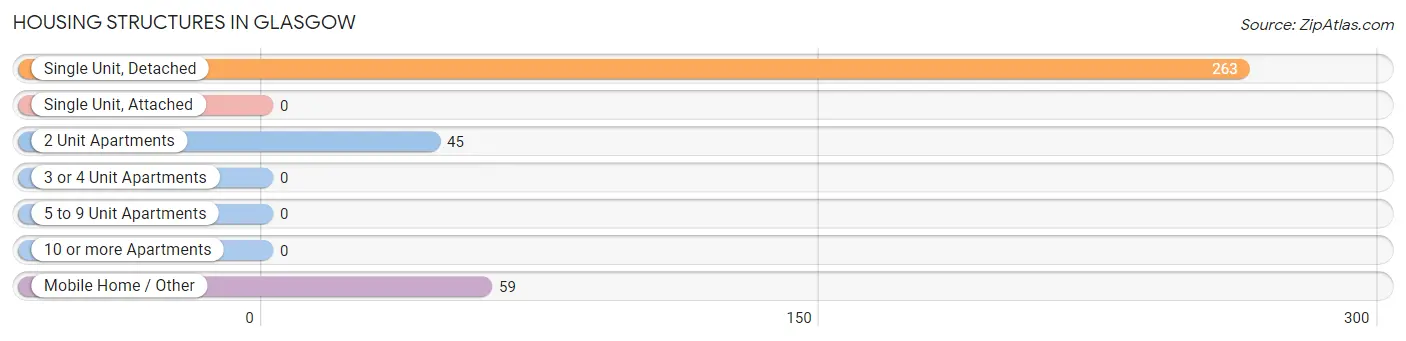
| Structure Type | # Housing Units | % Housing Units |
| Single Unit, Detached | 263 | 71.7% |
| Single Unit, Attached | 0 | 0.0% |
| 2 Unit Apartments | 45 | 12.3% |
| 3 or 4 Unit Apartments | 0 | 0.0% |
| 5 to 9 Unit Apartments | 0 | 0.0% |
| 10 or more Apartments | 0 | 0.0% |
| Mobile Home / Other | 59 | 16.1% |
| Total | 367 | 100.0% |
Housing Structures by Occupancy in Glasgow
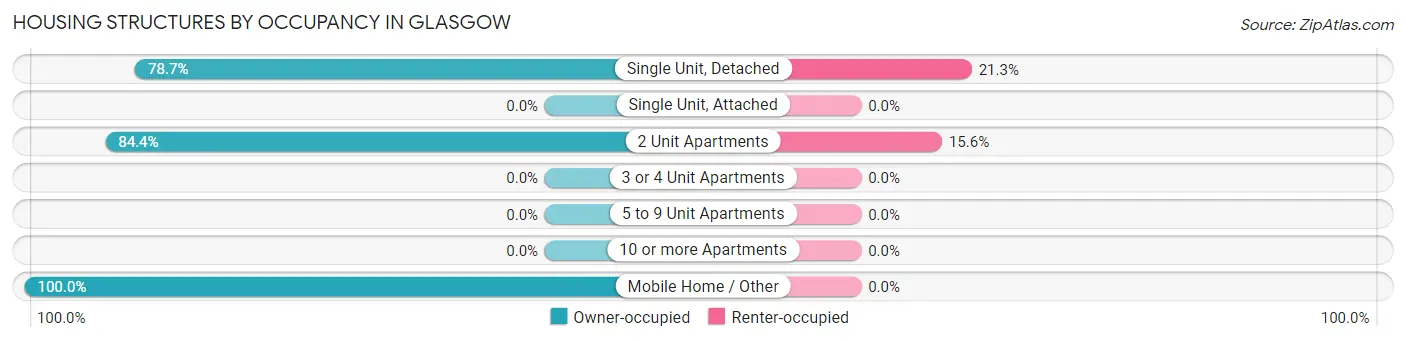
| Structure Type | Owner-occupied | Renter-occupied |
| Single Unit, Detached | 207 (78.7%) | 56 (21.3%) |
| Single Unit, Attached | 0 (0.0%) | 0 (0.0%) |
| 2 Unit Apartments | 38 (84.4%) | 7 (15.6%) |
| 3 or 4 Unit Apartments | 0 (0.0%) | 0 (0.0%) |
| 5 to 9 Unit Apartments | 0 (0.0%) | 0 (0.0%) |
| 10 or more Apartments | 0 (0.0%) | 0 (0.0%) |
| Mobile Home / Other | 59 (100.0%) | 0 (0.0%) |
| Total | 304 (82.8%) | 63 (17.2%) |
Housing Structures by Number of Rooms in Glasgow
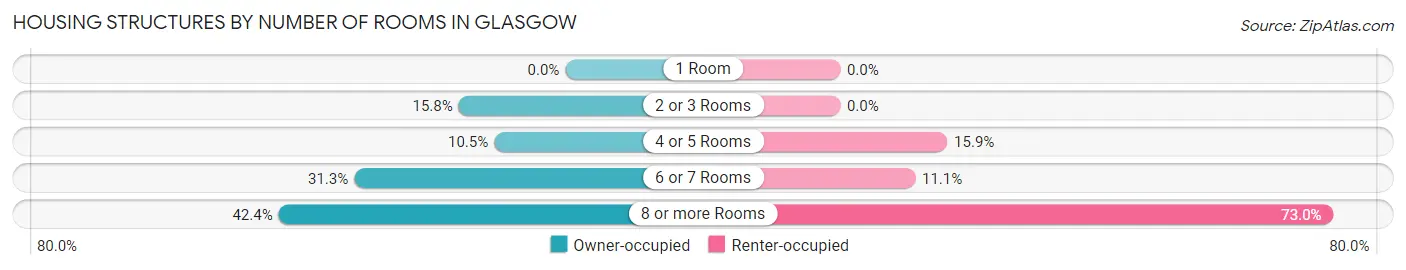
| Number of Rooms | Owner-occupied | Renter-occupied |
| 1 Room | 0 (0.0%) | 0 (0.0%) |
| 2 or 3 Rooms | 48 (15.8%) | 0 (0.0%) |
| 4 or 5 Rooms | 32 (10.5%) | 10 (15.9%) |
| 6 or 7 Rooms | 95 (31.2%) | 7 (11.1%) |
| 8 or more Rooms | 129 (42.4%) | 46 (73.0%) |
| Total | 304 (100.0%) | 63 (100.0%) |
Housing Structure by Heating Type in Glasgow
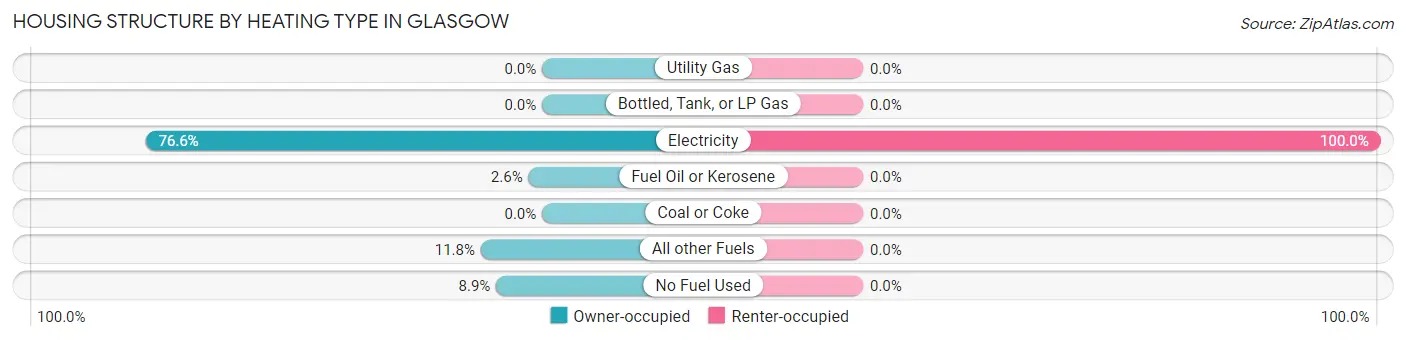
| Heating Type | Owner-occupied | Renter-occupied |
| Utility Gas | 0 (0.0%) | 0 (0.0%) |
| Bottled, Tank, or LP Gas | 0 (0.0%) | 0 (0.0%) |
| Electricity | 233 (76.6%) | 63 (100.0%) |
| Fuel Oil or Kerosene | 8 (2.6%) | 0 (0.0%) |
| Coal or Coke | 0 (0.0%) | 0 (0.0%) |
| All other Fuels | 36 (11.8%) | 0 (0.0%) |
| No Fuel Used | 27 (8.9%) | 0 (0.0%) |
| Total | 304 (100.0%) | 63 (100.0%) |
Household Vehicle Usage in Glasgow
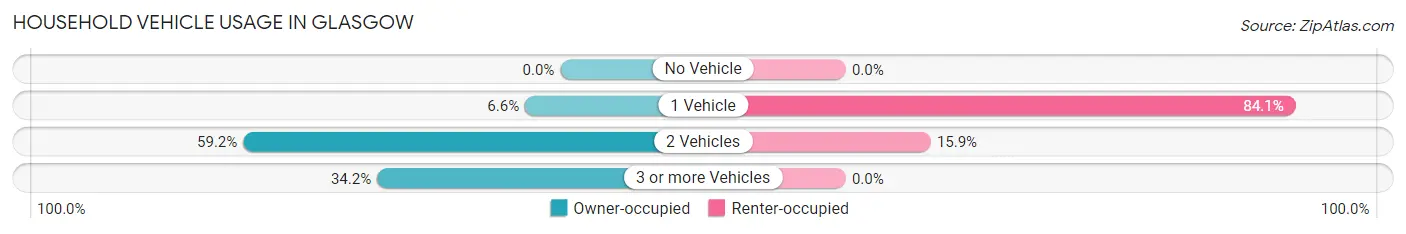
| Vehicles per Household | Owner-occupied | Renter-occupied |
| No Vehicle | 0 (0.0%) | 0 (0.0%) |
| 1 Vehicle | 20 (6.6%) | 53 (84.1%) |
| 2 Vehicles | 180 (59.2%) | 10 (15.9%) |
| 3 or more Vehicles | 104 (34.2%) | 0 (0.0%) |
| Total | 304 (100.0%) | 63 (100.0%) |
Real Estate & Mortgages in Glasgow
Real Estate and Mortgage Overview in Glasgow
| Characteristic | Without Mortgage | With Mortgage |
| Housing Units | 168 | 136 |
| Median Property Value | $401,400 | $333,300 |
| Median Household Income | $80,793 | $18 |
| Monthly Housing Costs | $586 | $0 |
| Real Estate Taxes | - | - |
Property Value by Mortgage Status in Glasgow
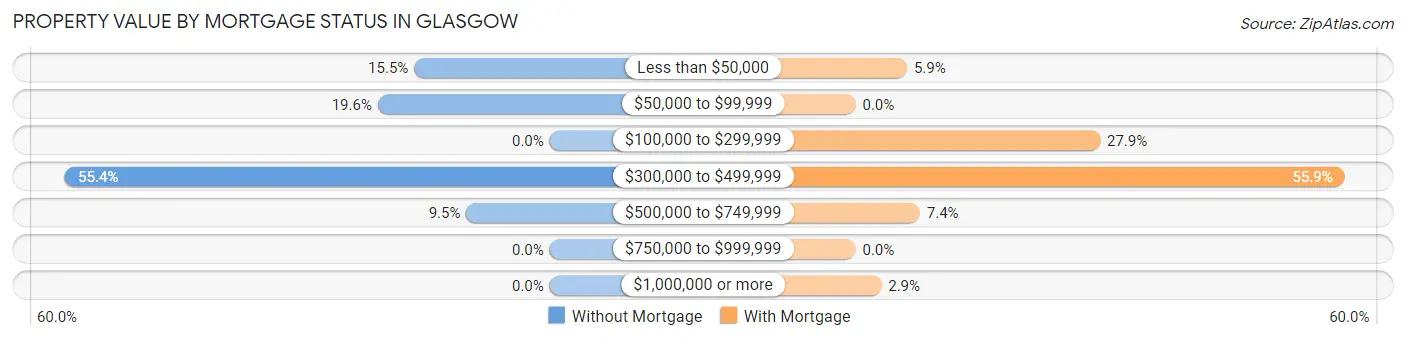
| Property Value | Without Mortgage | With Mortgage |
| Less than $50,000 | 26 (15.5%) | 8 (5.9%) |
| $50,000 to $99,999 | 33 (19.6%) | 0 (0.0%) |
| $100,000 to $299,999 | 0 (0.0%) | 38 (27.9%) |
| $300,000 to $499,999 | 93 (55.4%) | 76 (55.9%) |
| $500,000 to $749,999 | 16 (9.5%) | 10 (7.3%) |
| $750,000 to $999,999 | 0 (0.0%) | 0 (0.0%) |
| $1,000,000 or more | 0 (0.0%) | 4 (2.9%) |
| Total | 168 (100.0%) | 136 (100.0%) |
Household Income by Mortgage Status in Glasgow
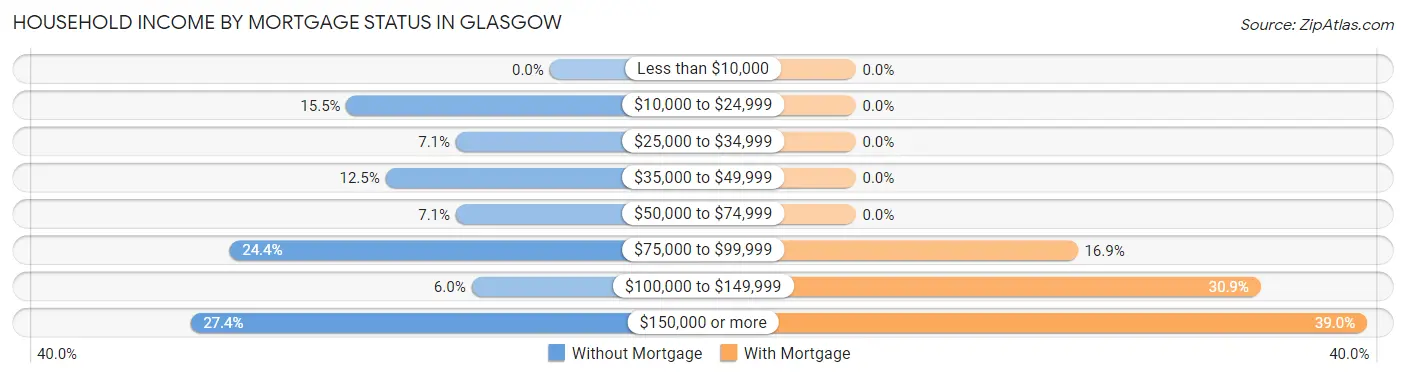
| Household Income | Without Mortgage | With Mortgage |
| Less than $10,000 | 0 (0.0%) | 0 (0.0%) |
| $10,000 to $24,999 | 26 (15.5%) | 0 (0.0%) |
| $25,000 to $34,999 | 12 (7.1%) | 0 (0.0%) |
| $35,000 to $49,999 | 21 (12.5%) | 0 (0.0%) |
| $50,000 to $74,999 | 12 (7.1%) | 0 (0.0%) |
| $75,000 to $99,999 | 41 (24.4%) | 23 (16.9%) |
| $100,000 to $149,999 | 10 (5.9%) | 42 (30.9%) |
| $150,000 or more | 46 (27.4%) | 53 (39.0%) |
| Total | 168 (100.0%) | 136 (100.0%) |
Property Value to Household Income Ratio in Glasgow
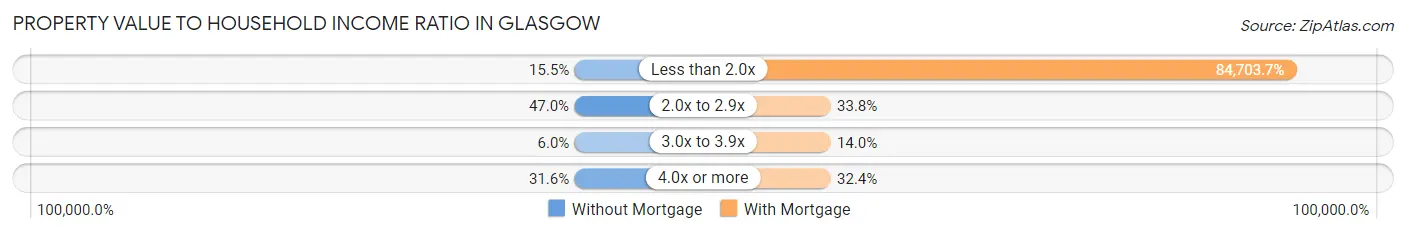
| Value-to-Income Ratio | Without Mortgage | With Mortgage |
| Less than 2.0x | 26 (15.5%) | 115,197 (84,703.7%) |
| 2.0x to 2.9x | 79 (47.0%) | 46 (33.8%) |
| 3.0x to 3.9x | 10 (5.9%) | 19 (14.0%) |
| 4.0x or more | 53 (31.6%) | 44 (32.4%) |
| Total | 168 (100.0%) | 136 (100.0%) |
Real Estate Taxes by Mortgage Status in Glasgow
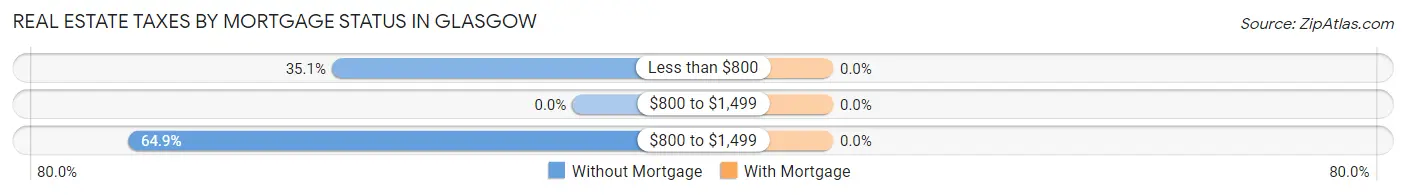
| Property Taxes | Without Mortgage | With Mortgage |
| Less than $800 | 59 (35.1%) | 0 (0.0%) |
| $800 to $1,499 | 0 (0.0%) | 0 (0.0%) |
| $800 to $1,499 | 109 (64.9%) | 0 (0.0%) |
| Total | 168 (100.0%) | 136 (100.0%) |
Health & Disability in Glasgow
Health Insurance Coverage by Age in Glasgow
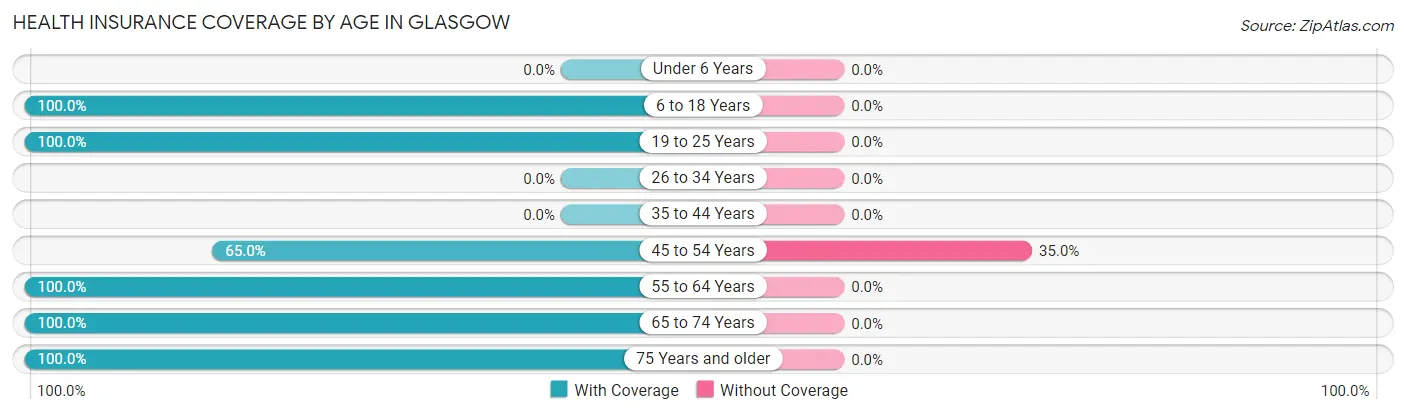
| Age Bracket | With Coverage | Without Coverage |
| Under 6 Years | 0 (0.0%) | 0 (0.0%) |
| 6 to 18 Years | 272 (100.0%) | 0 (0.0%) |
| 19 to 25 Years | 14 (100.0%) | 0 (0.0%) |
| 26 to 34 Years | 0 (0.0%) | 0 (0.0%) |
| 35 to 44 Years | 0 (0.0%) | 0 (0.0%) |
| 45 to 54 Years | 102 (65.0%) | 55 (35.0%) |
| 55 to 64 Years | 171 (100.0%) | 0 (0.0%) |
| 65 to 74 Years | 192 (100.0%) | 0 (0.0%) |
| 75 Years and older | 114 (100.0%) | 0 (0.0%) |
| Total | 865 (94.0%) | 55 (6.0%) |
Health Insurance Coverage by Citizenship Status in Glasgow
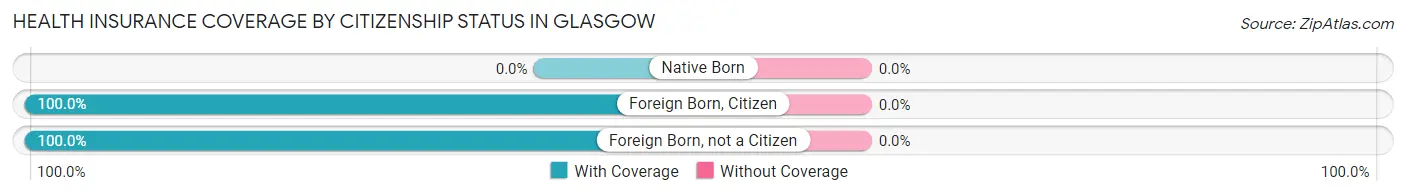
| Citizenship Status | With Coverage | Without Coverage |
| Native Born | 0 (0.0%) | 0 (0.0%) |
| Foreign Born, Citizen | 272 (100.0%) | 0 (0.0%) |
| Foreign Born, not a Citizen | 14 (100.0%) | 0 (0.0%) |
Health Insurance Coverage by Household Income in Glasgow
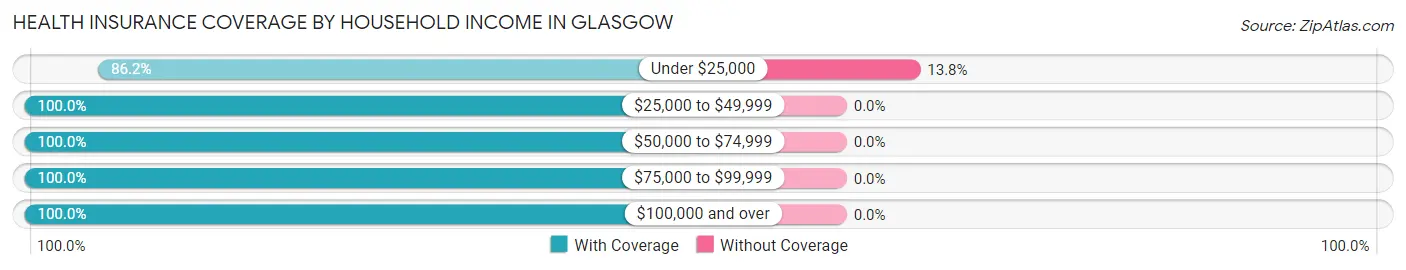
| Household Income | With Coverage | Without Coverage |
| Under $25,000 | 344 (86.2%) | 55 (13.8%) |
| $25,000 to $49,999 | 87 (100.0%) | 0 (0.0%) |
| $50,000 to $74,999 | 75 (100.0%) | 0 (0.0%) |
| $75,000 to $99,999 | 127 (100.0%) | 0 (0.0%) |
| $100,000 and over | 232 (100.0%) | 0 (0.0%) |
Public vs Private Health Insurance Coverage by Age in Glasgow
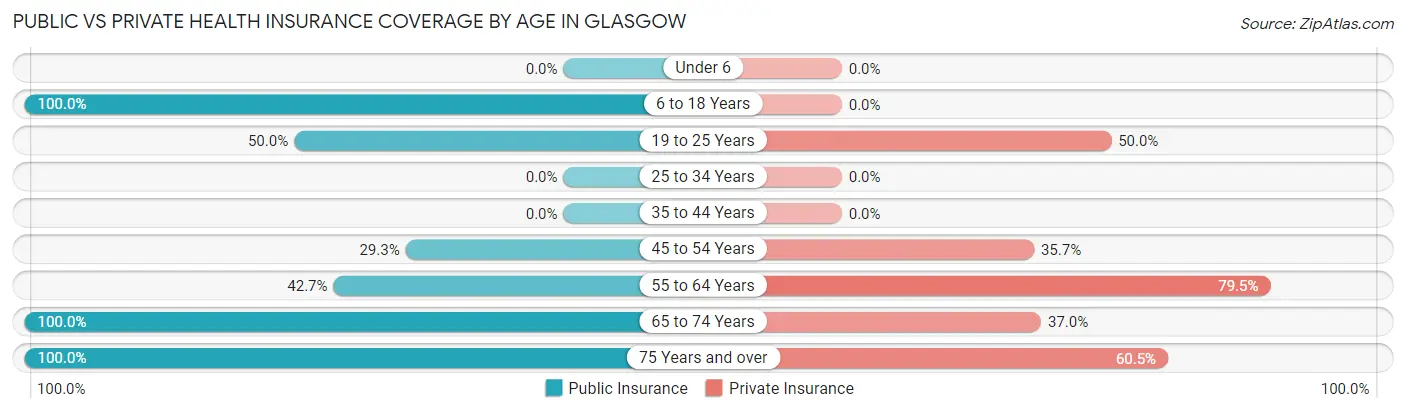
| Age Bracket | Public Insurance | Private Insurance |
| Under 6 | 0 (0.0%) | 0 (0.0%) |
| 6 to 18 Years | 272 (100.0%) | 0 (0.0%) |
| 19 to 25 Years | 7 (50.0%) | 7 (50.0%) |
| 25 to 34 Years | 0 (0.0%) | 0 (0.0%) |
| 35 to 44 Years | 0 (0.0%) | 0 (0.0%) |
| 45 to 54 Years | 46 (29.3%) | 56 (35.7%) |
| 55 to 64 Years | 73 (42.7%) | 136 (79.5%) |
| 65 to 74 Years | 192 (100.0%) | 71 (37.0%) |
| 75 Years and over | 114 (100.0%) | 69 (60.5%) |
| Total | 704 (76.5%) | 339 (36.8%) |
Disability Status by Sex by Age in Glasgow
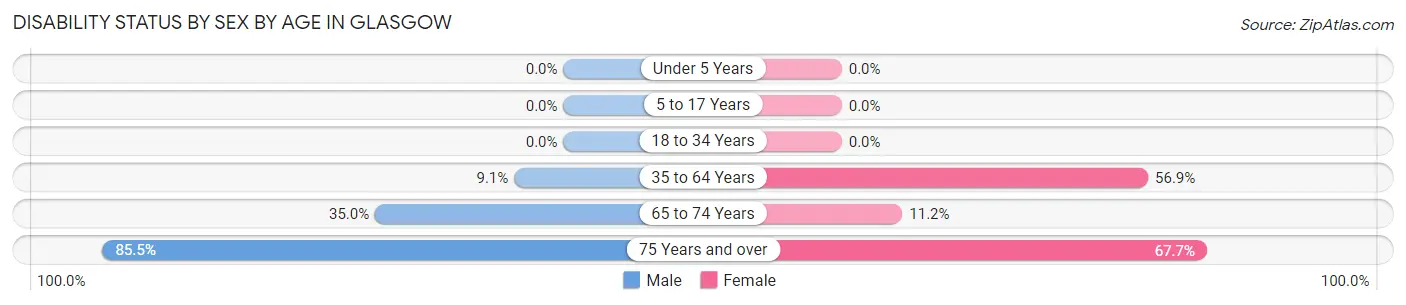
| Age Bracket | Male | Female |
| Under 5 Years | 0 (0.0%) | 0 (0.0%) |
| 5 to 17 Years | 0 (0.0%) | 0 (0.0%) |
| 18 to 34 Years | 0 (0.0%) | 0 (0.0%) |
| 35 to 64 Years | 16 (9.1%) | 87 (56.9%) |
| 65 to 74 Years | 36 (34.9%) | 10 (11.2%) |
| 75 Years and over | 71 (85.5%) | 21 (67.7%) |
Disability Class by Sex by Age in Glasgow
Disability Class: Hearing Difficulty
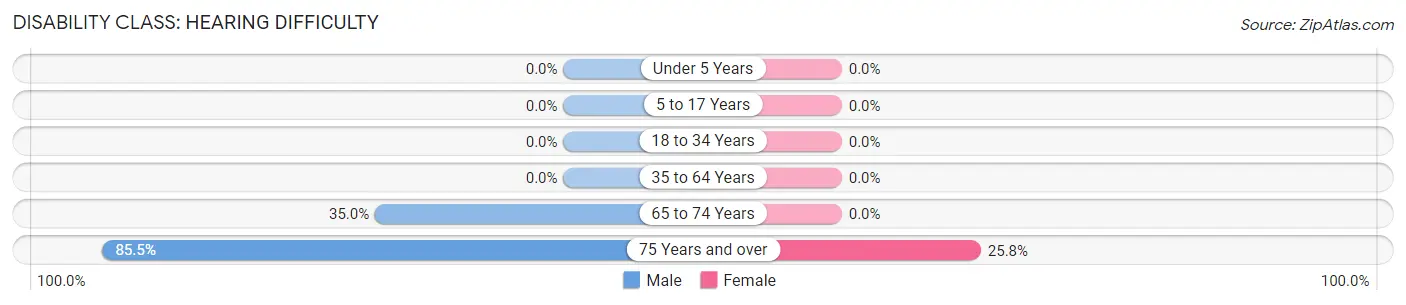
| Age Bracket | Male | Female |
| Under 5 Years | 0 (0.0%) | 0 (0.0%) |
| 5 to 17 Years | 0 (0.0%) | 0 (0.0%) |
| 18 to 34 Years | 0 (0.0%) | 0 (0.0%) |
| 35 to 64 Years | 0 (0.0%) | 0 (0.0%) |
| 65 to 74 Years | 36 (34.9%) | 0 (0.0%) |
| 75 Years and over | 71 (85.5%) | 8 (25.8%) |
Disability Class: Vision Difficulty
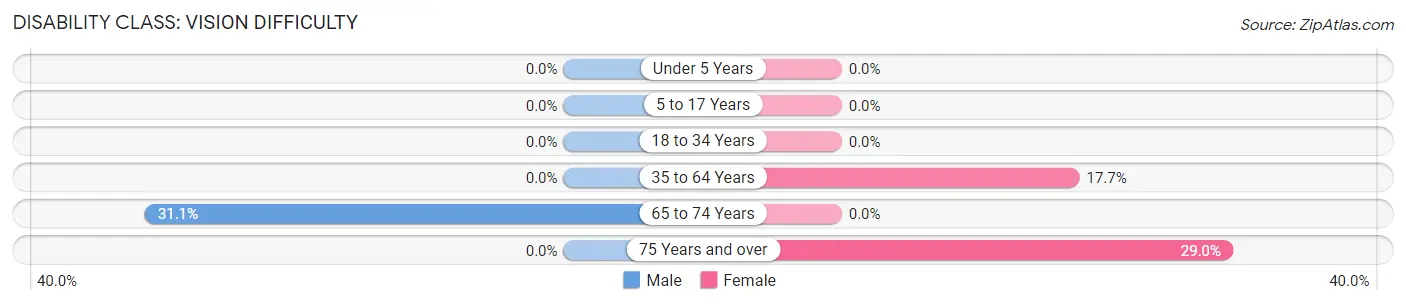
| Age Bracket | Male | Female |
| Under 5 Years | 0 (0.0%) | 0 (0.0%) |
| 5 to 17 Years | 0 (0.0%) | 0 (0.0%) |
| 18 to 34 Years | 0 (0.0%) | 0 (0.0%) |
| 35 to 64 Years | 0 (0.0%) | 27 (17.6%) |
| 65 to 74 Years | 32 (31.1%) | 0 (0.0%) |
| 75 Years and over | 0 (0.0%) | 9 (29.0%) |
Disability Class: Cognitive Difficulty
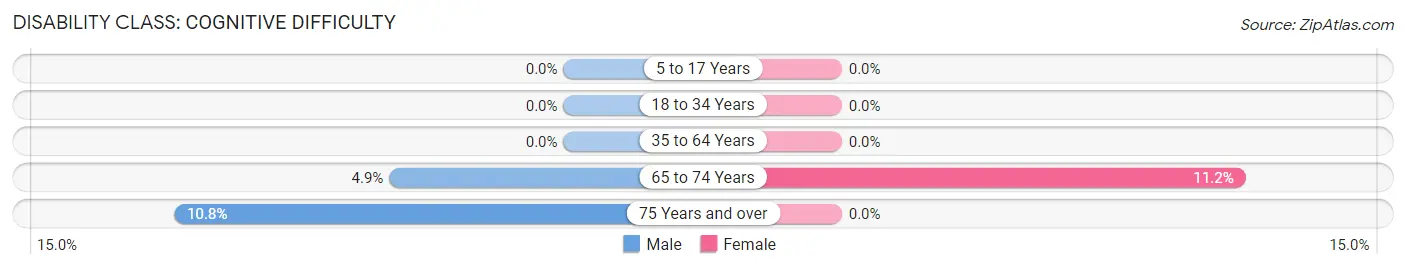
| Age Bracket | Male | Female |
| 5 to 17 Years | 0 (0.0%) | 0 (0.0%) |
| 18 to 34 Years | 0 (0.0%) | 0 (0.0%) |
| 35 to 64 Years | 0 (0.0%) | 0 (0.0%) |
| 65 to 74 Years | 5 (4.9%) | 10 (11.2%) |
| 75 Years and over | 9 (10.8%) | 0 (0.0%) |
Disability Class: Ambulatory Difficulty
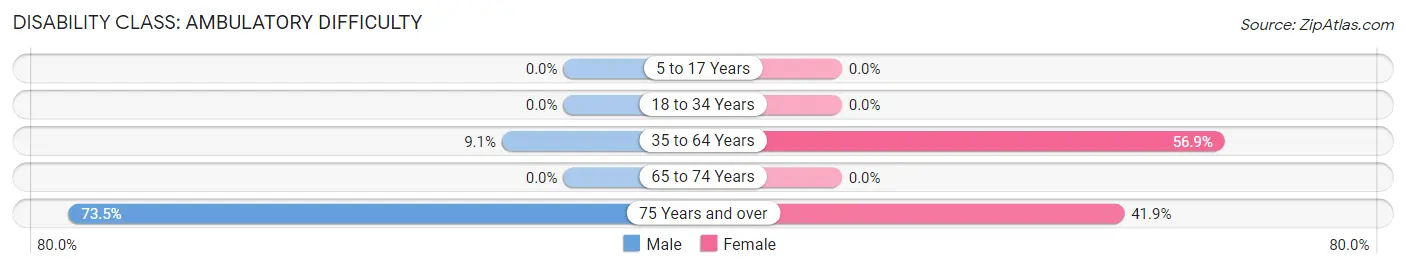
| Age Bracket | Male | Female |
| 5 to 17 Years | 0 (0.0%) | 0 (0.0%) |
| 18 to 34 Years | 0 (0.0%) | 0 (0.0%) |
| 35 to 64 Years | 16 (9.1%) | 87 (56.9%) |
| 65 to 74 Years | 0 (0.0%) | 0 (0.0%) |
| 75 Years and over | 61 (73.5%) | 13 (41.9%) |
Disability Class: Self-Care Difficulty
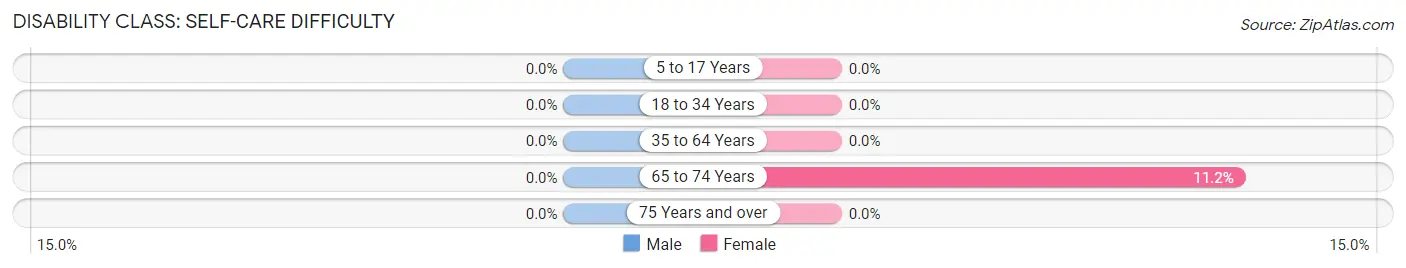
| Age Bracket | Male | Female |
| 5 to 17 Years | 0 (0.0%) | 0 (0.0%) |
| 18 to 34 Years | 0 (0.0%) | 0 (0.0%) |
| 35 to 64 Years | 0 (0.0%) | 0 (0.0%) |
| 65 to 74 Years | 0 (0.0%) | 10 (11.2%) |
| 75 Years and over | 0 (0.0%) | 0 (0.0%) |
Technology Access in Glasgow
Computing Device Access in Glasgow
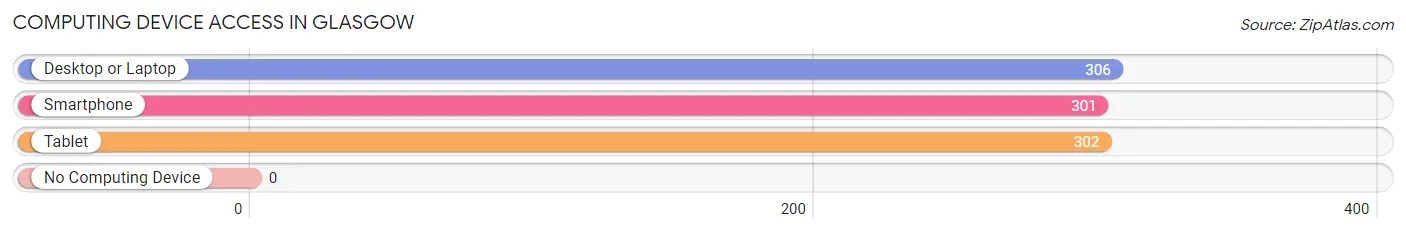
| Device Type | # Households | % Households |
| Desktop or Laptop | 306 | 83.4% |
| Smartphone | 301 | 82.0% |
| Tablet | 302 | 82.3% |
| No Computing Device | 0 | 0.0% |
| Total | 367 | 100.0% |
Internet Access in Glasgow
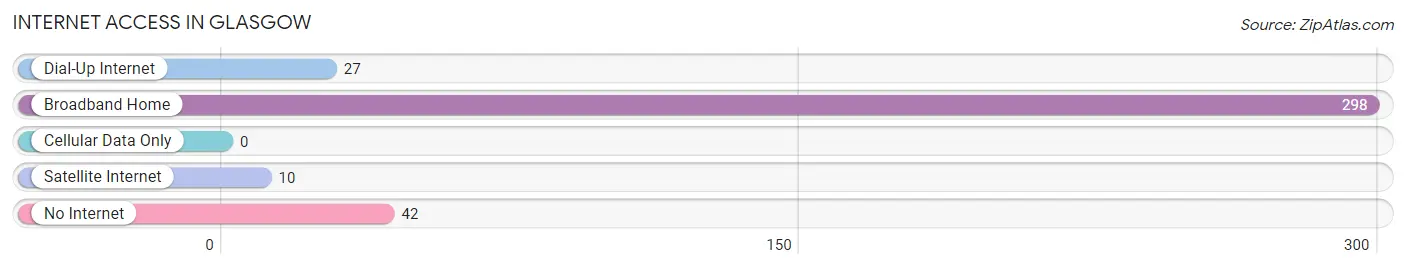
| Internet Type | # Households | % Households |
| Dial-Up Internet | 27 | 7.4% |
| Broadband Home | 298 | 81.2% |
| Cellular Data Only | 0 | 0.0% |
| Satellite Internet | 10 | 2.7% |
| No Internet | 42 | 11.4% |
| Total | 367 | 100.0% |
Glasgow Summary
Glasgow, Oregon is a small city located in the Umatilla County of the state of Oregon. It is situated in the foothills of the Blue Mountains, about 20 miles east of Pendleton. The city has a population of about 1,000 people and is known for its rural charm and friendly atmosphere.
History
The area around Glasgow was first settled in the late 1800s by homesteaders who were attracted to the area by its fertile soil and abundant water. The first post office was established in 1887 and the town was officially incorporated in 1901. The town was named after Glasgow, Scotland, by a local resident who had emigrated from Scotland.
In the early 1900s, Glasgow was a thriving agricultural community, with wheat, oats, and barley being the main crops. The town also had a number of businesses, including a bank, a hotel, a general store, and a blacksmith shop.
In the 1950s, the town began to decline as many of the local businesses closed and the population began to dwindle. However, in the late 1990s, the town began to experience a resurgence as new businesses opened and the population began to grow again.
Geography
Glasgow is located in the foothills of the Blue Mountains, about 20 miles east of Pendleton. The city is situated at an elevation of 2,400 feet and is surrounded by rolling hills and grasslands. The city is located in a semi-arid climate, with hot summers and cold winters.
The city is located near the Umatilla National Forest, which provides a variety of recreational activities, including camping, fishing, and hiking. The nearby Umatilla River is also a popular spot for fishing and rafting.
Economy
The economy of Glasgow is largely based on agriculture, with wheat, oats, and barley being the main crops. The city also has a number of small businesses, including a grocery store, a hardware store, and a restaurant.
The city is also home to a number of manufacturing companies, including a wood products company and a metal fabrication company. The city is also home to a number of small businesses, including a bakery, a florist, and a gift shop.
Demographics
As of the 2010 census, the population of Glasgow was 1,000 people. The racial makeup of the city was 94.2% White, 0.7% Native American, 0.3% Asian, 0.1% Pacific Islander, 0.1% from other races, and 4.7% from two or more races. The median household income was $37,500 and the median family income was $41,250.
Conclusion
Glasgow, Oregon is a small city located in the Umatilla County of the state of Oregon. It is situated in the foothills of the Blue Mountains, about 20 miles east of Pendleton. The city has a population of about 1,000 people and is known for its rural charm and friendly atmosphere. The economy of Glasgow is largely based on agriculture, with wheat, oats, and barley being the main crops. The city also has a number of small businesses, including a grocery store, a hardware store, and a restaurant. The racial makeup of the city was 94.2% White, 0.7% Native American, 0.3% Asian, 0.1% Pacific Islander, 0.1% from other races, and 4.7% from two or more races. Glasgow is a great place to live and work, with its rural charm and friendly atmosphere.
Common Questions
What is Per Capita Income in Glasgow?
Per Capita income in Glasgow is $38,587.
What is the Median Family Income in Glasgow?
Median Family Income in Glasgow is $81,128.
What is the Median Household income in Glasgow?
Median Household Income in Glasgow is $82,043.
What is Inequality or Gini Index in Glasgow?
Inequality or Gini Index in Glasgow is 0.37.
What is the Total Population of Glasgow?
Total Population of Glasgow is 920.
What is the Total Male Population of Glasgow?
Total Male Population of Glasgow is 464.
What is the Total Female Population of Glasgow?
Total Female Population of Glasgow is 456.
What is the Ratio of Males per 100 Females in Glasgow?
There are 101.75 Males per 100 Females in Glasgow.
What is the Ratio of Females per 100 Males in Glasgow?
There are 98.28 Females per 100 Males in Glasgow.
What is the Median Population Age in Glasgow?
Median Population Age in Glasgow is 57.4 Years.
What is the Average Family Size in Glasgow
Average Family Size in Glasgow is 3.1 People.
What is the Average Household Size in Glasgow
Average Household Size in Glasgow is 2.5 People.
How Large is the Labor Force in Glasgow?
There are 308 People in the Labor Forcein in Glasgow.
What is the Percentage of People in the Labor Force in Glasgow?
47.5% of People are in the Labor Force in Glasgow.