Depoe Bay, OR Map & Demographics
Depoe Bay Map
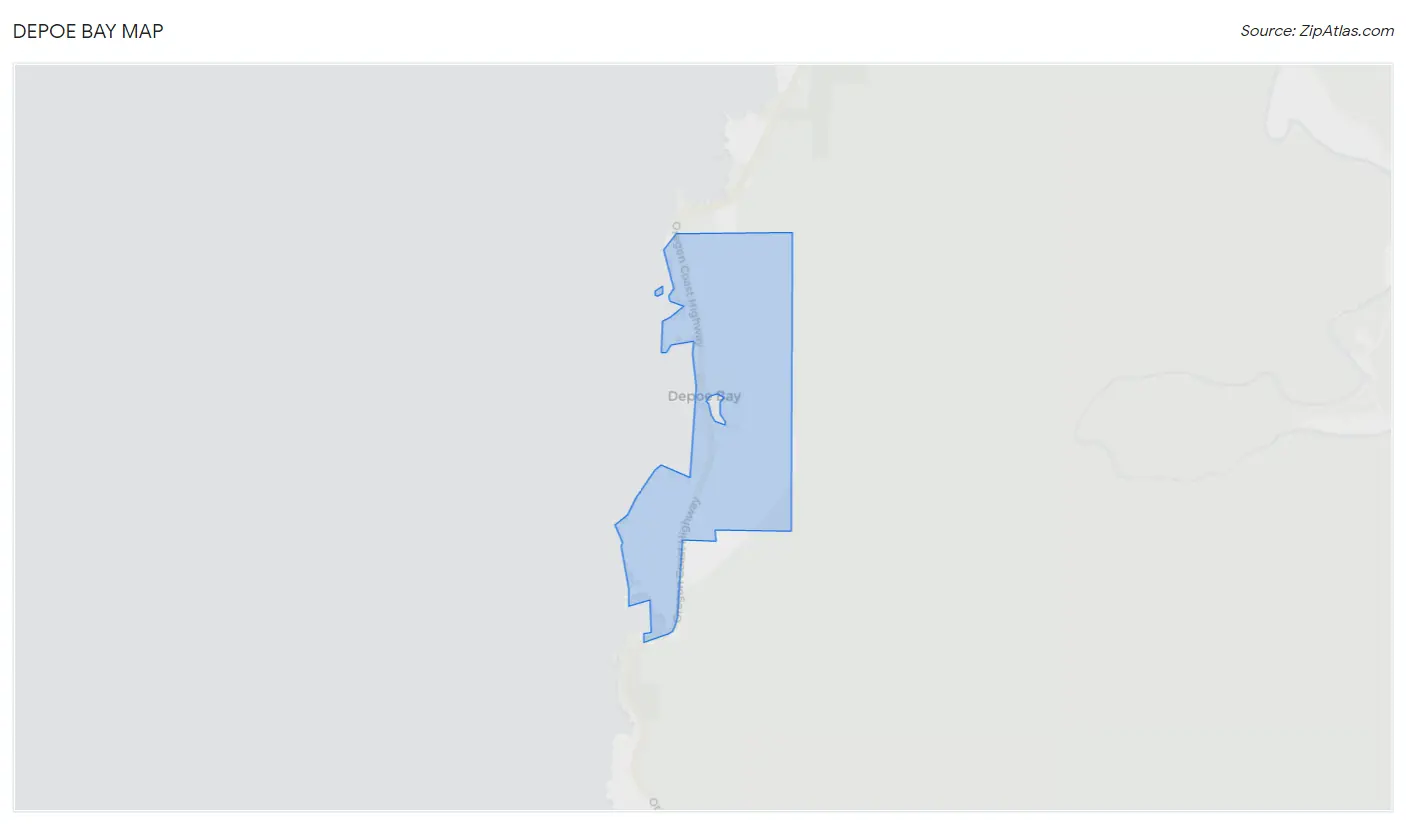
Depoe Bay Overview
$45,588
PER CAPITA INCOME
$92,625
AVG FAMILY INCOME
$66,667
AVG HOUSEHOLD INCOME
8.5%
WAGE / INCOME GAP [ % ]
91.5¢/ $1
WAGE / INCOME GAP [ $ ]
0.43
INEQUALITY / GINI INDEX
2,066
TOTAL POPULATION
939
MALE POPULATION
1,127
FEMALE POPULATION
83.32
MALES / 100 FEMALES
120.02
FEMALES / 100 MALES
56.3
MEDIAN AGE
2.5
AVG FAMILY SIZE
2.0
AVG HOUSEHOLD SIZE
1,043
LABOR FORCE [ PEOPLE ]
55.4%
PERCENT IN LABOR FORCE
13.1%
UNEMPLOYMENT RATE
Depoe Bay Zip Codes
Depoe Bay Area Codes
Income in Depoe Bay
Income Overview in Depoe Bay
Per Capita Income in Depoe Bay is $45,588, while median incomes of families and households are $92,625 and $66,667 respectively.
| Characteristic | Number | Measure |
| Per Capita Income | 2,066 | $45,588 |
| Median Family Income | 655 | $92,625 |
| Mean Family Income | 655 | $111,563 |
| Median Household Income | 1,024 | $66,667 |
| Mean Household Income | 1,024 | $91,286 |
| Income Deficit | 655 | $0 |
| Wage / Income Gap (%) | 2,066 | 8.46% |
| Wage / Income Gap ($) | 2,066 | 91.54¢ per $1 |
| Gini / Inequality Index | 2,066 | 0.43 |
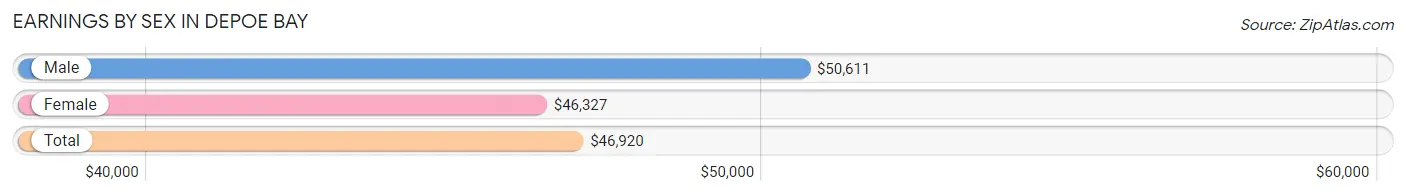
Earnings by Sex in Depoe Bay
Average Earnings in Depoe Bay are $46,920, $50,611 for men and $46,327 for women, a difference of 8.5%.
| Sex | Number | Average Earnings |
| Male | 526 (48.7%) | $50,611 |
| Female | 553 (51.2%) | $46,327 |
| Total | 1,079 (100.0%) | $46,920 |
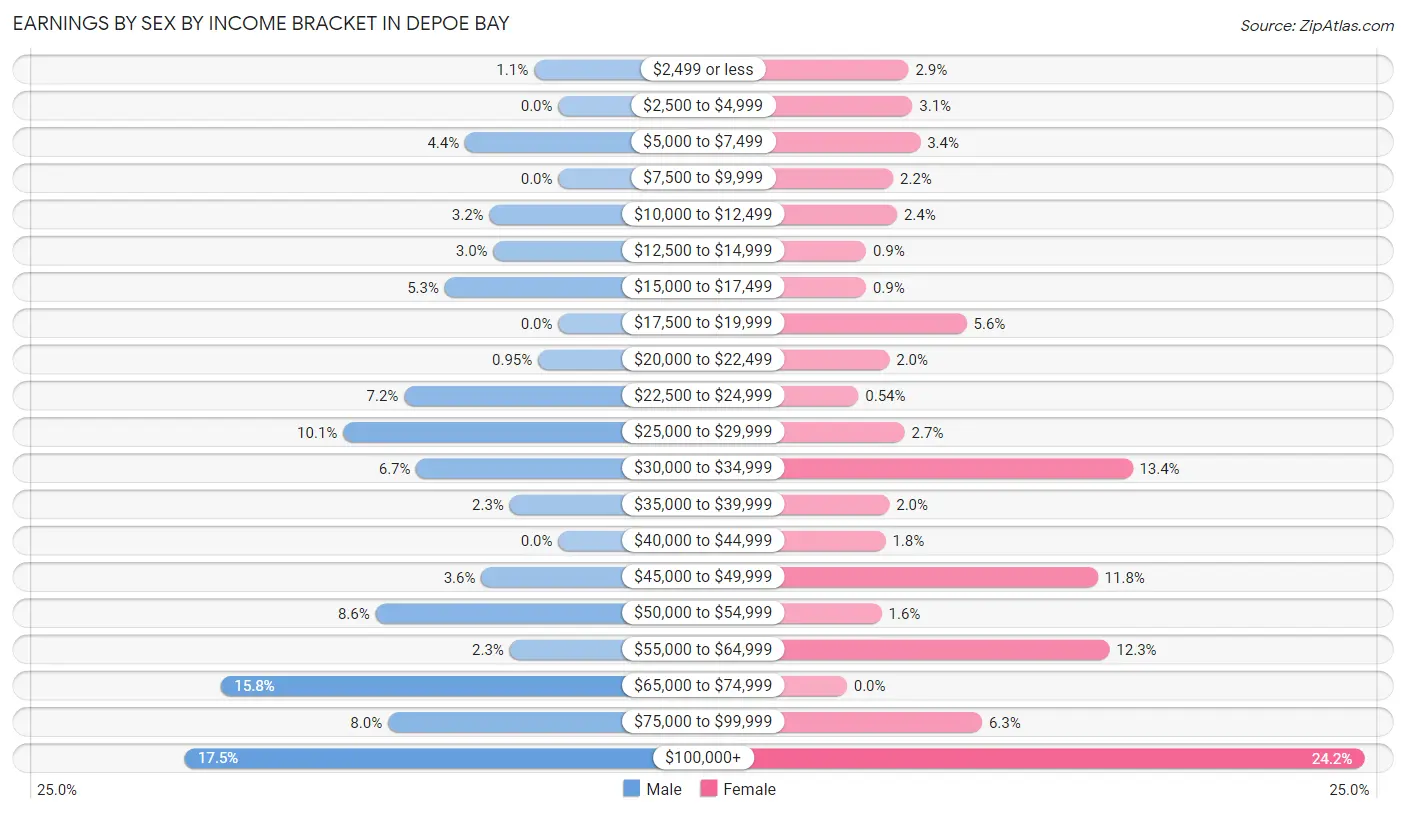
Earnings by Sex by Income Bracket in Depoe Bay
The most common earnings brackets in Depoe Bay are $100,000+ for men (92 | 17.5%) and $100,000+ for women (134 | 24.2%).
| Income | Male | Female |
| $2,499 or less | 6 (1.1%) | 16 (2.9%) |
| $2,500 to $4,999 | 0 (0.0%) | 17 (3.1%) |
| $5,000 to $7,499 | 23 (4.4%) | 19 (3.4%) |
| $7,500 to $9,999 | 0 (0.0%) | 12 (2.2%) |
| $10,000 to $12,499 | 17 (3.2%) | 13 (2.4%) |
| $12,500 to $14,999 | 16 (3.0%) | 5 (0.9%) |
| $15,000 to $17,499 | 28 (5.3%) | 5 (0.9%) |
| $17,500 to $19,999 | 0 (0.0%) | 31 (5.6%) |
| $20,000 to $22,499 | 5 (0.9%) | 11 (2.0%) |
| $22,500 to $24,999 | 38 (7.2%) | 3 (0.5%) |
| $25,000 to $29,999 | 53 (10.1%) | 15 (2.7%) |
| $30,000 to $34,999 | 35 (6.7%) | 74 (13.4%) |
| $35,000 to $39,999 | 12 (2.3%) | 11 (2.0%) |
| $40,000 to $44,999 | 0 (0.0%) | 10 (1.8%) |
| $45,000 to $49,999 | 19 (3.6%) | 65 (11.7%) |
| $50,000 to $54,999 | 45 (8.6%) | 9 (1.6%) |
| $55,000 to $64,999 | 12 (2.3%) | 68 (12.3%) |
| $65,000 to $74,999 | 83 (15.8%) | 0 (0.0%) |
| $75,000 to $99,999 | 42 (8.0%) | 35 (6.3%) |
| $100,000+ | 92 (17.5%) | 134 (24.2%) |
| Total | 526 (100.0%) | 553 (100.0%) |
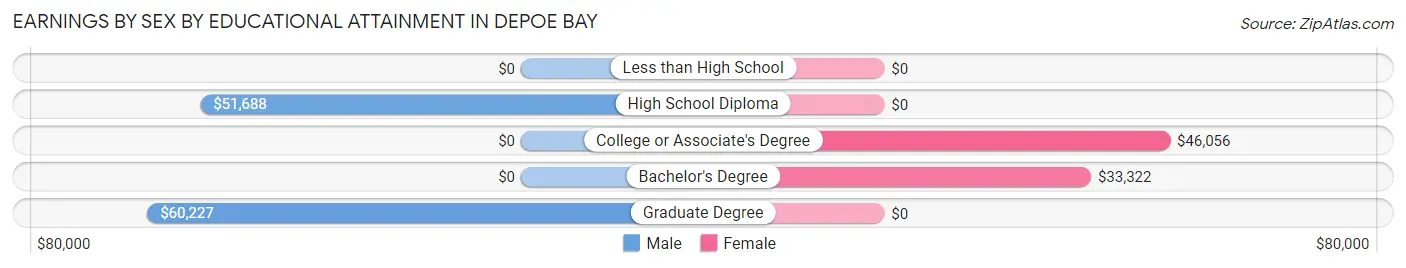
Earnings by Sex by Educational Attainment in Depoe Bay
Average earnings in Depoe Bay are $51,056 for men and $47,038 for women, a difference of 7.9%. Men with an educational attainment of graduate degree enjoy the highest average annual earnings of $60,227, while those with high school diploma education earn the least with $51,688. Women with an educational attainment of college or associate's degree earn the most with the average annual earnings of $46,056, while those with bachelor's degree education have the smallest earnings of $33,322.
| Educational Attainment | Male Income | Female Income |
| Less than High School | - | - |
| High School Diploma | $51,688 | $0 |
| College or Associate's Degree | - | - |
| Bachelor's Degree | - | - |
| Graduate Degree | $60,227 | $0 |
| Total | $51,056 | $47,038 |
Family Income in Depoe Bay
Family Income Brackets in Depoe Bay
According to the Depoe Bay family income data, there are 123 families falling into the $150,000 to $199,999 income range, which is the most common income bracket and makes up 18.8% of all families.
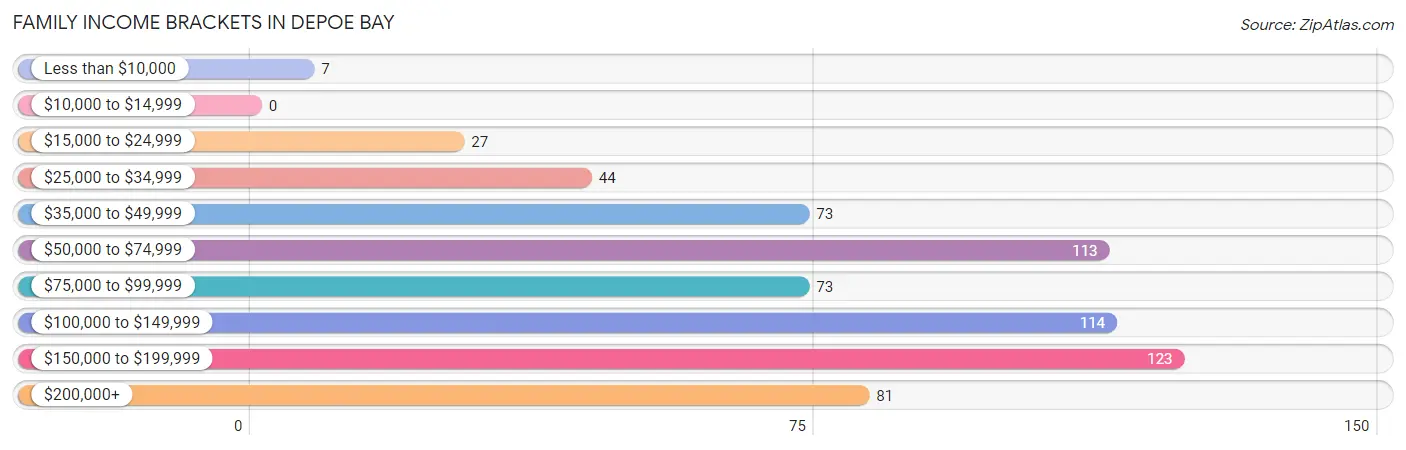
| Income Bracket | # Families | % Families |
| Less than $10,000 | 7 | 1.1% |
| $10,000 to $14,999 | 0 | 0.0% |
| $15,000 to $24,999 | 27 | 4.1% |
| $25,000 to $34,999 | 44 | 6.7% |
| $35,000 to $49,999 | 73 | 11.1% |
| $50,000 to $74,999 | 113 | 17.3% |
| $75,000 to $99,999 | 73 | 11.1% |
| $100,000 to $149,999 | 114 | 17.4% |
| $150,000 to $199,999 | 123 | 18.8% |
| $200,000+ | 81 | 12.4% |
Family Income by Famaliy Size in Depoe Bay
4-person families (63 | 9.6%) account for the highest median family income in Depoe Bay with $156,094 per family, while 2-person families (467 | 71.3%) have the highest median income of $41,146 per family member.
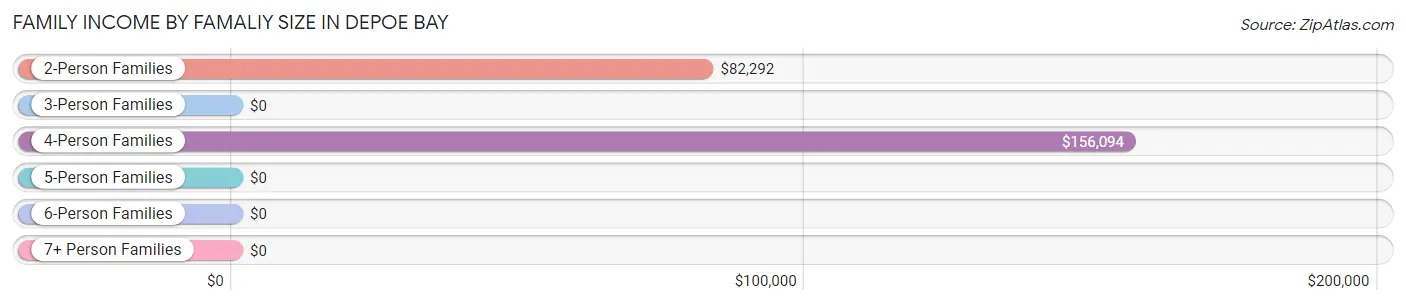
| Income Bracket | # Families | Median Income |
| 2-Person Families | 467 (71.3%) | $82,292 |
| 3-Person Families | 95 (14.5%) | $0 |
| 4-Person Families | 63 (9.6%) | $156,094 |
| 5-Person Families | 23 (3.5%) | $0 |
| 6-Person Families | 7 (1.1%) | $0 |
| 7+ Person Families | 0 (0.0%) | $0 |
| Total | 655 (100.0%) | $92,625 |
Family Income by Number of Earners in Depoe Bay
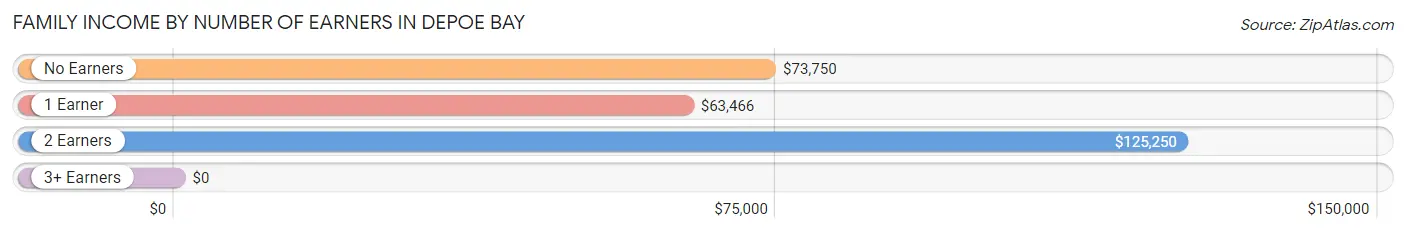
| Number of Earners | # Families | Median Income |
| No Earners | 151 (23.1%) | $73,750 |
| 1 Earner | 177 (27.0%) | $63,466 |
| 2 Earners | 307 (46.9%) | $125,250 |
| 3+ Earners | 20 (3.0%) | $0 |
| Total | 655 (100.0%) | $92,625 |
Household Income in Depoe Bay
Household Income Brackets in Depoe Bay
With 197 households falling in the category, the $100,000 to $149,999 income range is the most frequent in Depoe Bay, accounting for 19.2% of all households. In contrast, only 17 households (1.7%) fall into the $10,000 to $14,999 income bracket, making it the least populous group.
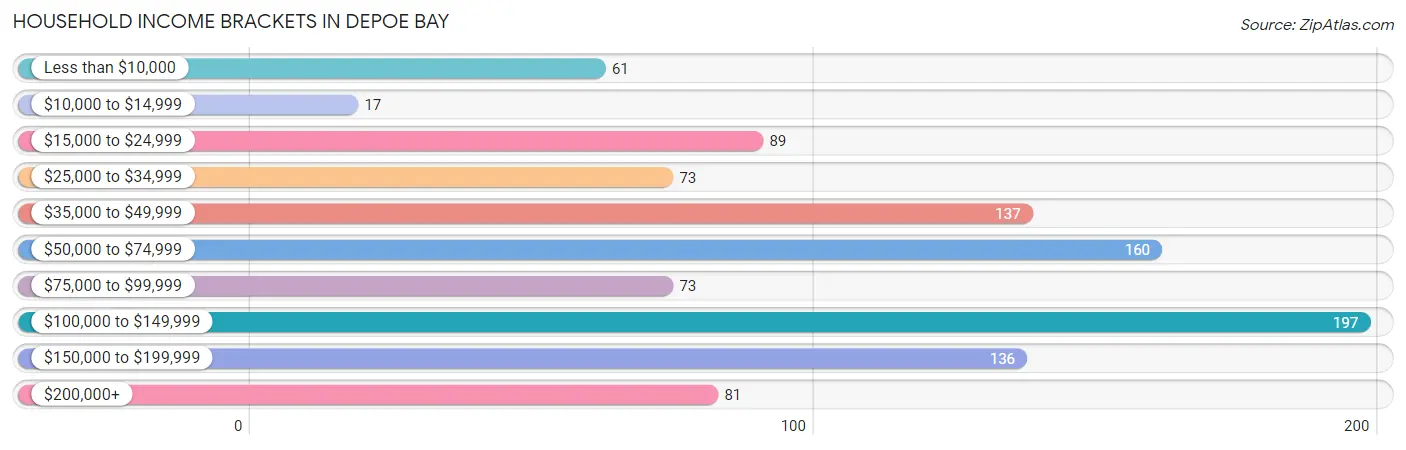
| Income Bracket | # Households | % Households |
| Less than $10,000 | 61 | 6.0% |
| $10,000 to $14,999 | 17 | 1.7% |
| $15,000 to $24,999 | 89 | 8.7% |
| $25,000 to $34,999 | 73 | 7.1% |
| $35,000 to $49,999 | 137 | 13.4% |
| $50,000 to $74,999 | 160 | 15.6% |
| $75,000 to $99,999 | 73 | 7.1% |
| $100,000 to $149,999 | 197 | 19.2% |
| $150,000 to $199,999 | 136 | 13.3% |
| $200,000+ | 81 | 7.9% |
Household Income by Householder Age in Depoe Bay
The median household income in Depoe Bay is $66,667, with the highest median household income of $103,088 found in the 45 to 64 years age bracket for the primary householder. A total of 346 households (33.8%) fall into this category.
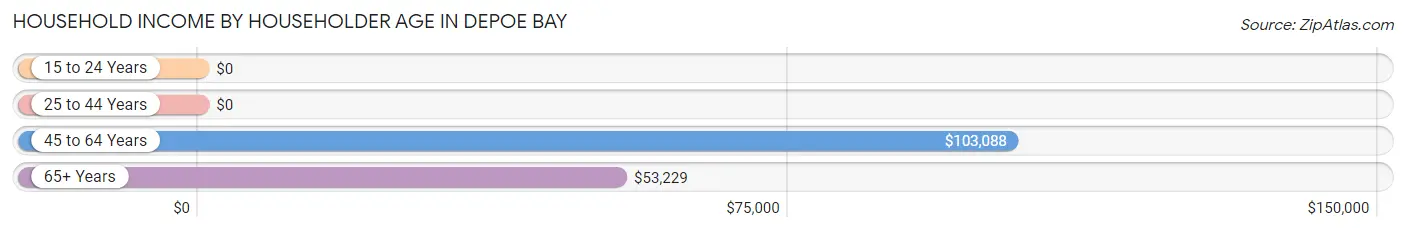
| Income Bracket | # Households | Median Income |
| 15 to 24 Years | 0 (0.0%) | $0 |
| 25 to 44 Years | 218 (21.3%) | $0 |
| 45 to 64 Years | 346 (33.8%) | $103,088 |
| 65+ Years | 460 (44.9%) | $53,229 |
| Total | 1,024 (100.0%) | $66,667 |
Poverty in Depoe Bay
Income Below Poverty by Sex and Age in Depoe Bay
With 0.5% poverty level for males and 12.5% for females among the residents of Depoe Bay, 65 to 74 year old males and 5 year old females are the most vulnerable to poverty, with 5 males (2.5%) and 8 females (100.0%) in their respective age groups living below the poverty level.
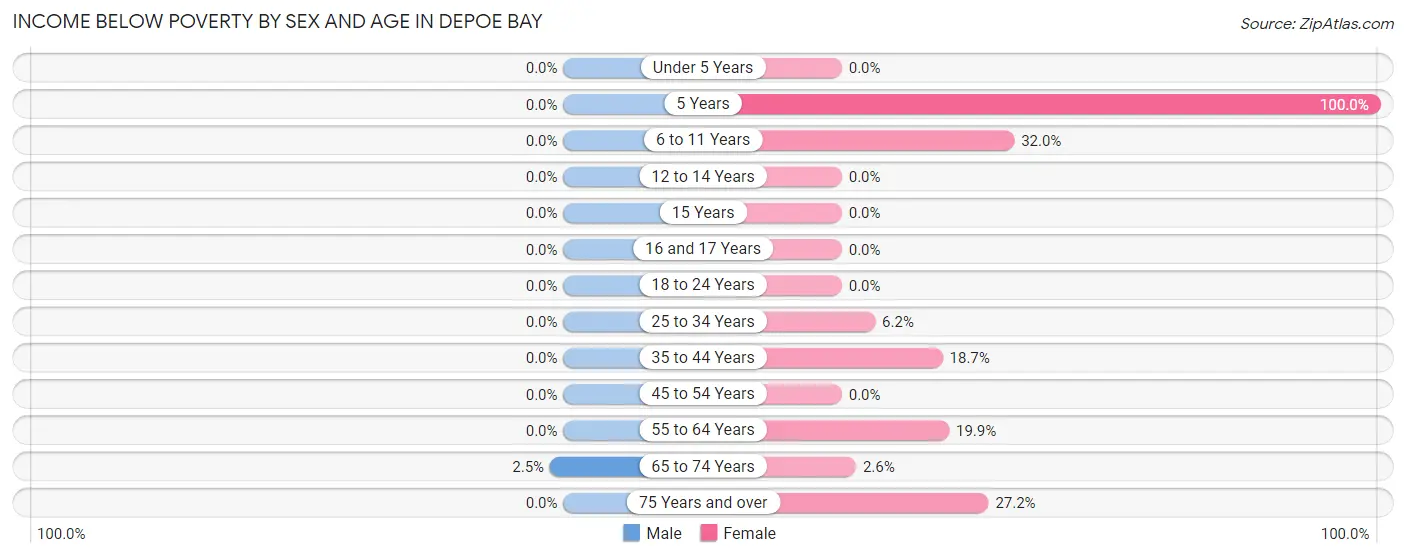
| Age Bracket | Male | Female |
| Under 5 Years | 0 (0.0%) | 0 (0.0%) |
| 5 Years | 0 (0.0%) | 8 (100.0%) |
| 6 to 11 Years | 0 (0.0%) | 8 (32.0%) |
| 12 to 14 Years | 0 (0.0%) | 0 (0.0%) |
| 15 Years | 0 (0.0%) | 0 (0.0%) |
| 16 and 17 Years | 0 (0.0%) | 0 (0.0%) |
| 18 to 24 Years | 0 (0.0%) | 0 (0.0%) |
| 25 to 34 Years | 0 (0.0%) | 7 (6.2%) |
| 35 to 44 Years | 0 (0.0%) | 29 (18.7%) |
| 45 to 54 Years | 0 (0.0%) | 0 (0.0%) |
| 55 to 64 Years | 0 (0.0%) | 39 (19.9%) |
| 65 to 74 Years | 5 (2.5%) | 6 (2.6%) |
| 75 Years and over | 0 (0.0%) | 43 (27.2%) |
| Total | 5 (0.5%) | 140 (12.5%) |
Income Above Poverty by Sex and Age in Depoe Bay
According to the poverty statistics in Depoe Bay, males aged under 5 years and females aged under 5 years are the age groups that are most secure financially, with 100.0% of males and 100.0% of females in these age groups living above the poverty line.
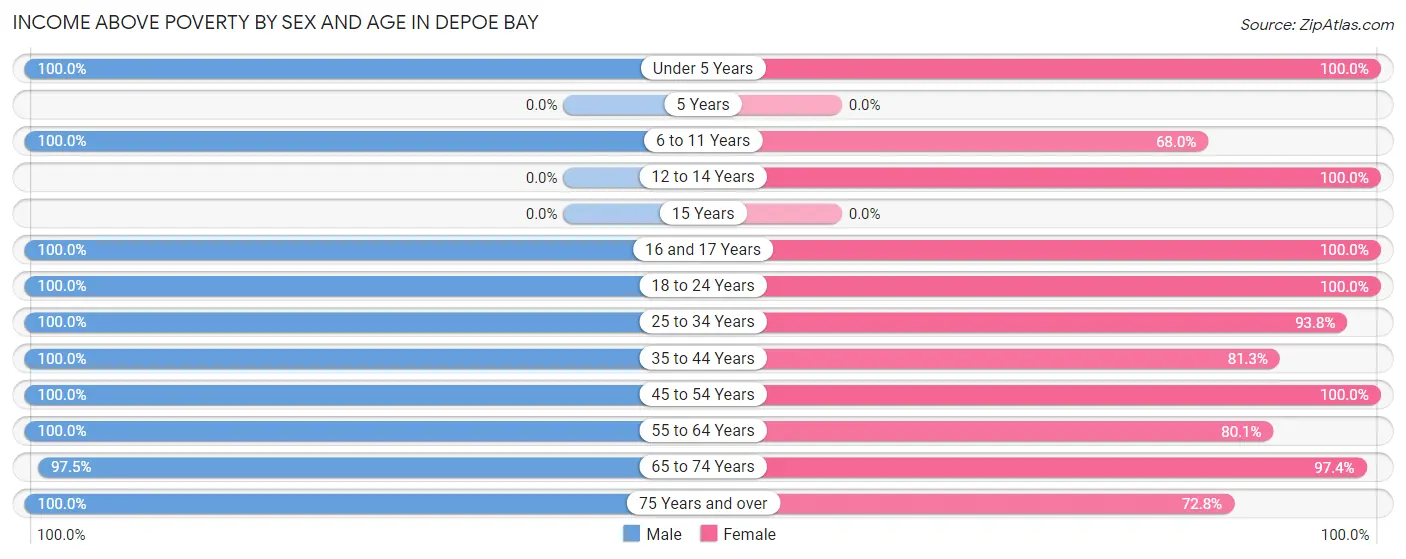
| Age Bracket | Male | Female |
| Under 5 Years | 9 (100.0%) | 67 (100.0%) |
| 5 Years | 0 (0.0%) | 0 (0.0%) |
| 6 to 11 Years | 46 (100.0%) | 17 (68.0%) |
| 12 to 14 Years | 0 (0.0%) | 22 (100.0%) |
| 15 Years | 0 (0.0%) | 0 (0.0%) |
| 16 and 17 Years | 9 (100.0%) | 5 (100.0%) |
| 18 to 24 Years | 44 (100.0%) | 37 (100.0%) |
| 25 to 34 Years | 136 (100.0%) | 106 (93.8%) |
| 35 to 44 Years | 115 (100.0%) | 126 (81.3%) |
| 45 to 54 Years | 60 (100.0%) | 107 (100.0%) |
| 55 to 64 Years | 266 (100.0%) | 157 (80.1%) |
| 65 to 74 Years | 196 (97.5%) | 222 (97.4%) |
| 75 Years and over | 53 (100.0%) | 115 (72.8%) |
| Total | 934 (99.5%) | 981 (87.5%) |
Income Below Poverty Among Married-Couple Families in Depoe Bay
The poverty statistics for married-couple families in Depoe Bay show that 1.0% or 5 of the total 520 families live below the poverty line. Families with no children have the highest poverty rate of 1.2%, comprising of 5 families. On the other hand, families with 1 or 2 children have the lowest poverty rate of 0.0%, which includes 0 families.
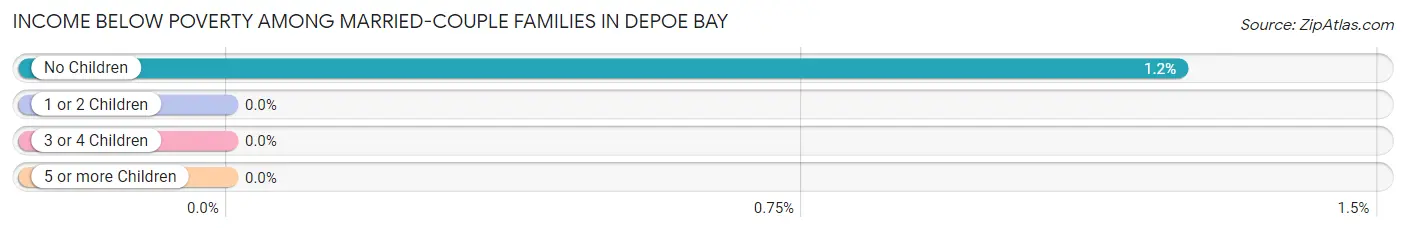
| Children | Above Poverty | Below Poverty |
| No Children | 399 (98.8%) | 5 (1.2%) |
| 1 or 2 Children | 116 (100.0%) | 0 (0.0%) |
| 3 or 4 Children | 0 (0.0%) | 0 (0.0%) |
| 5 or more Children | 0 (0.0%) | 0 (0.0%) |
| Total | 515 (99.0%) | 5 (1.0%) |
Income Below Poverty Among Single-Parent Households in Depoe Bay
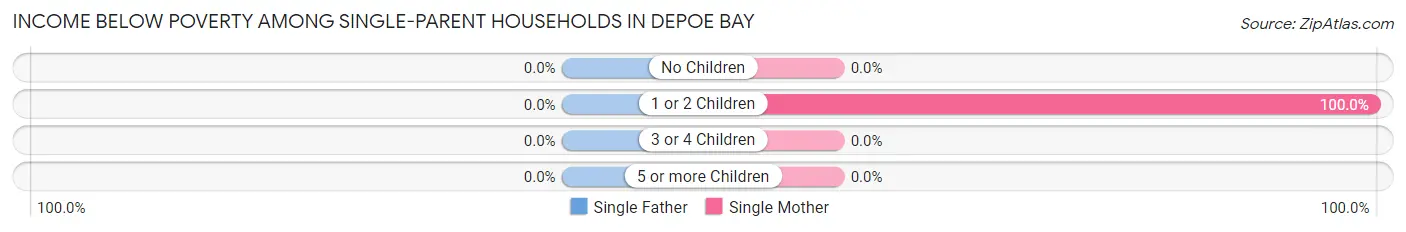
| Children | Single Father | Single Mother |
| No Children | 0 (0.0%) | 0 (0.0%) |
| 1 or 2 Children | 0 (0.0%) | 7 (100.0%) |
| 3 or 4 Children | 0 (0.0%) | 0 (0.0%) |
| 5 or more Children | 0 (0.0%) | 0 (0.0%) |
| Total | 0 (0.0%) | 7 (13.2%) |
Income Below Poverty Among Married-Couple vs Single-Parent Households in Depoe Bay
The poverty data for Depoe Bay shows that 5 of the married-couple family households (1.0%) and 7 of the single-parent households (5.2%) are living below the poverty level. Within the married-couple family households, those with no children have the highest poverty rate, with 5 households (1.2%) falling below the poverty line. Among the single-parent households, those with 1 or 2 children have the highest poverty rate, with 7 household (15.2%) living below poverty.
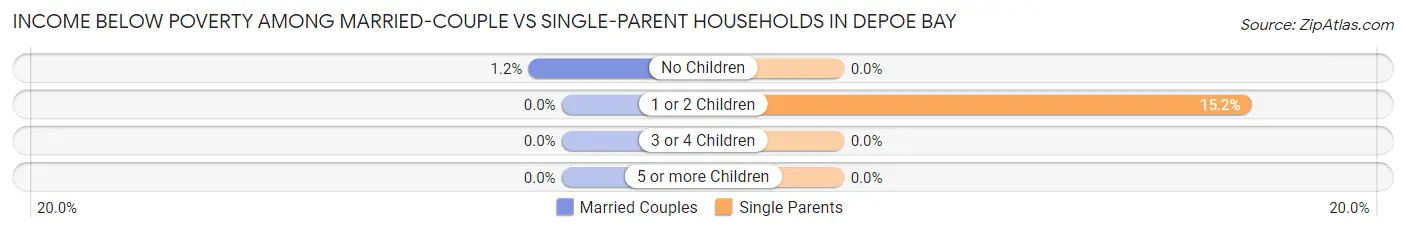
| Children | Married-Couple Families | Single-Parent Households |
| No Children | 5 (1.2%) | 0 (0.0%) |
| 1 or 2 Children | 0 (0.0%) | 7 (15.2%) |
| 3 or 4 Children | 0 (0.0%) | 0 (0.0%) |
| 5 or more Children | 0 (0.0%) | 0 (0.0%) |
| Total | 5 (1.0%) | 7 (5.2%) |
Race in Depoe Bay
The most populous races in Depoe Bay are White / Caucasian (2,016 | 97.6%), Hispanic or Latino (105 | 5.1%), and Some other Race (31 | 1.5%).
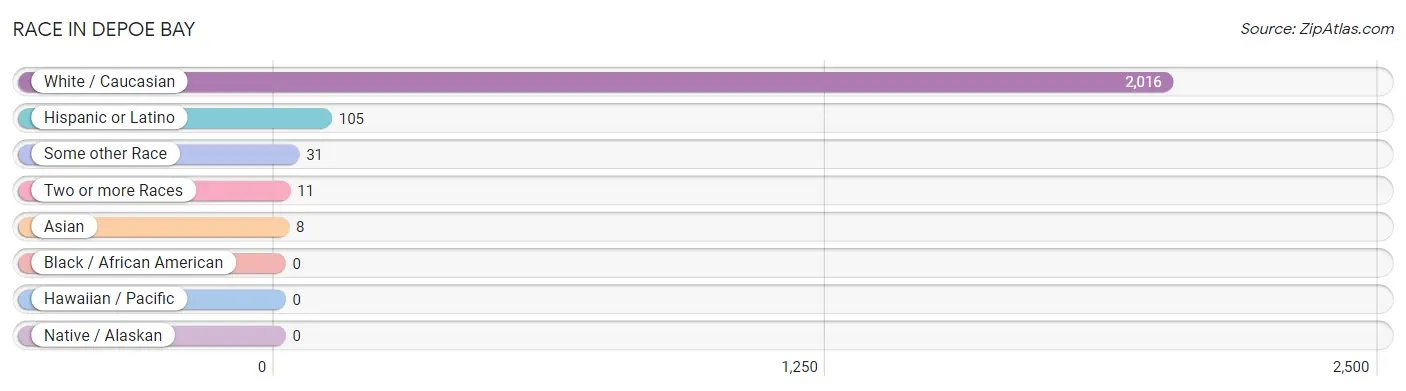
| Race | # Population | % Population |
| Asian | 8 | 0.4% |
| Black / African American | 0 | 0.0% |
| Hawaiian / Pacific | 0 | 0.0% |
| Hispanic or Latino | 105 | 5.1% |
| Native / Alaskan | 0 | 0.0% |
| White / Caucasian | 2,016 | 97.6% |
| Two or more Races | 11 | 0.5% |
| Some other Race | 31 | 1.5% |
| Total | 2,066 | 100.0% |
Ancestry in Depoe Bay
The most populous ancestries reported in Depoe Bay are German (492 | 23.8%), English (480 | 23.2%), Irish (236 | 11.4%), Scottish (190 | 9.2%), and Norwegian (146 | 7.1%), together accounting for 74.7% of all Depoe Bay residents.
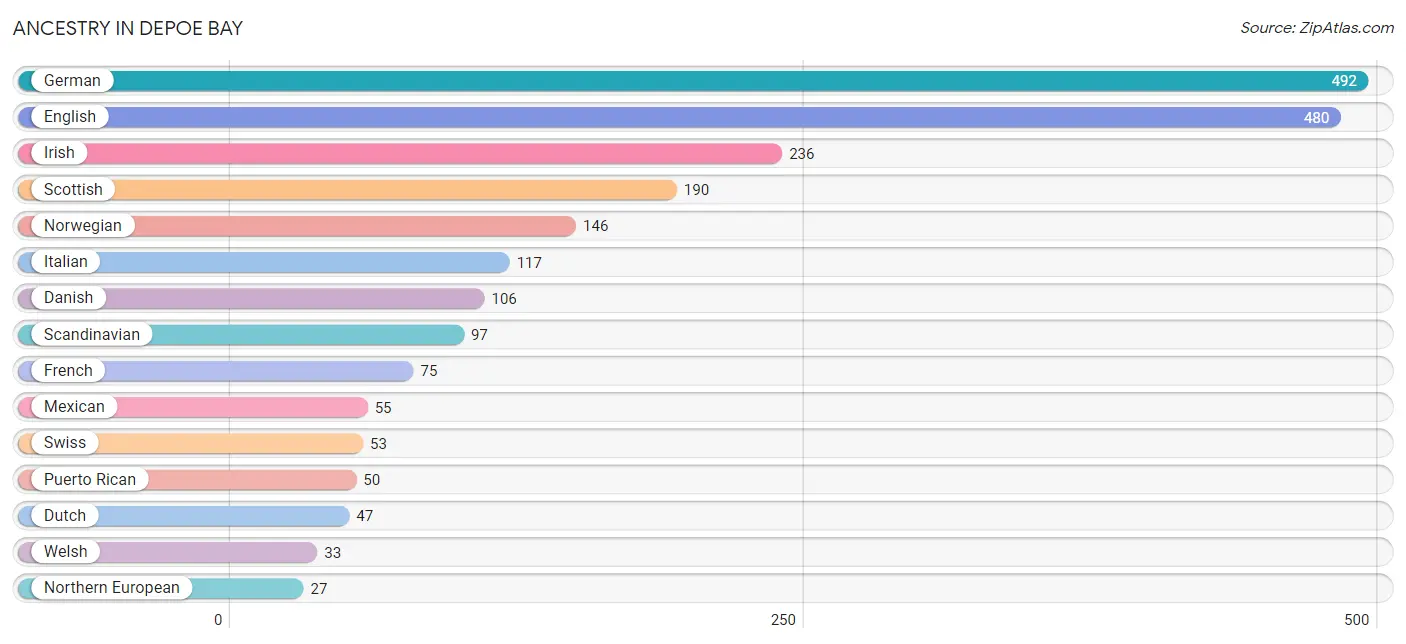
| Ancestry | # Population | % Population |
| American | 3 | 0.2% |
| Cherokee | 7 | 0.3% |
| Danish | 106 | 5.1% |
| Delaware | 2 | 0.1% |
| Dutch | 47 | 2.3% |
| English | 480 | 23.2% |
| European | 15 | 0.7% |
| Finnish | 5 | 0.2% |
| French | 75 | 3.6% |
| German | 492 | 23.8% |
| Indian (Asian) | 8 | 0.4% |
| Irish | 236 | 11.4% |
| Italian | 117 | 5.7% |
| Korean | 8 | 0.4% |
| Mexican | 55 | 2.7% |
| Northern European | 27 | 1.3% |
| Norwegian | 146 | 7.1% |
| Polish | 24 | 1.2% |
| Puerto Rican | 50 | 2.4% |
| Russian | 2 | 0.1% |
| Scandinavian | 97 | 4.7% |
| Scotch-Irish | 8 | 0.4% |
| Scottish | 190 | 9.2% |
| Sioux | 2 | 0.1% |
| Swedish | 20 | 1.0% |
| Swiss | 53 | 2.6% |
| Welsh | 33 | 1.6% | View All 27 Rows |
Immigrants in Depoe Bay
The most numerous immigrant groups reported in Depoe Bay came from Europe (13 | 0.6%), Switzerland (13 | 0.6%), and Western Europe (13 | 0.6%), together accounting for 1.9% of all Depoe Bay residents.
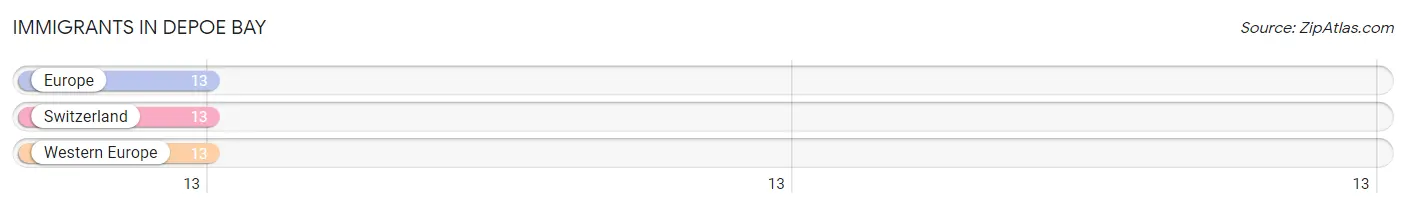
| Immigration Origin | # Population | % Population |
| Europe | 13 | 0.6% |
| Switzerland | 13 | 0.6% |
| Western Europe | 13 | 0.6% | View All 3 Rows |
Sex and Age in Depoe Bay
Sex and Age in Depoe Bay
The most populous age groups in Depoe Bay are 60 to 64 Years (174 | 18.5%) for men and 65 to 69 Years (166 | 14.7%) for women.
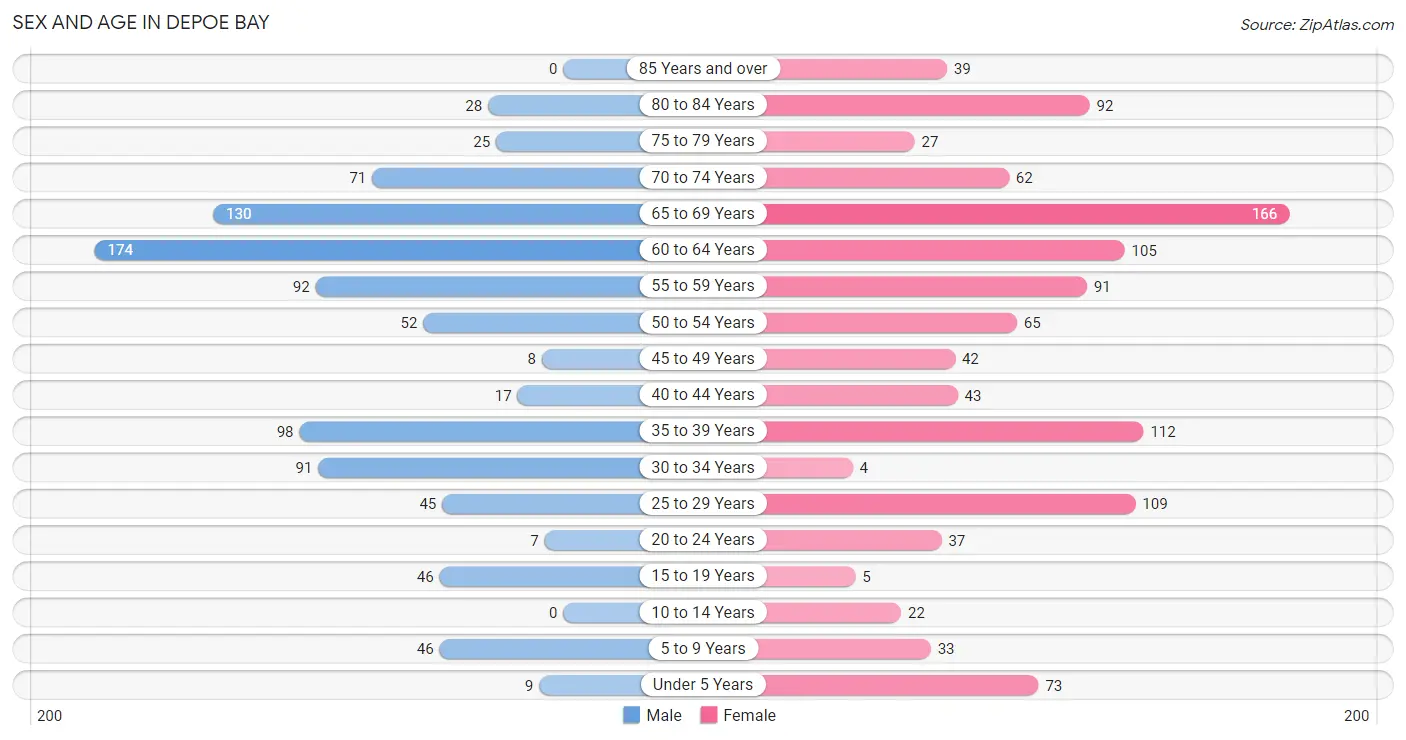
| Age Bracket | Male | Female |
| Under 5 Years | 9 (1.0%) | 73 (6.5%) |
| 5 to 9 Years | 46 (4.9%) | 33 (2.9%) |
| 10 to 14 Years | 0 (0.0%) | 22 (1.9%) |
| 15 to 19 Years | 46 (4.9%) | 5 (0.4%) |
| 20 to 24 Years | 7 (0.7%) | 37 (3.3%) |
| 25 to 29 Years | 45 (4.8%) | 109 (9.7%) |
| 30 to 34 Years | 91 (9.7%) | 4 (0.4%) |
| 35 to 39 Years | 98 (10.4%) | 112 (9.9%) |
| 40 to 44 Years | 17 (1.8%) | 43 (3.8%) |
| 45 to 49 Years | 8 (0.9%) | 42 (3.7%) |
| 50 to 54 Years | 52 (5.5%) | 65 (5.8%) |
| 55 to 59 Years | 92 (9.8%) | 91 (8.1%) |
| 60 to 64 Years | 174 (18.5%) | 105 (9.3%) |
| 65 to 69 Years | 130 (13.8%) | 166 (14.7%) |
| 70 to 74 Years | 71 (7.6%) | 62 (5.5%) |
| 75 to 79 Years | 25 (2.7%) | 27 (2.4%) |
| 80 to 84 Years | 28 (3.0%) | 92 (8.2%) |
| 85 Years and over | 0 (0.0%) | 39 (3.5%) |
| Total | 939 (100.0%) | 1,127 (100.0%) |
Families and Households in Depoe Bay
Median Family Size in Depoe Bay
The median family size in Depoe Bay is 2.47 persons per family, with single male/father families (82 | 12.5%) accounting for the largest median family size of 3.01 persons per family. On the other hand, married-couple families (520 | 79.4%) represent the smallest median family size with 2.36 persons per family.
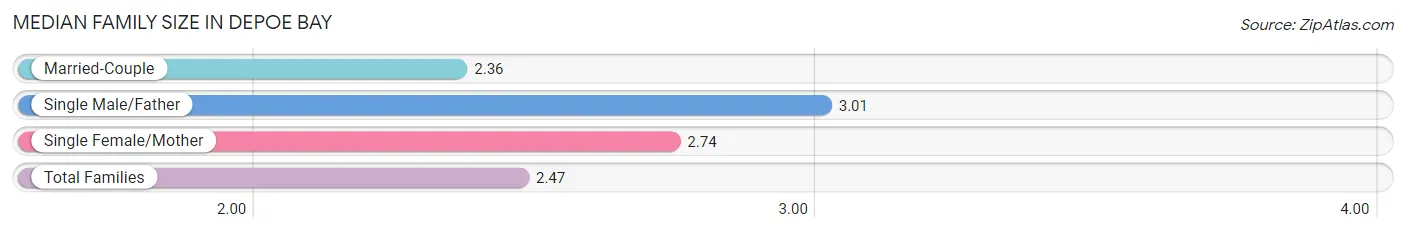
| Family Type | # Families | Family Size |
| Married-Couple | 520 (79.4%) | 2.36 |
| Single Male/Father | 82 (12.5%) | 3.01 |
| Single Female/Mother | 53 (8.1%) | 2.74 |
| Total Families | 655 (100.0%) | 2.47 |
Median Household Size in Depoe Bay
The median household size in Depoe Bay is 2.02 persons per household, with single male/father households (82 | 8.0%) accounting for the largest median household size of 3.21 persons per household. non-family households (369 | 36.0%) represent the smallest median household size with 1.13 persons per household.
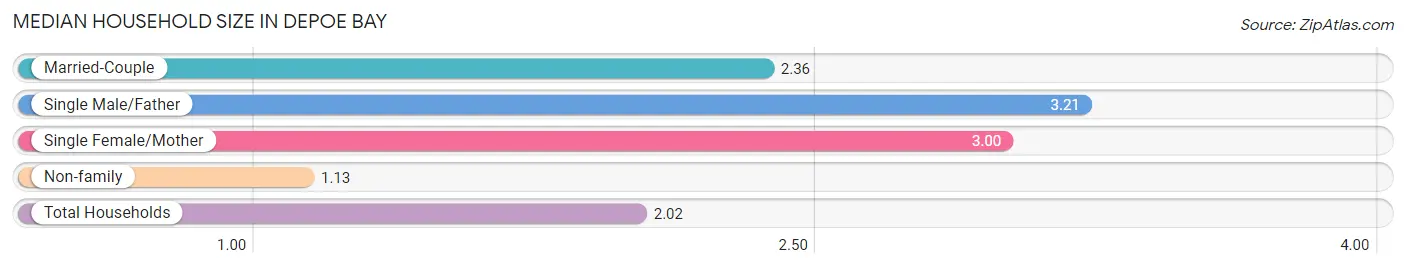
| Household Type | # Households | Household Size |
| Married-Couple | 520 (50.8%) | 2.36 |
| Single Male/Father | 82 (8.0%) | 3.21 |
| Single Female/Mother | 53 (5.2%) | 3.00 |
| Non-family | 369 (36.0%) | 1.13 |
| Total Households | 1,024 (100.0%) | 2.02 |
Household Size by Marriage Status in Depoe Bay
Out of a total of 1,024 households in Depoe Bay, 655 (64.0%) are family households, while 369 (36.0%) are nonfamily households. The most numerous type of family households are 2-person households, comprising 451, and the most common type of nonfamily households are 1-person households, comprising 326.
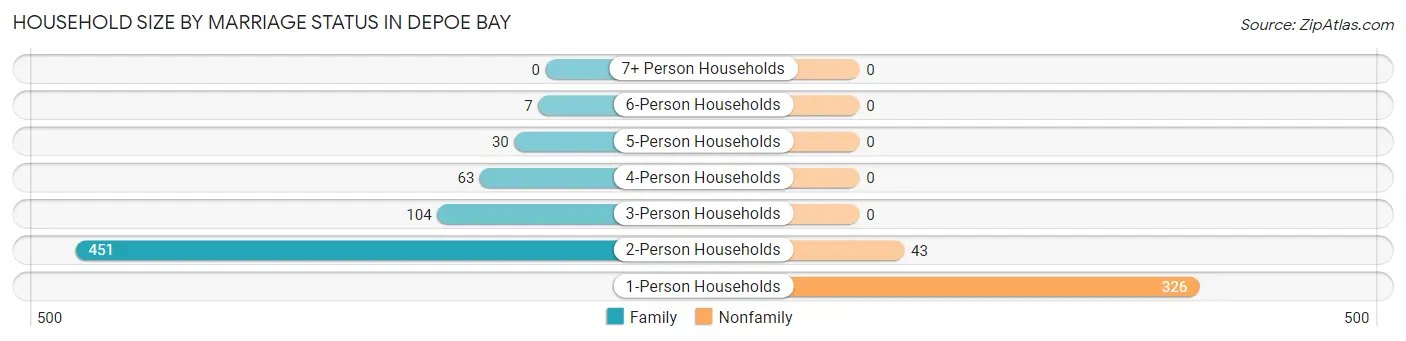
| Household Size | Family Households | Nonfamily Households |
| 1-Person Households | - | 326 (31.8%) |
| 2-Person Households | 451 (44.0%) | 43 (4.2%) |
| 3-Person Households | 104 (10.2%) | 0 (0.0%) |
| 4-Person Households | 63 (6.1%) | 0 (0.0%) |
| 5-Person Households | 30 (2.9%) | 0 (0.0%) |
| 6-Person Households | 7 (0.7%) | 0 (0.0%) |
| 7+ Person Households | 0 (0.0%) | 0 (0.0%) |
| Total | 655 (64.0%) | 369 (36.0%) |
Female Fertility in Depoe Bay
Fertility by Age in Depoe Bay
Average fertility rate in Depoe Bay is 159.0 births per 1,000 women. Women in the age bracket of 20 to 34 years have the highest fertility rate with 373.0 births per 1,000 women. Women in the age bracket of 20 to 34 years acount for 100.0% of all women with births.
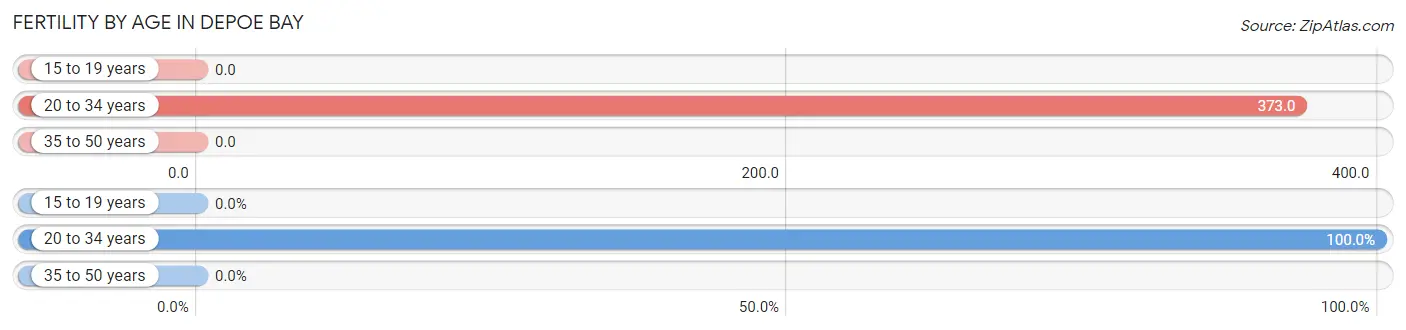
| Age Bracket | Women with Births | Births / 1,000 Women |
| 15 to 19 years | 0 (0.0%) | 0.0 |
| 20 to 34 years | 56 (100.0%) | 373.0 |
| 35 to 50 years | 0 (0.0%) | 0.0 |
| Total | 56 (100.0%) | 159.0 |
Fertility by Age by Marriage Status in Depoe Bay
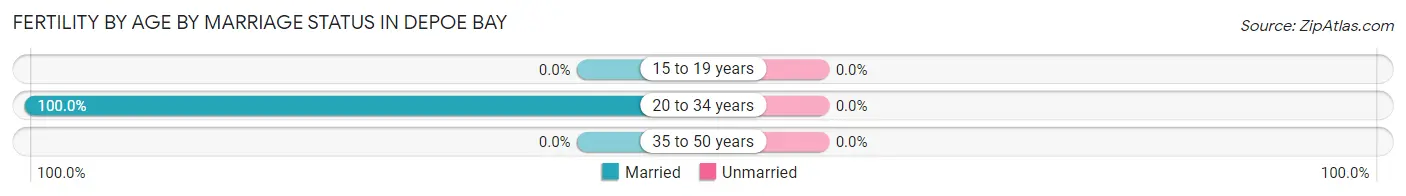
| Age Bracket | Married | Unmarried |
| 15 to 19 years | 0 (0.0%) | 0 (0.0%) |
| 20 to 34 years | 56 (100.0%) | 0 (0.0%) |
| 35 to 50 years | 0 (0.0%) | 0 (0.0%) |
| Total | 56 (100.0%) | 0 (0.0%) |
Fertility by Education in Depoe Bay
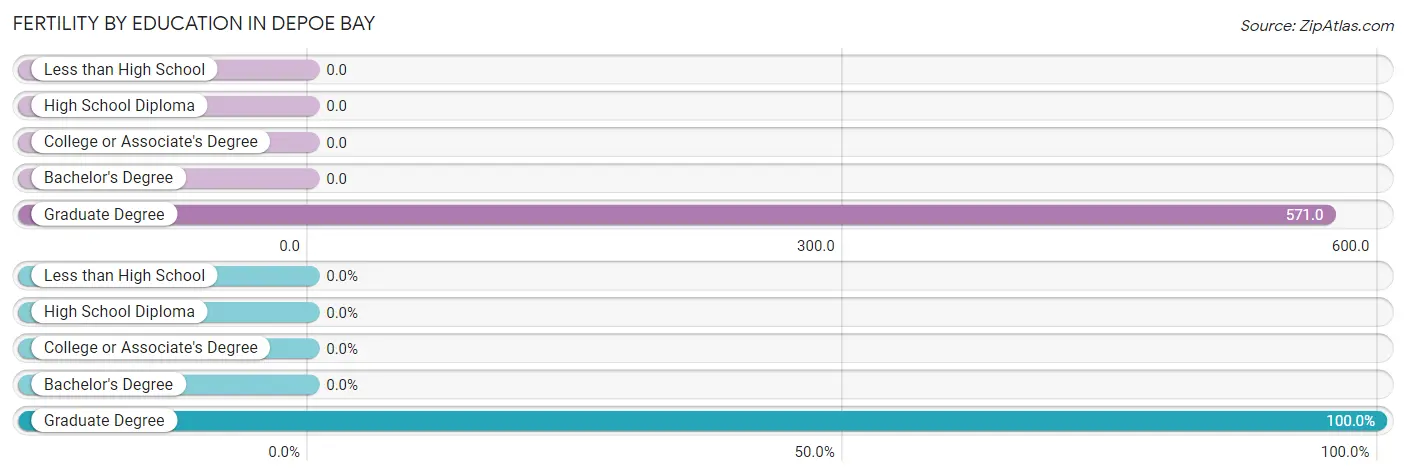
| Educational Attainment | Women with Births | Births / 1,000 Women |
| Less than High School | 0 (0.0%) | 0.0 |
| High School Diploma | 0 (0.0%) | 0.0 |
| College or Associate's Degree | 0 (0.0%) | 0.0 |
| Bachelor's Degree | 0 (0.0%) | 0.0 |
| Graduate Degree | 56 (100.0%) | 571.0 |
| Total | 56 (100.0%) | 159.0 |
Fertility by Education by Marriage Status in Depoe Bay
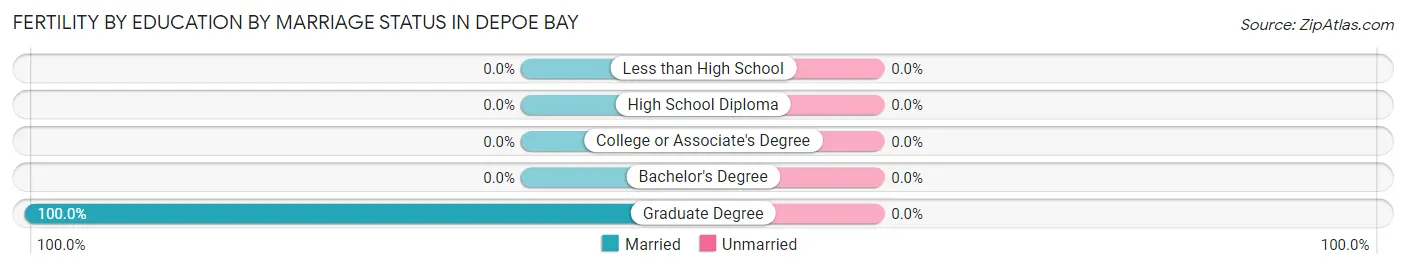
| Educational Attainment | Married | Unmarried |
| Less than High School | 0 (0.0%) | 0 (0.0%) |
| High School Diploma | 0 (0.0%) | 0 (0.0%) |
| College or Associate's Degree | 0 (0.0%) | 0 (0.0%) |
| Bachelor's Degree | 0 (0.0%) | 0 (0.0%) |
| Graduate Degree | 56 (100.0%) | 0 (0.0%) |
| Total | 56 (100.0%) | 0 (0.0%) |
Employment Characteristics in Depoe Bay
Employment by Class of Employer in Depoe Bay
Among the 894 employed individuals in Depoe Bay, private company employees (415 | 46.4%), local government employees (236 | 26.4%), and self-employed (not incorporated) (73 | 8.2%) make up the most common classes of employment.
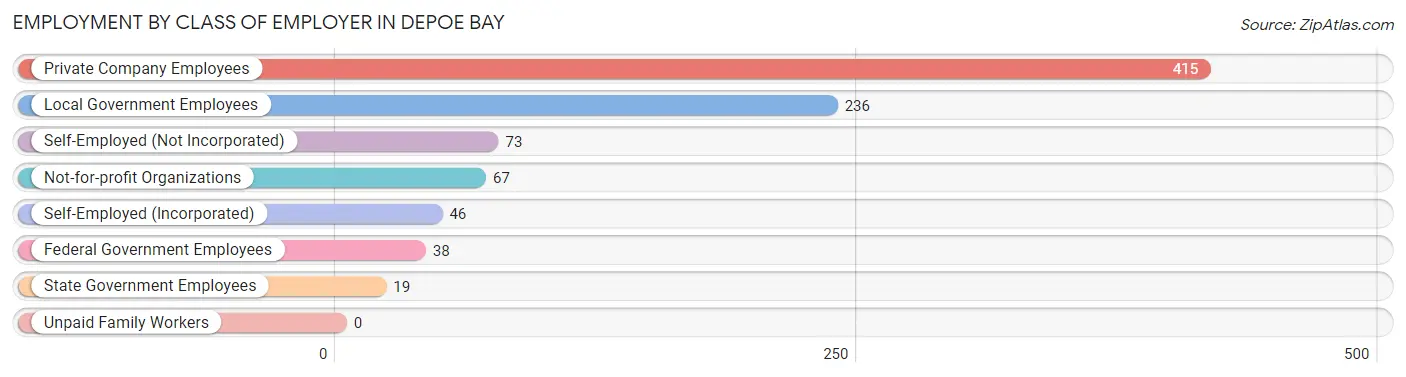
| Employer Class | # Employees | % Employees |
| Private Company Employees | 415 | 46.4% |
| Self-Employed (Incorporated) | 46 | 5.1% |
| Self-Employed (Not Incorporated) | 73 | 8.2% |
| Not-for-profit Organizations | 67 | 7.5% |
| Local Government Employees | 236 | 26.4% |
| State Government Employees | 19 | 2.1% |
| Federal Government Employees | 38 | 4.3% |
| Unpaid Family Workers | 0 | 0.0% |
| Total | 894 | 100.0% |
Employment Status by Age in Depoe Bay
According to the labor force statistics for Depoe Bay, out of the total population over 16 years of age (1,883), 55.4% or 1,043 individuals are in the labor force, with 13.1% or 137 of them unemployed. The age group with the highest labor force participation rate is 20 to 24 years, with 100.0% or 44 individuals in the labor force. Within the labor force, the 30 to 34 years age range has the highest percentage of unemployed individuals, with 90.3% or 56 of them being unemployed.
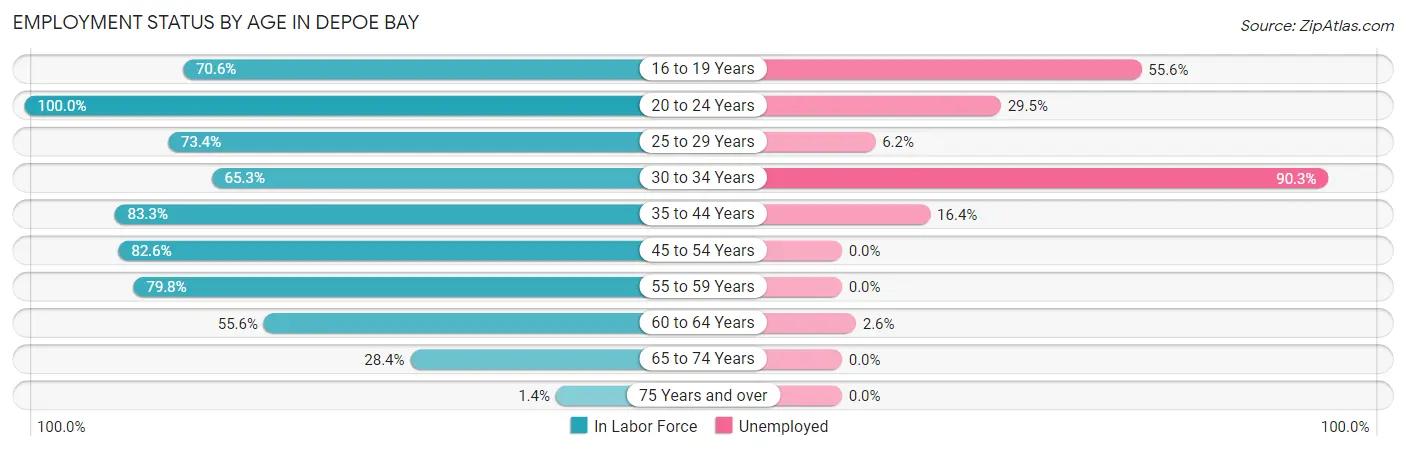
| Age Bracket | In Labor Force | Unemployed |
| 16 to 19 Years | 36 (70.6%) | 20 (55.6%) |
| 20 to 24 Years | 44 (100.0%) | 13 (29.5%) |
| 25 to 29 Years | 113 (73.4%) | 7 (6.2%) |
| 30 to 34 Years | 62 (65.3%) | 56 (90.3%) |
| 35 to 44 Years | 225 (83.3%) | 37 (16.4%) |
| 45 to 54 Years | 138 (82.6%) | 0 (0.0%) |
| 55 to 59 Years | 146 (79.8%) | 0 (0.0%) |
| 60 to 64 Years | 155 (55.6%) | 4 (2.6%) |
| 65 to 74 Years | 122 (28.4%) | 0 (0.0%) |
| 75 Years and over | 3 (1.4%) | 0 (0.0%) |
| Total | 1,043 (55.4%) | 137 (13.1%) |
Employment Status by Educational Attainment in Depoe Bay
According to labor force statistics for Depoe Bay, 73.1% of individuals (839) out of the total population between 25 and 64 years of age (1,148) are in the labor force, with 12.4% or 104 of them being unemployed. The group with the highest labor force participation rate are those with the educational attainment of less than high school, with 100.0% or 8 individuals in the labor force. Within the labor force, individuals with college / associate degree education have the highest percentage of unemployment, with 24.0% or 88 of them being unemployed.
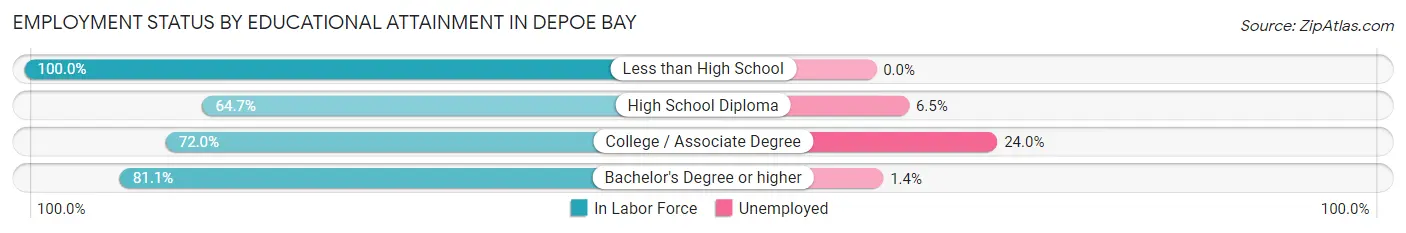
| Educational Attainment | In Labor Force | Unemployed |
| Less than High School | 8 (100.0%) | 0 (0.0%) |
| High School Diploma | 185 (64.7%) | 19 (6.5%) |
| College / Associate Degree | 367 (72.0%) | 122 (24.0%) |
| Bachelor's Degree or higher | 279 (81.1%) | 5 (1.4%) |
| Total | 839 (73.1%) | 142 (12.4%) |
Employment Occupations by Sex in Depoe Bay
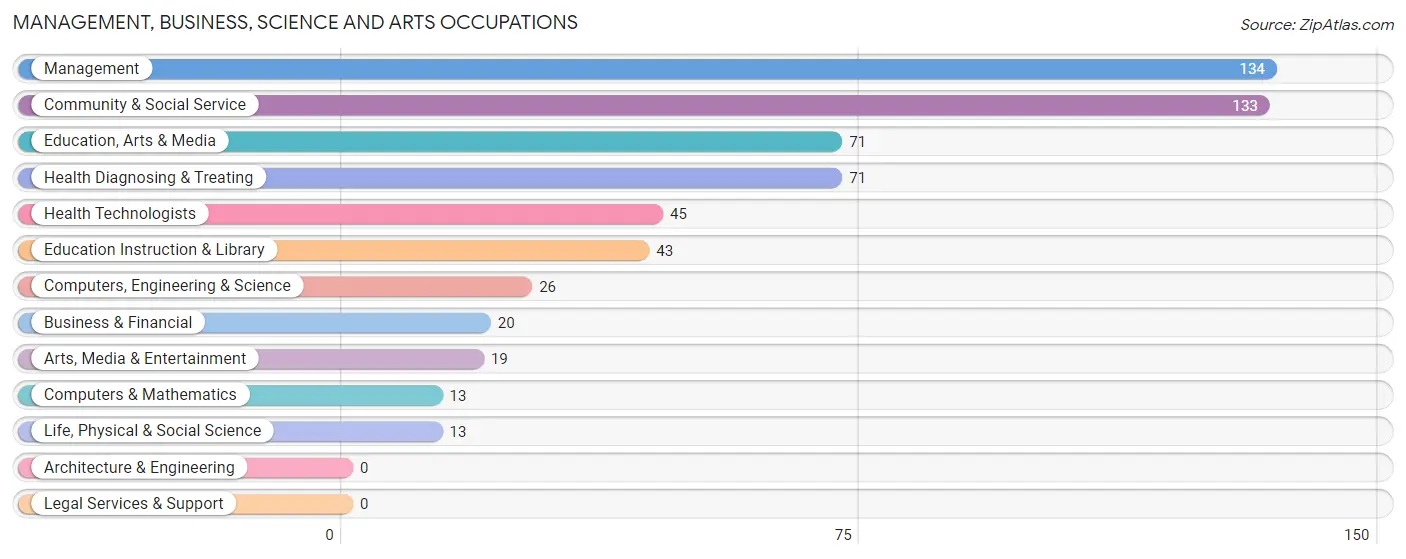
Management, Business, Science and Arts Occupations
The most common Management, Business, Science and Arts occupations in Depoe Bay are Management (134 | 14.8%), Community & Social Service (133 | 14.7%), Education, Arts & Media (71 | 7.8%), Health Diagnosing & Treating (71 | 7.8%), and Health Technologists (45 | 5.0%).
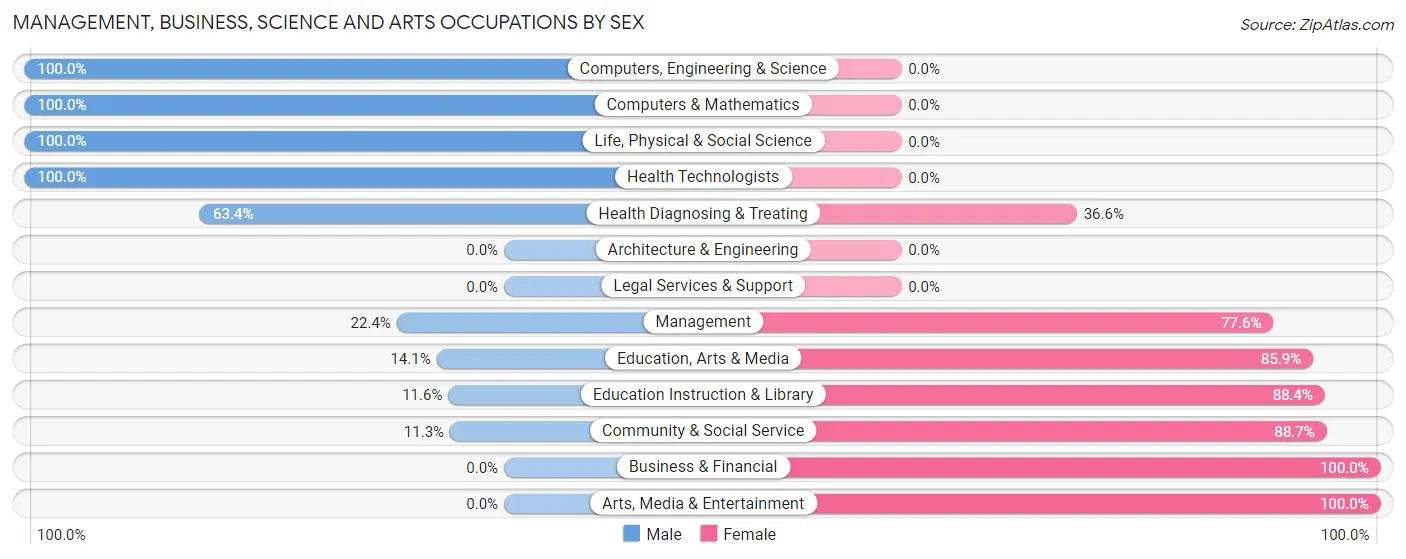
Management, Business, Science and Arts Occupations by Sex
Within the Management, Business, Science and Arts occupations in Depoe Bay, the most male-oriented occupations are Computers, Engineering & Science (100.0%), Computers & Mathematics (100.0%), and Life, Physical & Social Science (100.0%), while the most female-oriented occupations are Business & Financial (100.0%), Arts, Media & Entertainment (100.0%), and Community & Social Service (88.7%).
| Occupation | Male | Female |
| Management | 30 (22.4%) | 104 (77.6%) |
| Business & Financial | 0 (0.0%) | 20 (100.0%) |
| Computers, Engineering & Science | 26 (100.0%) | 0 (0.0%) |
| Computers & Mathematics | 13 (100.0%) | 0 (0.0%) |
| Architecture & Engineering | 0 (0.0%) | 0 (0.0%) |
| Life, Physical & Social Science | 13 (100.0%) | 0 (0.0%) |
| Community & Social Service | 15 (11.3%) | 118 (88.7%) |
| Education, Arts & Media | 10 (14.1%) | 61 (85.9%) |
| Legal Services & Support | 0 (0.0%) | 0 (0.0%) |
| Education Instruction & Library | 5 (11.6%) | 38 (88.4%) |
| Arts, Media & Entertainment | 0 (0.0%) | 19 (100.0%) |
| Health Diagnosing & Treating | 45 (63.4%) | 26 (36.6%) |
| Health Technologists | 45 (100.0%) | 0 (0.0%) |
| Total (Category) | 116 (30.2%) | 268 (69.8%) |
| Total (Overall) | 421 (46.4%) | 486 (53.6%) |
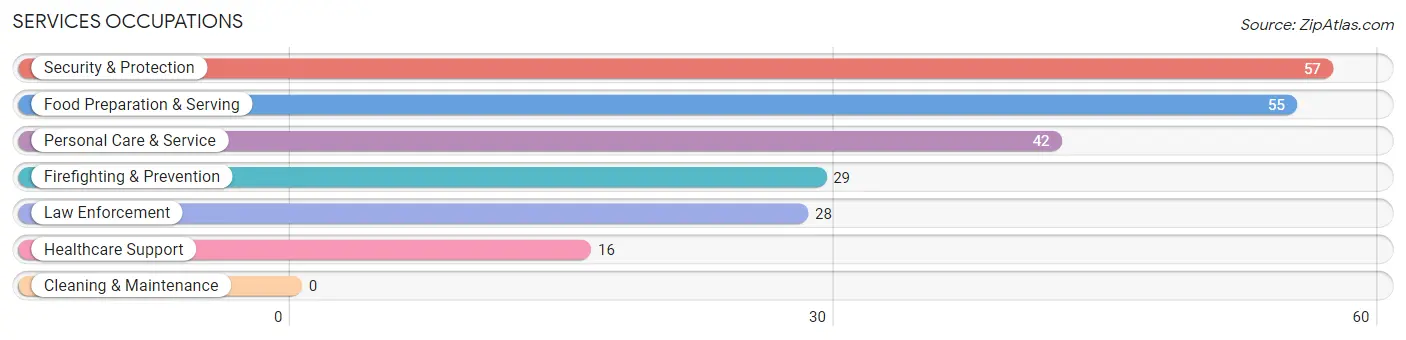
Services Occupations
The most common Services occupations in Depoe Bay are Security & Protection (57 | 6.3%), Food Preparation & Serving (55 | 6.1%), Personal Care & Service (42 | 4.6%), Firefighting & Prevention (29 | 3.2%), and Law Enforcement (28 | 3.1%).
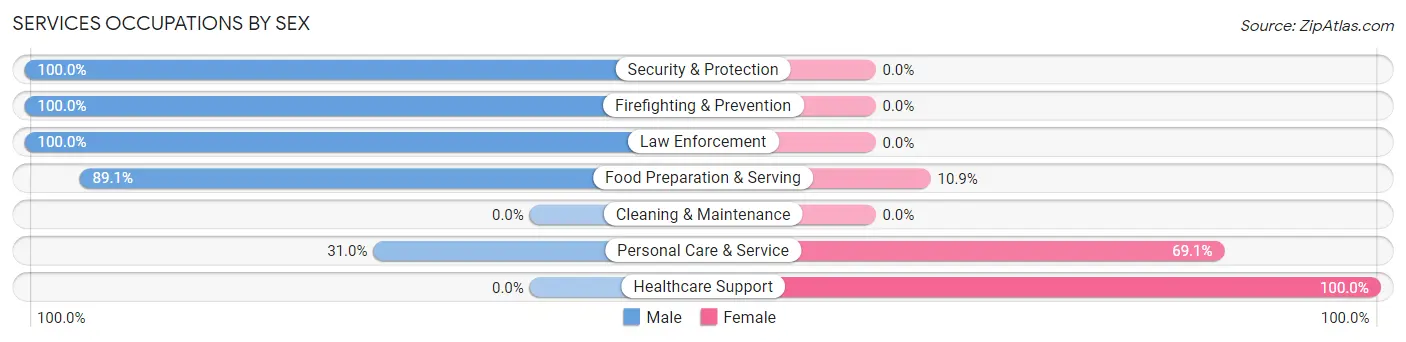
Services Occupations by Sex
Within the Services occupations in Depoe Bay, the most male-oriented occupations are Security & Protection (100.0%), Firefighting & Prevention (100.0%), and Law Enforcement (100.0%), while the most female-oriented occupations are Healthcare Support (100.0%), Personal Care & Service (69.1%), and Food Preparation & Serving (10.9%).
| Occupation | Male | Female |
| Healthcare Support | 0 (0.0%) | 16 (100.0%) |
| Security & Protection | 57 (100.0%) | 0 (0.0%) |
| Firefighting & Prevention | 29 (100.0%) | 0 (0.0%) |
| Law Enforcement | 28 (100.0%) | 0 (0.0%) |
| Food Preparation & Serving | 49 (89.1%) | 6 (10.9%) |
| Cleaning & Maintenance | 0 (0.0%) | 0 (0.0%) |
| Personal Care & Service | 13 (30.9%) | 29 (69.1%) |
| Total (Category) | 119 (70.0%) | 51 (30.0%) |
| Total (Overall) | 421 (46.4%) | 486 (53.6%) |
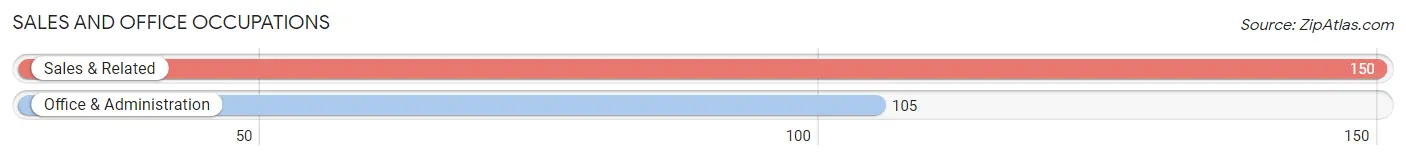
Sales and Office Occupations
The most common Sales and Office occupations in Depoe Bay are Sales & Related (150 | 16.5%), and Office & Administration (105 | 11.6%).
Sales and Office Occupations by Sex
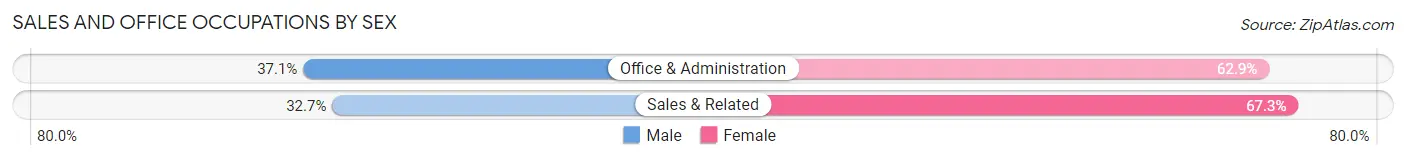
| Occupation | Male | Female |
| Sales & Related | 49 (32.7%) | 101 (67.3%) |
| Office & Administration | 39 (37.1%) | 66 (62.9%) |
| Total (Category) | 88 (34.5%) | 167 (65.5%) |
| Total (Overall) | 421 (46.4%) | 486 (53.6%) |
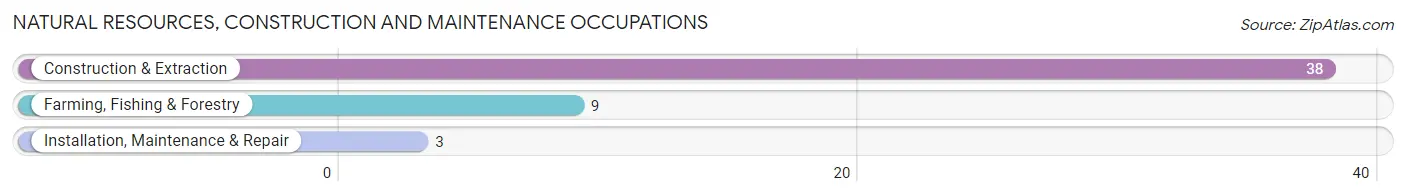
Natural Resources, Construction and Maintenance Occupations
The most common Natural Resources, Construction and Maintenance occupations in Depoe Bay are Construction & Extraction (38 | 4.2%), Farming, Fishing & Forestry (9 | 1.0%), and Installation, Maintenance & Repair (3 | 0.3%).
Natural Resources, Construction and Maintenance Occupations by Sex
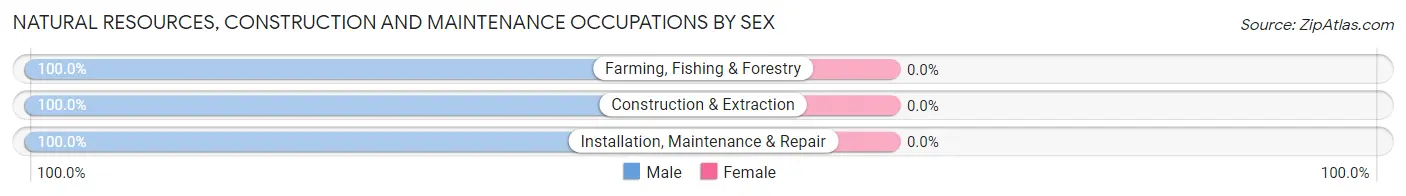
| Occupation | Male | Female |
| Farming, Fishing & Forestry | 9 (100.0%) | 0 (0.0%) |
| Construction & Extraction | 38 (100.0%) | 0 (0.0%) |
| Installation, Maintenance & Repair | 3 (100.0%) | 0 (0.0%) |
| Total (Category) | 50 (100.0%) | 0 (0.0%) |
| Total (Overall) | 421 (46.4%) | 486 (53.6%) |
Production, Transportation and Moving Occupations
The most common Production, Transportation and Moving occupations in Depoe Bay are , and Transportation (48 | 5.3%).
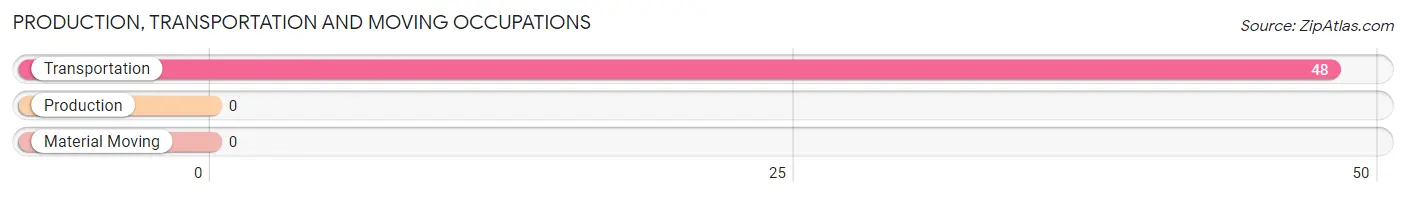
Production, Transportation and Moving Occupations by Sex
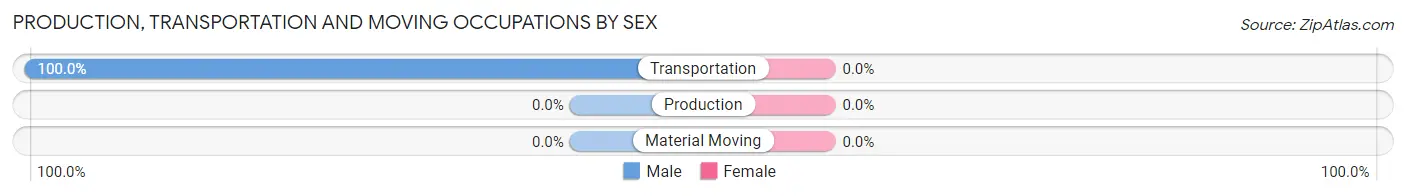
| Occupation | Male | Female |
| Production | 0 (0.0%) | 0 (0.0%) |
| Transportation | 48 (100.0%) | 0 (0.0%) |
| Material Moving | 0 (0.0%) | 0 (0.0%) |
| Total (Category) | 48 (100.0%) | 0 (0.0%) |
| Total (Overall) | 421 (46.4%) | 486 (53.6%) |
Employment Industries by Sex in Depoe Bay
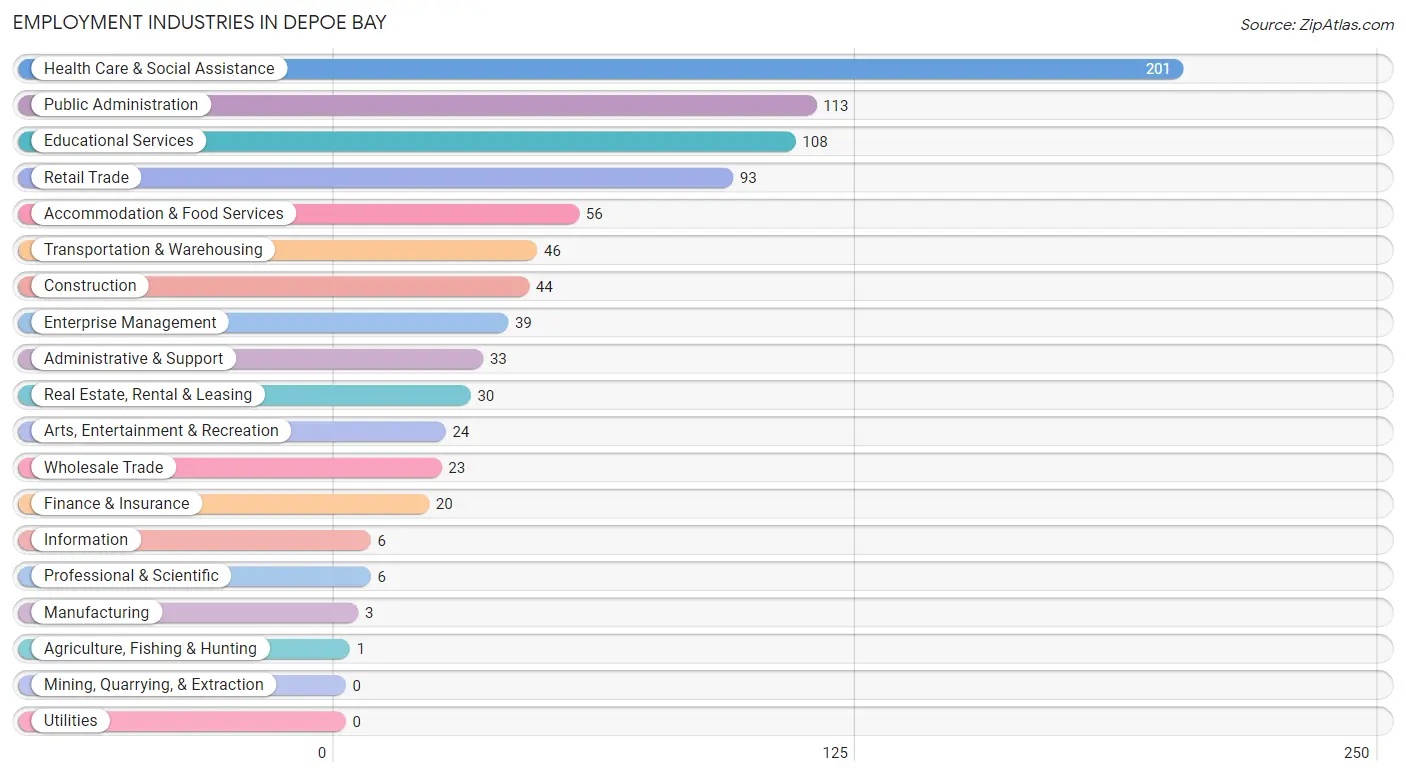
Employment Industries in Depoe Bay
The major employment industries in Depoe Bay include Health Care & Social Assistance (201 | 22.2%), Public Administration (113 | 12.5%), Educational Services (108 | 11.9%), Retail Trade (93 | 10.2%), and Accommodation & Food Services (56 | 6.2%).
Employment Industries by Sex in Depoe Bay
The Depoe Bay industries that see more men than women are Agriculture, Fishing & Hunting (100.0%), Construction (100.0%), and Manufacturing (100.0%), whereas the industries that tend to have a higher number of women are Information (100.0%), Finance & Insurance (100.0%), and Real Estate, Rental & Leasing (90.0%).
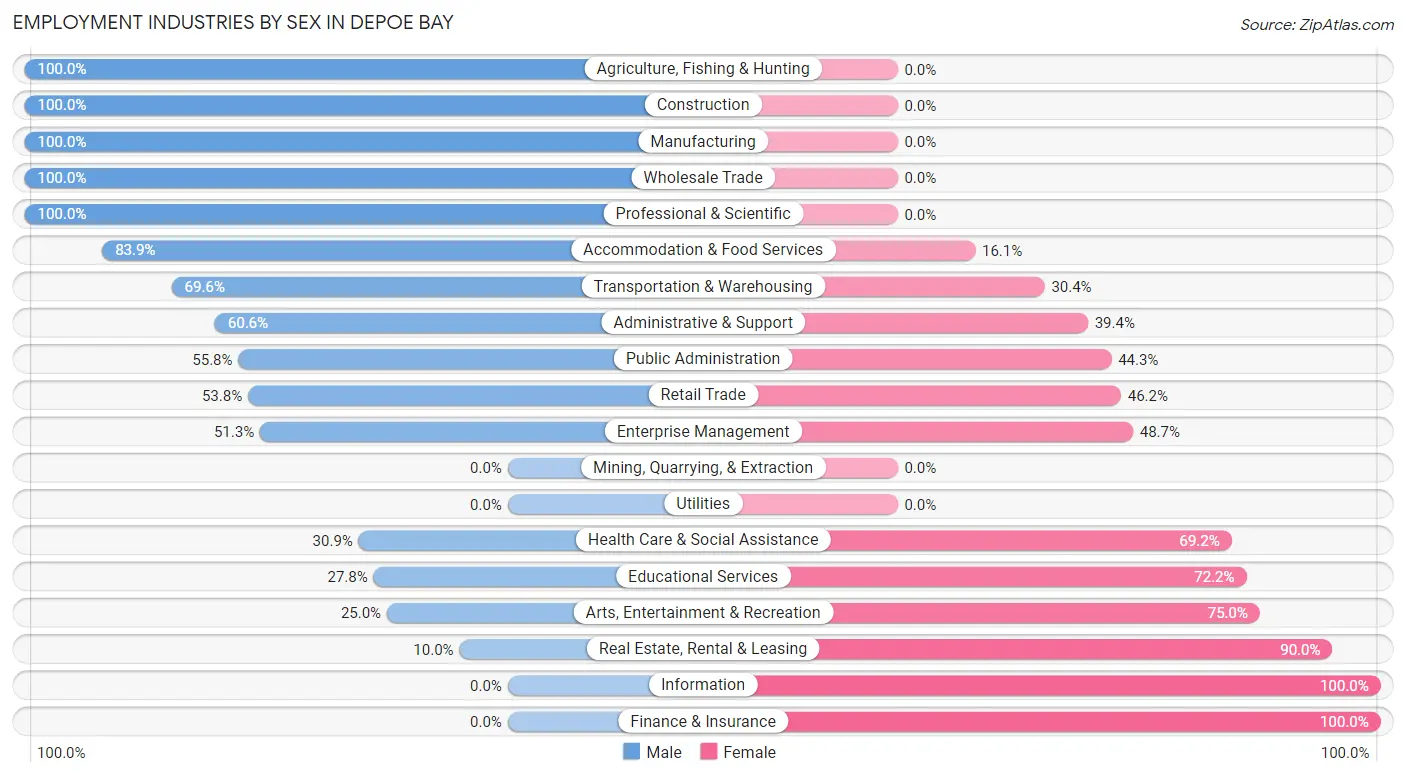
| Industry | Male | Female |
| Agriculture, Fishing & Hunting | 1 (100.0%) | 0 (0.0%) |
| Mining, Quarrying, & Extraction | 0 (0.0%) | 0 (0.0%) |
| Construction | 44 (100.0%) | 0 (0.0%) |
| Manufacturing | 3 (100.0%) | 0 (0.0%) |
| Wholesale Trade | 23 (100.0%) | 0 (0.0%) |
| Retail Trade | 50 (53.8%) | 43 (46.2%) |
| Transportation & Warehousing | 32 (69.6%) | 14 (30.4%) |
| Utilities | 0 (0.0%) | 0 (0.0%) |
| Information | 0 (0.0%) | 6 (100.0%) |
| Finance & Insurance | 0 (0.0%) | 20 (100.0%) |
| Real Estate, Rental & Leasing | 3 (10.0%) | 27 (90.0%) |
| Professional & Scientific | 6 (100.0%) | 0 (0.0%) |
| Enterprise Management | 20 (51.3%) | 19 (48.7%) |
| Administrative & Support | 20 (60.6%) | 13 (39.4%) |
| Educational Services | 30 (27.8%) | 78 (72.2%) |
| Health Care & Social Assistance | 62 (30.8%) | 139 (69.2%) |
| Arts, Entertainment & Recreation | 6 (25.0%) | 18 (75.0%) |
| Accommodation & Food Services | 47 (83.9%) | 9 (16.1%) |
| Public Administration | 63 (55.7%) | 50 (44.3%) |
| Total | 421 (46.4%) | 486 (53.6%) |
Education in Depoe Bay
School Enrollment in Depoe Bay
The most common levels of schooling among the 167 students in Depoe Bay are elementary school (63 | 37.7%), high school (41 | 24.5%), and nursery / preschool (23 | 13.8%).
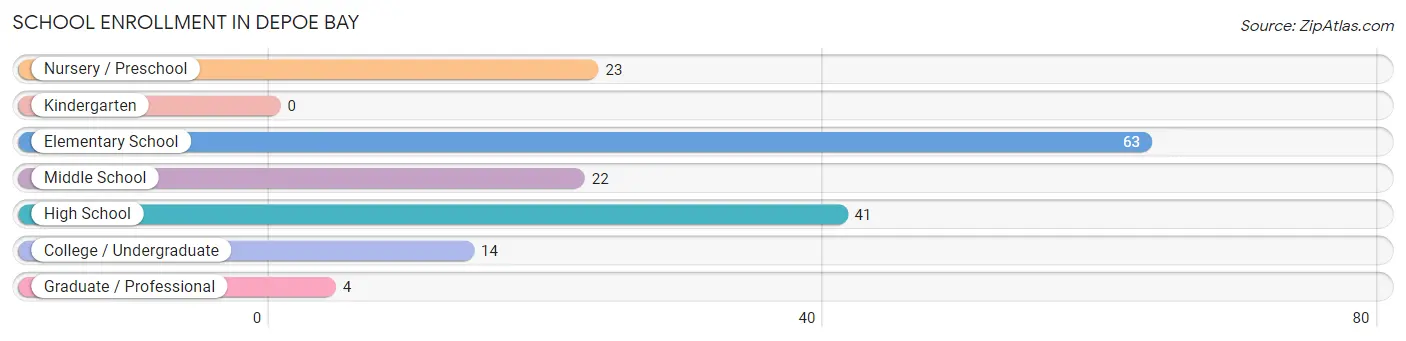
| School Level | # Students | % Students |
| Nursery / Preschool | 23 | 13.8% |
| Kindergarten | 0 | 0.0% |
| Elementary School | 63 | 37.7% |
| Middle School | 22 | 13.2% |
| High School | 41 | 24.5% |
| College / Undergraduate | 14 | 8.4% |
| Graduate / Professional | 4 | 2.4% |
| Total | 167 | 100.0% |
School Enrollment by Age by Funding Source in Depoe Bay
Out of a total of 167 students who are enrolled in schools in Depoe Bay, 16 (9.6%) attend a private institution, while the remaining 151 (90.4%) are enrolled in public schools. The age group of 20 to 24 year olds has the highest likelihood of being enrolled in private schools, with 7 (100.0% in the age bracket) enrolled. Conversely, the age group of 3 to 4 year olds has the lowest likelihood of being enrolled in a private school, with 23 (100.0% in the age bracket) attending a public institution.
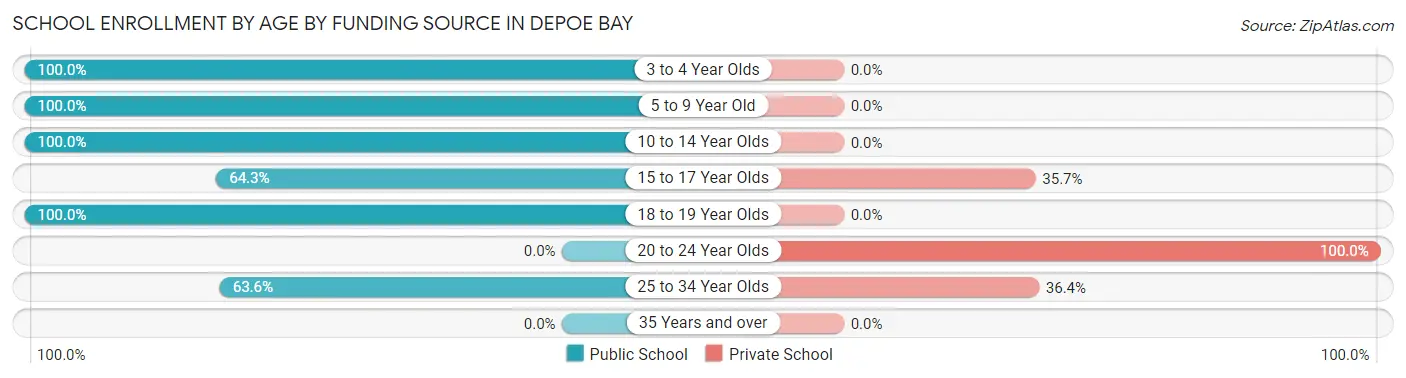
| Age Bracket | Public School | Private School |
| 3 to 4 Year Olds | 23 (100.0%) | 0 (0.0%) |
| 5 to 9 Year Old | 63 (100.0%) | 0 (0.0%) |
| 10 to 14 Year Olds | 22 (100.0%) | 0 (0.0%) |
| 15 to 17 Year Olds | 9 (64.3%) | 5 (35.7%) |
| 18 to 19 Year Olds | 27 (100.0%) | 0 (0.0%) |
| 20 to 24 Year Olds | 0 (0.0%) | 7 (100.0%) |
| 25 to 34 Year Olds | 7 (63.6%) | 4 (36.4%) |
| 35 Years and over | 0 (0.0%) | 0 (0.0%) |
| Total | 151 (90.4%) | 16 (9.6%) |
Educational Attainment by Field of Study in Depoe Bay
Psychology (147 | 20.8%), education (93 | 13.2%), bio, nature & agricultural (75 | 10.6%), science & technology (69 | 9.8%), and arts & humanities (61 | 8.6%) are the most common fields of study among 706 individuals in Depoe Bay who have obtained a bachelor's degree or higher.
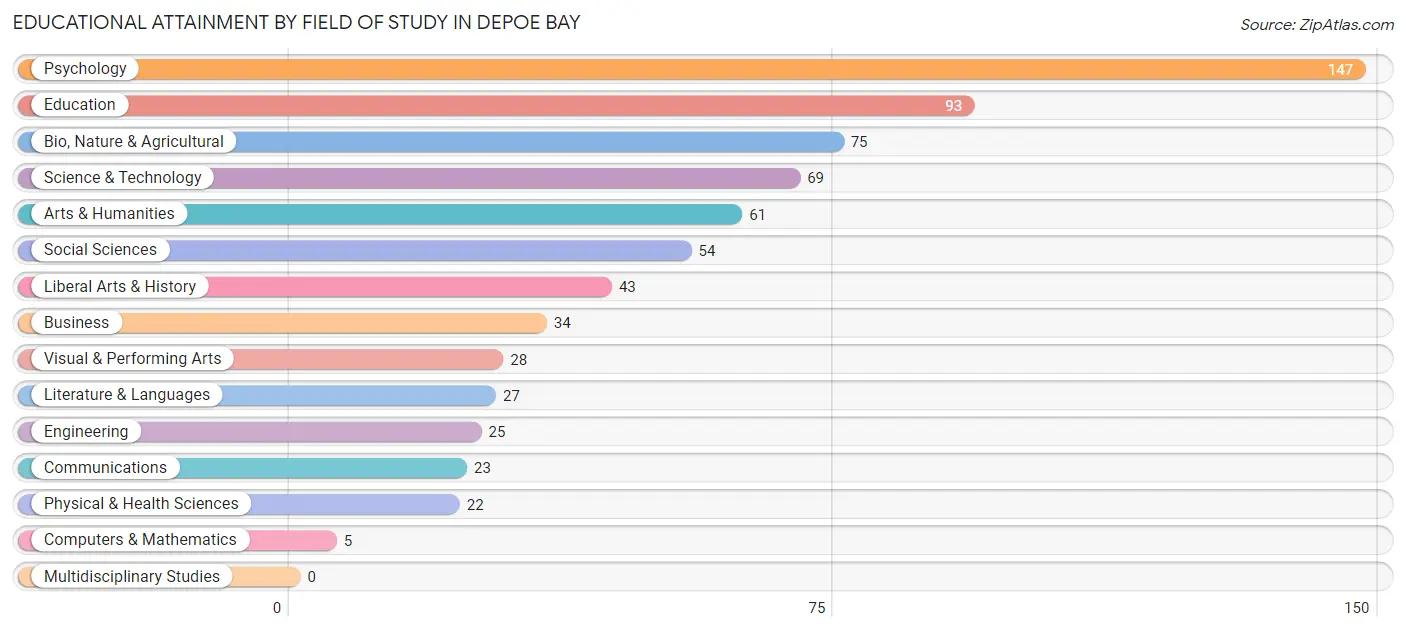
| Field of Study | # Graduates | % Graduates |
| Computers & Mathematics | 5 | 0.7% |
| Bio, Nature & Agricultural | 75 | 10.6% |
| Physical & Health Sciences | 22 | 3.1% |
| Psychology | 147 | 20.8% |
| Social Sciences | 54 | 7.6% |
| Engineering | 25 | 3.5% |
| Multidisciplinary Studies | 0 | 0.0% |
| Science & Technology | 69 | 9.8% |
| Business | 34 | 4.8% |
| Education | 93 | 13.2% |
| Literature & Languages | 27 | 3.8% |
| Liberal Arts & History | 43 | 6.1% |
| Visual & Performing Arts | 28 | 4.0% |
| Communications | 23 | 3.3% |
| Arts & Humanities | 61 | 8.6% |
| Total | 706 | 100.0% |
Transportation & Commute in Depoe Bay
Vehicle Availability by Sex in Depoe Bay
The most prevalent vehicle ownership categories in Depoe Bay are males with 2 vehicles (221, accounting for 54.2%) and females with 2 vehicles (179, making up 45.5%).
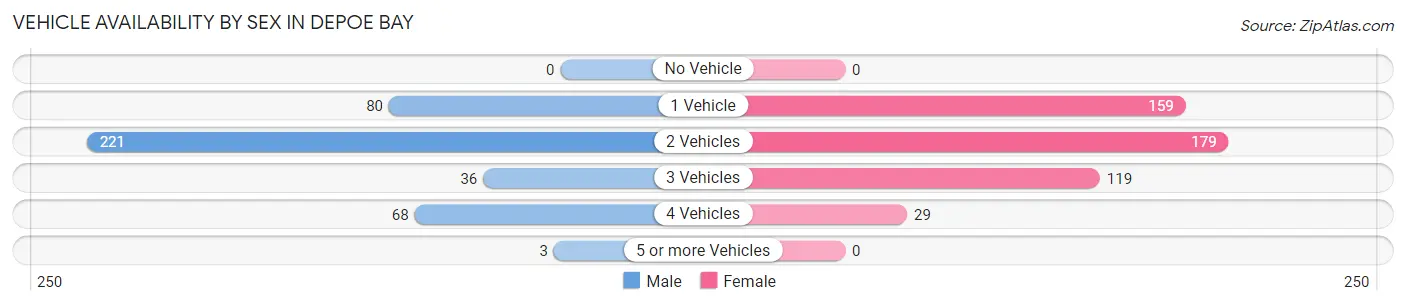
| Vehicles Available | Male | Female |
| No Vehicle | 0 (0.0%) | 0 (0.0%) |
| 1 Vehicle | 80 (19.6%) | 159 (32.7%) |
| 2 Vehicles | 221 (54.2%) | 179 (36.8%) |
| 3 Vehicles | 36 (8.8%) | 119 (24.5%) |
| 4 Vehicles | 68 (16.7%) | 29 (6.0%) |
| 5 or more Vehicles | 3 (0.7%) | 0 (0.0%) |
| Total | 408 (100.0%) | 486 (100.0%) |
Commute Time in Depoe Bay
The most frequently occuring commute durations in Depoe Bay are 20 to 24 minutes (277 commuters, 34.7%), less than 5 minutes (110 commuters, 13.8%), and 25 to 29 minutes (109 commuters, 13.7%).
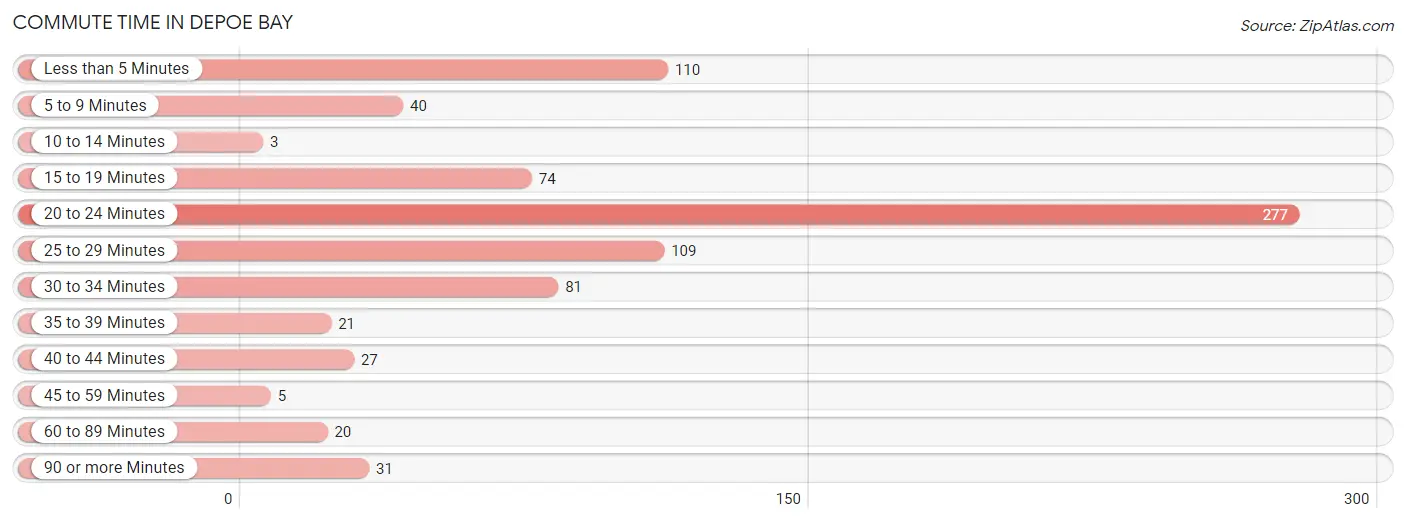
| Commute Time | # Commuters | % Commuters |
| Less than 5 Minutes | 110 | 13.8% |
| 5 to 9 Minutes | 40 | 5.0% |
| 10 to 14 Minutes | 3 | 0.4% |
| 15 to 19 Minutes | 74 | 9.3% |
| 20 to 24 Minutes | 277 | 34.7% |
| 25 to 29 Minutes | 109 | 13.7% |
| 30 to 34 Minutes | 81 | 10.2% |
| 35 to 39 Minutes | 21 | 2.6% |
| 40 to 44 Minutes | 27 | 3.4% |
| 45 to 59 Minutes | 5 | 0.6% |
| 60 to 89 Minutes | 20 | 2.5% |
| 90 or more Minutes | 31 | 3.9% |
Commute Time by Sex in Depoe Bay
The most common commute times in Depoe Bay are 20 to 24 minutes (100 commuters, 25.5%) for males and 20 to 24 minutes (177 commuters, 43.7%) for females.

| Commute Time | Male | Female |
| Less than 5 Minutes | 72 (18.3%) | 38 (9.4%) |
| 5 to 9 Minutes | 17 (4.3%) | 23 (5.7%) |
| 10 to 14 Minutes | 3 (0.8%) | 0 (0.0%) |
| 15 to 19 Minutes | 56 (14.2%) | 18 (4.4%) |
| 20 to 24 Minutes | 100 (25.5%) | 177 (43.7%) |
| 25 to 29 Minutes | 70 (17.8%) | 39 (9.6%) |
| 30 to 34 Minutes | 50 (12.7%) | 31 (7.6%) |
| 35 to 39 Minutes | 21 (5.3%) | 0 (0.0%) |
| 40 to 44 Minutes | 4 (1.0%) | 23 (5.7%) |
| 45 to 59 Minutes | 0 (0.0%) | 5 (1.2%) |
| 60 to 89 Minutes | 0 (0.0%) | 20 (4.9%) |
| 90 or more Minutes | 0 (0.0%) | 31 (7.6%) |
Time of Departure to Work by Sex in Depoe Bay
The most frequent times of departure to work in Depoe Bay are 6:30 AM to 6:59 AM (66, 16.8%) for males and 7:30 AM to 7:59 AM (130, 32.1%) for females.
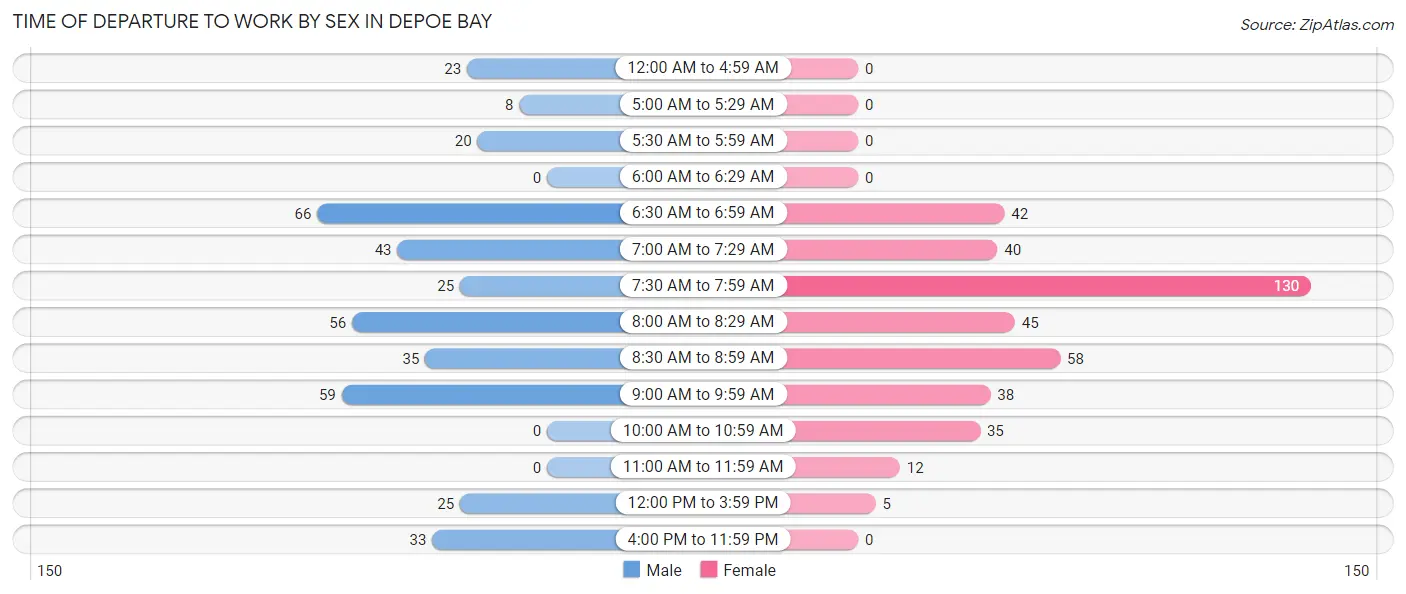
| Time of Departure | Male | Female |
| 12:00 AM to 4:59 AM | 23 (5.9%) | 0 (0.0%) |
| 5:00 AM to 5:29 AM | 8 (2.0%) | 0 (0.0%) |
| 5:30 AM to 5:59 AM | 20 (5.1%) | 0 (0.0%) |
| 6:00 AM to 6:29 AM | 0 (0.0%) | 0 (0.0%) |
| 6:30 AM to 6:59 AM | 66 (16.8%) | 42 (10.4%) |
| 7:00 AM to 7:29 AM | 43 (10.9%) | 40 (9.9%) |
| 7:30 AM to 7:59 AM | 25 (6.4%) | 130 (32.1%) |
| 8:00 AM to 8:29 AM | 56 (14.2%) | 45 (11.1%) |
| 8:30 AM to 8:59 AM | 35 (8.9%) | 58 (14.3%) |
| 9:00 AM to 9:59 AM | 59 (15.0%) | 38 (9.4%) |
| 10:00 AM to 10:59 AM | 0 (0.0%) | 35 (8.6%) |
| 11:00 AM to 11:59 AM | 0 (0.0%) | 12 (3.0%) |
| 12:00 PM to 3:59 PM | 25 (6.4%) | 5 (1.2%) |
| 4:00 PM to 11:59 PM | 33 (8.4%) | 0 (0.0%) |
| Total | 393 (100.0%) | 405 (100.0%) |
Housing Occupancy in Depoe Bay
Occupancy by Ownership in Depoe Bay
Of the total 1,024 dwellings in Depoe Bay, owner-occupied units account for 739 (72.2%), while renter-occupied units make up 285 (27.8%).
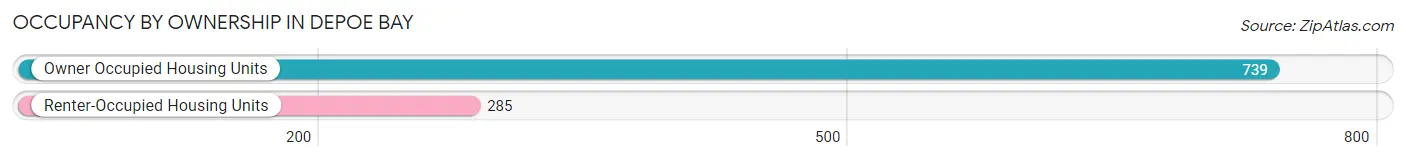
| Occupancy | # Housing Units | % Housing Units |
| Owner Occupied Housing Units | 739 | 72.2% |
| Renter-Occupied Housing Units | 285 | 27.8% |
| Total Occupied Housing Units | 1,024 | 100.0% |
Occupancy by Household Size in Depoe Bay
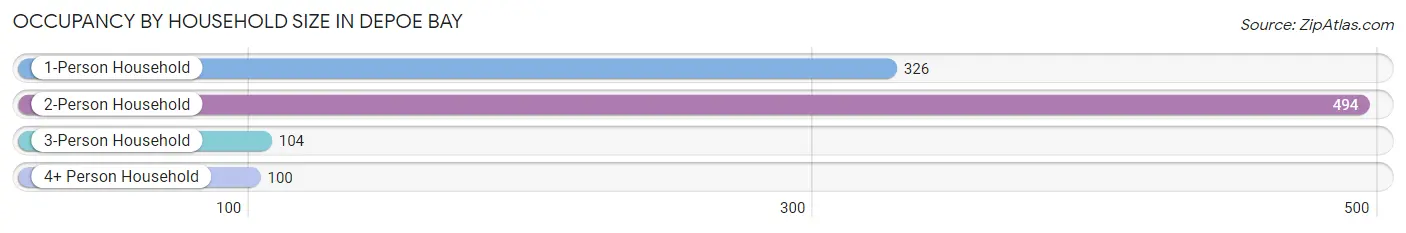
| Household Size | # Housing Units | % Housing Units |
| 1-Person Household | 326 | 31.8% |
| 2-Person Household | 494 | 48.2% |
| 3-Person Household | 104 | 10.2% |
| 4+ Person Household | 100 | 9.8% |
| Total Housing Units | 1,024 | 100.0% |
Occupancy by Ownership by Household Size in Depoe Bay
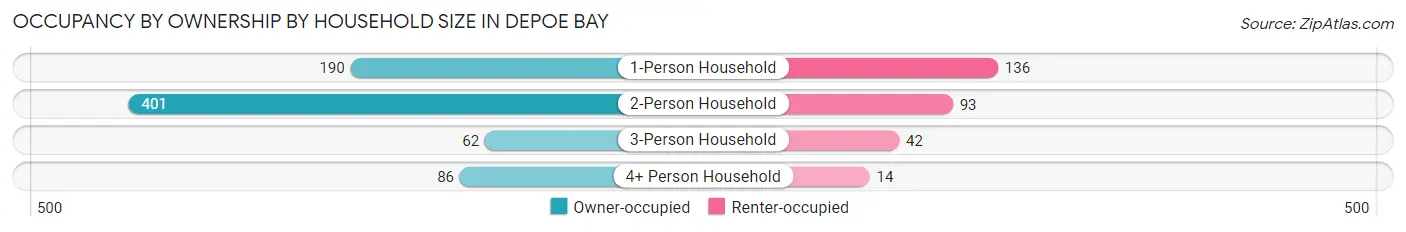
| Household Size | Owner-occupied | Renter-occupied |
| 1-Person Household | 190 (58.3%) | 136 (41.7%) |
| 2-Person Household | 401 (81.2%) | 93 (18.8%) |
| 3-Person Household | 62 (59.6%) | 42 (40.4%) |
| 4+ Person Household | 86 (86.0%) | 14 (14.0%) |
| Total Housing Units | 739 (72.2%) | 285 (27.8%) |
Occupancy by Educational Attainment in Depoe Bay
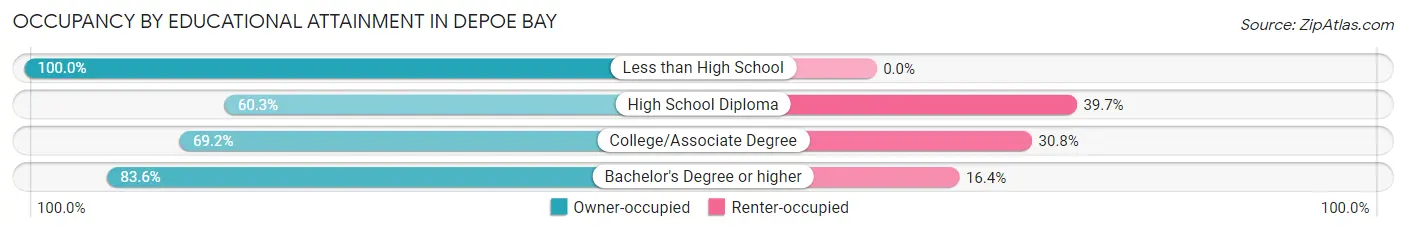
| Household Size | Owner-occupied | Renter-occupied |
| Less than High School | 3 (100.0%) | 0 (0.0%) |
| High School Diploma | 126 (60.3%) | 83 (39.7%) |
| College/Associate Degree | 330 (69.2%) | 147 (30.8%) |
| Bachelor's Degree or higher | 280 (83.6%) | 55 (16.4%) |
Occupancy by Age of Householder in Depoe Bay
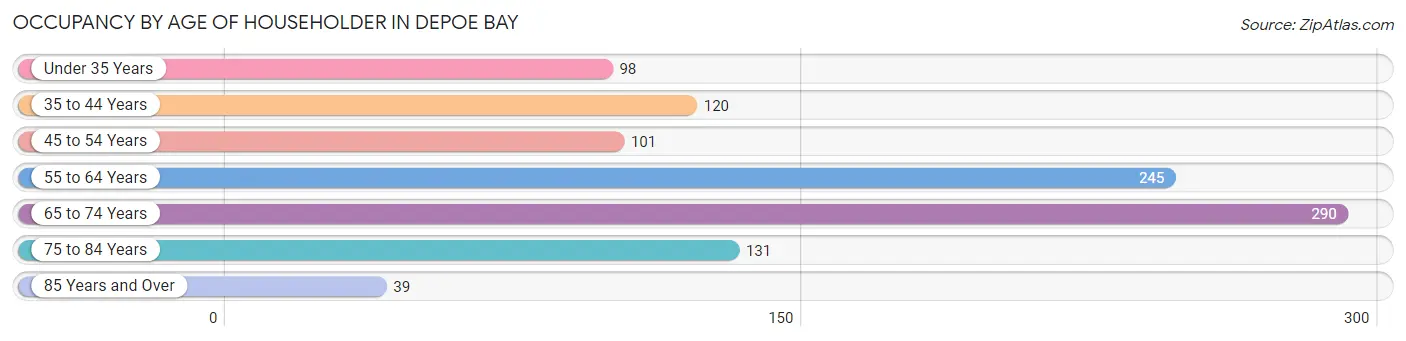
| Age Bracket | # Households | % Households |
| Under 35 Years | 98 | 9.6% |
| 35 to 44 Years | 120 | 11.7% |
| 45 to 54 Years | 101 | 9.9% |
| 55 to 64 Years | 245 | 23.9% |
| 65 to 74 Years | 290 | 28.3% |
| 75 to 84 Years | 131 | 12.8% |
| 85 Years and Over | 39 | 3.8% |
| Total | 1,024 | 100.0% |
Housing Finances in Depoe Bay
Median Income by Occupancy in Depoe Bay
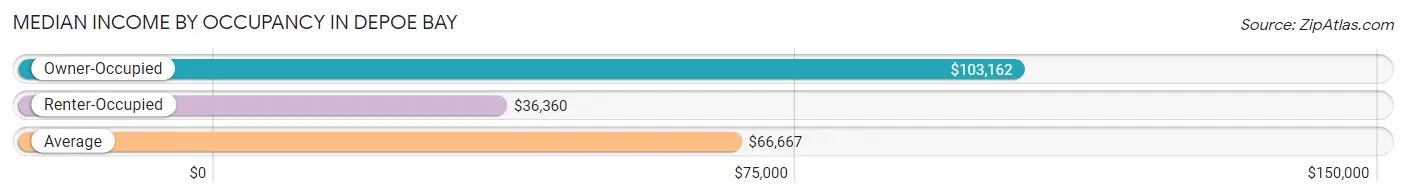
| Occupancy Type | # Households | Median Income |
| Owner-Occupied | 739 (72.2%) | $103,162 |
| Renter-Occupied | 285 (27.8%) | $36,360 |
| Average | 1,024 (100.0%) | $66,667 |
Occupancy by Householder Income Bracket in Depoe Bay
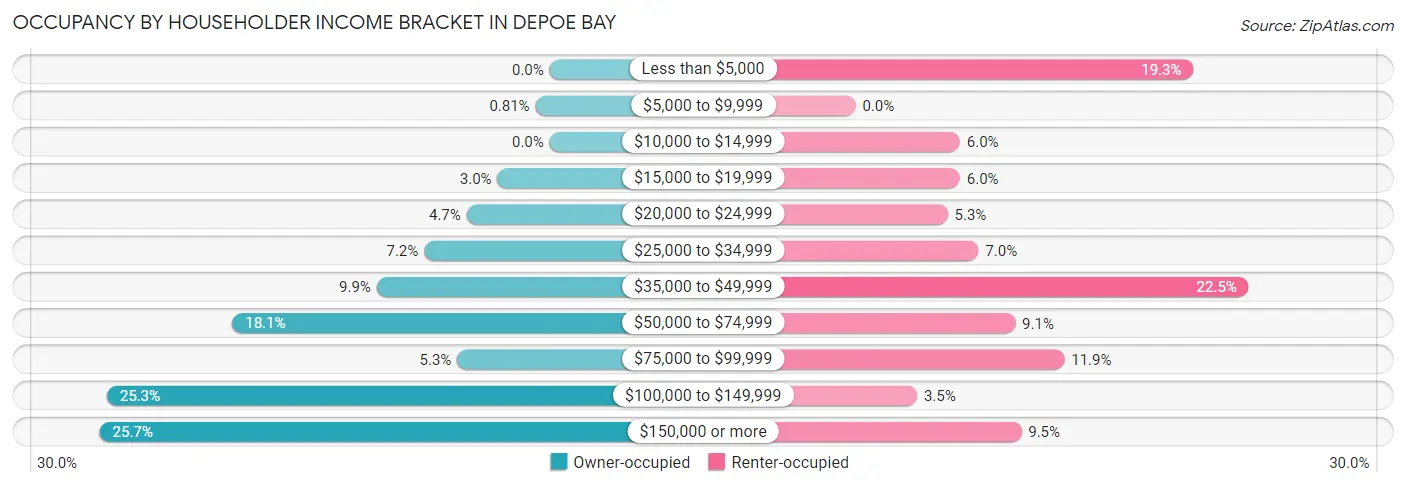
| Income Bracket | Owner-occupied | Renter-occupied |
| Less than $5,000 | 0 (0.0%) | 55 (19.3%) |
| $5,000 to $9,999 | 6 (0.8%) | 0 (0.0%) |
| $10,000 to $14,999 | 0 (0.0%) | 17 (6.0%) |
| $15,000 to $19,999 | 22 (3.0%) | 17 (6.0%) |
| $20,000 to $24,999 | 35 (4.7%) | 15 (5.3%) |
| $25,000 to $34,999 | 53 (7.2%) | 20 (7.0%) |
| $35,000 to $49,999 | 73 (9.9%) | 64 (22.5%) |
| $50,000 to $74,999 | 134 (18.1%) | 26 (9.1%) |
| $75,000 to $99,999 | 39 (5.3%) | 34 (11.9%) |
| $100,000 to $149,999 | 187 (25.3%) | 10 (3.5%) |
| $150,000 or more | 190 (25.7%) | 27 (9.5%) |
| Total | 739 (100.0%) | 285 (100.0%) |
Monthly Housing Cost Tiers in Depoe Bay
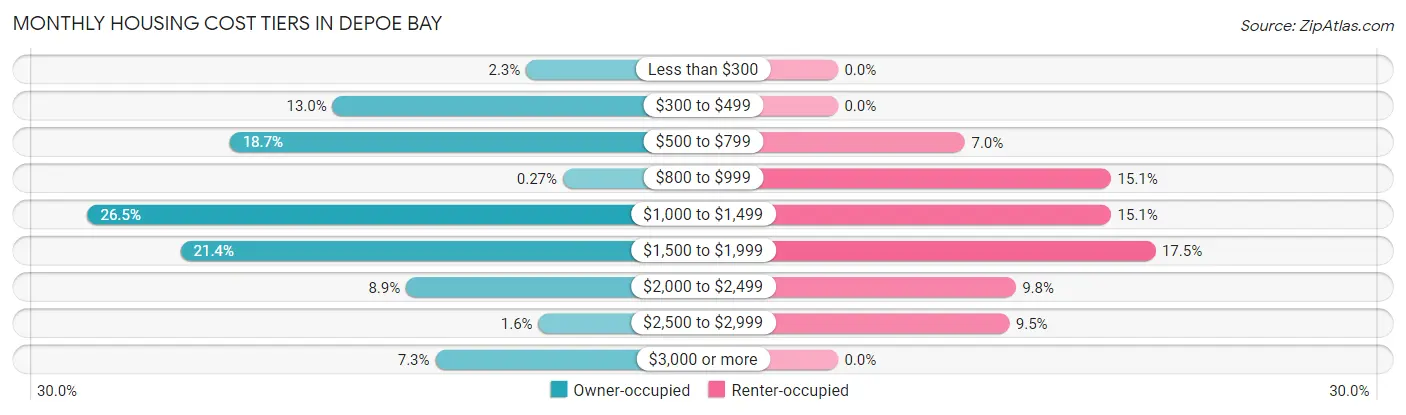
| Monthly Cost | Owner-occupied | Renter-occupied |
| Less than $300 | 17 (2.3%) | 0 (0.0%) |
| $300 to $499 | 96 (13.0%) | 0 (0.0%) |
| $500 to $799 | 138 (18.7%) | 20 (7.0%) |
| $800 to $999 | 2 (0.3%) | 43 (15.1%) |
| $1,000 to $1,499 | 196 (26.5%) | 43 (15.1%) |
| $1,500 to $1,999 | 158 (21.4%) | 50 (17.5%) |
| $2,000 to $2,499 | 66 (8.9%) | 28 (9.8%) |
| $2,500 to $2,999 | 12 (1.6%) | 27 (9.5%) |
| $3,000 or more | 54 (7.3%) | 0 (0.0%) |
| Total | 739 (100.0%) | 285 (100.0%) |
Physical Housing Characteristics in Depoe Bay
Housing Structures in Depoe Bay
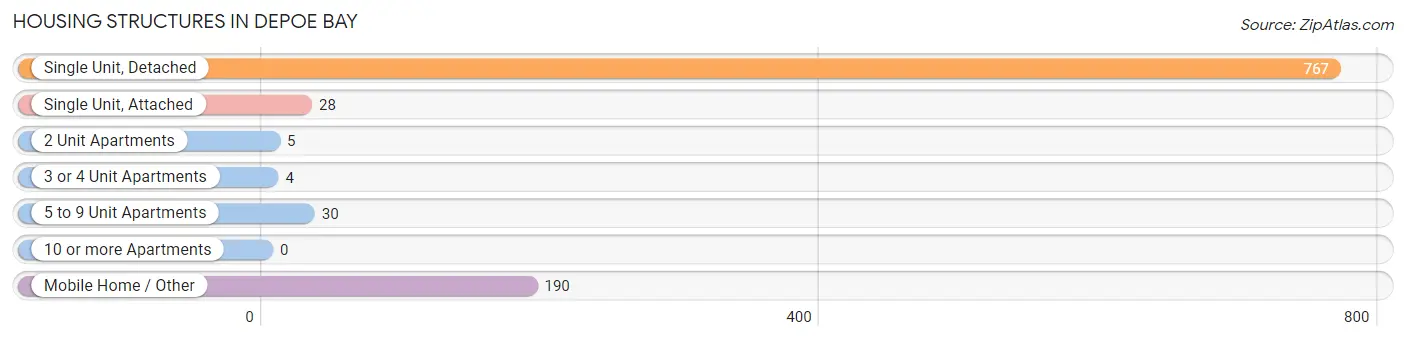
| Structure Type | # Housing Units | % Housing Units |
| Single Unit, Detached | 767 | 74.9% |
| Single Unit, Attached | 28 | 2.7% |
| 2 Unit Apartments | 5 | 0.5% |
| 3 or 4 Unit Apartments | 4 | 0.4% |
| 5 to 9 Unit Apartments | 30 | 2.9% |
| 10 or more Apartments | 0 | 0.0% |
| Mobile Home / Other | 190 | 18.5% |
| Total | 1,024 | 100.0% |
Housing Structures by Occupancy in Depoe Bay
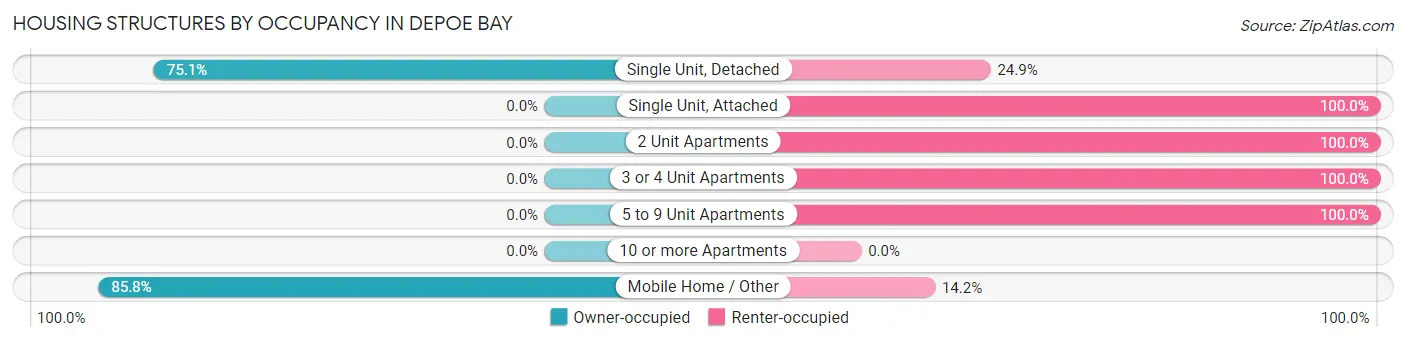
| Structure Type | Owner-occupied | Renter-occupied |
| Single Unit, Detached | 576 (75.1%) | 191 (24.9%) |
| Single Unit, Attached | 0 (0.0%) | 28 (100.0%) |
| 2 Unit Apartments | 0 (0.0%) | 5 (100.0%) |
| 3 or 4 Unit Apartments | 0 (0.0%) | 4 (100.0%) |
| 5 to 9 Unit Apartments | 0 (0.0%) | 30 (100.0%) |
| 10 or more Apartments | 0 (0.0%) | 0 (0.0%) |
| Mobile Home / Other | 163 (85.8%) | 27 (14.2%) |
| Total | 739 (72.2%) | 285 (27.8%) |
Housing Structures by Number of Rooms in Depoe Bay
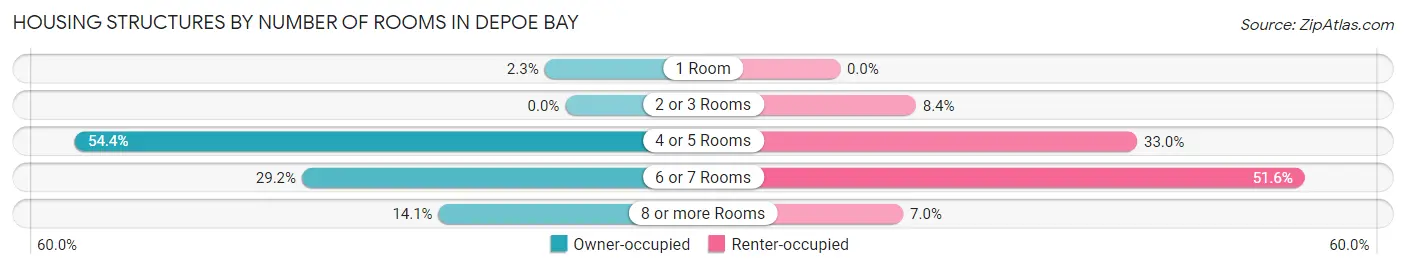
| Number of Rooms | Owner-occupied | Renter-occupied |
| 1 Room | 17 (2.3%) | 0 (0.0%) |
| 2 or 3 Rooms | 0 (0.0%) | 24 (8.4%) |
| 4 or 5 Rooms | 402 (54.4%) | 94 (33.0%) |
| 6 or 7 Rooms | 216 (29.2%) | 147 (51.6%) |
| 8 or more Rooms | 104 (14.1%) | 20 (7.0%) |
| Total | 739 (100.0%) | 285 (100.0%) |
Housing Structure by Heating Type in Depoe Bay
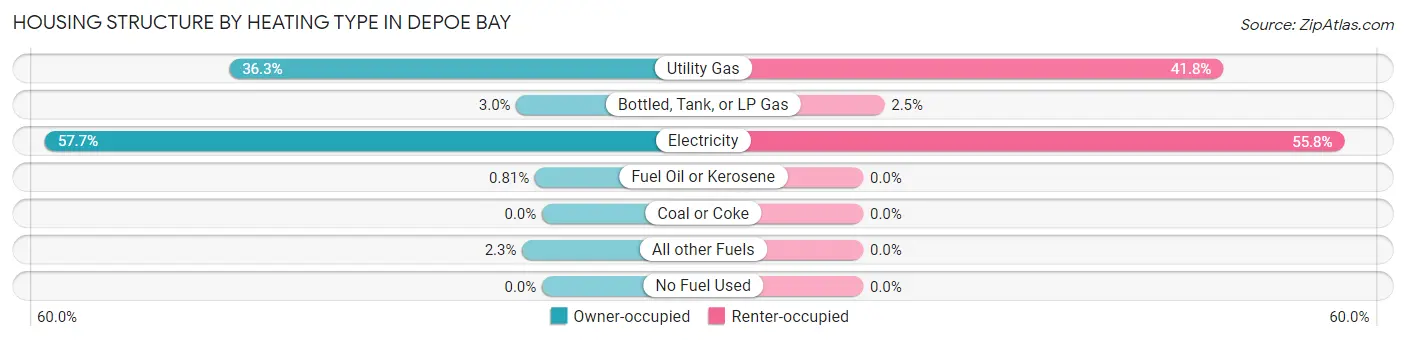
| Heating Type | Owner-occupied | Renter-occupied |
| Utility Gas | 268 (36.3%) | 119 (41.7%) |
| Bottled, Tank, or LP Gas | 22 (3.0%) | 7 (2.5%) |
| Electricity | 426 (57.7%) | 159 (55.8%) |
| Fuel Oil or Kerosene | 6 (0.8%) | 0 (0.0%) |
| Coal or Coke | 0 (0.0%) | 0 (0.0%) |
| All other Fuels | 17 (2.3%) | 0 (0.0%) |
| No Fuel Used | 0 (0.0%) | 0 (0.0%) |
| Total | 739 (100.0%) | 285 (100.0%) |
Household Vehicle Usage in Depoe Bay
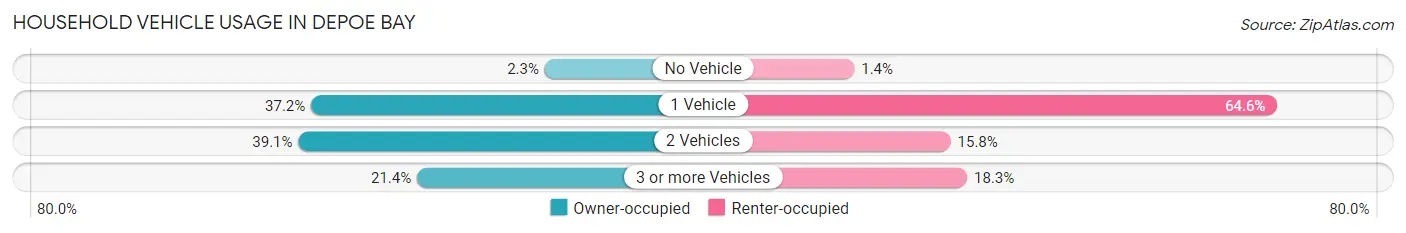
| Vehicles per Household | Owner-occupied | Renter-occupied |
| No Vehicle | 17 (2.3%) | 4 (1.4%) |
| 1 Vehicle | 275 (37.2%) | 184 (64.6%) |
| 2 Vehicles | 289 (39.1%) | 45 (15.8%) |
| 3 or more Vehicles | 158 (21.4%) | 52 (18.2%) |
| Total | 739 (100.0%) | 285 (100.0%) |
Real Estate & Mortgages in Depoe Bay
Real Estate and Mortgage Overview in Depoe Bay
| Characteristic | Without Mortgage | With Mortgage |
| Housing Units | 255 | 484 |
| Median Property Value | $390,700 | $325,800 |
| Median Household Income | $50,938 | $156 |
| Monthly Housing Costs | $520 | $54 |
| Real Estate Taxes | $2,696 | $0 |
Property Value by Mortgage Status in Depoe Bay

| Property Value | Without Mortgage | With Mortgage |
| Less than $50,000 | 17 (6.7%) | 4 (0.8%) |
| $50,000 to $99,999 | 0 (0.0%) | 0 (0.0%) |
| $100,000 to $299,999 | 57 (22.4%) | 197 (40.7%) |
| $300,000 to $499,999 | 141 (55.3%) | 195 (40.3%) |
| $500,000 to $749,999 | 14 (5.5%) | 54 (11.2%) |
| $750,000 to $999,999 | 6 (2.4%) | 19 (3.9%) |
| $1,000,000 or more | 20 (7.8%) | 15 (3.1%) |
| Total | 255 (100.0%) | 484 (100.0%) |
Household Income by Mortgage Status in Depoe Bay
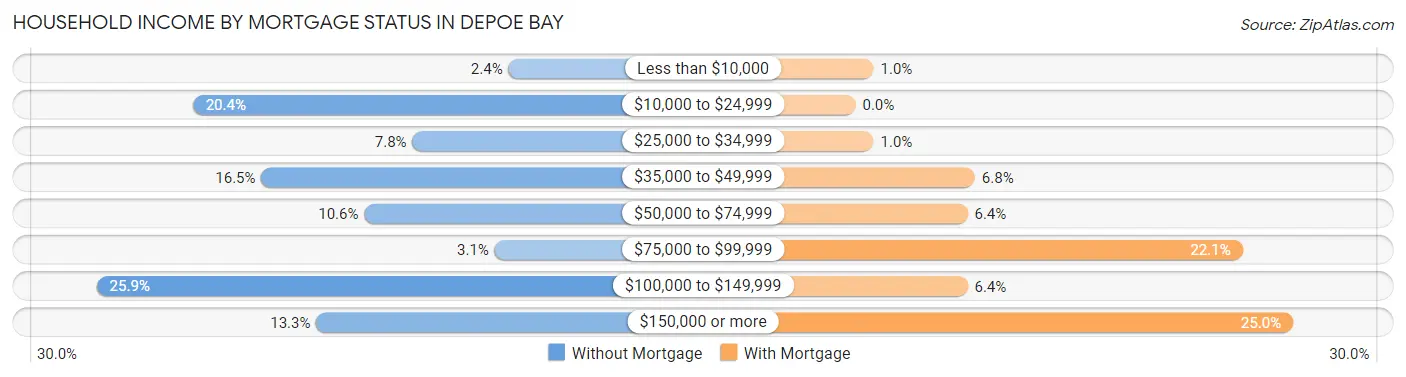
| Household Income | Without Mortgage | With Mortgage |
| Less than $10,000 | 6 (2.4%) | 5 (1.0%) |
| $10,000 to $24,999 | 52 (20.4%) | 0 (0.0%) |
| $25,000 to $34,999 | 20 (7.8%) | 5 (1.0%) |
| $35,000 to $49,999 | 42 (16.5%) | 33 (6.8%) |
| $50,000 to $74,999 | 27 (10.6%) | 31 (6.4%) |
| $75,000 to $99,999 | 8 (3.1%) | 107 (22.1%) |
| $100,000 to $149,999 | 66 (25.9%) | 31 (6.4%) |
| $150,000 or more | 34 (13.3%) | 121 (25.0%) |
| Total | 255 (100.0%) | 484 (100.0%) |
Property Value to Household Income Ratio in Depoe Bay
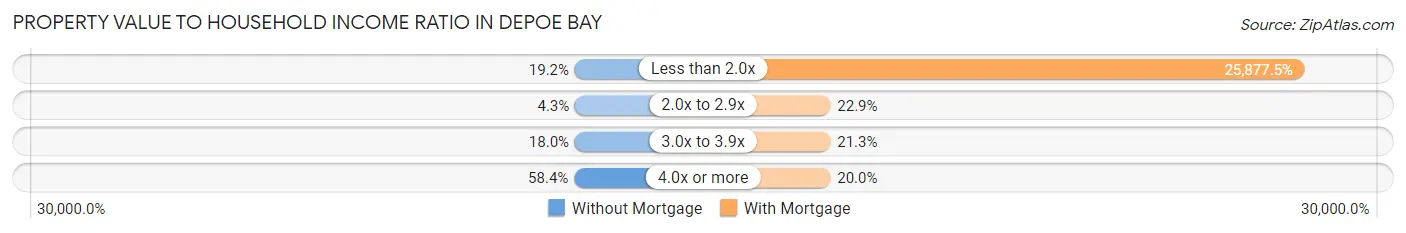
| Value-to-Income Ratio | Without Mortgage | With Mortgage |
| Less than 2.0x | 49 (19.2%) | 125,247 (25,877.5%) |
| 2.0x to 2.9x | 11 (4.3%) | 111 (22.9%) |
| 3.0x to 3.9x | 46 (18.0%) | 103 (21.3%) |
| 4.0x or more | 149 (58.4%) | 97 (20.0%) |
| Total | 255 (100.0%) | 484 (100.0%) |
Real Estate Taxes by Mortgage Status in Depoe Bay
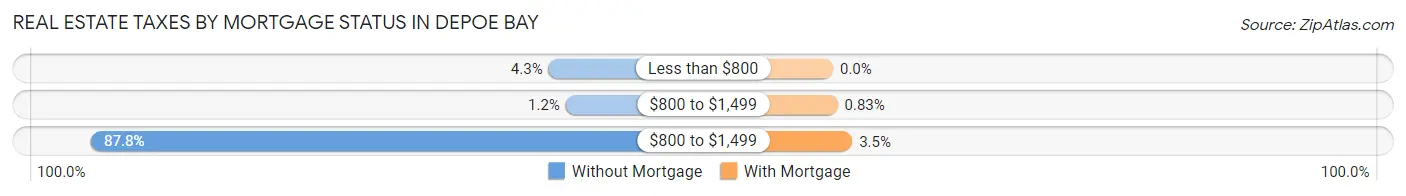
| Property Taxes | Without Mortgage | With Mortgage |
| Less than $800 | 11 (4.3%) | 0 (0.0%) |
| $800 to $1,499 | 3 (1.2%) | 4 (0.8%) |
| $800 to $1,499 | 224 (87.8%) | 17 (3.5%) |
| Total | 255 (100.0%) | 484 (100.0%) |
Health & Disability in Depoe Bay
Health Insurance Coverage by Age in Depoe Bay
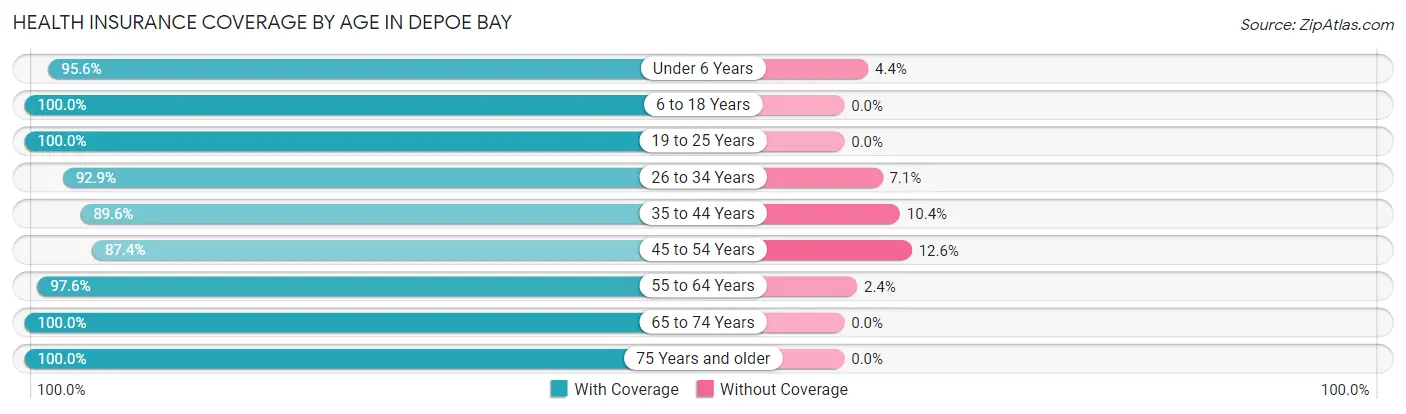
| Age Bracket | With Coverage | Without Coverage |
| Under 6 Years | 86 (95.6%) | 4 (4.4%) |
| 6 to 18 Years | 134 (100.0%) | 0 (0.0%) |
| 19 to 25 Years | 78 (100.0%) | 0 (0.0%) |
| 26 to 34 Years | 209 (92.9%) | 16 (7.1%) |
| 35 to 44 Years | 242 (89.6%) | 28 (10.4%) |
| 45 to 54 Years | 146 (87.4%) | 21 (12.6%) |
| 55 to 64 Years | 451 (97.6%) | 11 (2.4%) |
| 65 to 74 Years | 429 (100.0%) | 0 (0.0%) |
| 75 Years and older | 211 (100.0%) | 0 (0.0%) |
| Total | 1,986 (96.1%) | 80 (3.9%) |
Health Insurance Coverage by Citizenship Status in Depoe Bay
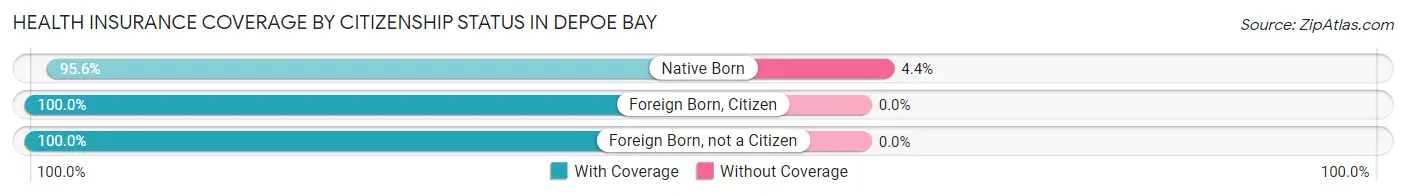
| Citizenship Status | With Coverage | Without Coverage |
| Native Born | 86 (95.6%) | 4 (4.4%) |
| Foreign Born, Citizen | 134 (100.0%) | 0 (0.0%) |
| Foreign Born, not a Citizen | 78 (100.0%) | 0 (0.0%) |
Health Insurance Coverage by Household Income in Depoe Bay
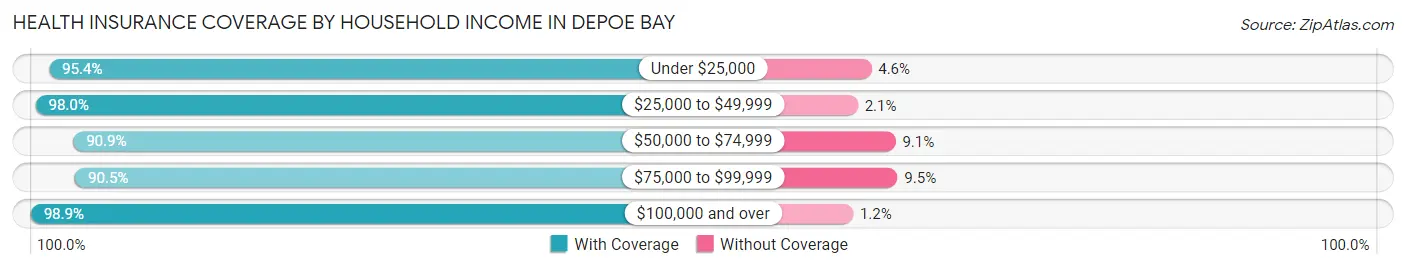
| Household Income | With Coverage | Without Coverage |
| Under $25,000 | 187 (95.4%) | 9 (4.6%) |
| $25,000 to $49,999 | 334 (98.0%) | 7 (2.1%) |
| $50,000 to $74,999 | 309 (90.9%) | 31 (9.1%) |
| $75,000 to $99,999 | 210 (90.5%) | 22 (9.5%) |
| $100,000 and over | 946 (98.9%) | 11 (1.1%) |
Public vs Private Health Insurance Coverage by Age in Depoe Bay
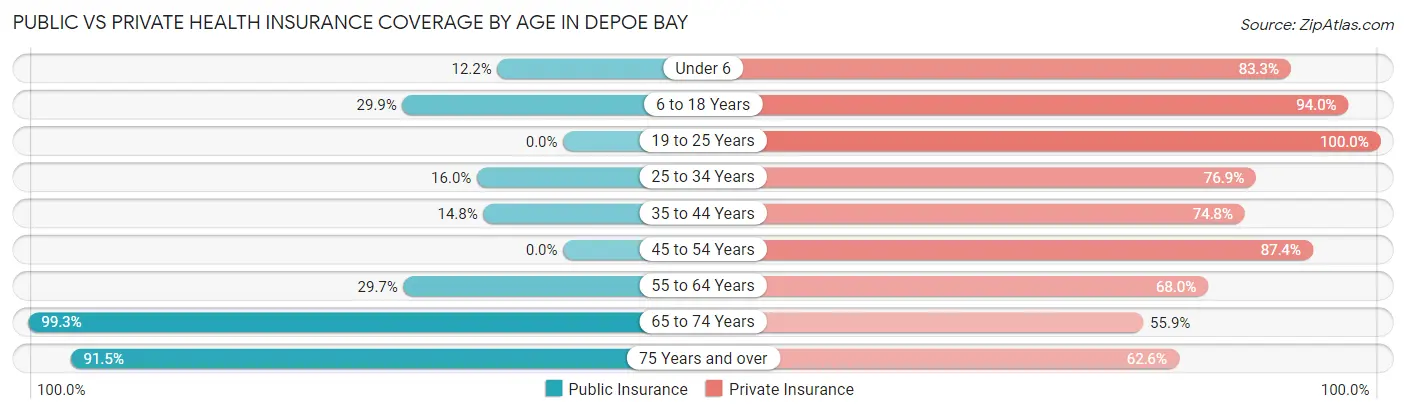
| Age Bracket | Public Insurance | Private Insurance |
| Under 6 | 11 (12.2%) | 75 (83.3%) |
| 6 to 18 Years | 40 (29.8%) | 126 (94.0%) |
| 19 to 25 Years | 0 (0.0%) | 78 (100.0%) |
| 25 to 34 Years | 36 (16.0%) | 173 (76.9%) |
| 35 to 44 Years | 40 (14.8%) | 202 (74.8%) |
| 45 to 54 Years | 0 (0.0%) | 146 (87.4%) |
| 55 to 64 Years | 137 (29.6%) | 314 (68.0%) |
| 65 to 74 Years | 426 (99.3%) | 240 (55.9%) |
| 75 Years and over | 193 (91.5%) | 132 (62.6%) |
| Total | 883 (42.7%) | 1,486 (71.9%) |
Disability Status by Sex by Age in Depoe Bay
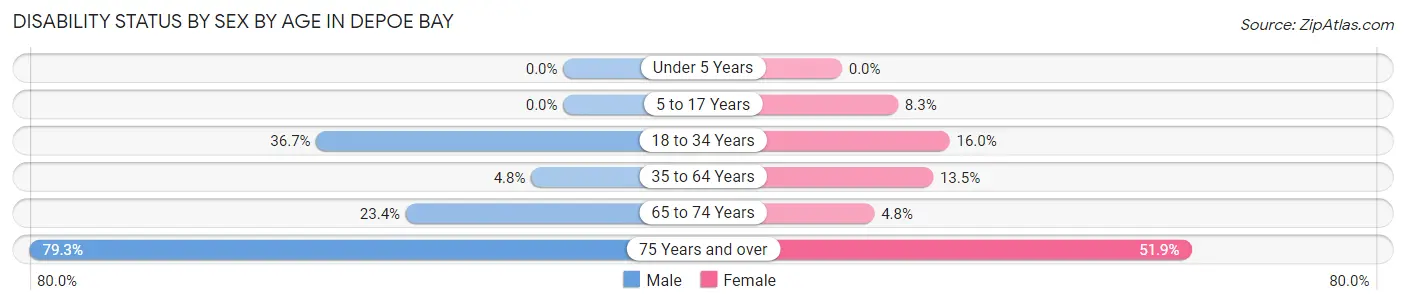
| Age Bracket | Male | Female |
| Under 5 Years | 0 (0.0%) | 0 (0.0%) |
| 5 to 17 Years | 0 (0.0%) | 5 (8.3%) |
| 18 to 34 Years | 66 (36.7%) | 24 (16.0%) |
| 35 to 64 Years | 21 (4.8%) | 62 (13.5%) |
| 65 to 74 Years | 47 (23.4%) | 11 (4.8%) |
| 75 Years and over | 42 (79.2%) | 82 (51.9%) |
Disability Class by Sex by Age in Depoe Bay
Disability Class: Hearing Difficulty
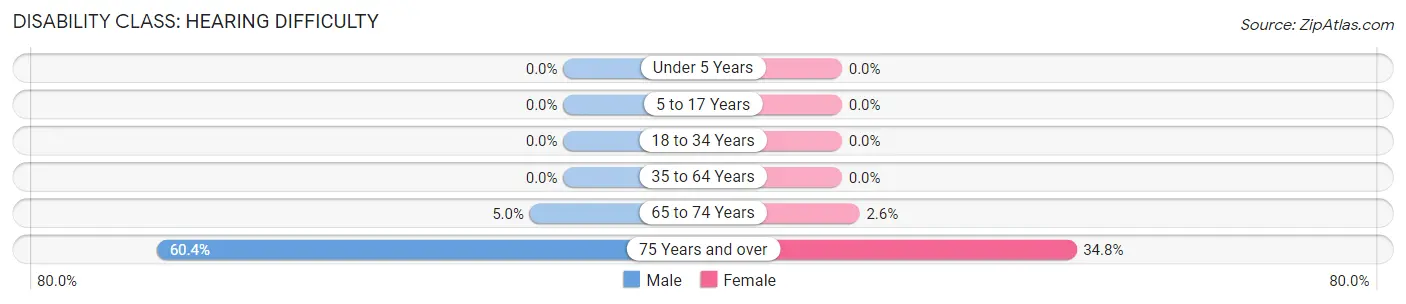
| Age Bracket | Male | Female |
| Under 5 Years | 0 (0.0%) | 0 (0.0%) |
| 5 to 17 Years | 0 (0.0%) | 0 (0.0%) |
| 18 to 34 Years | 0 (0.0%) | 0 (0.0%) |
| 35 to 64 Years | 0 (0.0%) | 0 (0.0%) |
| 65 to 74 Years | 10 (5.0%) | 6 (2.6%) |
| 75 Years and over | 32 (60.4%) | 55 (34.8%) |
Disability Class: Vision Difficulty
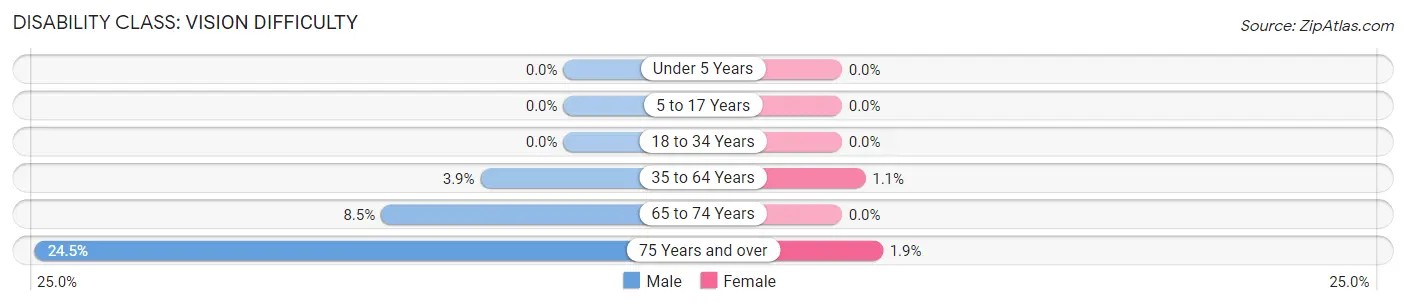
| Age Bracket | Male | Female |
| Under 5 Years | 0 (0.0%) | 0 (0.0%) |
| 5 to 17 Years | 0 (0.0%) | 0 (0.0%) |
| 18 to 34 Years | 0 (0.0%) | 0 (0.0%) |
| 35 to 64 Years | 17 (3.8%) | 5 (1.1%) |
| 65 to 74 Years | 17 (8.5%) | 0 (0.0%) |
| 75 Years and over | 13 (24.5%) | 3 (1.9%) |
Disability Class: Cognitive Difficulty
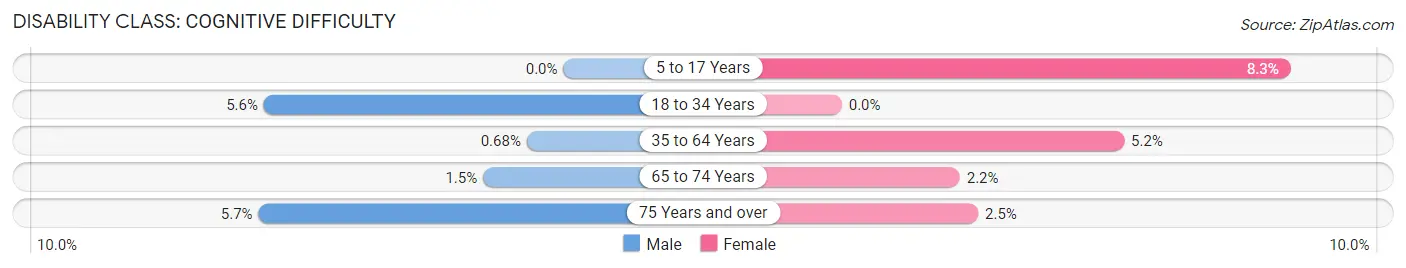
| Age Bracket | Male | Female |
| 5 to 17 Years | 0 (0.0%) | 5 (8.3%) |
| 18 to 34 Years | 10 (5.6%) | 0 (0.0%) |
| 35 to 64 Years | 3 (0.7%) | 24 (5.2%) |
| 65 to 74 Years | 3 (1.5%) | 5 (2.2%) |
| 75 Years and over | 3 (5.7%) | 4 (2.5%) |
Disability Class: Ambulatory Difficulty
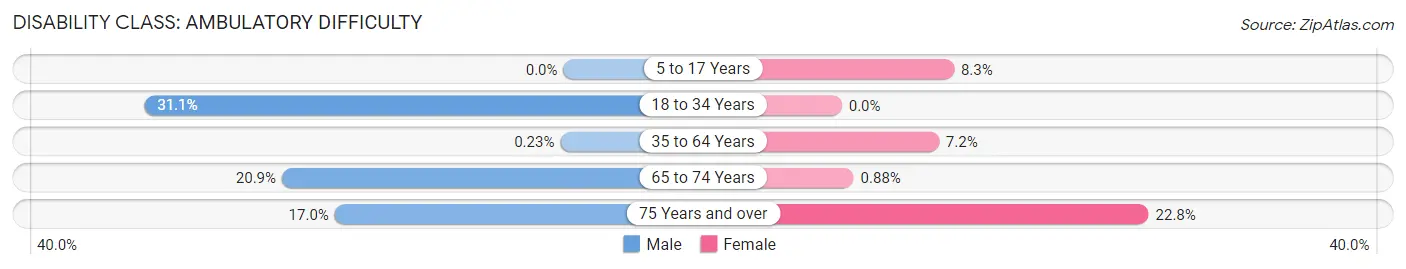
| Age Bracket | Male | Female |
| 5 to 17 Years | 0 (0.0%) | 5 (8.3%) |
| 18 to 34 Years | 56 (31.1%) | 0 (0.0%) |
| 35 to 64 Years | 1 (0.2%) | 33 (7.2%) |
| 65 to 74 Years | 42 (20.9%) | 2 (0.9%) |
| 75 Years and over | 9 (17.0%) | 36 (22.8%) |
Disability Class: Self-Care Difficulty
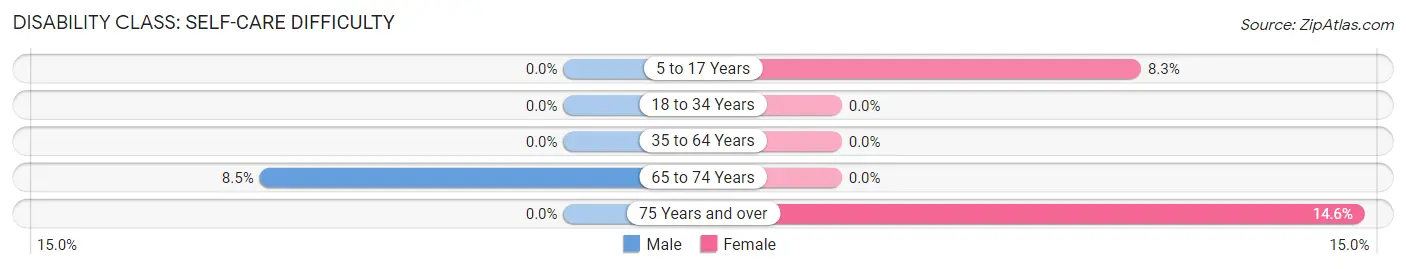
| Age Bracket | Male | Female |
| 5 to 17 Years | 0 (0.0%) | 5 (8.3%) |
| 18 to 34 Years | 0 (0.0%) | 0 (0.0%) |
| 35 to 64 Years | 0 (0.0%) | 0 (0.0%) |
| 65 to 74 Years | 17 (8.5%) | 0 (0.0%) |
| 75 Years and over | 0 (0.0%) | 23 (14.6%) |
Technology Access in Depoe Bay
Computing Device Access in Depoe Bay
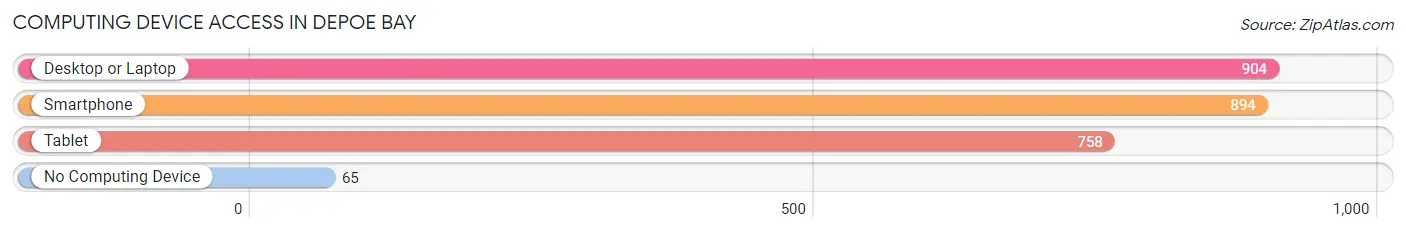
| Device Type | # Households | % Households |
| Desktop or Laptop | 904 | 88.3% |
| Smartphone | 894 | 87.3% |
| Tablet | 758 | 74.0% |
| No Computing Device | 65 | 6.4% |
| Total | 1,024 | 100.0% |
Internet Access in Depoe Bay
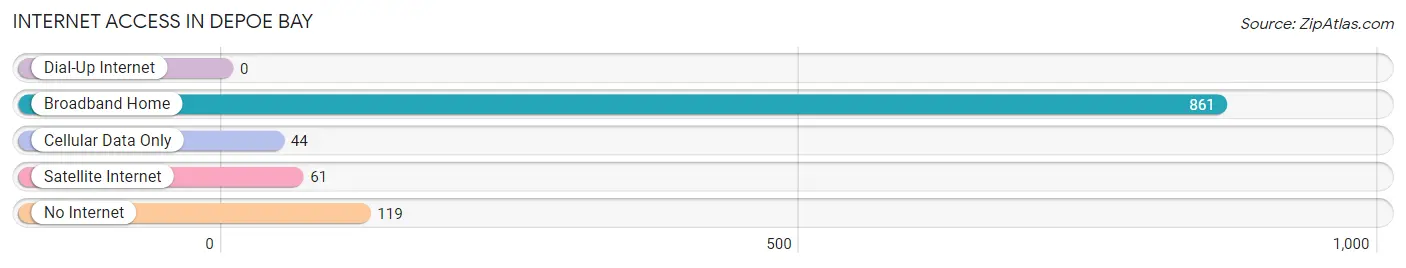
| Internet Type | # Households | % Households |
| Dial-Up Internet | 0 | 0.0% |
| Broadband Home | 861 | 84.1% |
| Cellular Data Only | 44 | 4.3% |
| Satellite Internet | 61 | 6.0% |
| No Internet | 119 | 11.6% |
| Total | 1,024 | 100.0% |
Depoe Bay Summary
Depoe Bay, Oregon is a small coastal city located in Lincoln County, Oregon. It is situated on the central Oregon Coast, approximately halfway between Newport and Lincoln City. The city is known for its picturesque harbor, which is the world’s smallest navigable harbor. The city is also known for its whale watching, fishing, and other recreational activities.
History
Depoe Bay was first settled in the late 1800s by a group of fishermen from the nearby Siletz Indian Reservation. The town was originally named “Depot Bay” after the nearby depot of the Oregon Coast Railroad. The name was later changed to “Depoe Bay” in honor of Chief George Depoe, a leader of the Siletz tribe.
In the early 1900s, the town began to grow as a fishing and canning center. The first cannery was built in 1906, and the town soon became a major producer of canned salmon. The cannery was destroyed by a fire in 1915, but was quickly rebuilt.
In the 1920s, the town began to attract tourists, and the first hotel was built in 1924. The town was incorporated in 1945, and the population has grown steadily since then.
Geography
Depoe Bay is located on the central Oregon Coast, approximately halfway between Newport and Lincoln City. The city is situated on a small bay, which is the world’s smallest navigable harbor. The bay is surrounded by rocky cliffs and is home to a variety of sea life, including whales, seals, and sea lions.
The city is located in a temperate rainforest climate, with mild temperatures year-round. The average high temperature in the summer is around 70 degrees Fahrenheit, and the average low temperature in the winter is around 40 degrees Fahrenheit.
Economy
The economy of Depoe Bay is largely based on tourism and fishing. The city is a popular destination for whale watching, fishing, and other recreational activities. The city also has a number of restaurants, hotels, and other businesses catering to tourists.
The city is also home to a number of commercial fishing operations, which provide a significant portion of the city’s income. The city is also home to a number of seafood processing plants, which process and package seafood for sale in local markets.
Demographics
As of the 2010 census, the population of Depoe Bay was 1,398. The population is predominantly white (94.3%), with small percentages of Native American (2.2%), Asian (1.2%), and African American (0.7%) residents. The median household income is $41,944, and the median home value is $220,000.
Conclusion
Depoe Bay, Oregon is a small coastal city located in Lincoln County, Oregon. It is known for its picturesque harbor, whale watching, fishing, and other recreational activities. The city has a temperate rainforest climate, and the economy is largely based on tourism and fishing. The population is predominantly white, with small percentages of Native American, Asian, and African American residents.
Common Questions
What is Per Capita Income in Depoe Bay?
Per Capita income in Depoe Bay is $45,588.
What is the Median Family Income in Depoe Bay?
Median Family Income in Depoe Bay is $92,625.
What is the Median Household income in Depoe Bay?
Median Household Income in Depoe Bay is $66,667.
What is Income or Wage Gap in Depoe Bay?
Income or Wage Gap in Depoe Bay is 8.5%.
Women in Depoe Bay earn 91.5 cents for every dollar earned by a man.
What is Inequality or Gini Index in Depoe Bay?
Inequality or Gini Index in Depoe Bay is 0.43.
What is the Total Population of Depoe Bay?
Total Population of Depoe Bay is 2,066.
What is the Total Male Population of Depoe Bay?
Total Male Population of Depoe Bay is 939.
What is the Total Female Population of Depoe Bay?
Total Female Population of Depoe Bay is 1,127.
What is the Ratio of Males per 100 Females in Depoe Bay?
There are 83.32 Males per 100 Females in Depoe Bay.
What is the Ratio of Females per 100 Males in Depoe Bay?
There are 120.02 Females per 100 Males in Depoe Bay.
What is the Median Population Age in Depoe Bay?
Median Population Age in Depoe Bay is 56.3 Years.
What is the Average Family Size in Depoe Bay
Average Family Size in Depoe Bay is 2.5 People.
What is the Average Household Size in Depoe Bay
Average Household Size in Depoe Bay is 2.0 People.
How Large is the Labor Force in Depoe Bay?
There are 1,043 People in the Labor Forcein in Depoe Bay.
What is the Percentage of People in the Labor Force in Depoe Bay?
55.4% of People are in the Labor Force in Depoe Bay.
What is the Unemployment Rate in Depoe Bay?
Unemployment Rate in Depoe Bay is 13.1%.