Melrose, OR Map & Demographics
Melrose Map
Melrose Overview
$51,606
PER CAPITA INCOME
$92,411
AVG FAMILY INCOME
$94,671
AVG HOUSEHOLD INCOME
53.8%
WAGE / INCOME GAP [ % ]
46.2¢/ $1
WAGE / INCOME GAP [ $ ]
0.54
INEQUALITY / GINI INDEX
797
TOTAL POPULATION
478
MALE POPULATION
319
FEMALE POPULATION
149.84
MALES / 100 FEMALES
66.74
FEMALES / 100 MALES
47.5
MEDIAN AGE
3.2
AVG FAMILY SIZE
2.4
AVG HOUSEHOLD SIZE
444
LABOR FORCE [ PEOPLE ]
66.8%
PERCENT IN LABOR FORCE
2.5%
UNEMPLOYMENT RATE
Income in Melrose
Income Overview in Melrose
Per Capita Income in Melrose is $51,606, while median incomes of families and households are $92,411 and $94,671 respectively.
| Characteristic | Number | Measure |
| Per Capita Income | 797 | $51,606 |
| Median Family Income | 183 | $92,411 |
| Mean Family Income | 183 | $101,106 |
| Median Household Income | 335 | $94,671 |
| Mean Household Income | 335 | $122,747 |
| Income Deficit | 183 | $0 |
| Wage / Income Gap (%) | 797 | 53.83% |
| Wage / Income Gap ($) | 797 | 46.17¢ per $1 |
| Gini / Inequality Index | 797 | 0.54 |
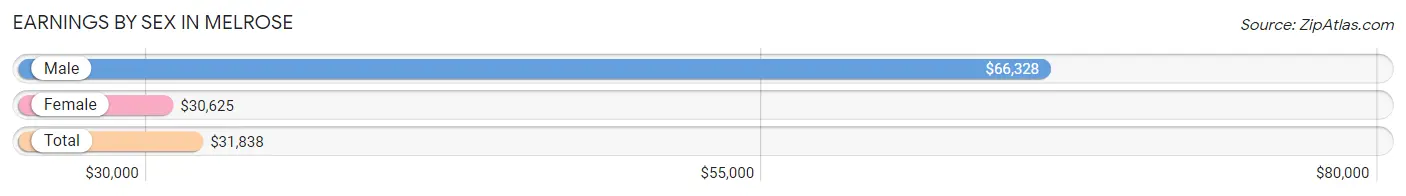
Earnings by Sex in Melrose
Average Earnings in Melrose are $31,838, $66,328 for men and $30,625 for women, a difference of 53.8%.
| Sex | Number | Average Earnings |
| Male | 225 (50.7%) | $66,328 |
| Female | 219 (49.3%) | $30,625 |
| Total | 444 (100.0%) | $31,838 |
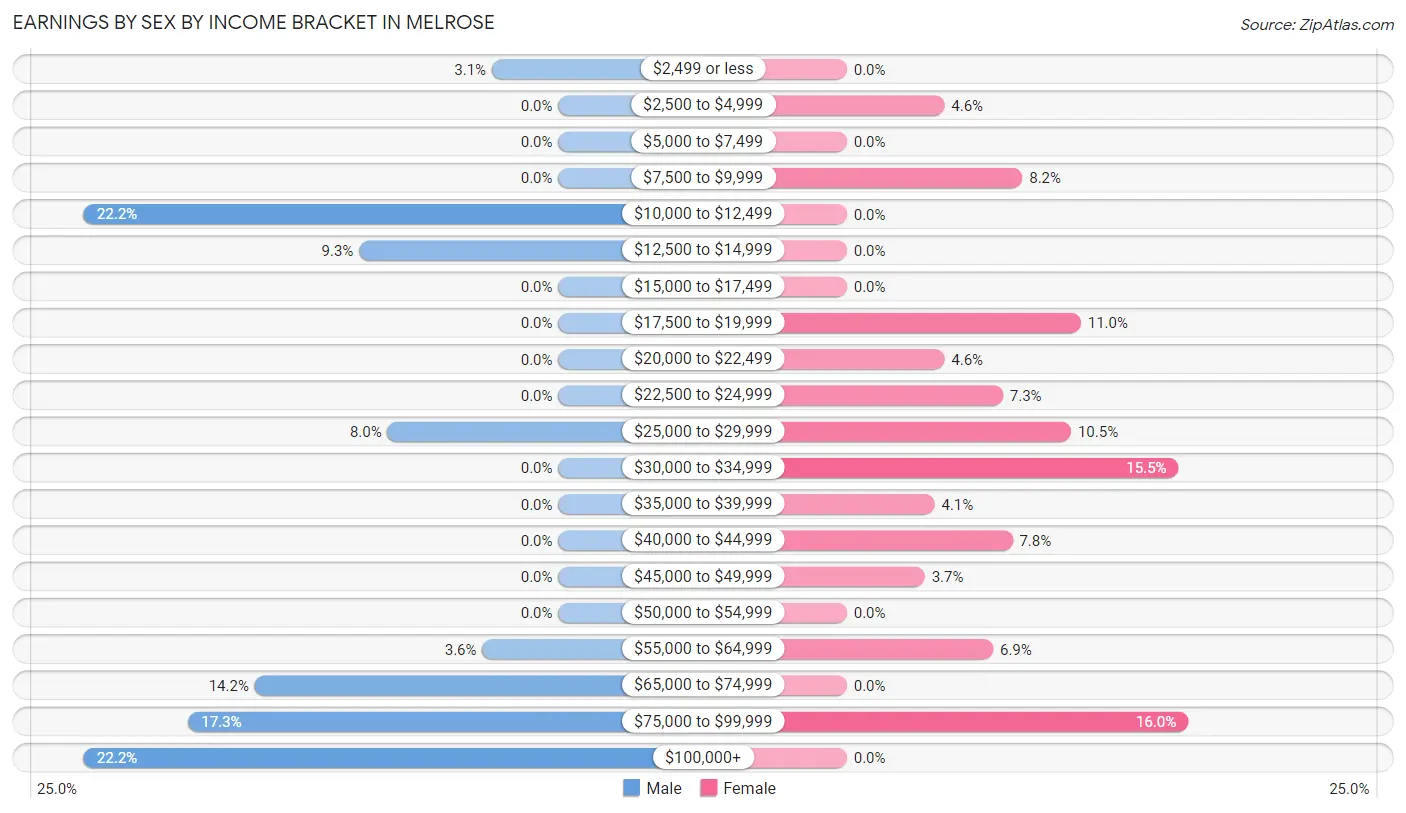
Earnings by Sex by Income Bracket in Melrose
The most common earnings brackets in Melrose are $10,000 to $12,499 for men (50 | 22.2%) and $75,000 to $99,999 for women (35 | 16.0%).
| Income | Male | Female |
| $2,499 or less | 7 (3.1%) | 0 (0.0%) |
| $2,500 to $4,999 | 0 (0.0%) | 10 (4.6%) |
| $5,000 to $7,499 | 0 (0.0%) | 0 (0.0%) |
| $7,500 to $9,999 | 0 (0.0%) | 18 (8.2%) |
| $10,000 to $12,499 | 50 (22.2%) | 0 (0.0%) |
| $12,500 to $14,999 | 21 (9.3%) | 0 (0.0%) |
| $15,000 to $17,499 | 0 (0.0%) | 0 (0.0%) |
| $17,500 to $19,999 | 0 (0.0%) | 24 (11.0%) |
| $20,000 to $22,499 | 0 (0.0%) | 10 (4.6%) |
| $22,500 to $24,999 | 0 (0.0%) | 16 (7.3%) |
| $25,000 to $29,999 | 18 (8.0%) | 23 (10.5%) |
| $30,000 to $34,999 | 0 (0.0%) | 34 (15.5%) |
| $35,000 to $39,999 | 0 (0.0%) | 9 (4.1%) |
| $40,000 to $44,999 | 0 (0.0%) | 17 (7.8%) |
| $45,000 to $49,999 | 0 (0.0%) | 8 (3.6%) |
| $50,000 to $54,999 | 0 (0.0%) | 0 (0.0%) |
| $55,000 to $64,999 | 8 (3.6%) | 15 (6.9%) |
| $65,000 to $74,999 | 32 (14.2%) | 0 (0.0%) |
| $75,000 to $99,999 | 39 (17.3%) | 35 (16.0%) |
| $100,000+ | 50 (22.2%) | 0 (0.0%) |
| Total | 225 (100.0%) | 219 (100.0%) |
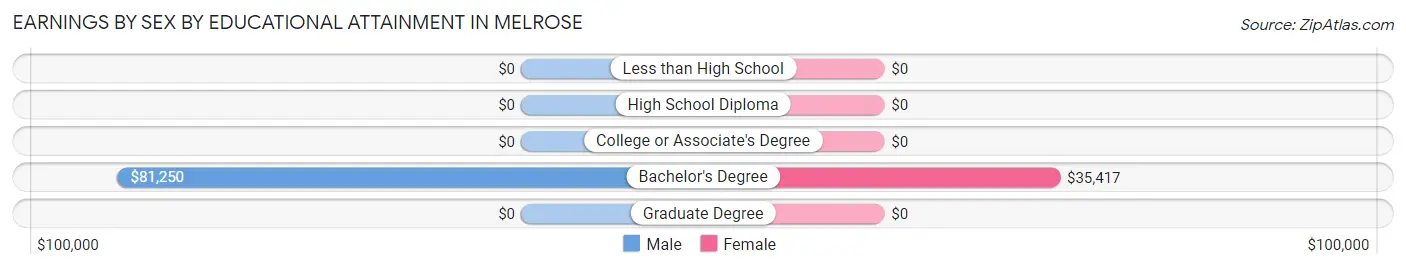
Earnings by Sex by Educational Attainment in Melrose
Average earnings in Melrose are $67,188 for men and $31,324 for women, a difference of 53.4%. Men with an educational attainment of bachelor's degree enjoy the highest average annual earnings of $81,250, while those with bachelor's degree education earn the least with $81,250. Women with an educational attainment of bachelor's degree earn the most with the average annual earnings of $35,417, while those with bachelor's degree education have the smallest earnings of $35,417.
| Educational Attainment | Male Income | Female Income |
| Less than High School | - | - |
| High School Diploma | - | - |
| College or Associate's Degree | - | - |
| Bachelor's Degree | $81,250 | $35,417 |
| Graduate Degree | - | - |
| Total | $67,188 | $31,324 |
Family Income in Melrose
Family Income Brackets in Melrose
According to the Melrose family income data, there are 66 families falling into the $100,000 to $149,999 income range, which is the most common income bracket and makes up 36.1% of all families.
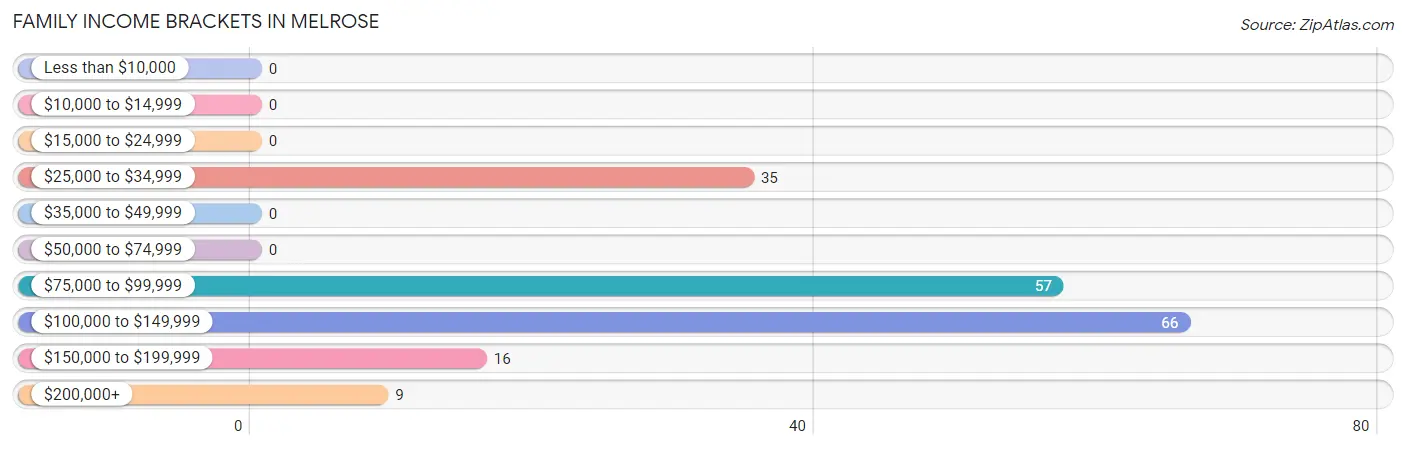
| Income Bracket | # Families | % Families |
| Less than $10,000 | 0 | 0.0% |
| $10,000 to $14,999 | 0 | 0.0% |
| $15,000 to $24,999 | 0 | 0.0% |
| $25,000 to $34,999 | 35 | 19.1% |
| $35,000 to $49,999 | 0 | 0.0% |
| $50,000 to $74,999 | 0 | 0.0% |
| $75,000 to $99,999 | 57 | 31.1% |
| $100,000 to $149,999 | 66 | 36.1% |
| $150,000 to $199,999 | 16 | 8.7% |
| $200,000+ | 9 | 4.9% |
Family Income by Famaliy Size in Melrose
2-person families (89 | 48.6%) account for the highest median family income in Melrose with $107,321 per family, while 2-person families (89 | 48.6%) have the highest median income of $53,660 per family member.
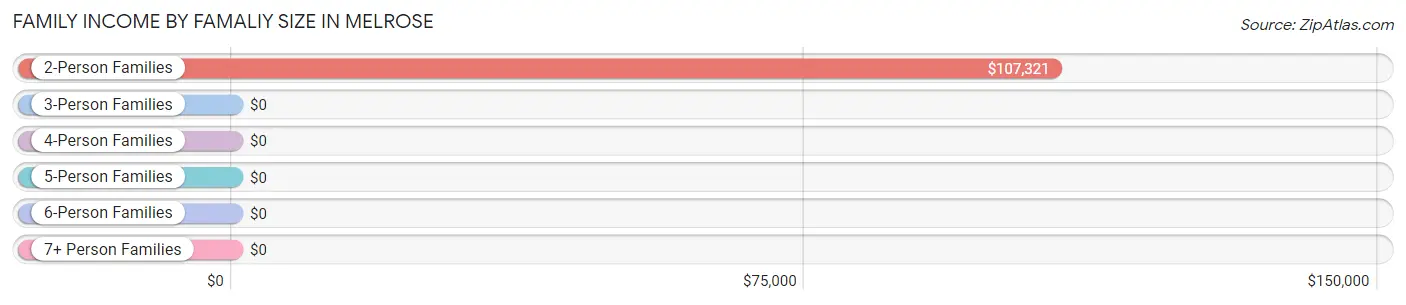
| Income Bracket | # Families | Median Income |
| 2-Person Families | 89 (48.6%) | $107,321 |
| 3-Person Families | 55 (30.0%) | $0 |
| 4-Person Families | 14 (7.6%) | $0 |
| 5-Person Families | 0 (0.0%) | $0 |
| 6-Person Families | 16 (8.7%) | $0 |
| 7+ Person Families | 9 (4.9%) | $0 |
| Total | 183 (100.0%) | $92,411 |
Family Income by Number of Earners in Melrose
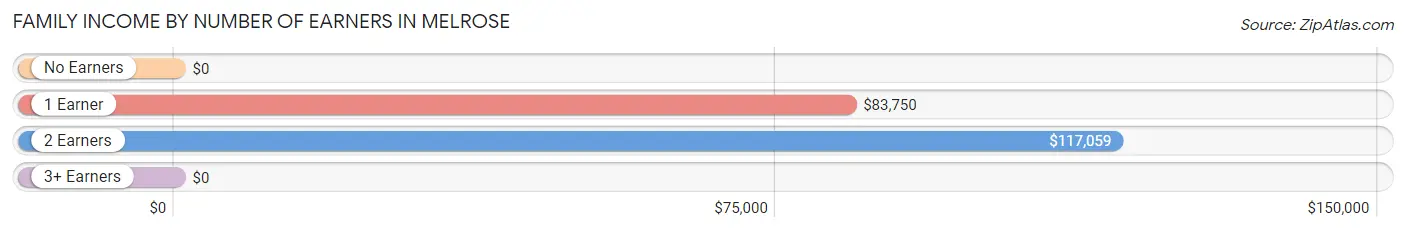
| Number of Earners | # Families | Median Income |
| No Earners | 21 (11.5%) | $0 |
| 1 Earner | 67 (36.6%) | $83,750 |
| 2 Earners | 70 (38.3%) | $117,059 |
| 3+ Earners | 25 (13.7%) | $0 |
| Total | 183 (100.0%) | $92,411 |
Household Income in Melrose
Household Income Brackets in Melrose
With 90 households falling in the category, the $100,000 to $149,999 income range is the most frequent in Melrose, accounting for 26.9% of all households.
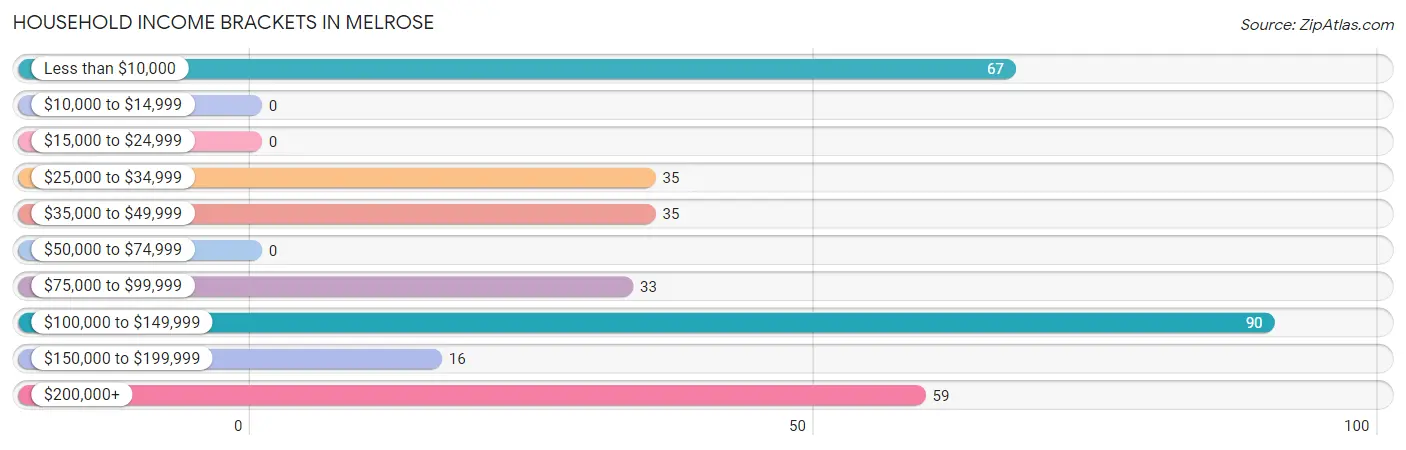
| Income Bracket | # Households | % Households |
| Less than $10,000 | 67 | 20.0% |
| $10,000 to $14,999 | 0 | 0.0% |
| $15,000 to $24,999 | 0 | 0.0% |
| $25,000 to $34,999 | 35 | 10.4% |
| $35,000 to $49,999 | 35 | 10.4% |
| $50,000 to $74,999 | 0 | 0.0% |
| $75,000 to $99,999 | 33 | 9.9% |
| $100,000 to $149,999 | 90 | 26.9% |
| $150,000 to $199,999 | 16 | 4.8% |
| $200,000+ | 59 | 17.6% |
Household Income by Householder Age in Melrose
The median household income in Melrose is $94,671, with the highest median household income of $93,947 found in the 25 to 44 years age bracket for the primary householder. A total of 64 households (19.1%) fall into this category.
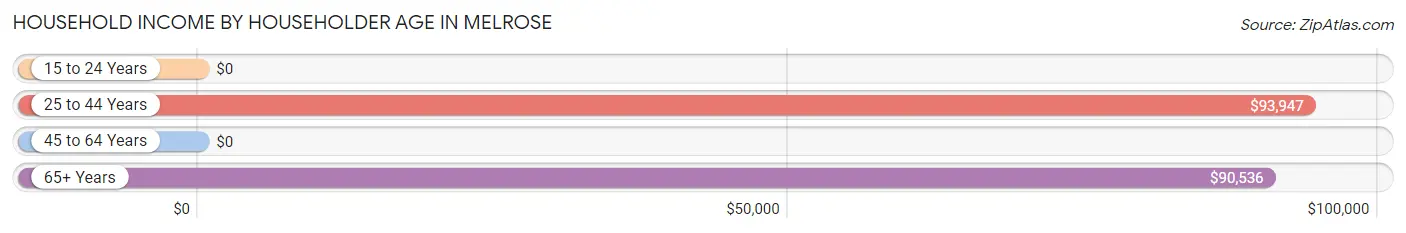
| Income Bracket | # Households | Median Income |
| 15 to 24 Years | 0 (0.0%) | $0 |
| 25 to 44 Years | 64 (19.1%) | $93,947 |
| 45 to 64 Years | 201 (60.0%) | $0 |
| 65+ Years | 70 (20.9%) | $90,536 |
| Total | 335 (100.0%) | $94,671 |
Poverty in Melrose
Income Below Poverty by Sex and Age in Melrose
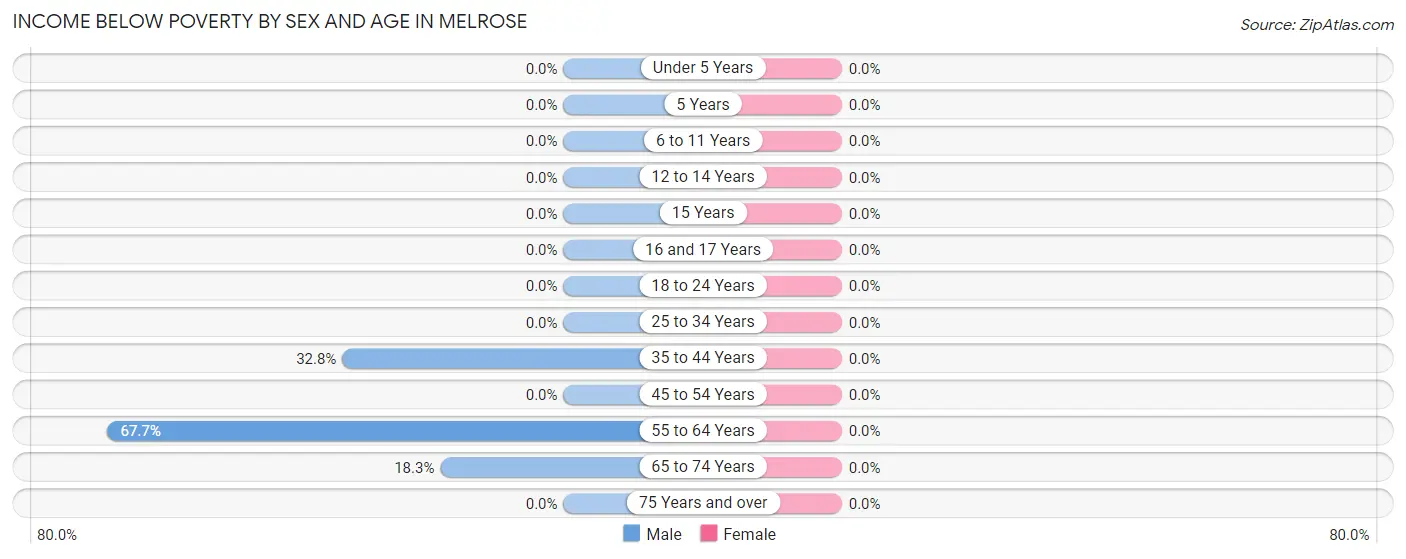
| Age Bracket | Male | Female |
| Under 5 Years | 0 (0.0%) | 0 (0.0%) |
| 5 Years | 0 (0.0%) | 0 (0.0%) |
| 6 to 11 Years | 0 (0.0%) | 0 (0.0%) |
| 12 to 14 Years | 0 (0.0%) | 0 (0.0%) |
| 15 Years | 0 (0.0%) | 0 (0.0%) |
| 16 and 17 Years | 0 (0.0%) | 0 (0.0%) |
| 18 to 24 Years | 0 (0.0%) | 0 (0.0%) |
| 25 to 34 Years | 0 (0.0%) | 0 (0.0%) |
| 35 to 44 Years | 22 (32.8%) | 0 (0.0%) |
| 45 to 54 Years | 0 (0.0%) | 0 (0.0%) |
| 55 to 64 Years | 67 (67.7%) | 0 (0.0%) |
| 65 to 74 Years | 17 (18.3%) | 0 (0.0%) |
| 75 Years and over | 0 (0.0%) | 0 (0.0%) |
| Total | 106 (22.2%) | 0 (0.0%) |
Income Above Poverty by Sex and Age in Melrose
According to the poverty statistics in Melrose, males aged under 5 years and females aged under 5 years are the age groups that are most secure financially, with 100.0% of males and 100.0% of females in these age groups living above the poverty line.
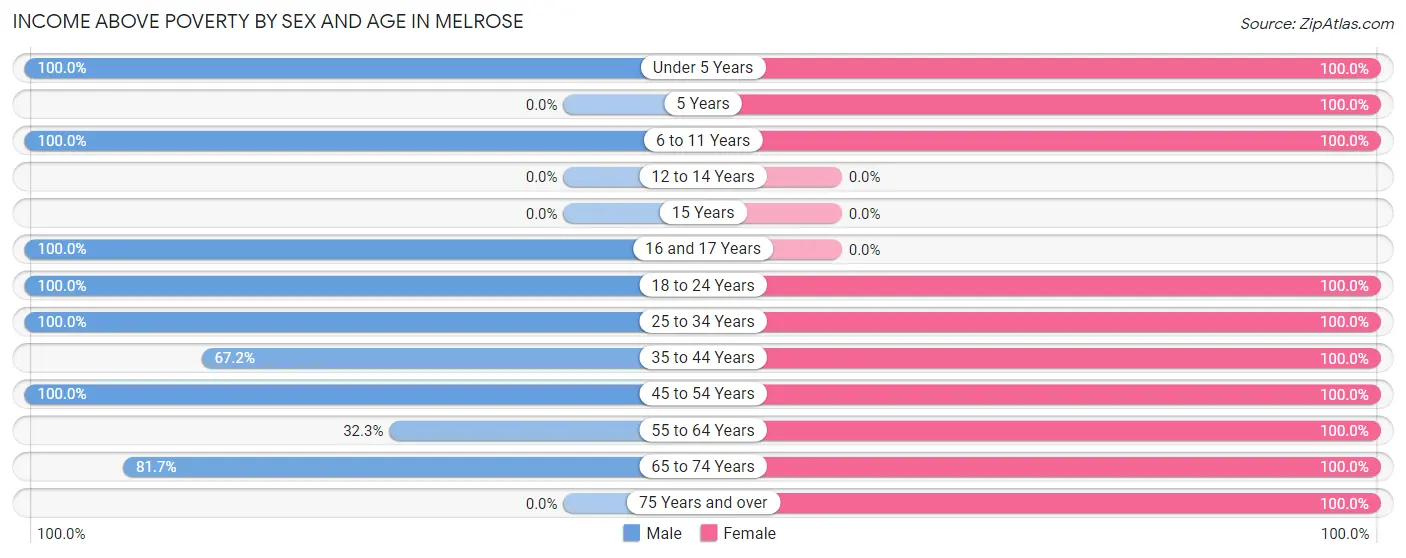
| Age Bracket | Male | Female |
| Under 5 Years | 20 (100.0%) | 28 (100.0%) |
| 5 Years | 0 (0.0%) | 16 (100.0%) |
| 6 to 11 Years | 47 (100.0%) | 21 (100.0%) |
| 12 to 14 Years | 0 (0.0%) | 0 (0.0%) |
| 15 Years | 0 (0.0%) | 0 (0.0%) |
| 16 and 17 Years | 18 (100.0%) | 0 (0.0%) |
| 18 to 24 Years | 11 (100.0%) | 19 (100.0%) |
| 25 to 34 Years | 33 (100.0%) | 72 (100.0%) |
| 35 to 44 Years | 45 (67.2%) | 23 (100.0%) |
| 45 to 54 Years | 90 (100.0%) | 57 (100.0%) |
| 55 to 64 Years | 32 (32.3%) | 42 (100.0%) |
| 65 to 74 Years | 76 (81.7%) | 25 (100.0%) |
| 75 Years and over | 0 (0.0%) | 16 (100.0%) |
| Total | 372 (77.8%) | 319 (100.0%) |
Income Below Poverty Among Married-Couple Families in Melrose
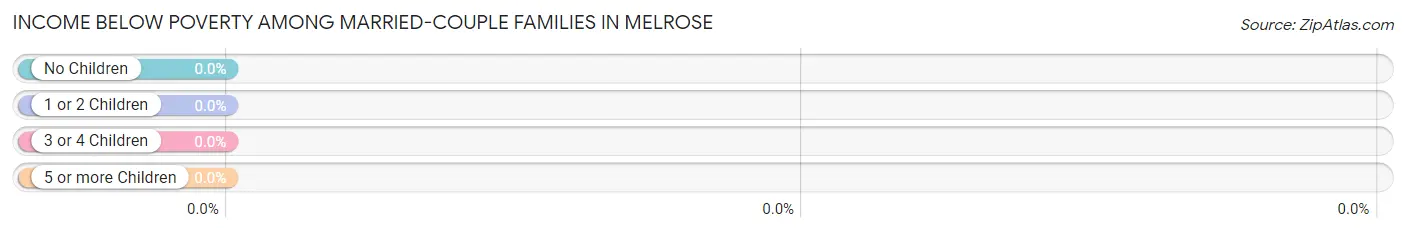
| Children | Above Poverty | Below Poverty |
| No Children | 88 (100.0%) | 0 (0.0%) |
| 1 or 2 Children | 52 (100.0%) | 0 (0.0%) |
| 3 or 4 Children | 0 (0.0%) | 0 (0.0%) |
| 5 or more Children | 0 (0.0%) | 0 (0.0%) |
| Total | 140 (100.0%) | 0 (0.0%) |
Income Below Poverty Among Single-Parent Households in Melrose
| Children | Single Father | Single Mother |
| No Children | 0 (0.0%) | 0 (0.0%) |
| 1 or 2 Children | 0 (0.0%) | 0 (0.0%) |
| 3 or 4 Children | 0 (0.0%) | 0 (0.0%) |
| 5 or more Children | 0 (0.0%) | 0 (0.0%) |
| Total | 0 (0.0%) | 0 (0.0%) |
Income Below Poverty Among Married-Couple vs Single-Parent Households in Melrose
| Children | Married-Couple Families | Single-Parent Households |
| No Children | 0 (0.0%) | 0 (0.0%) |
| 1 or 2 Children | 0 (0.0%) | 0 (0.0%) |
| 3 or 4 Children | 0 (0.0%) | 0 (0.0%) |
| 5 or more Children | 0 (0.0%) | 0 (0.0%) |
| Total | 0 (0.0%) | 0 (0.0%) |
Race in Melrose
The most populous races in Melrose are , and White / Caucasian (797 | 100.0%).
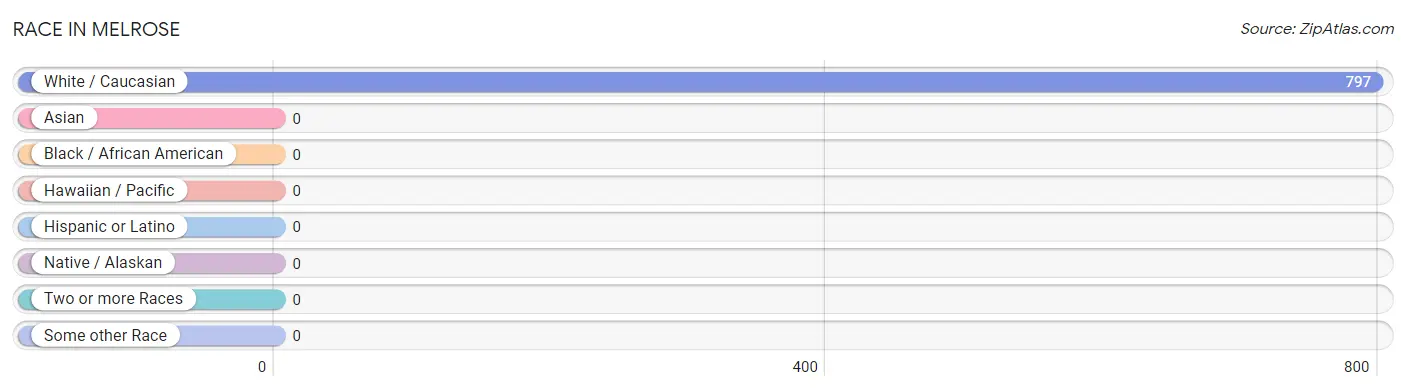
| Race | # Population | % Population |
| Asian | 0 | 0.0% |
| Black / African American | 0 | 0.0% |
| Hawaiian / Pacific | 0 | 0.0% |
| Hispanic or Latino | 0 | 0.0% |
| Native / Alaskan | 0 | 0.0% |
| White / Caucasian | 797 | 100.0% |
| Two or more Races | 0 | 0.0% |
| Some other Race | 0 | 0.0% |
| Total | 797 | 100.0% |
Ancestry in Melrose
The most populous ancestries reported in Melrose are English (244 | 30.6%), German (164 | 20.6%), Italian (131 | 16.4%), American (85 | 10.7%), and Irish (81 | 10.2%), together accounting for 88.5% of all Melrose residents.
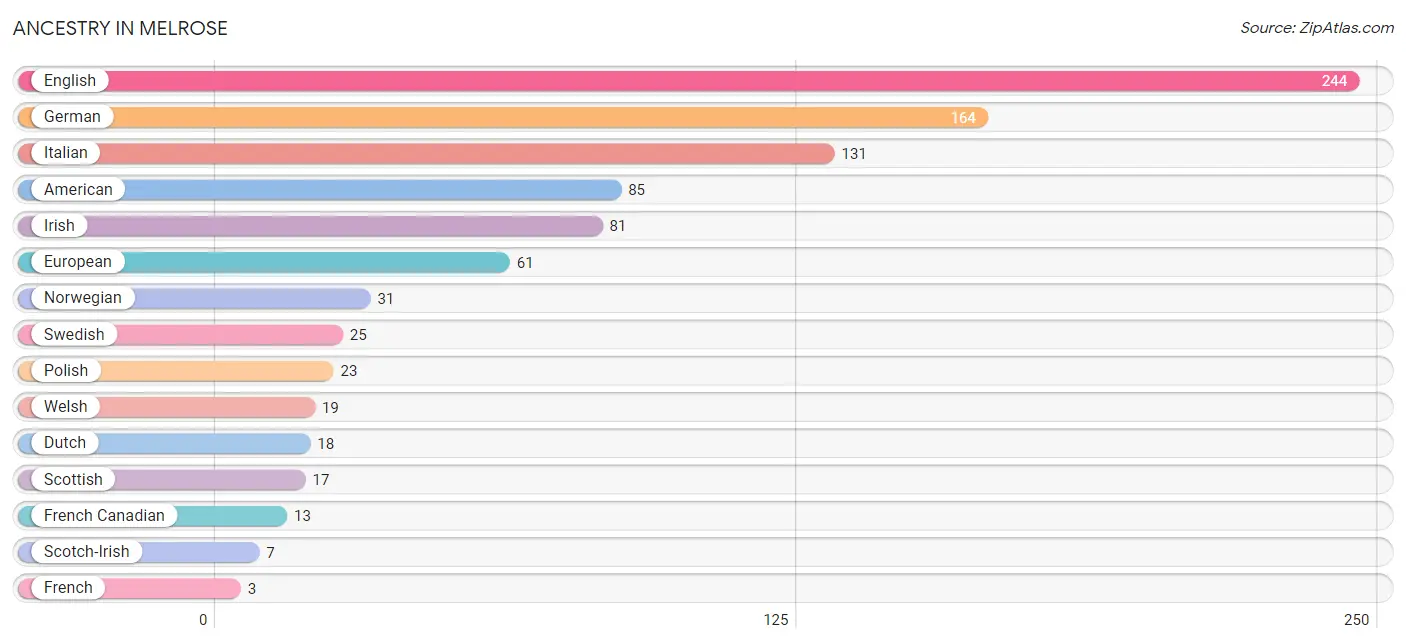
| Ancestry | # Population | % Population |
| American | 85 | 10.7% |
| Dutch | 18 | 2.3% |
| English | 244 | 30.6% |
| European | 61 | 7.6% |
| French | 3 | 0.4% |
| French Canadian | 13 | 1.6% |
| German | 164 | 20.6% |
| Irish | 81 | 10.2% |
| Italian | 131 | 16.4% |
| Norwegian | 31 | 3.9% |
| Polish | 23 | 2.9% |
| Scotch-Irish | 7 | 0.9% |
| Scottish | 17 | 2.1% |
| Swedish | 25 | 3.1% |
| Welsh | 19 | 2.4% | View All 15 Rows |
Immigrants in Melrose
The most numerous immigrant groups reported in Melrose came from , and Canada (13 | 1.6%), together accounting for 1.6% of all Melrose residents.

| Immigration Origin | # Population | % Population |
| Canada | 13 | 1.6% | View All 1 Rows |
Sex and Age in Melrose
Sex and Age in Melrose
The most populous age groups in Melrose are 60 to 64 Years (83 | 17.4%) for men and 30 to 34 Years (53 | 16.6%) for women.
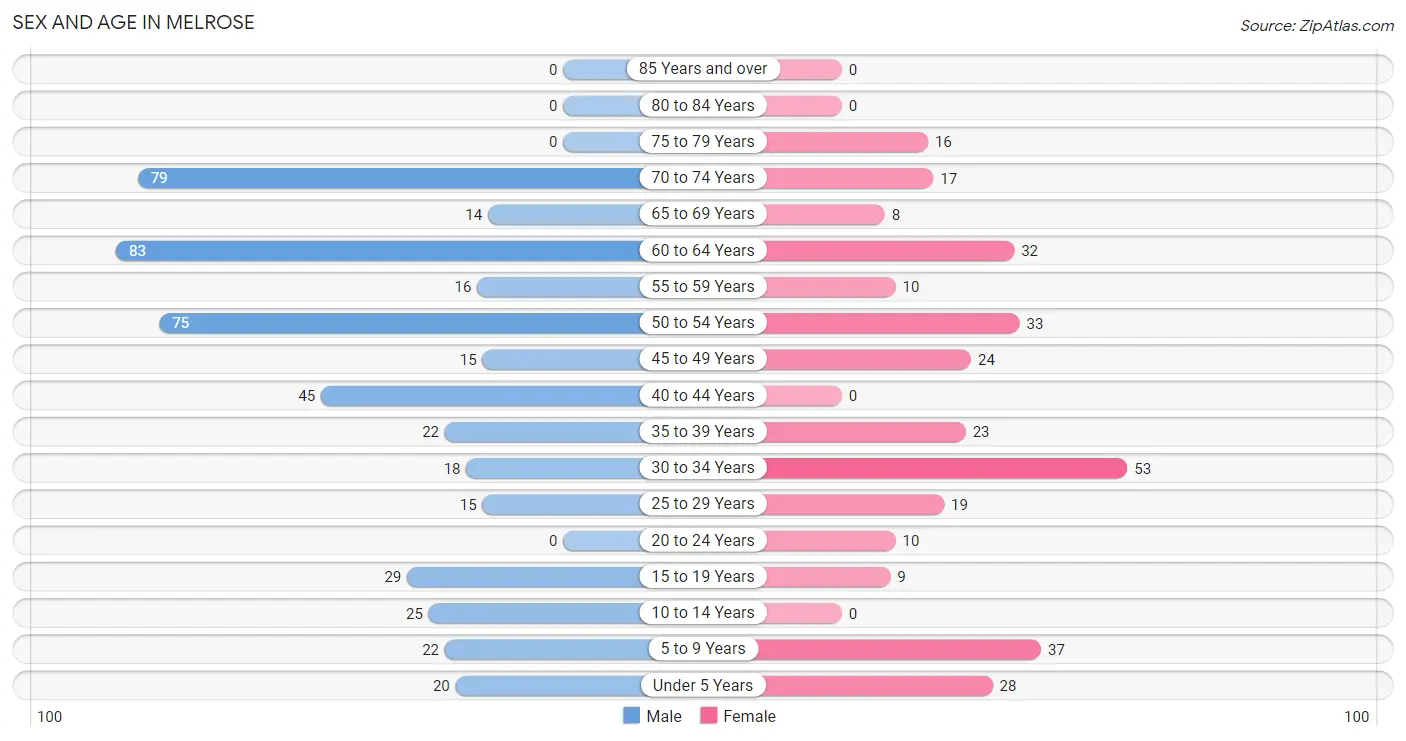
| Age Bracket | Male | Female |
| Under 5 Years | 20 (4.2%) | 28 (8.8%) |
| 5 to 9 Years | 22 (4.6%) | 37 (11.6%) |
| 10 to 14 Years | 25 (5.2%) | 0 (0.0%) |
| 15 to 19 Years | 29 (6.1%) | 9 (2.8%) |
| 20 to 24 Years | 0 (0.0%) | 10 (3.1%) |
| 25 to 29 Years | 15 (3.1%) | 19 (6.0%) |
| 30 to 34 Years | 18 (3.8%) | 53 (16.6%) |
| 35 to 39 Years | 22 (4.6%) | 23 (7.2%) |
| 40 to 44 Years | 45 (9.4%) | 0 (0.0%) |
| 45 to 49 Years | 15 (3.1%) | 24 (7.5%) |
| 50 to 54 Years | 75 (15.7%) | 33 (10.3%) |
| 55 to 59 Years | 16 (3.4%) | 10 (3.1%) |
| 60 to 64 Years | 83 (17.4%) | 32 (10.0%) |
| 65 to 69 Years | 14 (2.9%) | 8 (2.5%) |
| 70 to 74 Years | 79 (16.5%) | 17 (5.3%) |
| 75 to 79 Years | 0 (0.0%) | 16 (5.0%) |
| 80 to 84 Years | 0 (0.0%) | 0 (0.0%) |
| 85 Years and over | 0 (0.0%) | 0 (0.0%) |
| Total | 478 (100.0%) | 319 (100.0%) |
Families and Households in Melrose
Median Family Size in Melrose
The median family size in Melrose is 3.19 persons per family, with single female/mother families (19 | 10.4%) accounting for the largest median family size of 3.42 persons per family. On the other hand, single male/father families (24 | 13.1%) represent the smallest median family size with 2.17 persons per family.
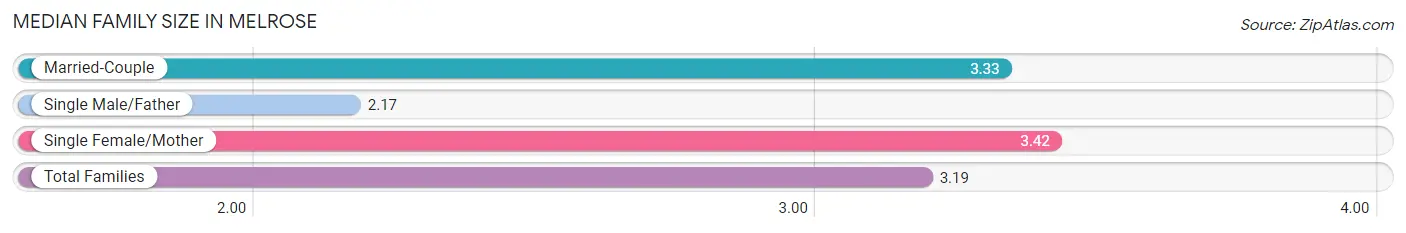
| Family Type | # Families | Family Size |
| Married-Couple | 140 (76.5%) | 3.33 |
| Single Male/Father | 24 (13.1%) | 2.17 |
| Single Female/Mother | 19 (10.4%) | 3.42 |
| Total Families | 183 (100.0%) | 3.19 |
Median Household Size in Melrose
The median household size in Melrose is 2.38 persons per household, with single female/mother households (19 | 5.7%) accounting for the largest median household size of 4.58 persons per household. non-family households (152 | 45.4%) represent the smallest median household size with 1.11 persons per household.
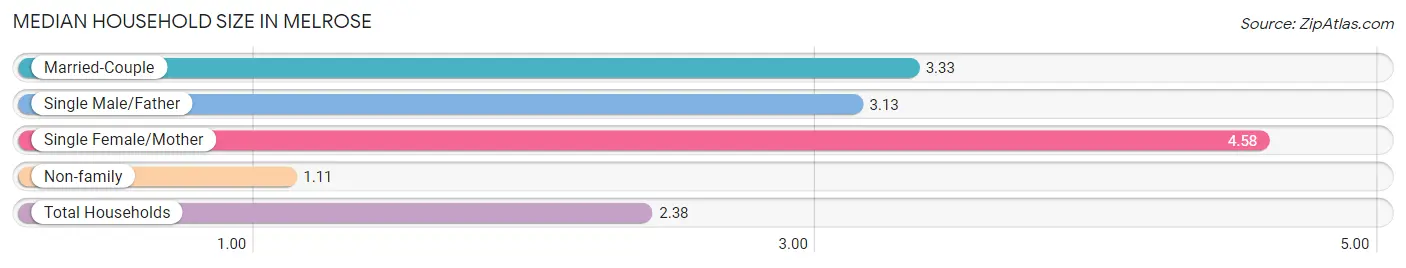
| Household Type | # Households | Household Size |
| Married-Couple | 140 (41.8%) | 3.33 |
| Single Male/Father | 24 (7.2%) | 3.13 |
| Single Female/Mother | 19 (5.7%) | 4.58 |
| Non-family | 152 (45.4%) | 1.11 |
| Total Households | 335 (100.0%) | 2.38 |
Household Size by Marriage Status in Melrose
Out of a total of 335 households in Melrose, 183 (54.6%) are family households, while 152 (45.4%) are nonfamily households. The most numerous type of family households are 2-person households, comprising 65, and the most common type of nonfamily households are 1-person households, comprising 135.
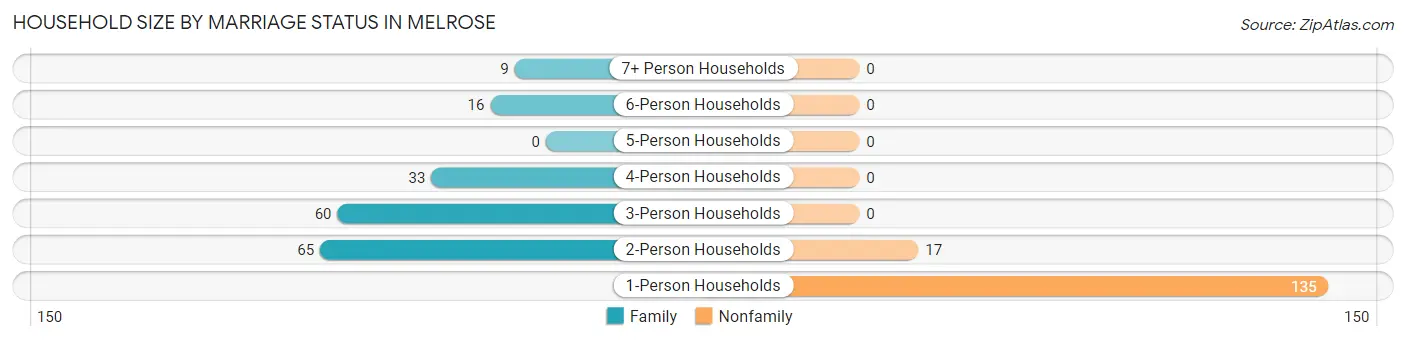
| Household Size | Family Households | Nonfamily Households |
| 1-Person Households | - | 135 (40.3%) |
| 2-Person Households | 65 (19.4%) | 17 (5.1%) |
| 3-Person Households | 60 (17.9%) | 0 (0.0%) |
| 4-Person Households | 33 (9.9%) | 0 (0.0%) |
| 5-Person Households | 0 (0.0%) | 0 (0.0%) |
| 6-Person Households | 16 (4.8%) | 0 (0.0%) |
| 7+ Person Households | 9 (2.7%) | 0 (0.0%) |
| Total | 183 (54.6%) | 152 (45.4%) |
Female Fertility in Melrose
Fertility by Age in Melrose
| Age Bracket | Women with Births | Births / 1,000 Women |
| 15 to 19 years | 0 (0.0%) | 0.0 |
| 20 to 34 years | 0 (0.0%) | 0.0 |
| 35 to 50 years | 0 (0.0%) | 0.0 |
| Total | 0 (0.0%) | 0.0 |
Fertility by Age by Marriage Status in Melrose
| Age Bracket | Married | Unmarried |
| 15 to 19 years | 0 (0.0%) | 0 (0.0%) |
| 20 to 34 years | 0 (0.0%) | 0 (0.0%) |
| 35 to 50 years | 0 (0.0%) | 0 (0.0%) |
| Total | 0 (0.0%) | 0 (0.0%) |
Fertility by Education in Melrose
| Educational Attainment | Women with Births | Births / 1,000 Women |
| Less than High School | 0 (0.0%) | 0.0 |
| High School Diploma | 0 (0.0%) | 0.0 |
| College or Associate's Degree | 0 (0.0%) | 0.0 |
| Bachelor's Degree | 0 (0.0%) | 0.0 |
| Graduate Degree | 0 (0.0%) | 0.0 |
| Total | 0 (0.0%) | 0.0 |
Fertility by Education by Marriage Status in Melrose
| Educational Attainment | Married | Unmarried |
| Less than High School | 0 (0.0%) | 0 (0.0%) |
| High School Diploma | 0 (0.0%) | 0 (0.0%) |
| College or Associate's Degree | 0 (0.0%) | 0 (0.0%) |
| Bachelor's Degree | 0 (0.0%) | 0 (0.0%) |
| Graduate Degree | 0 (0.0%) | 0 (0.0%) |
| Total | 0 (0.0%) | 0 (0.0%) |
Employment Characteristics in Melrose
Employment by Class of Employer in Melrose
Among the 411 employed individuals in Melrose, private company employees (134 | 32.6%), self-employed (incorporated) (83 | 20.2%), and self-employed (not incorporated) (66 | 16.1%) make up the most common classes of employment.
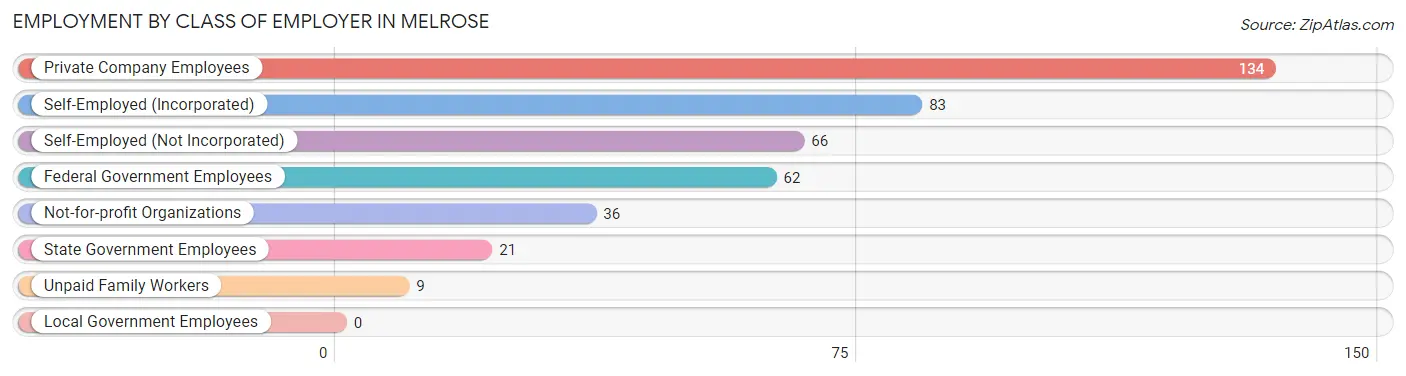
| Employer Class | # Employees | % Employees |
| Private Company Employees | 134 | 32.6% |
| Self-Employed (Incorporated) | 83 | 20.2% |
| Self-Employed (Not Incorporated) | 66 | 16.1% |
| Not-for-profit Organizations | 36 | 8.8% |
| Local Government Employees | 0 | 0.0% |
| State Government Employees | 21 | 5.1% |
| Federal Government Employees | 62 | 15.1% |
| Unpaid Family Workers | 9 | 2.2% |
| Total | 411 | 100.0% |
Employment Status by Age in Melrose
According to the labor force statistics for Melrose, out of the total population over 16 years of age (665), 66.8% or 444 individuals are in the labor force, with 2.5% or 11 of them unemployed. The age group with the highest labor force participation rate is 20 to 24 years, with 100.0% or 10 individuals in the labor force. Within the labor force, the 16 to 19 years age range has the highest percentage of unemployed individuals, with 55.0% or 11 of them being unemployed.
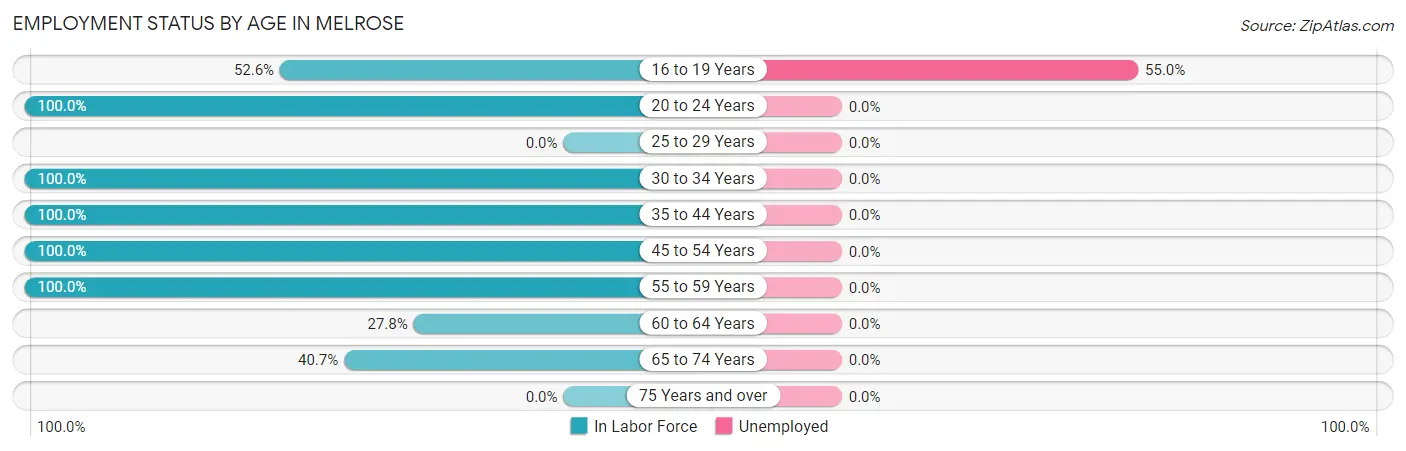
| Age Bracket | In Labor Force | Unemployed |
| 16 to 19 Years | 20 (52.6%) | 11 (55.0%) |
| 20 to 24 Years | 10 (100.0%) | 0 (0.0%) |
| 25 to 29 Years | 0 (0.0%) | 0 (0.0%) |
| 30 to 34 Years | 71 (100.0%) | 0 (0.0%) |
| 35 to 44 Years | 90 (100.0%) | 0 (0.0%) |
| 45 to 54 Years | 147 (100.0%) | 0 (0.0%) |
| 55 to 59 Years | 26 (100.0%) | 0 (0.0%) |
| 60 to 64 Years | 32 (27.8%) | 0 (0.0%) |
| 65 to 74 Years | 48 (40.7%) | 0 (0.0%) |
| 75 Years and over | 0 (0.0%) | 0 (0.0%) |
| Total | 444 (66.8%) | 11 (2.5%) |
Employment Status by Educational Attainment in Melrose
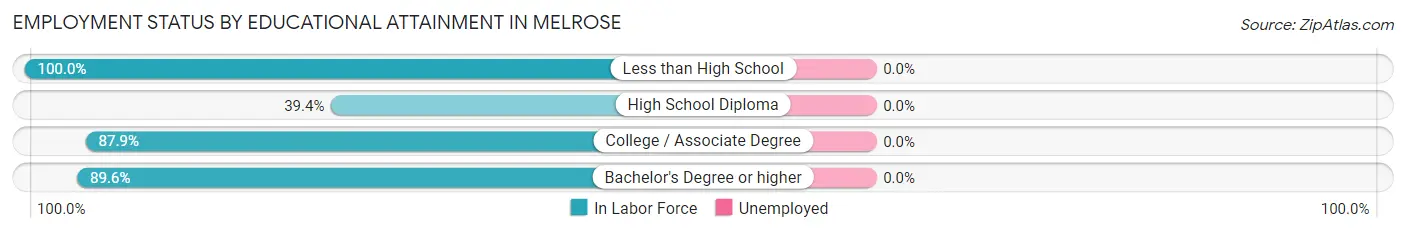
| Educational Attainment | In Labor Force | Unemployed |
| Less than High School | 39 (100.0%) | 0 (0.0%) |
| High School Diploma | 54 (39.4%) | 0 (0.0%) |
| College / Associate Degree | 109 (87.9%) | 0 (0.0%) |
| Bachelor's Degree or higher | 164 (89.6%) | 0 (0.0%) |
| Total | 366 (75.8%) | 0 (0.0%) |
Employment Occupations by Sex in Melrose
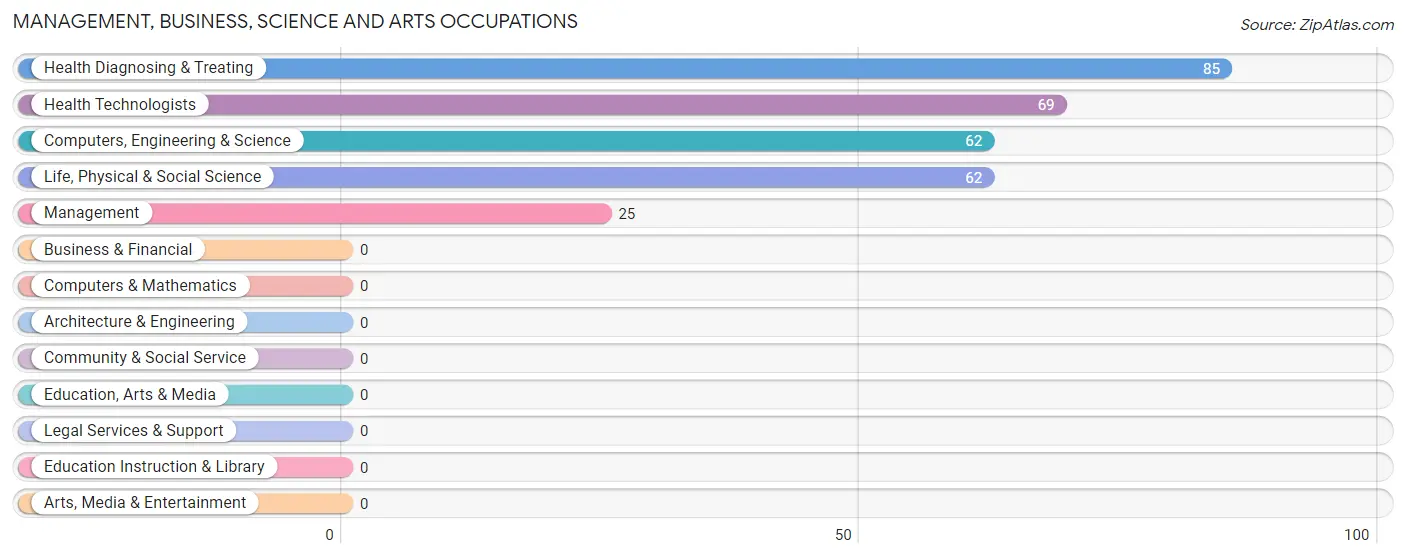
Management, Business, Science and Arts Occupations
The most common Management, Business, Science and Arts occupations in Melrose are Health Diagnosing & Treating (85 | 19.6%), Health Technologists (69 | 15.9%), Computers, Engineering & Science (62 | 14.3%), Life, Physical & Social Science (62 | 14.3%), and Management (25 | 5.8%).
Management, Business, Science and Arts Occupations by Sex
Within the Management, Business, Science and Arts occupations in Melrose, the most male-oriented occupations are Health Technologists (72.5%), Computers, Engineering & Science (62.9%), and Life, Physical & Social Science (62.9%), while the most female-oriented occupations are Management (100.0%), Health Diagnosing & Treating (41.2%), and Computers, Engineering & Science (37.1%).
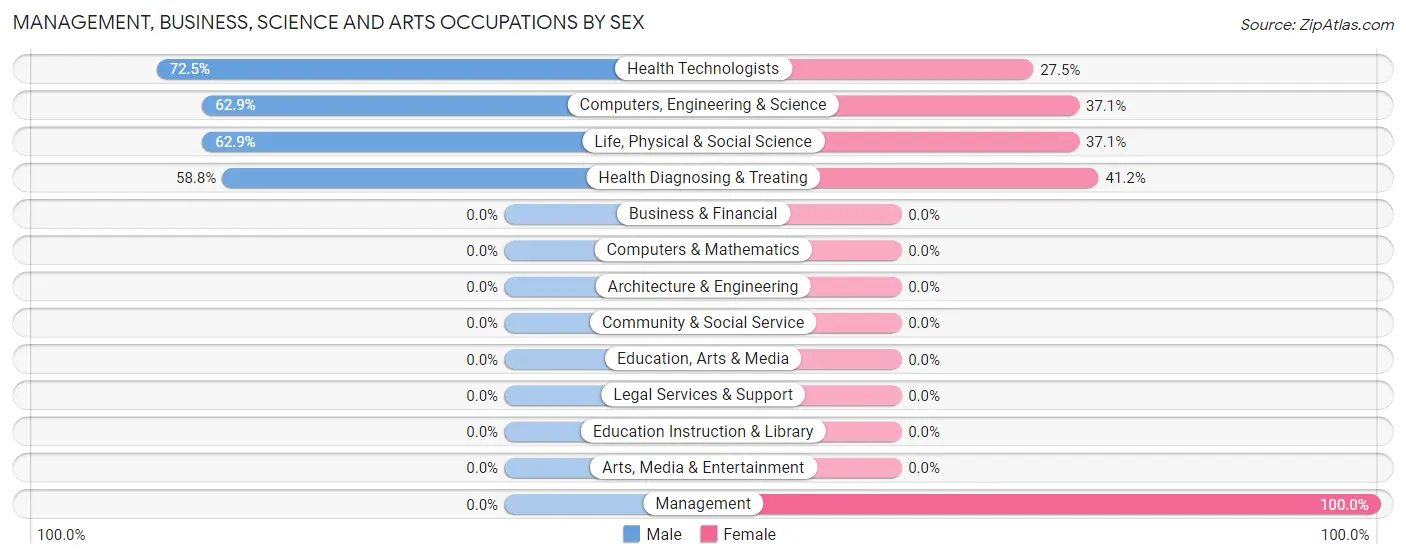
| Occupation | Male | Female |
| Management | 0 (0.0%) | 25 (100.0%) |
| Business & Financial | 0 (0.0%) | 0 (0.0%) |
| Computers, Engineering & Science | 39 (62.9%) | 23 (37.1%) |
| Computers & Mathematics | 0 (0.0%) | 0 (0.0%) |
| Architecture & Engineering | 0 (0.0%) | 0 (0.0%) |
| Life, Physical & Social Science | 39 (62.9%) | 23 (37.1%) |
| Community & Social Service | 0 (0.0%) | 0 (0.0%) |
| Education, Arts & Media | 0 (0.0%) | 0 (0.0%) |
| Legal Services & Support | 0 (0.0%) | 0 (0.0%) |
| Education Instruction & Library | 0 (0.0%) | 0 (0.0%) |
| Arts, Media & Entertainment | 0 (0.0%) | 0 (0.0%) |
| Health Diagnosing & Treating | 50 (58.8%) | 35 (41.2%) |
| Health Technologists | 50 (72.5%) | 19 (27.5%) |
| Total (Category) | 89 (51.7%) | 83 (48.3%) |
| Total (Overall) | 214 (49.4%) | 219 (50.6%) |
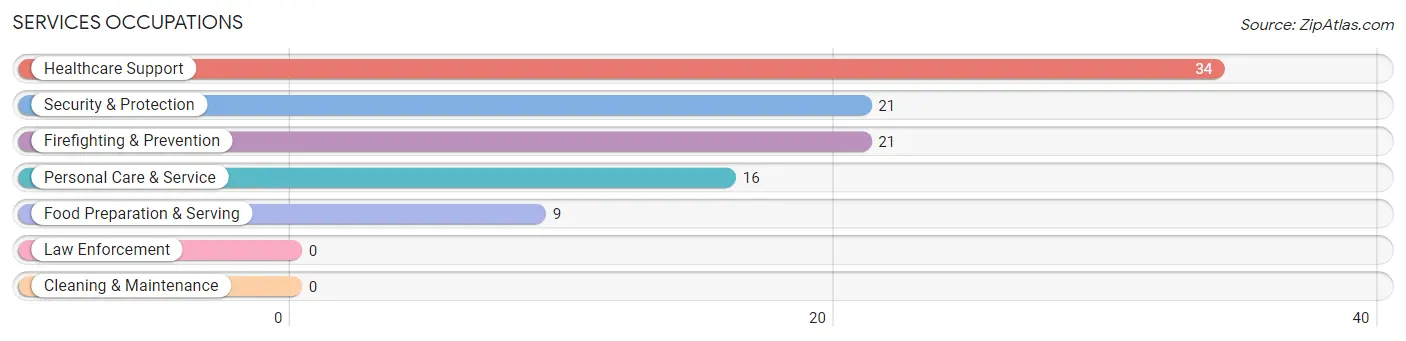
Services Occupations
The most common Services occupations in Melrose are Healthcare Support (34 | 7.9%), Security & Protection (21 | 4.9%), Firefighting & Prevention (21 | 4.9%), Personal Care & Service (16 | 3.7%), and Food Preparation & Serving (9 | 2.1%).
Services Occupations by Sex
Within the Services occupations in Melrose, the most male-oriented occupations are Security & Protection (100.0%), Firefighting & Prevention (100.0%), and Healthcare Support (50.0%), while the most female-oriented occupations are Food Preparation & Serving (100.0%), Personal Care & Service (100.0%), and Healthcare Support (50.0%).
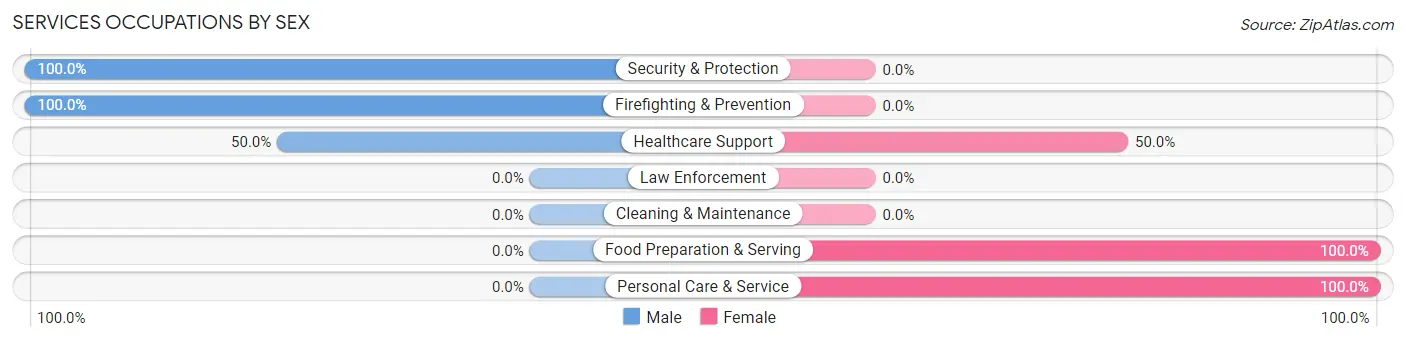
| Occupation | Male | Female |
| Healthcare Support | 17 (50.0%) | 17 (50.0%) |
| Security & Protection | 21 (100.0%) | 0 (0.0%) |
| Firefighting & Prevention | 21 (100.0%) | 0 (0.0%) |
| Law Enforcement | 0 (0.0%) | 0 (0.0%) |
| Food Preparation & Serving | 0 (0.0%) | 9 (100.0%) |
| Cleaning & Maintenance | 0 (0.0%) | 0 (0.0%) |
| Personal Care & Service | 0 (0.0%) | 16 (100.0%) |
| Total (Category) | 38 (47.5%) | 42 (52.5%) |
| Total (Overall) | 214 (49.4%) | 219 (50.6%) |
Sales and Office Occupations
The most common Sales and Office occupations in Melrose are , and Office & Administration (106 | 24.5%).
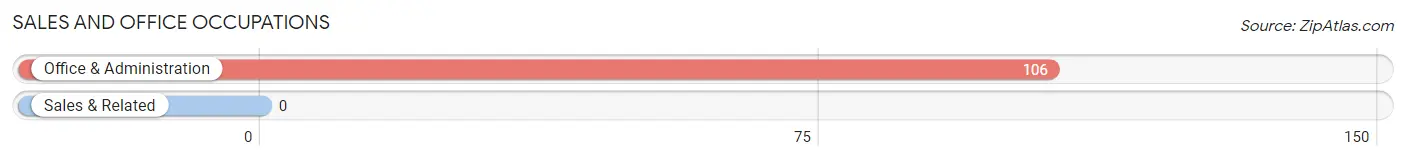
Sales and Office Occupations by Sex

| Occupation | Male | Female |
| Sales & Related | 0 (0.0%) | 0 (0.0%) |
| Office & Administration | 22 (20.7%) | 84 (79.2%) |
| Total (Category) | 22 (20.7%) | 84 (79.2%) |
| Total (Overall) | 214 (49.4%) | 219 (50.6%) |
Natural Resources, Construction and Maintenance Occupations
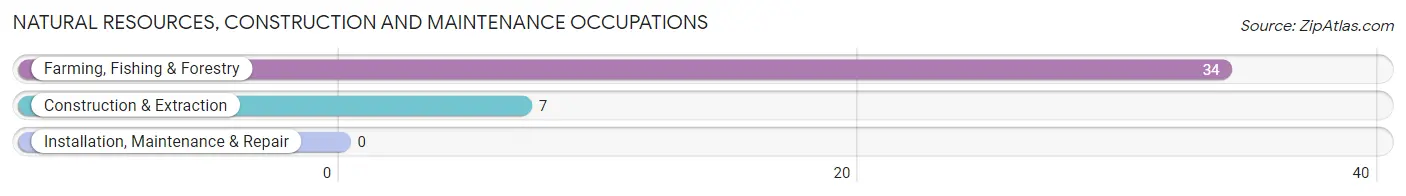
The most common Natural Resources, Construction and Maintenance occupations in Melrose are Farming, Fishing & Forestry (34 | 7.9%), and Construction & Extraction (7 | 1.6%).
Natural Resources, Construction and Maintenance Occupations by Sex

| Occupation | Male | Female |
| Farming, Fishing & Forestry | 34 (100.0%) | 0 (0.0%) |
| Construction & Extraction | 7 (100.0%) | 0 (0.0%) |
| Installation, Maintenance & Repair | 0 (0.0%) | 0 (0.0%) |
| Total (Category) | 41 (100.0%) | 0 (0.0%) |
| Total (Overall) | 214 (49.4%) | 219 (50.6%) |
Production, Transportation and Moving Occupations
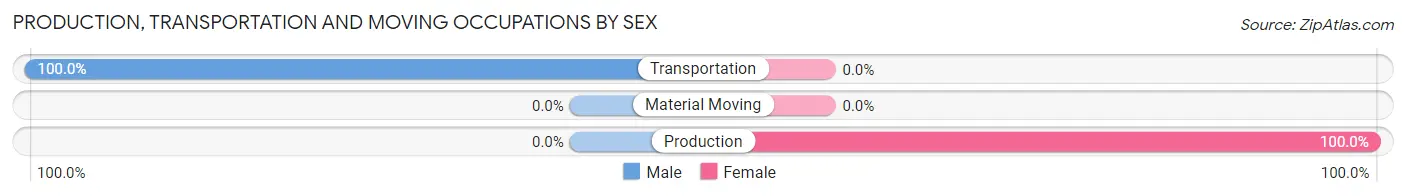
The most common Production, Transportation and Moving occupations in Melrose are Transportation (24 | 5.5%), and Production (10 | 2.3%).

Production, Transportation and Moving Occupations by Sex
| Occupation | Male | Female |
| Production | 0 (0.0%) | 10 (100.0%) |
| Transportation | 24 (100.0%) | 0 (0.0%) |
| Material Moving | 0 (0.0%) | 0 (0.0%) |
| Total (Category) | 24 (70.6%) | 10 (29.4%) |
| Total (Overall) | 214 (49.4%) | 219 (50.6%) |
Employment Industries by Sex in Melrose
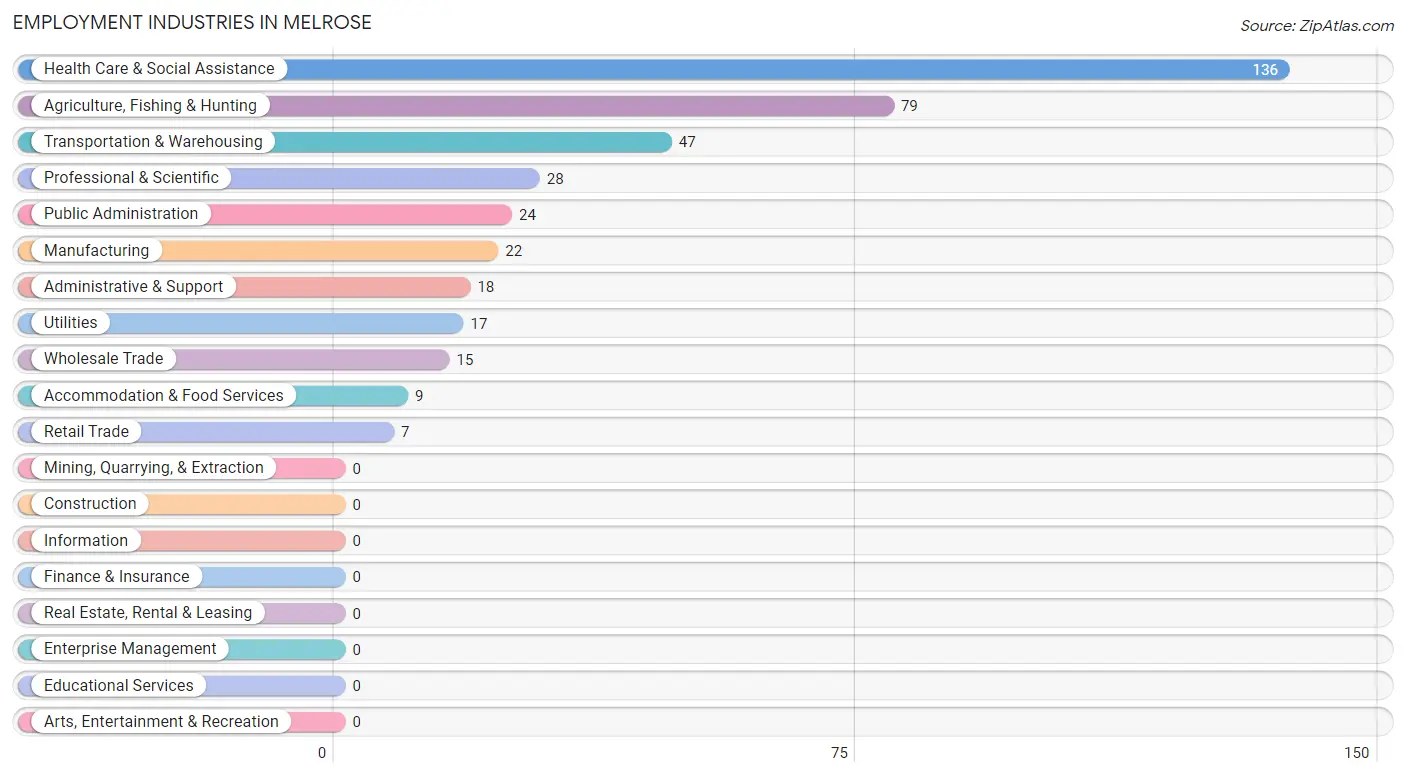
Employment Industries in Melrose
The major employment industries in Melrose include Health Care & Social Assistance (136 | 31.4%), Agriculture, Fishing & Hunting (79 | 18.2%), Transportation & Warehousing (47 | 10.8%), Professional & Scientific (28 | 6.5%), and Public Administration (24 | 5.5%).
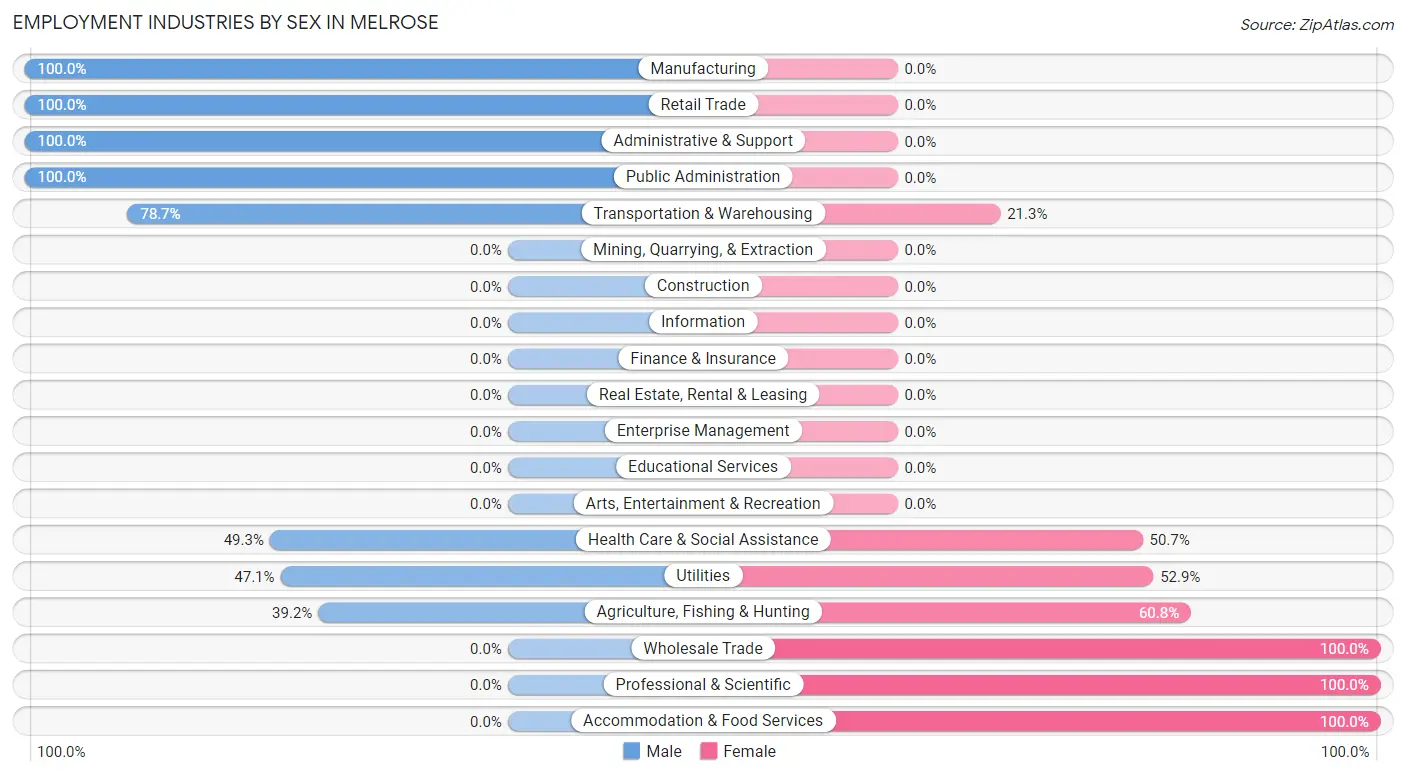
Employment Industries by Sex in Melrose
The Melrose industries that see more men than women are Manufacturing (100.0%), Retail Trade (100.0%), and Administrative & Support (100.0%), whereas the industries that tend to have a higher number of women are Wholesale Trade (100.0%), Professional & Scientific (100.0%), and Accommodation & Food Services (100.0%).
| Industry | Male | Female |
| Agriculture, Fishing & Hunting | 31 (39.2%) | 48 (60.8%) |
| Mining, Quarrying, & Extraction | 0 (0.0%) | 0 (0.0%) |
| Construction | 0 (0.0%) | 0 (0.0%) |
| Manufacturing | 22 (100.0%) | 0 (0.0%) |
| Wholesale Trade | 0 (0.0%) | 15 (100.0%) |
| Retail Trade | 7 (100.0%) | 0 (0.0%) |
| Transportation & Warehousing | 37 (78.7%) | 10 (21.3%) |
| Utilities | 8 (47.1%) | 9 (52.9%) |
| Information | 0 (0.0%) | 0 (0.0%) |
| Finance & Insurance | 0 (0.0%) | 0 (0.0%) |
| Real Estate, Rental & Leasing | 0 (0.0%) | 0 (0.0%) |
| Professional & Scientific | 0 (0.0%) | 28 (100.0%) |
| Enterprise Management | 0 (0.0%) | 0 (0.0%) |
| Administrative & Support | 18 (100.0%) | 0 (0.0%) |
| Educational Services | 0 (0.0%) | 0 (0.0%) |
| Health Care & Social Assistance | 67 (49.3%) | 69 (50.7%) |
| Arts, Entertainment & Recreation | 0 (0.0%) | 0 (0.0%) |
| Accommodation & Food Services | 0 (0.0%) | 9 (100.0%) |
| Public Administration | 24 (100.0%) | 0 (0.0%) |
| Total | 214 (49.4%) | 219 (50.6%) |
Education in Melrose
School Enrollment in Melrose
The most common levels of schooling among the 150 students in Melrose are elementary school (43 | 28.7%), college / undergraduate (29 | 19.3%), and middle school (25 | 16.7%).
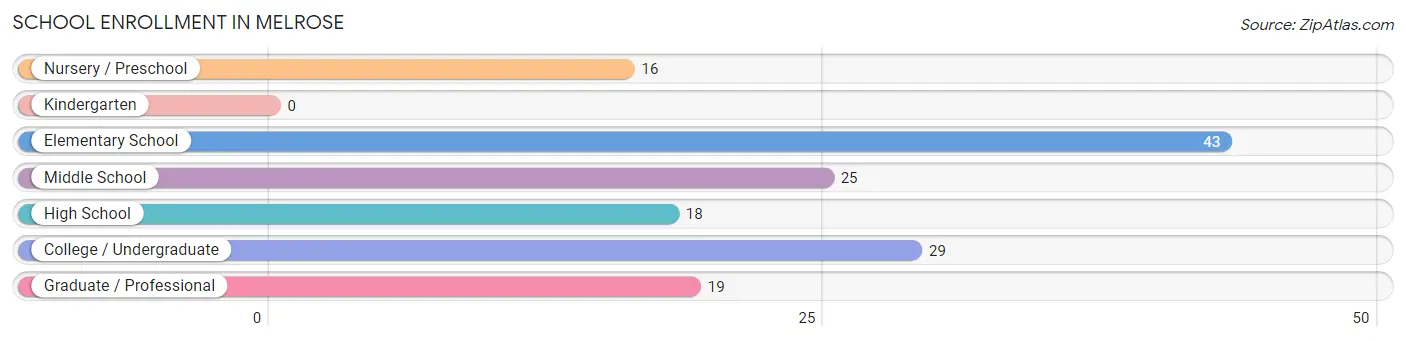
| School Level | # Students | % Students |
| Nursery / Preschool | 16 | 10.7% |
| Kindergarten | 0 | 0.0% |
| Elementary School | 43 | 28.7% |
| Middle School | 25 | 16.7% |
| High School | 18 | 12.0% |
| College / Undergraduate | 29 | 19.3% |
| Graduate / Professional | 19 | 12.7% |
| Total | 150 | 100.0% |
School Enrollment by Age by Funding Source in Melrose
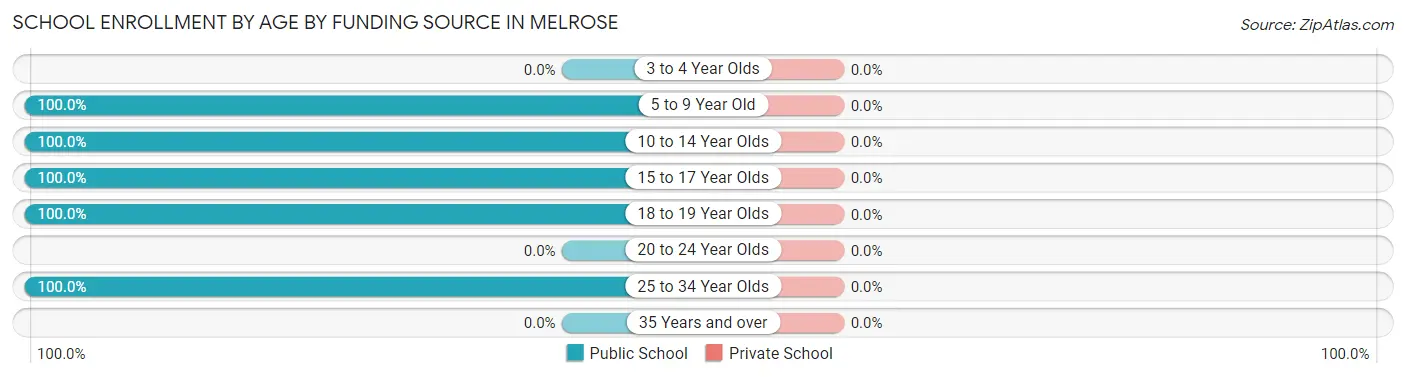
| Age Bracket | Public School | Private School |
| 3 to 4 Year Olds | 0 (0.0%) | 0 (0.0%) |
| 5 to 9 Year Old | 59 (100.0%) | 0 (0.0%) |
| 10 to 14 Year Olds | 25 (100.0%) | 0 (0.0%) |
| 15 to 17 Year Olds | 18 (100.0%) | 0 (0.0%) |
| 18 to 19 Year Olds | 11 (100.0%) | 0 (0.0%) |
| 20 to 24 Year Olds | 0 (0.0%) | 0 (0.0%) |
| 25 to 34 Year Olds | 37 (100.0%) | 0 (0.0%) |
| 35 Years and over | 0 (0.0%) | 0 (0.0%) |
| Total | 150 (100.0%) | 0 (0.0%) |
Educational Attainment by Field of Study in Melrose
Business (74 | 31.4%), bio, nature & agricultural (70 | 29.7%), visual & performing arts (50 | 21.2%), social sciences (18 | 7.6%), and physical & health sciences (9 | 3.8%) are the most common fields of study among 236 individuals in Melrose who have obtained a bachelor's degree or higher.
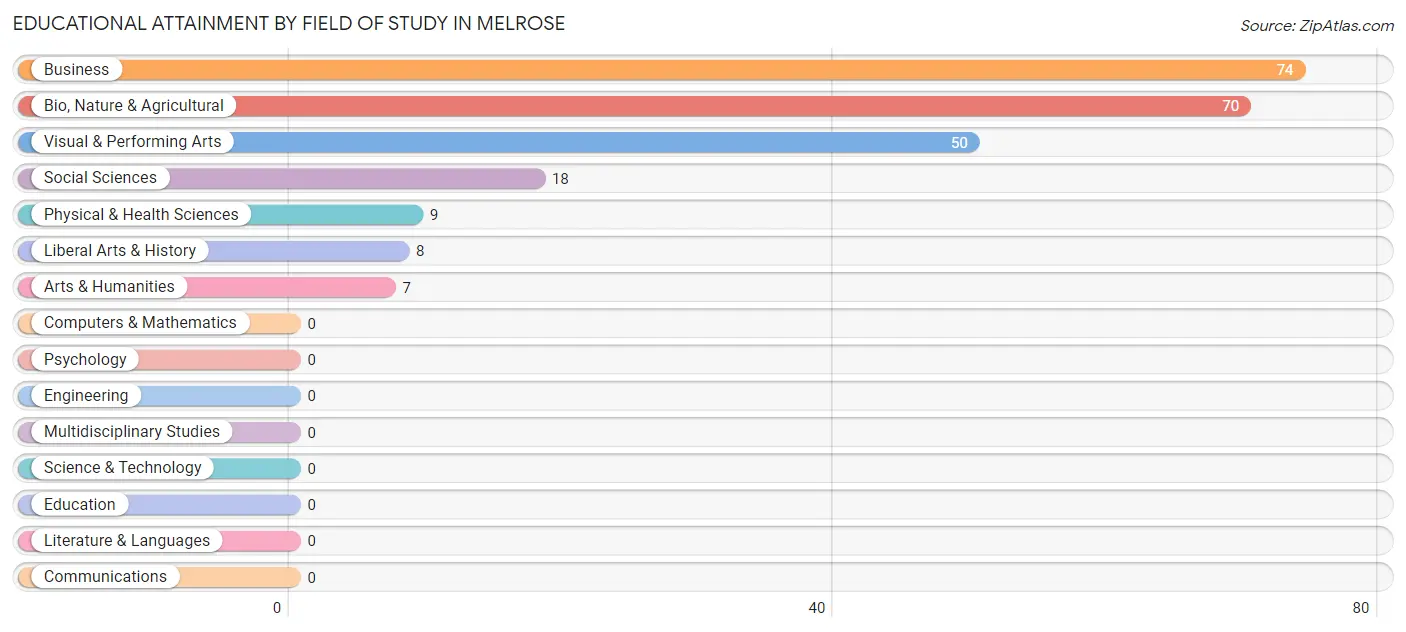
| Field of Study | # Graduates | % Graduates |
| Computers & Mathematics | 0 | 0.0% |
| Bio, Nature & Agricultural | 70 | 29.7% |
| Physical & Health Sciences | 9 | 3.8% |
| Psychology | 0 | 0.0% |
| Social Sciences | 18 | 7.6% |
| Engineering | 0 | 0.0% |
| Multidisciplinary Studies | 0 | 0.0% |
| Science & Technology | 0 | 0.0% |
| Business | 74 | 31.4% |
| Education | 0 | 0.0% |
| Literature & Languages | 0 | 0.0% |
| Liberal Arts & History | 8 | 3.4% |
| Visual & Performing Arts | 50 | 21.2% |
| Communications | 0 | 0.0% |
| Arts & Humanities | 7 | 3.0% |
| Total | 236 | 100.0% |
Transportation & Commute in Melrose
Vehicle Availability by Sex in Melrose
The most prevalent vehicle ownership categories in Melrose are males with 3 vehicles (82, accounting for 42.7%) and females with 3 vehicles (51, making up 37.4%).
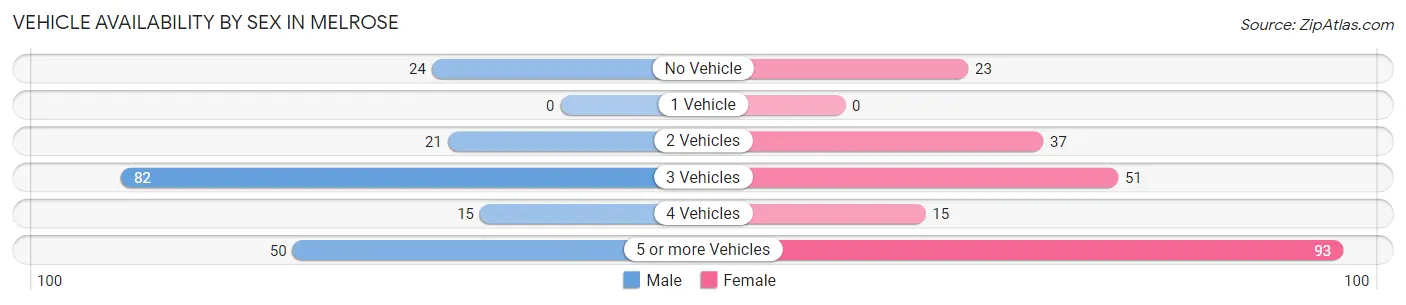
| Vehicles Available | Male | Female |
| No Vehicle | 24 (12.5%) | 23 (10.5%) |
| 1 Vehicle | 0 (0.0%) | 0 (0.0%) |
| 2 Vehicles | 21 (10.9%) | 37 (16.9%) |
| 3 Vehicles | 82 (42.7%) | 51 (23.3%) |
| 4 Vehicles | 15 (7.8%) | 15 (6.9%) |
| 5 or more Vehicles | 50 (26.0%) | 93 (42.5%) |
| Total | 192 (100.0%) | 219 (100.0%) |
Commute Time in Melrose
The most frequently occuring commute durations in Melrose are 10 to 14 minutes (124 commuters, 35.1%), 15 to 19 minutes (123 commuters, 34.8%), and 20 to 24 minutes (64 commuters, 18.1%).
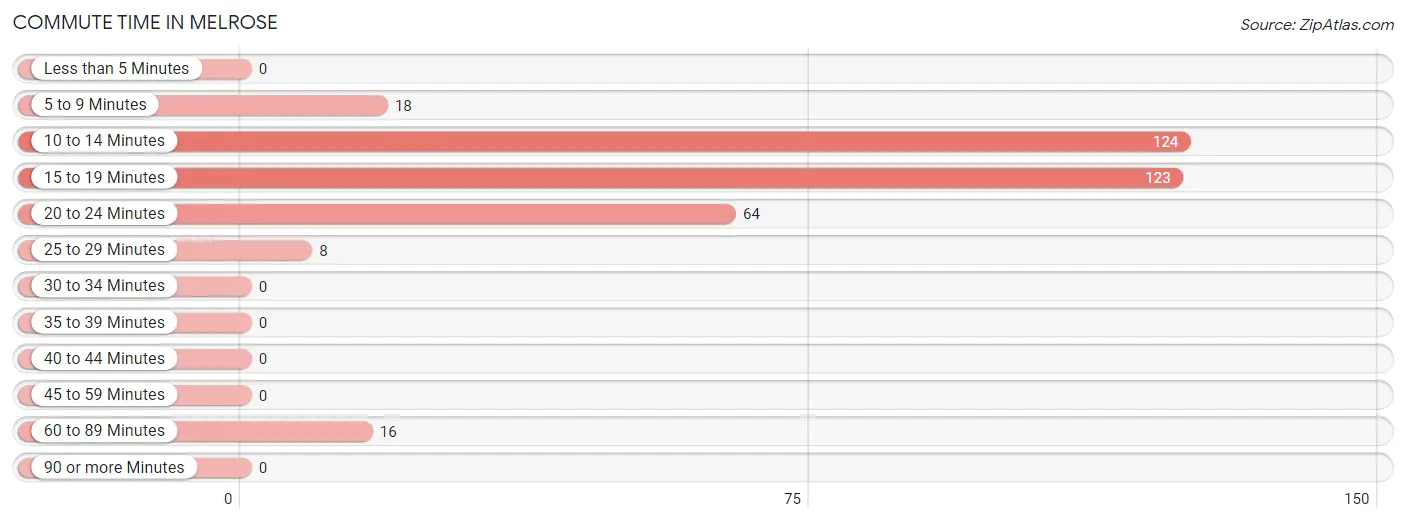
| Commute Time | # Commuters | % Commuters |
| Less than 5 Minutes | 0 | 0.0% |
| 5 to 9 Minutes | 18 | 5.1% |
| 10 to 14 Minutes | 124 | 35.1% |
| 15 to 19 Minutes | 123 | 34.8% |
| 20 to 24 Minutes | 64 | 18.1% |
| 25 to 29 Minutes | 8 | 2.3% |
| 30 to 34 Minutes | 0 | 0.0% |
| 35 to 39 Minutes | 0 | 0.0% |
| 40 to 44 Minutes | 0 | 0.0% |
| 45 to 59 Minutes | 0 | 0.0% |
| 60 to 89 Minutes | 16 | 4.5% |
| 90 or more Minutes | 0 | 0.0% |
Commute Time by Sex in Melrose
The most common commute times in Melrose are 15 to 19 minutes (87 commuters, 49.1%) for males and 10 to 14 minutes (83 commuters, 47.2%) for females.
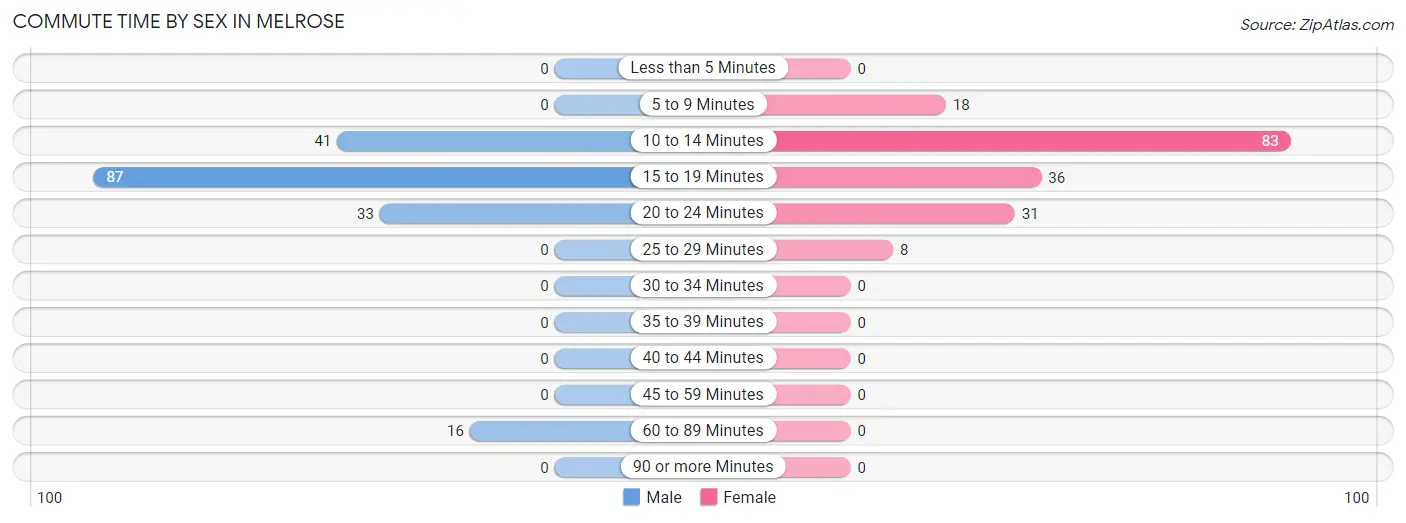
| Commute Time | Male | Female |
| Less than 5 Minutes | 0 (0.0%) | 0 (0.0%) |
| 5 to 9 Minutes | 0 (0.0%) | 18 (10.2%) |
| 10 to 14 Minutes | 41 (23.2%) | 83 (47.2%) |
| 15 to 19 Minutes | 87 (49.1%) | 36 (20.4%) |
| 20 to 24 Minutes | 33 (18.6%) | 31 (17.6%) |
| 25 to 29 Minutes | 0 (0.0%) | 8 (4.5%) |
| 30 to 34 Minutes | 0 (0.0%) | 0 (0.0%) |
| 35 to 39 Minutes | 0 (0.0%) | 0 (0.0%) |
| 40 to 44 Minutes | 0 (0.0%) | 0 (0.0%) |
| 45 to 59 Minutes | 0 (0.0%) | 0 (0.0%) |
| 60 to 89 Minutes | 16 (9.0%) | 0 (0.0%) |
| 90 or more Minutes | 0 (0.0%) | 0 (0.0%) |
Time of Departure to Work by Sex in Melrose
The most frequent times of departure to work in Melrose are 5:00 AM to 5:29 AM (87, 49.1%) for males and 8:30 AM to 8:59 AM (26, 14.8%) for females.
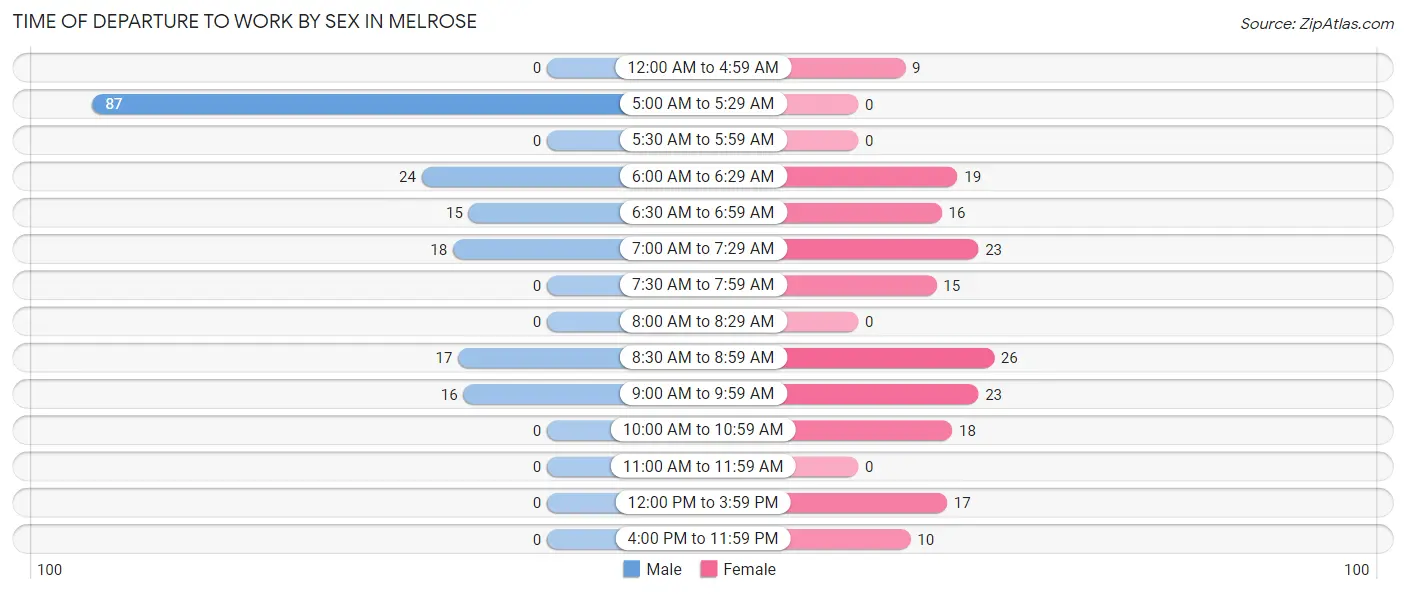
| Time of Departure | Male | Female |
| 12:00 AM to 4:59 AM | 0 (0.0%) | 9 (5.1%) |
| 5:00 AM to 5:29 AM | 87 (49.1%) | 0 (0.0%) |
| 5:30 AM to 5:59 AM | 0 (0.0%) | 0 (0.0%) |
| 6:00 AM to 6:29 AM | 24 (13.6%) | 19 (10.8%) |
| 6:30 AM to 6:59 AM | 15 (8.5%) | 16 (9.1%) |
| 7:00 AM to 7:29 AM | 18 (10.2%) | 23 (13.1%) |
| 7:30 AM to 7:59 AM | 0 (0.0%) | 15 (8.5%) |
| 8:00 AM to 8:29 AM | 0 (0.0%) | 0 (0.0%) |
| 8:30 AM to 8:59 AM | 17 (9.6%) | 26 (14.8%) |
| 9:00 AM to 9:59 AM | 16 (9.0%) | 23 (13.1%) |
| 10:00 AM to 10:59 AM | 0 (0.0%) | 18 (10.2%) |
| 11:00 AM to 11:59 AM | 0 (0.0%) | 0 (0.0%) |
| 12:00 PM to 3:59 PM | 0 (0.0%) | 17 (9.7%) |
| 4:00 PM to 11:59 PM | 0 (0.0%) | 10 (5.7%) |
| Total | 177 (100.0%) | 176 (100.0%) |
Housing Occupancy in Melrose
Occupancy by Ownership in Melrose
Of the total 335 dwellings in Melrose, owner-occupied units account for 297 (88.7%), while renter-occupied units make up 38 (11.3%).
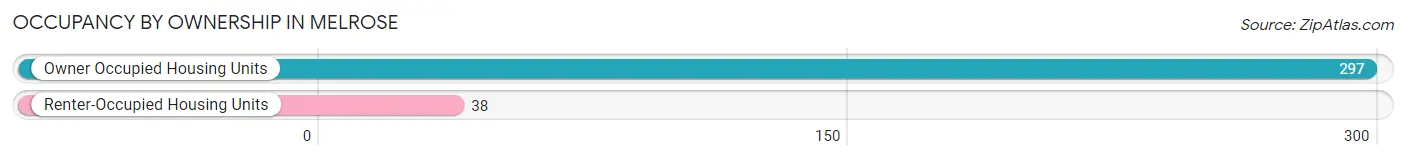
| Occupancy | # Housing Units | % Housing Units |
| Owner Occupied Housing Units | 297 | 88.7% |
| Renter-Occupied Housing Units | 38 | 11.3% |
| Total Occupied Housing Units | 335 | 100.0% |
Occupancy by Household Size in Melrose
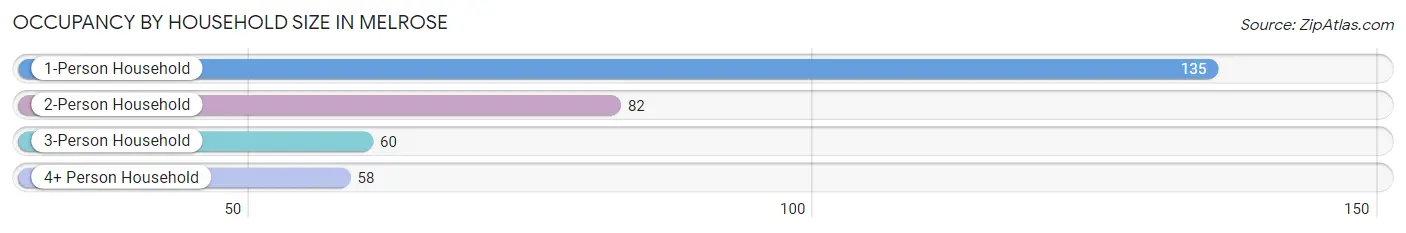
| Household Size | # Housing Units | % Housing Units |
| 1-Person Household | 135 | 40.3% |
| 2-Person Household | 82 | 24.5% |
| 3-Person Household | 60 | 17.9% |
| 4+ Person Household | 58 | 17.3% |
| Total Housing Units | 335 | 100.0% |
Occupancy by Ownership by Household Size in Melrose
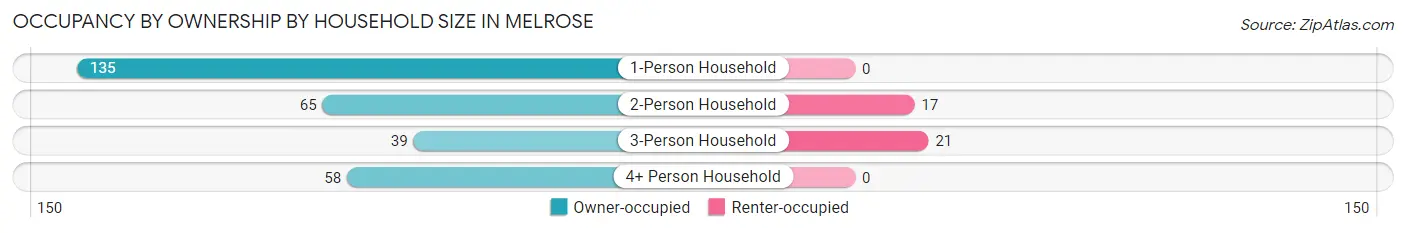
| Household Size | Owner-occupied | Renter-occupied |
| 1-Person Household | 135 (100.0%) | 0 (0.0%) |
| 2-Person Household | 65 (79.3%) | 17 (20.7%) |
| 3-Person Household | 39 (65.0%) | 21 (35.0%) |
| 4+ Person Household | 58 (100.0%) | 0 (0.0%) |
| Total Housing Units | 297 (88.7%) | 38 (11.3%) |
Occupancy by Educational Attainment in Melrose
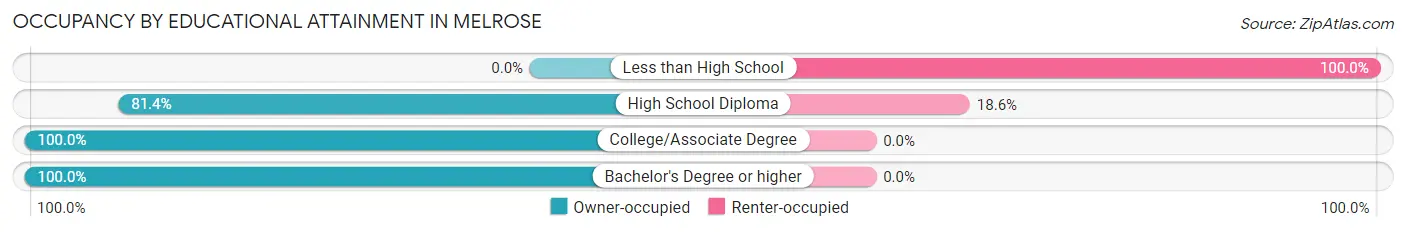
| Household Size | Owner-occupied | Renter-occupied |
| Less than High School | 0 (0.0%) | 17 (100.0%) |
| High School Diploma | 92 (81.4%) | 21 (18.6%) |
| College/Associate Degree | 91 (100.0%) | 0 (0.0%) |
| Bachelor's Degree or higher | 114 (100.0%) | 0 (0.0%) |
Occupancy by Age of Householder in Melrose
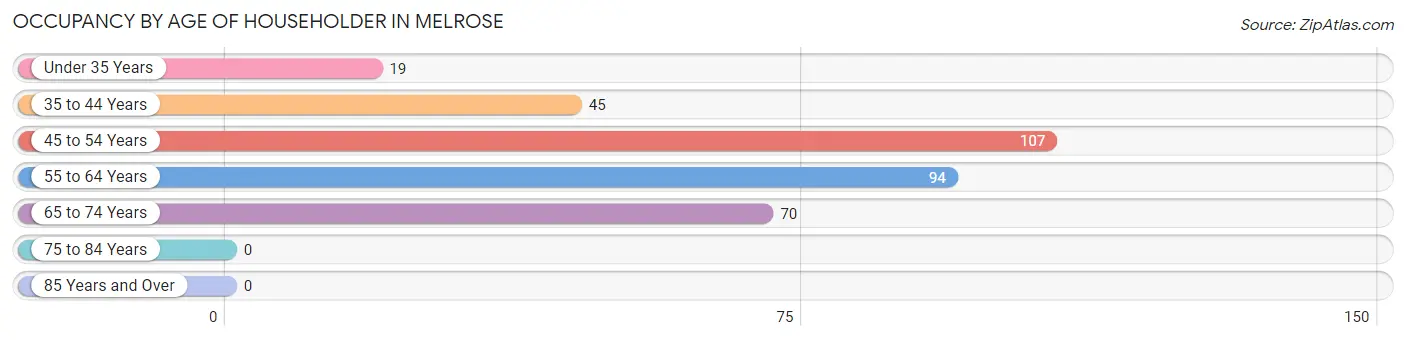
| Age Bracket | # Households | % Households |
| Under 35 Years | 19 | 5.7% |
| 35 to 44 Years | 45 | 13.4% |
| 45 to 54 Years | 107 | 31.9% |
| 55 to 64 Years | 94 | 28.1% |
| 65 to 74 Years | 70 | 20.9% |
| 75 to 84 Years | 0 | 0.0% |
| 85 Years and Over | 0 | 0.0% |
| Total | 335 | 100.0% |
Housing Finances in Melrose
Median Income by Occupancy in Melrose
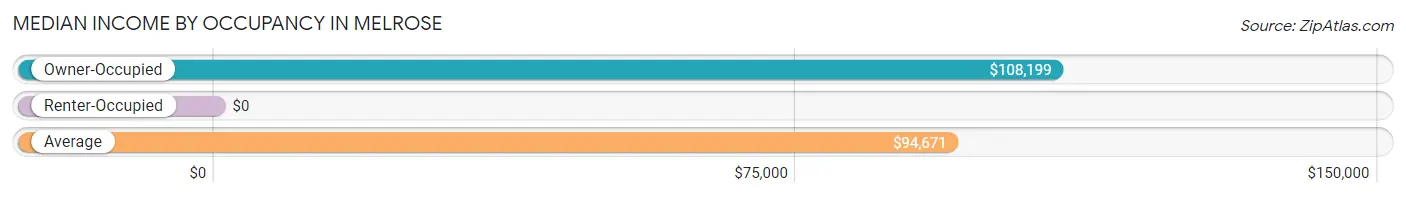
| Occupancy Type | # Households | Median Income |
| Owner-Occupied | 297 (88.7%) | $108,199 |
| Renter-Occupied | 38 (11.3%) | $0 |
| Average | 335 (100.0%) | $94,671 |
Occupancy by Householder Income Bracket in Melrose
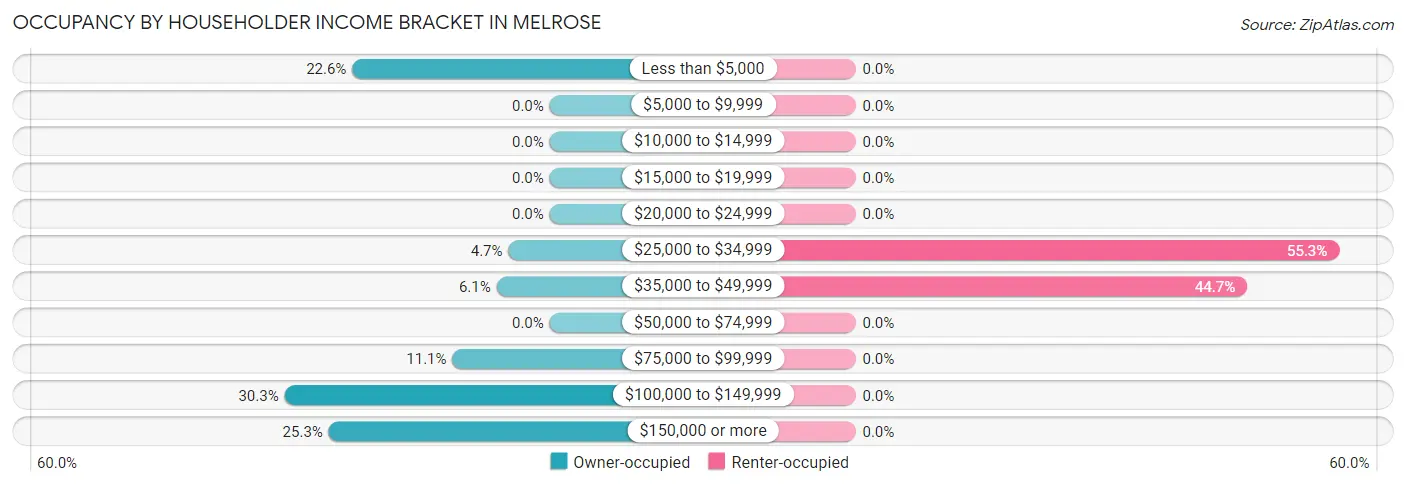
| Income Bracket | Owner-occupied | Renter-occupied |
| Less than $5,000 | 67 (22.6%) | 0 (0.0%) |
| $5,000 to $9,999 | 0 (0.0%) | 0 (0.0%) |
| $10,000 to $14,999 | 0 (0.0%) | 0 (0.0%) |
| $15,000 to $19,999 | 0 (0.0%) | 0 (0.0%) |
| $20,000 to $24,999 | 0 (0.0%) | 0 (0.0%) |
| $25,000 to $34,999 | 14 (4.7%) | 21 (55.3%) |
| $35,000 to $49,999 | 18 (6.1%) | 17 (44.7%) |
| $50,000 to $74,999 | 0 (0.0%) | 0 (0.0%) |
| $75,000 to $99,999 | 33 (11.1%) | 0 (0.0%) |
| $100,000 to $149,999 | 90 (30.3%) | 0 (0.0%) |
| $150,000 or more | 75 (25.3%) | 0 (0.0%) |
| Total | 297 (100.0%) | 38 (100.0%) |
Monthly Housing Cost Tiers in Melrose
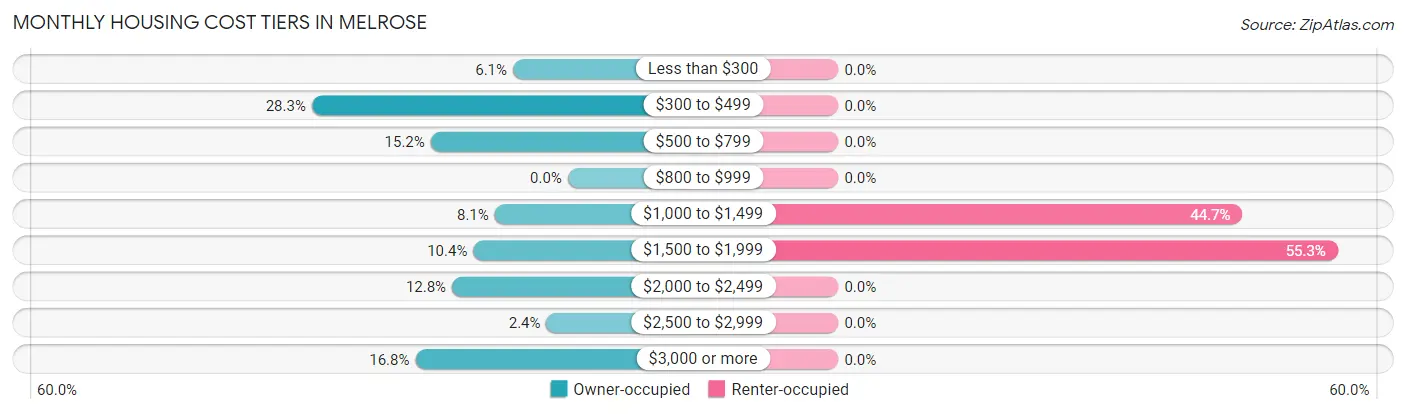
| Monthly Cost | Owner-occupied | Renter-occupied |
| Less than $300 | 18 (6.1%) | 0 (0.0%) |
| $300 to $499 | 84 (28.3%) | 0 (0.0%) |
| $500 to $799 | 45 (15.1%) | 0 (0.0%) |
| $800 to $999 | 0 (0.0%) | 0 (0.0%) |
| $1,000 to $1,499 | 24 (8.1%) | 17 (44.7%) |
| $1,500 to $1,999 | 31 (10.4%) | 21 (55.3%) |
| $2,000 to $2,499 | 38 (12.8%) | 0 (0.0%) |
| $2,500 to $2,999 | 7 (2.4%) | 0 (0.0%) |
| $3,000 or more | 50 (16.8%) | 0 (0.0%) |
| Total | 297 (100.0%) | 38 (100.0%) |
Physical Housing Characteristics in Melrose
Housing Structures in Melrose
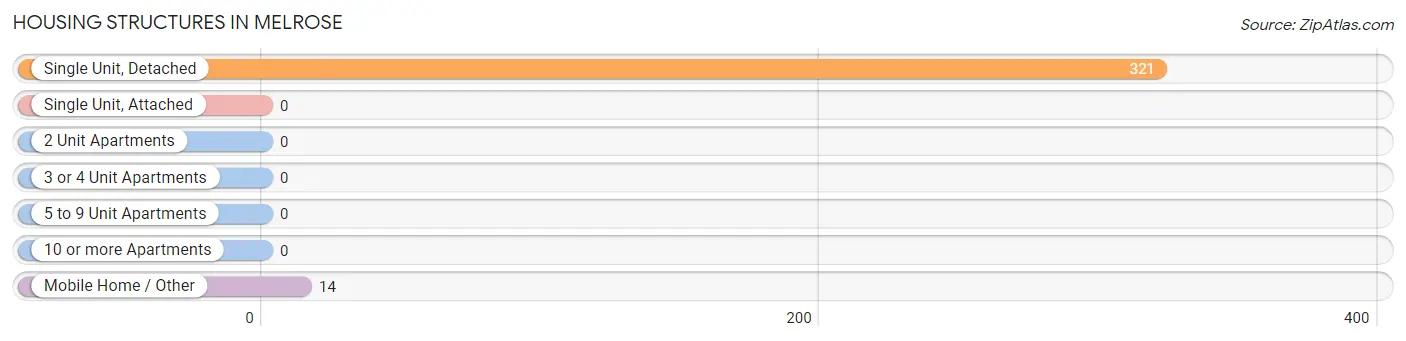
| Structure Type | # Housing Units | % Housing Units |
| Single Unit, Detached | 321 | 95.8% |
| Single Unit, Attached | 0 | 0.0% |
| 2 Unit Apartments | 0 | 0.0% |
| 3 or 4 Unit Apartments | 0 | 0.0% |
| 5 to 9 Unit Apartments | 0 | 0.0% |
| 10 or more Apartments | 0 | 0.0% |
| Mobile Home / Other | 14 | 4.2% |
| Total | 335 | 100.0% |
Housing Structures by Occupancy in Melrose
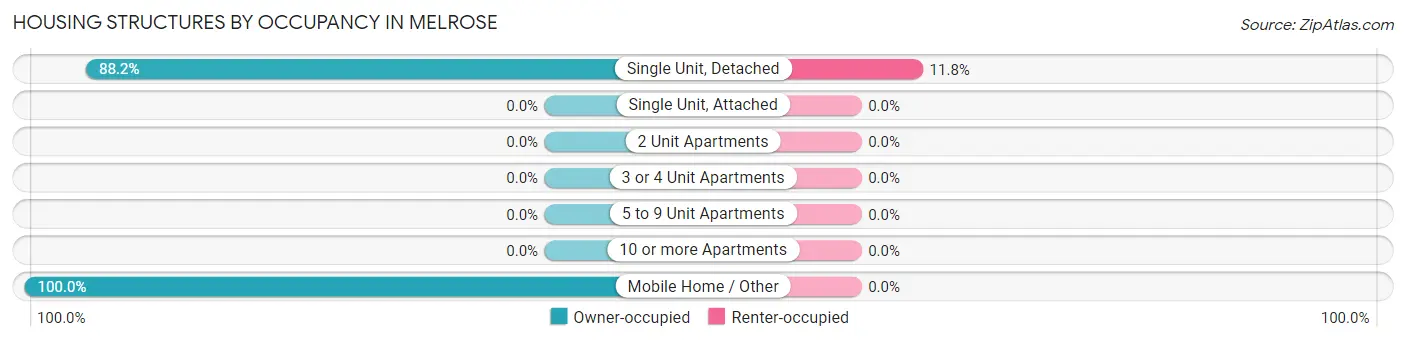
| Structure Type | Owner-occupied | Renter-occupied |
| Single Unit, Detached | 283 (88.2%) | 38 (11.8%) |
| Single Unit, Attached | 0 (0.0%) | 0 (0.0%) |
| 2 Unit Apartments | 0 (0.0%) | 0 (0.0%) |
| 3 or 4 Unit Apartments | 0 (0.0%) | 0 (0.0%) |
| 5 to 9 Unit Apartments | 0 (0.0%) | 0 (0.0%) |
| 10 or more Apartments | 0 (0.0%) | 0 (0.0%) |
| Mobile Home / Other | 14 (100.0%) | 0 (0.0%) |
| Total | 297 (88.7%) | 38 (11.3%) |
Housing Structures by Number of Rooms in Melrose
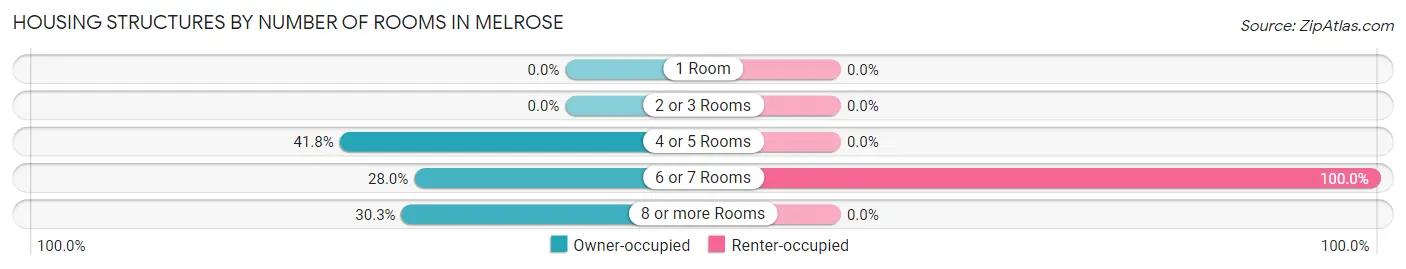
| Number of Rooms | Owner-occupied | Renter-occupied |
| 1 Room | 0 (0.0%) | 0 (0.0%) |
| 2 or 3 Rooms | 0 (0.0%) | 0 (0.0%) |
| 4 or 5 Rooms | 124 (41.7%) | 0 (0.0%) |
| 6 or 7 Rooms | 83 (28.0%) | 38 (100.0%) |
| 8 or more Rooms | 90 (30.3%) | 0 (0.0%) |
| Total | 297 (100.0%) | 38 (100.0%) |
Housing Structure by Heating Type in Melrose
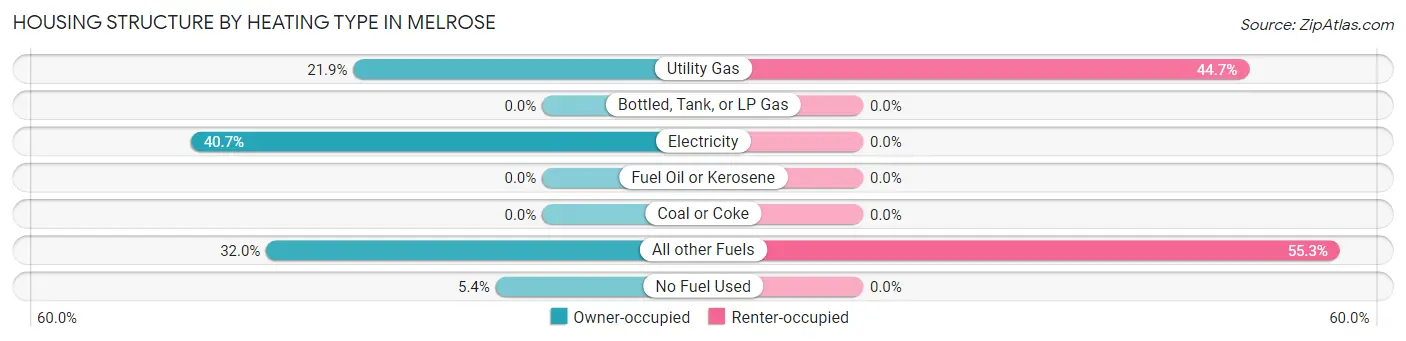
| Heating Type | Owner-occupied | Renter-occupied |
| Utility Gas | 65 (21.9%) | 17 (44.7%) |
| Bottled, Tank, or LP Gas | 0 (0.0%) | 0 (0.0%) |
| Electricity | 121 (40.7%) | 0 (0.0%) |
| Fuel Oil or Kerosene | 0 (0.0%) | 0 (0.0%) |
| Coal or Coke | 0 (0.0%) | 0 (0.0%) |
| All other Fuels | 95 (32.0%) | 21 (55.3%) |
| No Fuel Used | 16 (5.4%) | 0 (0.0%) |
| Total | 297 (100.0%) | 38 (100.0%) |
Household Vehicle Usage in Melrose
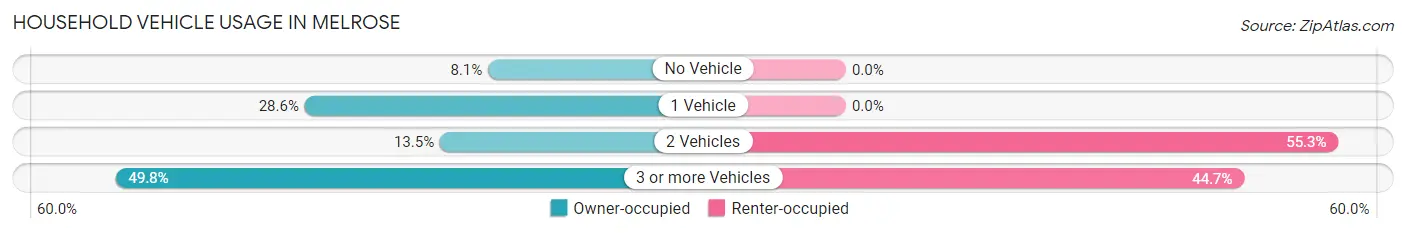
| Vehicles per Household | Owner-occupied | Renter-occupied |
| No Vehicle | 24 (8.1%) | 0 (0.0%) |
| 1 Vehicle | 85 (28.6%) | 0 (0.0%) |
| 2 Vehicles | 40 (13.5%) | 21 (55.3%) |
| 3 or more Vehicles | 148 (49.8%) | 17 (44.7%) |
| Total | 297 (100.0%) | 38 (100.0%) |
Real Estate & Mortgages in Melrose
Real Estate and Mortgage Overview in Melrose
| Characteristic | Without Mortgage | With Mortgage |
| Housing Units | 147 | 150 |
| Median Property Value | $486,500 | $494,100 |
| Median Household Income | - | - |
| Monthly Housing Costs | $391 | $50 |
| Real Estate Taxes | $3,250 | $0 |
Property Value by Mortgage Status in Melrose
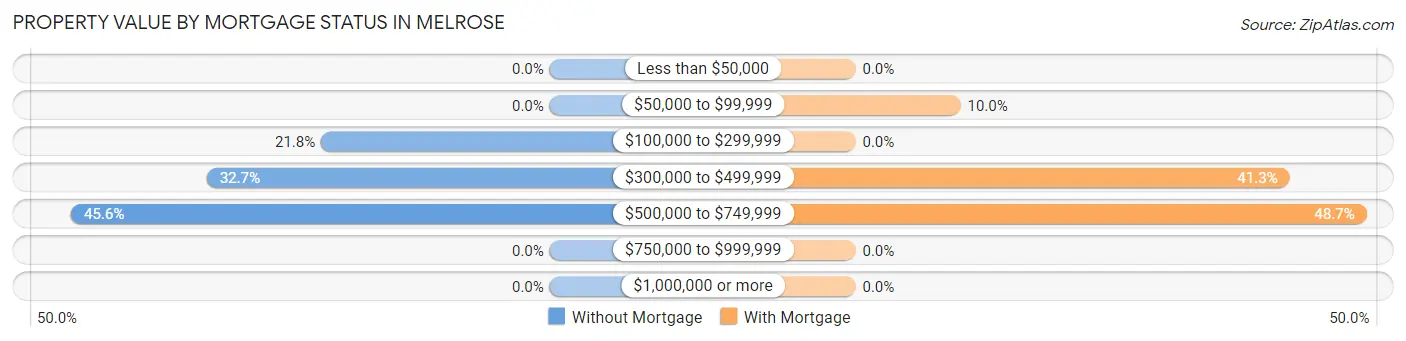
| Property Value | Without Mortgage | With Mortgage |
| Less than $50,000 | 0 (0.0%) | 0 (0.0%) |
| $50,000 to $99,999 | 0 (0.0%) | 15 (10.0%) |
| $100,000 to $299,999 | 32 (21.8%) | 0 (0.0%) |
| $300,000 to $499,999 | 48 (32.7%) | 62 (41.3%) |
| $500,000 to $749,999 | 67 (45.6%) | 73 (48.7%) |
| $750,000 to $999,999 | 0 (0.0%) | 0 (0.0%) |
| $1,000,000 or more | 0 (0.0%) | 0 (0.0%) |
| Total | 147 (100.0%) | 150 (100.0%) |
Household Income by Mortgage Status in Melrose
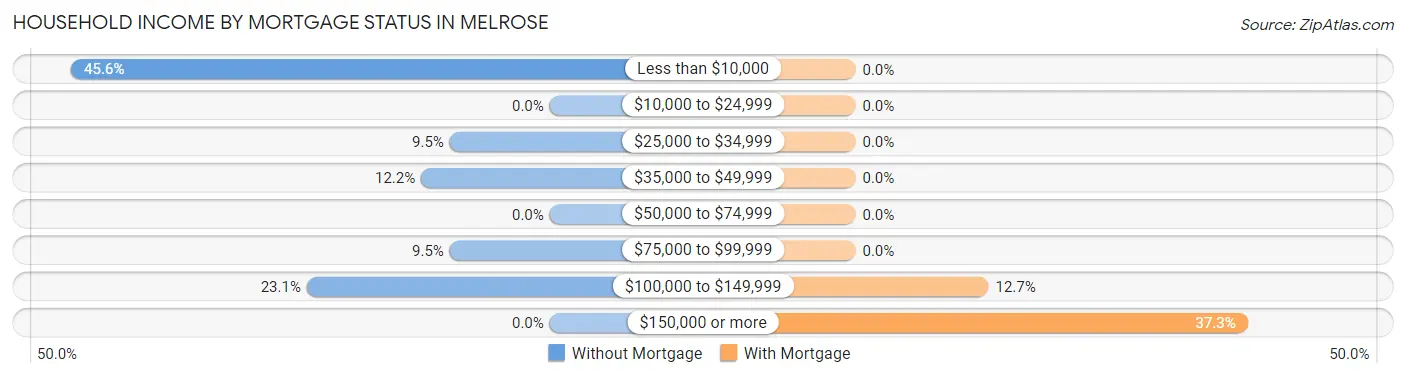
| Household Income | Without Mortgage | With Mortgage |
| Less than $10,000 | 67 (45.6%) | 0 (0.0%) |
| $10,000 to $24,999 | 0 (0.0%) | 0 (0.0%) |
| $25,000 to $34,999 | 14 (9.5%) | 0 (0.0%) |
| $35,000 to $49,999 | 18 (12.2%) | 0 (0.0%) |
| $50,000 to $74,999 | 0 (0.0%) | 0 (0.0%) |
| $75,000 to $99,999 | 14 (9.5%) | 0 (0.0%) |
| $100,000 to $149,999 | 34 (23.1%) | 19 (12.7%) |
| $150,000 or more | 0 (0.0%) | 56 (37.3%) |
| Total | 147 (100.0%) | 150 (100.0%) |
Property Value to Household Income Ratio in Melrose
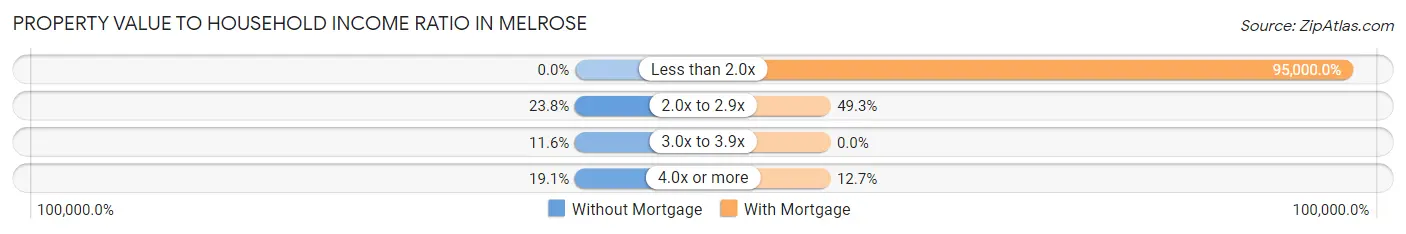
| Value-to-Income Ratio | Without Mortgage | With Mortgage |
| Less than 2.0x | 0 (0.0%) | 142,500 (95,000.0%) |
| 2.0x to 2.9x | 35 (23.8%) | 74 (49.3%) |
| 3.0x to 3.9x | 17 (11.6%) | 0 (0.0%) |
| 4.0x or more | 28 (19.1%) | 19 (12.7%) |
| Total | 147 (100.0%) | 150 (100.0%) |
Real Estate Taxes by Mortgage Status in Melrose
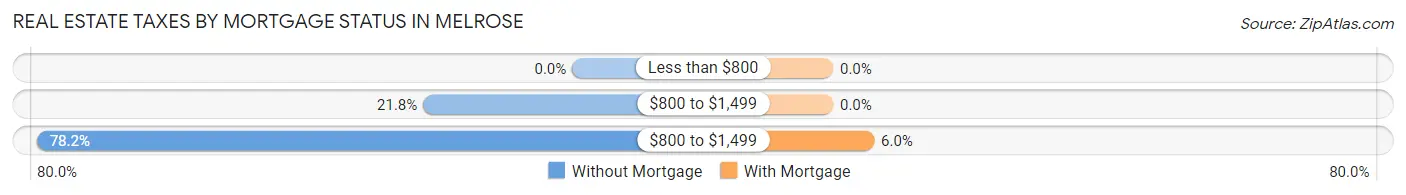
| Property Taxes | Without Mortgage | With Mortgage |
| Less than $800 | 0 (0.0%) | 0 (0.0%) |
| $800 to $1,499 | 32 (21.8%) | 0 (0.0%) |
| $800 to $1,499 | 115 (78.2%) | 9 (6.0%) |
| Total | 147 (100.0%) | 150 (100.0%) |
Health & Disability in Melrose
Health Insurance Coverage by Age in Melrose
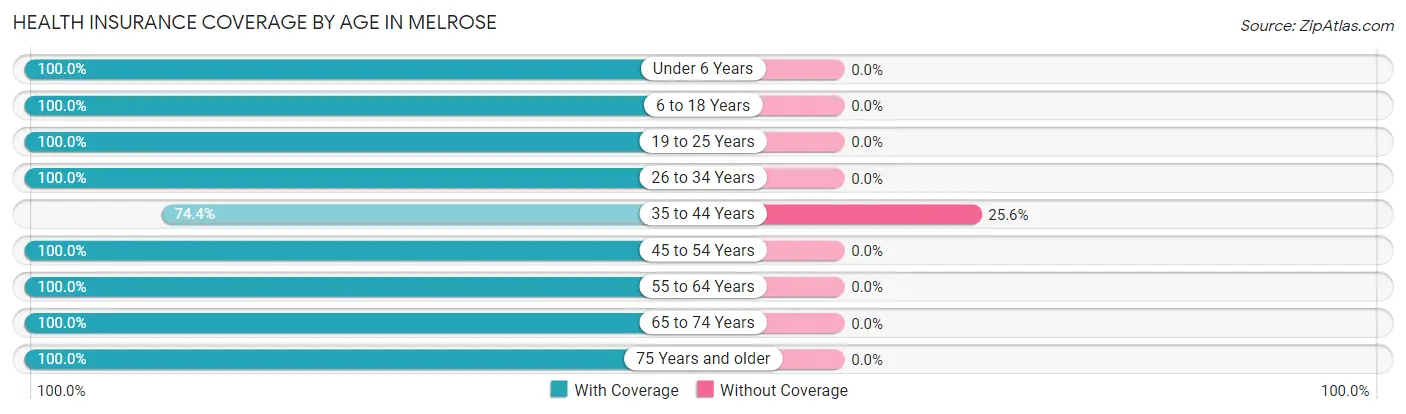
| Age Bracket | With Coverage | Without Coverage |
| Under 6 Years | 64 (100.0%) | 0 (0.0%) |
| 6 to 18 Years | 86 (100.0%) | 0 (0.0%) |
| 19 to 25 Years | 30 (100.0%) | 0 (0.0%) |
| 26 to 34 Years | 105 (100.0%) | 0 (0.0%) |
| 35 to 44 Years | 67 (74.4%) | 23 (25.6%) |
| 45 to 54 Years | 147 (100.0%) | 0 (0.0%) |
| 55 to 64 Years | 141 (100.0%) | 0 (0.0%) |
| 65 to 74 Years | 118 (100.0%) | 0 (0.0%) |
| 75 Years and older | 16 (100.0%) | 0 (0.0%) |
| Total | 774 (97.1%) | 23 (2.9%) |
Health Insurance Coverage by Citizenship Status in Melrose

| Citizenship Status | With Coverage | Without Coverage |
| Native Born | 64 (100.0%) | 0 (0.0%) |
| Foreign Born, Citizen | 86 (100.0%) | 0 (0.0%) |
| Foreign Born, not a Citizen | 30 (100.0%) | 0 (0.0%) |
Health Insurance Coverage by Household Income in Melrose
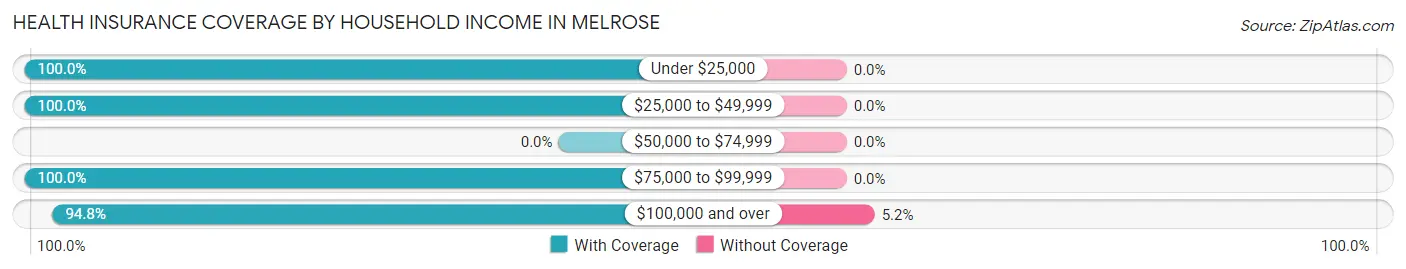
| Household Income | With Coverage | Without Coverage |
| Under $25,000 | 67 (100.0%) | 0 (0.0%) |
| $25,000 to $49,999 | 140 (100.0%) | 0 (0.0%) |
| $50,000 to $74,999 | 0 (0.0%) | 0 (0.0%) |
| $75,000 to $99,999 | 150 (100.0%) | 0 (0.0%) |
| $100,000 and over | 417 (94.8%) | 23 (5.2%) |
Public vs Private Health Insurance Coverage by Age in Melrose
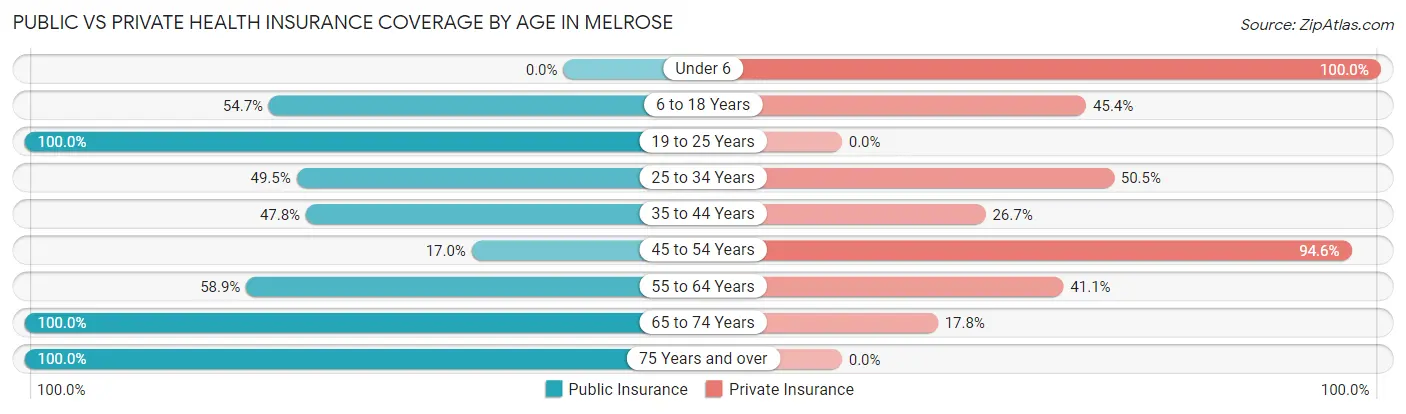
| Age Bracket | Public Insurance | Private Insurance |
| Under 6 | 0 (0.0%) | 64 (100.0%) |
| 6 to 18 Years | 47 (54.6%) | 39 (45.4%) |
| 19 to 25 Years | 30 (100.0%) | 0 (0.0%) |
| 25 to 34 Years | 52 (49.5%) | 53 (50.5%) |
| 35 to 44 Years | 43 (47.8%) | 24 (26.7%) |
| 45 to 54 Years | 25 (17.0%) | 139 (94.6%) |
| 55 to 64 Years | 83 (58.9%) | 58 (41.1%) |
| 65 to 74 Years | 118 (100.0%) | 21 (17.8%) |
| 75 Years and over | 16 (100.0%) | 0 (0.0%) |
| Total | 414 (51.9%) | 398 (49.9%) |
Disability Status by Sex by Age in Melrose
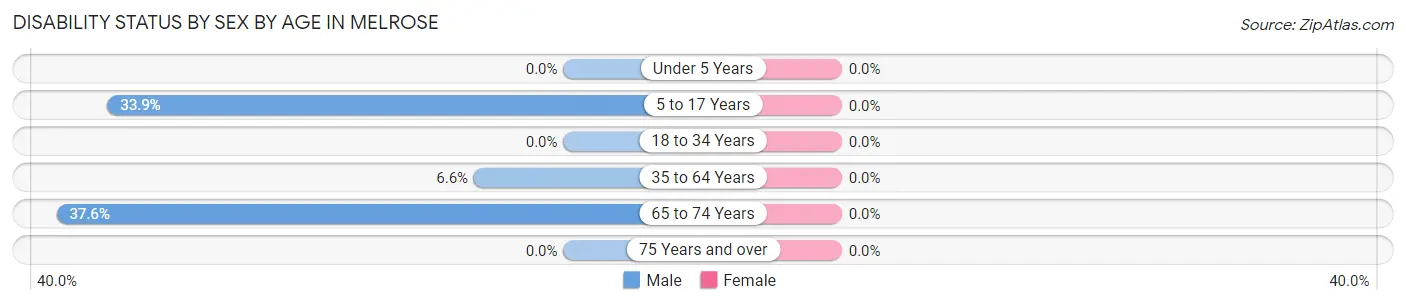
| Age Bracket | Male | Female |
| Under 5 Years | 0 (0.0%) | 0 (0.0%) |
| 5 to 17 Years | 22 (33.9%) | 0 (0.0%) |
| 18 to 34 Years | 0 (0.0%) | 0 (0.0%) |
| 35 to 64 Years | 17 (6.6%) | 0 (0.0%) |
| 65 to 74 Years | 35 (37.6%) | 0 (0.0%) |
| 75 Years and over | 0 (0.0%) | 0 (0.0%) |
Disability Class by Sex by Age in Melrose
Disability Class: Hearing Difficulty
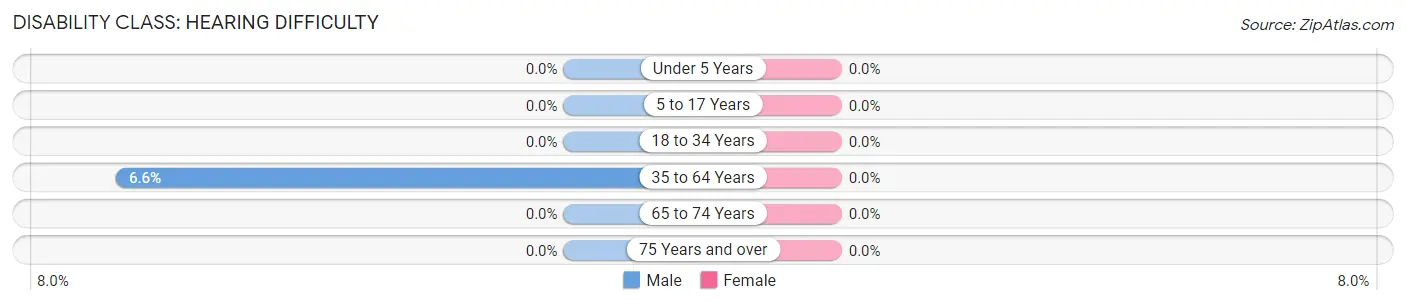
| Age Bracket | Male | Female |
| Under 5 Years | 0 (0.0%) | 0 (0.0%) |
| 5 to 17 Years | 0 (0.0%) | 0 (0.0%) |
| 18 to 34 Years | 0 (0.0%) | 0 (0.0%) |
| 35 to 64 Years | 17 (6.6%) | 0 (0.0%) |
| 65 to 74 Years | 0 (0.0%) | 0 (0.0%) |
| 75 Years and over | 0 (0.0%) | 0 (0.0%) |
Disability Class: Vision Difficulty
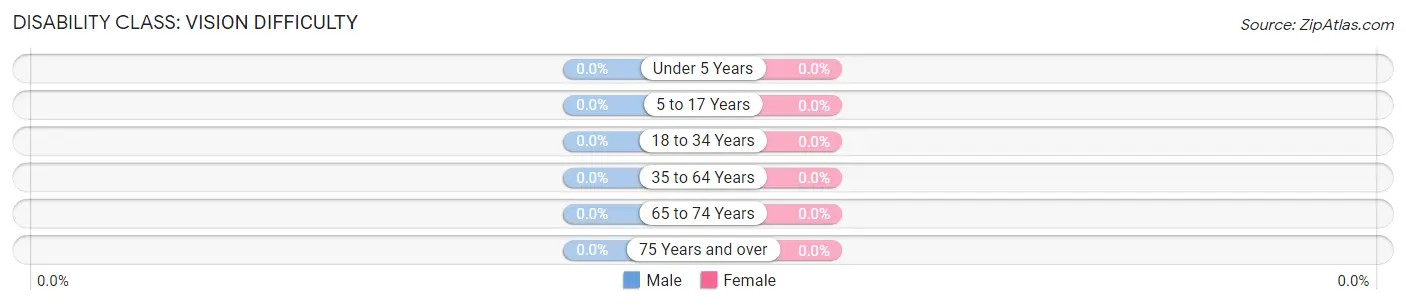
| Age Bracket | Male | Female |
| Under 5 Years | 0 (0.0%) | 0 (0.0%) |
| 5 to 17 Years | 0 (0.0%) | 0 (0.0%) |
| 18 to 34 Years | 0 (0.0%) | 0 (0.0%) |
| 35 to 64 Years | 0 (0.0%) | 0 (0.0%) |
| 65 to 74 Years | 0 (0.0%) | 0 (0.0%) |
| 75 Years and over | 0 (0.0%) | 0 (0.0%) |
Disability Class: Cognitive Difficulty
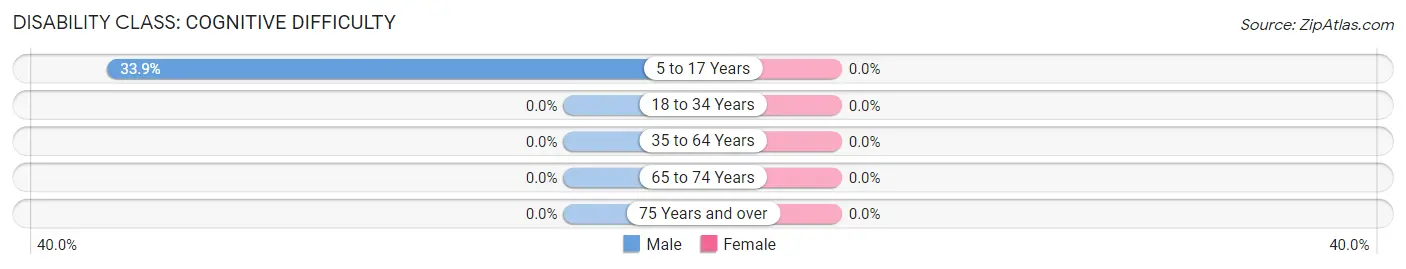
| Age Bracket | Male | Female |
| 5 to 17 Years | 22 (33.9%) | 0 (0.0%) |
| 18 to 34 Years | 0 (0.0%) | 0 (0.0%) |
| 35 to 64 Years | 0 (0.0%) | 0 (0.0%) |
| 65 to 74 Years | 0 (0.0%) | 0 (0.0%) |
| 75 Years and over | 0 (0.0%) | 0 (0.0%) |
Disability Class: Ambulatory Difficulty
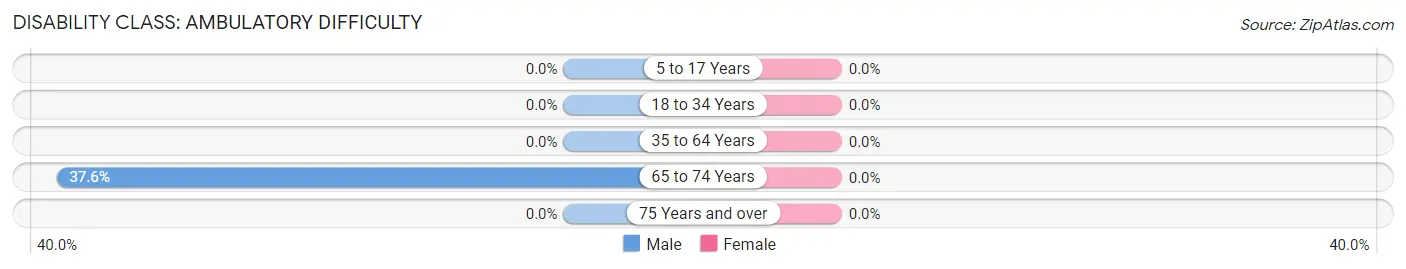
| Age Bracket | Male | Female |
| 5 to 17 Years | 0 (0.0%) | 0 (0.0%) |
| 18 to 34 Years | 0 (0.0%) | 0 (0.0%) |
| 35 to 64 Years | 0 (0.0%) | 0 (0.0%) |
| 65 to 74 Years | 35 (37.6%) | 0 (0.0%) |
| 75 Years and over | 0 (0.0%) | 0 (0.0%) |
Disability Class: Self-Care Difficulty
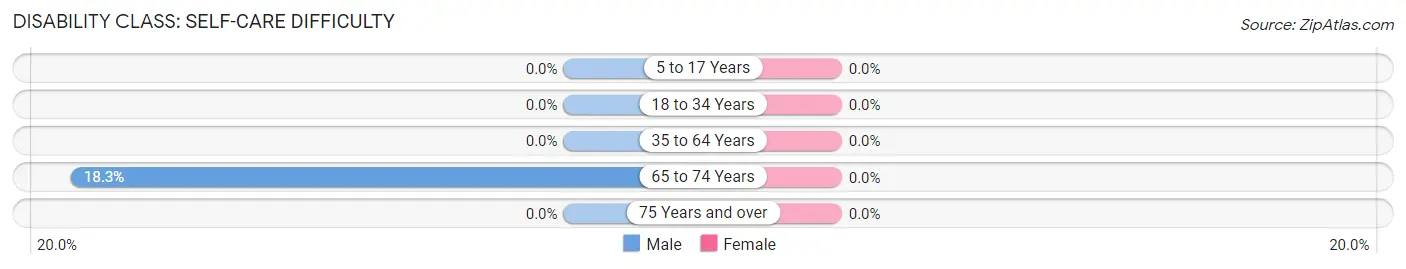
| Age Bracket | Male | Female |
| 5 to 17 Years | 0 (0.0%) | 0 (0.0%) |
| 18 to 34 Years | 0 (0.0%) | 0 (0.0%) |
| 35 to 64 Years | 0 (0.0%) | 0 (0.0%) |
| 65 to 74 Years | 17 (18.3%) | 0 (0.0%) |
| 75 Years and over | 0 (0.0%) | 0 (0.0%) |
Technology Access in Melrose
Computing Device Access in Melrose
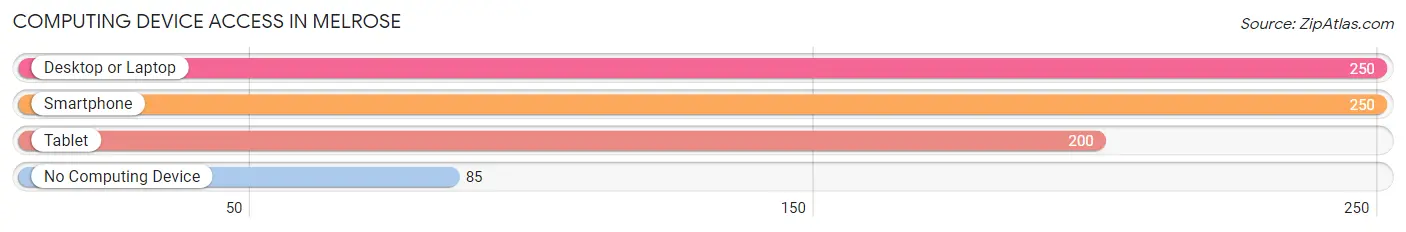
| Device Type | # Households | % Households |
| Desktop or Laptop | 250 | 74.6% |
| Smartphone | 250 | 74.6% |
| Tablet | 200 | 59.7% |
| No Computing Device | 85 | 25.4% |
| Total | 335 | 100.0% |
Internet Access in Melrose
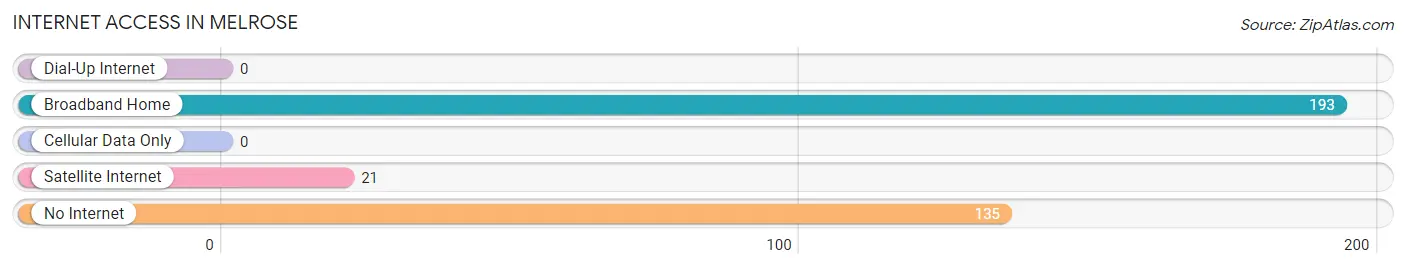
| Internet Type | # Households | % Households |
| Dial-Up Internet | 0 | 0.0% |
| Broadband Home | 193 | 57.6% |
| Cellular Data Only | 0 | 0.0% |
| Satellite Internet | 21 | 6.3% |
| No Internet | 135 | 40.3% |
| Total | 335 | 100.0% |
Melrose Summary
History
Melrose, Oregon is a small unincorporated community located in the foothills of the Cascade Mountains in Lane County. It was founded in the late 1800s by a group of settlers who were looking for a place to settle and start a new life. The area was originally inhabited by the Kalapuya Native American tribe, who had lived in the area for centuries before the settlers arrived.
The first settlers in Melrose were a group of German immigrants who arrived in the late 1800s. They were attracted to the area by its abundance of natural resources, including timber, water, and fertile soil. The settlers quickly established a small farming community and built a school, church, and general store.
The town of Melrose was officially incorporated in 1906. It was named after the nearby Melrose Creek, which was named after a Scottish town. The town quickly grew and prospered, and by the 1920s it had become a thriving agricultural center.
The Great Depression hit Melrose hard, and many of the town’s businesses and farms were forced to close. However, the town was able to survive and eventually recovered. In the 1950s, the town began to experience a resurgence as new businesses and industries moved into the area.
Today, Melrose is a small but vibrant community. It is home to a variety of businesses, including a grocery store, hardware store, and several restaurants. The town also has a post office, library, and several churches.
Geography
Melrose is located in the foothills of the Cascade Mountains in Lane County, Oregon. It is situated at an elevation of 1,400 feet and is surrounded by lush forests and rolling hills. The town is located approximately 25 miles east of Eugene and is accessible via Highway 126.
The climate in Melrose is mild and temperate, with warm summers and cool winters. The average annual temperature is around 50 degrees Fahrenheit. The area receives an average of 40 inches of precipitation per year, with most of it falling in the winter months.
Economy
The economy of Melrose is largely based on agriculture and forestry. The town is home to several farms, which produce a variety of crops, including hay, wheat, and vegetables. The area is also home to several timber companies, which harvest and process timber for use in construction and other industries.
In addition to agriculture and forestry, Melrose is home to several small businesses, including restaurants, retail stores, and service providers. The town also has a post office, library, and several churches.
Demographics
As of the 2010 census, the population of Melrose was 1,093. The racial makeup of the town was 94.3% White, 0.7% African American, 0.3% Native American, 0.7% Asian, 0.1% Pacific Islander, and 3.0% from other races. The median household income was $37,500, and the median age was 44.
Melrose is a small but vibrant community. It is home to a variety of businesses, including a grocery store, hardware store, and several restaurants. The town also has a post office, library, and several churches. The town is also home to a variety of recreational activities, including hiking, fishing, and camping.
Common Questions
What is Per Capita Income in Melrose?
Per Capita income in Melrose is $51,606.
What is the Median Family Income in Melrose?
Median Family Income in Melrose is $92,411.
What is the Median Household income in Melrose?
Median Household Income in Melrose is $94,671.
What is Income or Wage Gap in Melrose?
Income or Wage Gap in Melrose is 53.8%.
Women in Melrose earn 46.2 cents for every dollar earned by a man.
What is Inequality or Gini Index in Melrose?
Inequality or Gini Index in Melrose is 0.54.
What is the Total Population of Melrose?
Total Population of Melrose is 797.
What is the Total Male Population of Melrose?
Total Male Population of Melrose is 478.
What is the Total Female Population of Melrose?
Total Female Population of Melrose is 319.
What is the Ratio of Males per 100 Females in Melrose?
There are 149.84 Males per 100 Females in Melrose.
What is the Ratio of Females per 100 Males in Melrose?
There are 66.74 Females per 100 Males in Melrose.
What is the Median Population Age in Melrose?
Median Population Age in Melrose is 47.5 Years.
What is the Average Family Size in Melrose
Average Family Size in Melrose is 3.2 People.
What is the Average Household Size in Melrose
Average Household Size in Melrose is 2.4 People.
How Large is the Labor Force in Melrose?
There are 444 People in the Labor Forcein in Melrose.
What is the Percentage of People in the Labor Force in Melrose?
66.8% of People are in the Labor Force in Melrose.
What is the Unemployment Rate in Melrose?
Unemployment Rate in Melrose is 2.5%.