The Dalles, OR Map & Demographics
The Dalles Map
The Dalles Overview
$35,644
PER CAPITA INCOME
$79,114
AVG FAMILY INCOME
$59,714
AVG HOUSEHOLD INCOME
32.9%
WAGE / INCOME GAP [ % ]
67.1¢/ $1
WAGE / INCOME GAP [ $ ]
$10,905
FAMILY INCOME DEFICIT
0.50
INEQUALITY / GINI INDEX
15,988
TOTAL POPULATION
7,705
MALE POPULATION
8,283
FEMALE POPULATION
93.02
MALES / 100 FEMALES
107.50
FEMALES / 100 MALES
37.4
MEDIAN AGE
3.1
AVG FAMILY SIZE
2.4
AVG HOUSEHOLD SIZE
7,746
LABOR FORCE [ PEOPLE ]
60.9%
PERCENT IN LABOR FORCE
7.1%
UNEMPLOYMENT RATE
The Dalles Zip Codes
The Dalles Area Codes
Income in The Dalles
Income Overview in The Dalles
Per Capita Income in The Dalles is $35,644, while median incomes of families and households are $79,114 and $59,714 respectively.
| Characteristic | Number | Measure |
| Per Capita Income | 15,988 | $35,644 |
| Median Family Income | 3,798 | $79,114 |
| Mean Family Income | 3,798 | $113,665 |
| Median Household Income | 6,341 | $59,714 |
| Mean Household Income | 6,341 | $87,985 |
| Income Deficit | 3,798 | $10,905 |
| Wage / Income Gap (%) | 15,988 | 32.92% |
| Wage / Income Gap ($) | 15,988 | 67.08¢ per $1 |
| Gini / Inequality Index | 15,988 | 0.50 |
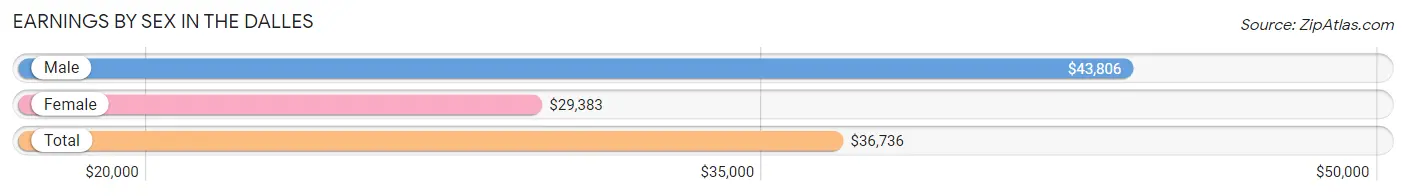
Earnings by Sex in The Dalles
Average Earnings in The Dalles are $36,736, $43,806 for men and $29,383 for women, a difference of 32.9%.
| Sex | Number | Average Earnings |
| Male | 3,946 (48.8%) | $43,806 |
| Female | 4,143 (51.2%) | $29,383 |
| Total | 8,089 (100.0%) | $36,736 |
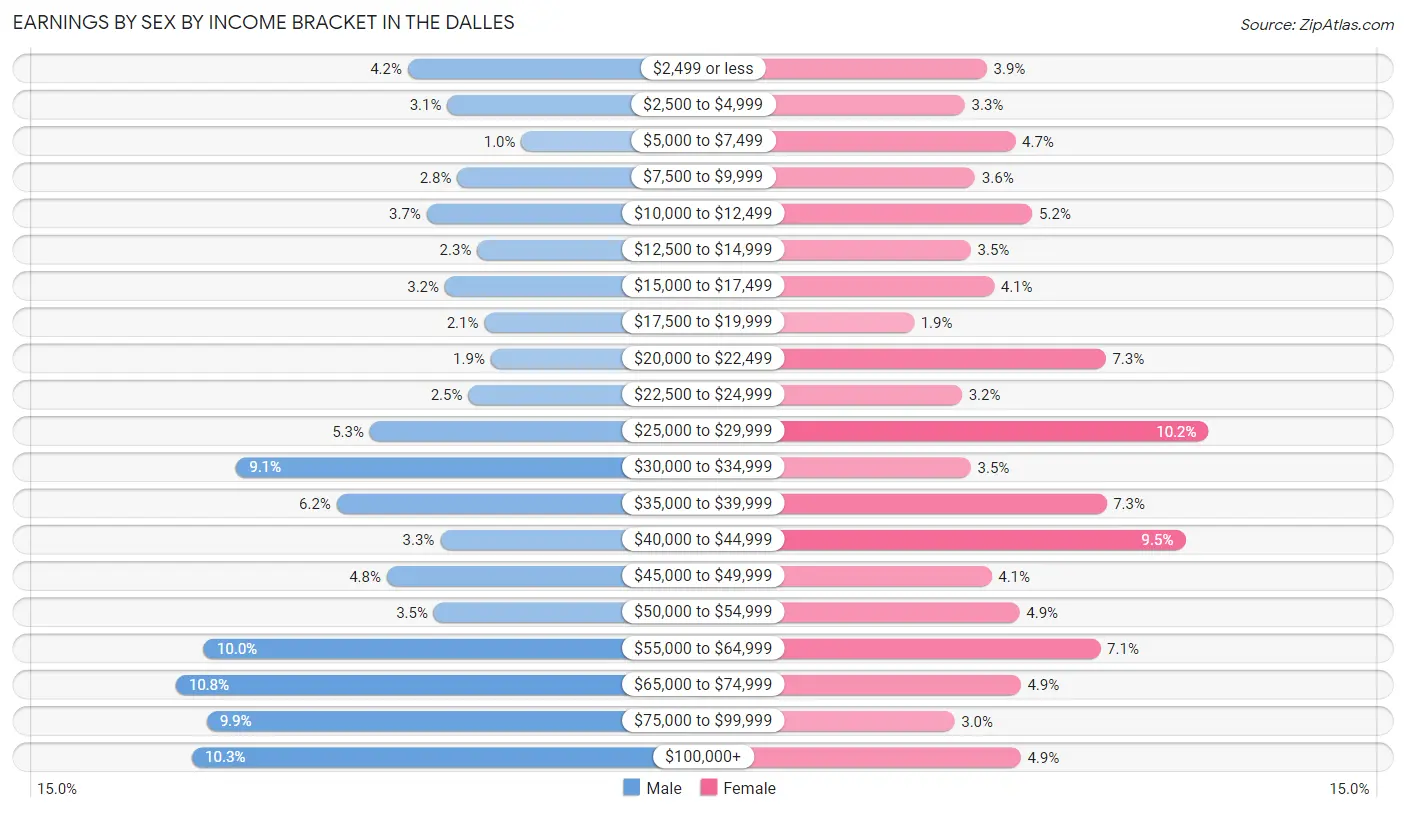
Earnings by Sex by Income Bracket in The Dalles
The most common earnings brackets in The Dalles are $65,000 to $74,999 for men (424 | 10.7%) and $25,000 to $29,999 for women (421 | 10.2%).
| Income | Male | Female |
| $2,499 or less | 167 (4.2%) | 163 (3.9%) |
| $2,500 to $4,999 | 123 (3.1%) | 137 (3.3%) |
| $5,000 to $7,499 | 41 (1.0%) | 196 (4.7%) |
| $7,500 to $9,999 | 112 (2.8%) | 149 (3.6%) |
| $10,000 to $12,499 | 146 (3.7%) | 216 (5.2%) |
| $12,500 to $14,999 | 90 (2.3%) | 144 (3.5%) |
| $15,000 to $17,499 | 126 (3.2%) | 171 (4.1%) |
| $17,500 to $19,999 | 82 (2.1%) | 78 (1.9%) |
| $20,000 to $22,499 | 75 (1.9%) | 301 (7.3%) |
| $22,500 to $24,999 | 100 (2.5%) | 134 (3.2%) |
| $25,000 to $29,999 | 209 (5.3%) | 421 (10.2%) |
| $30,000 to $34,999 | 357 (9.0%) | 144 (3.5%) |
| $35,000 to $39,999 | 246 (6.2%) | 302 (7.3%) |
| $40,000 to $44,999 | 131 (3.3%) | 394 (9.5%) |
| $45,000 to $49,999 | 190 (4.8%) | 168 (4.1%) |
| $50,000 to $54,999 | 138 (3.5%) | 201 (4.9%) |
| $55,000 to $64,999 | 393 (10.0%) | 295 (7.1%) |
| $65,000 to $74,999 | 424 (10.7%) | 202 (4.9%) |
| $75,000 to $99,999 | 390 (9.9%) | 125 (3.0%) |
| $100,000+ | 406 (10.3%) | 202 (4.9%) |
| Total | 3,946 (100.0%) | 4,143 (100.0%) |
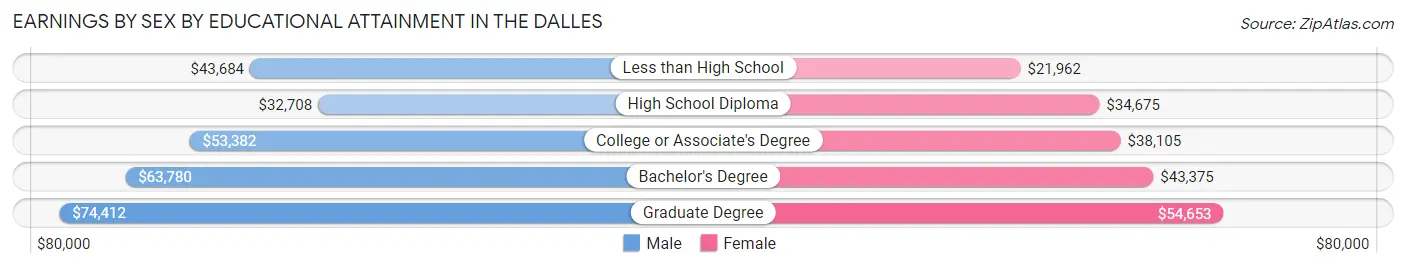
Earnings by Sex by Educational Attainment in The Dalles
Average earnings in The Dalles are $49,574 for men and $37,673 for women, a difference of 24.0%. Men with an educational attainment of graduate degree enjoy the highest average annual earnings of $74,412, while those with high school diploma education earn the least with $32,708. Women with an educational attainment of graduate degree earn the most with the average annual earnings of $54,653, while those with less than high school education have the smallest earnings of $21,962.
| Educational Attainment | Male Income | Female Income |
| Less than High School | $43,684 | $21,962 |
| High School Diploma | $32,708 | $34,675 |
| College or Associate's Degree | $53,382 | $38,105 |
| Bachelor's Degree | $63,780 | $43,375 |
| Graduate Degree | $74,412 | $54,653 |
| Total | $49,574 | $37,673 |
Family Income in The Dalles
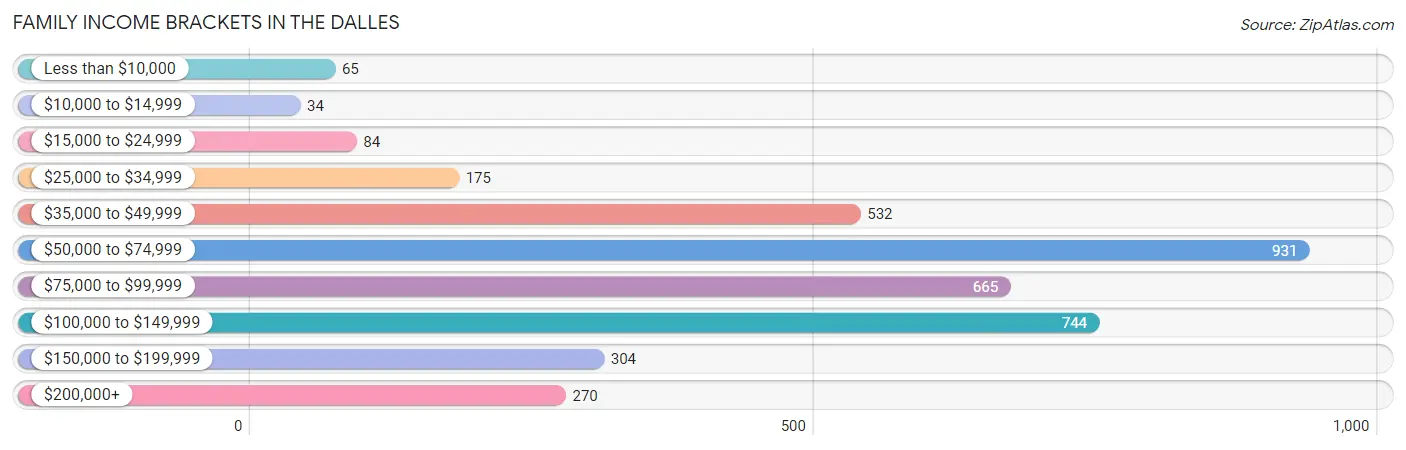
Family Income Brackets in The Dalles
According to the The Dalles family income data, there are 931 families falling into the $50,000 to $74,999 income range, which is the most common income bracket and makes up 24.5% of all families. Conversely, the $10,000 to $14,999 income bracket is the least frequent group with only 34 families (0.9%) belonging to this category.
| Income Bracket | # Families | % Families |
| Less than $10,000 | 65 | 1.7% |
| $10,000 to $14,999 | 34 | 0.9% |
| $15,000 to $24,999 | 84 | 2.2% |
| $25,000 to $34,999 | 175 | 4.6% |
| $35,000 to $49,999 | 532 | 14.0% |
| $50,000 to $74,999 | 931 | 24.5% |
| $75,000 to $99,999 | 665 | 17.5% |
| $100,000 to $149,999 | 744 | 19.6% |
| $150,000 to $199,999 | 304 | 8.0% |
| $200,000+ | 270 | 7.1% |
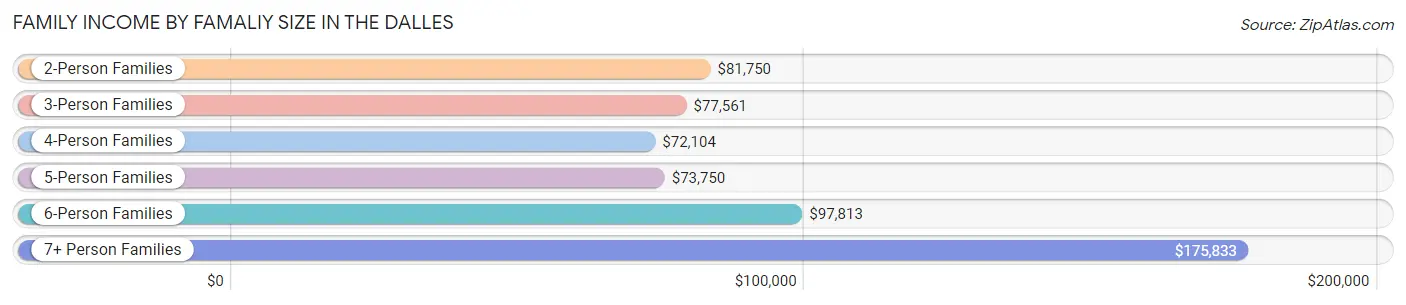
Family Income by Famaliy Size in The Dalles
7+ person families (32 | 0.8%) account for the highest median family income in The Dalles with $175,833 per family, while 2-person families (1,949 | 51.3%) have the highest median income of $40,875 per family member.
| Income Bracket | # Families | Median Income |
| 2-Person Families | 1,949 (51.3%) | $81,750 |
| 3-Person Families | 586 (15.4%) | $77,561 |
| 4-Person Families | 697 (18.3%) | $72,104 |
| 5-Person Families | 365 (9.6%) | $73,750 |
| 6-Person Families | 169 (4.4%) | $97,813 |
| 7+ Person Families | 32 (0.8%) | $175,833 |
| Total | 3,798 (100.0%) | $79,114 |
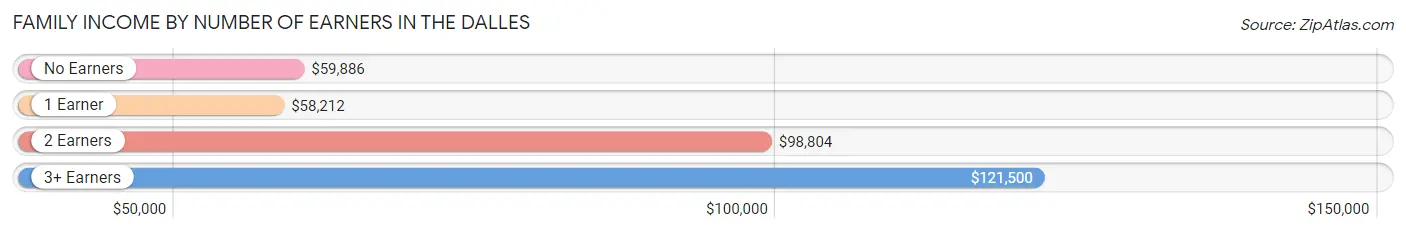
Family Income by Number of Earners in The Dalles
The median family income in The Dalles is $79,114, with families comprising 3+ earners (444) having the highest median family income of $121,500, while families with 1 earner (1,367) have the lowest median family income of $58,212, accounting for 11.7% and 36.0% of families, respectively.
| Number of Earners | # Families | Median Income |
| No Earners | 539 (14.2%) | $59,886 |
| 1 Earner | 1,367 (36.0%) | $58,212 |
| 2 Earners | 1,448 (38.1%) | $98,804 |
| 3+ Earners | 444 (11.7%) | $121,500 |
| Total | 3,798 (100.0%) | $79,114 |
Household Income in The Dalles
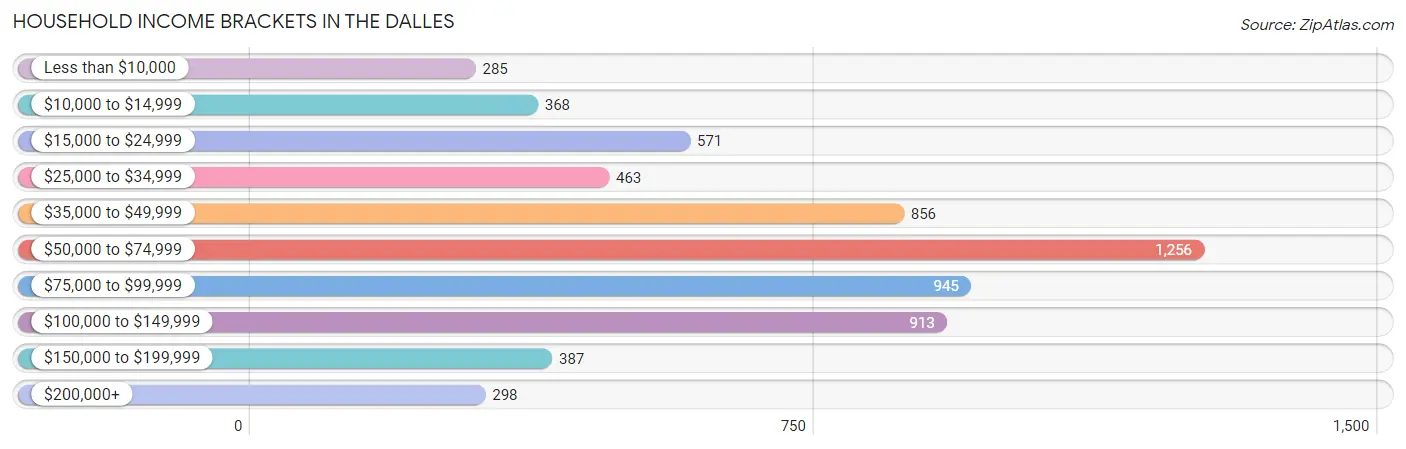
Household Income Brackets in The Dalles
With 1,256 households falling in the category, the $50,000 to $74,999 income range is the most frequent in The Dalles, accounting for 19.8% of all households. In contrast, only 285 households (4.5%) fall into the less than $10,000 income bracket, making it the least populous group.
| Income Bracket | # Households | % Households |
| Less than $10,000 | 285 | 4.5% |
| $10,000 to $14,999 | 368 | 5.8% |
| $15,000 to $24,999 | 571 | 9.0% |
| $25,000 to $34,999 | 463 | 7.3% |
| $35,000 to $49,999 | 856 | 13.5% |
| $50,000 to $74,999 | 1,256 | 19.8% |
| $75,000 to $99,999 | 945 | 14.9% |
| $100,000 to $149,999 | 913 | 14.4% |
| $150,000 to $199,999 | 387 | 6.1% |
| $200,000+ | 298 | 4.7% |
Household Income by Householder Age in The Dalles
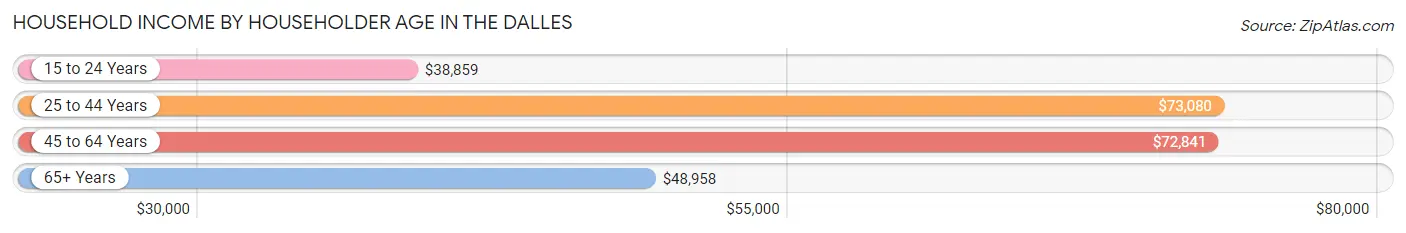
The median household income in The Dalles is $59,714, with the highest median household income of $73,080 found in the 25 to 44 years age bracket for the primary householder. A total of 2,075 households (32.7%) fall into this category. Meanwhile, the 15 to 24 years age bracket for the primary householder has the lowest median household income of $38,859, with 399 households (6.3%) in this group.
| Income Bracket | # Households | Median Income |
| 15 to 24 Years | 399 (6.3%) | $38,859 |
| 25 to 44 Years | 2,075 (32.7%) | $73,080 |
| 45 to 64 Years | 1,861 (29.3%) | $72,841 |
| 65+ Years | 2,006 (31.6%) | $48,958 |
| Total | 6,341 (100.0%) | $59,714 |
Poverty in The Dalles
Income Below Poverty by Sex and Age in The Dalles
With 8.7% poverty level for males and 12.1% for females among the residents of The Dalles, 5 year old males and under 5 year old females are the most vulnerable to poverty, with 10 males (18.2%) and 87 females (22.5%) in their respective age groups living below the poverty level.
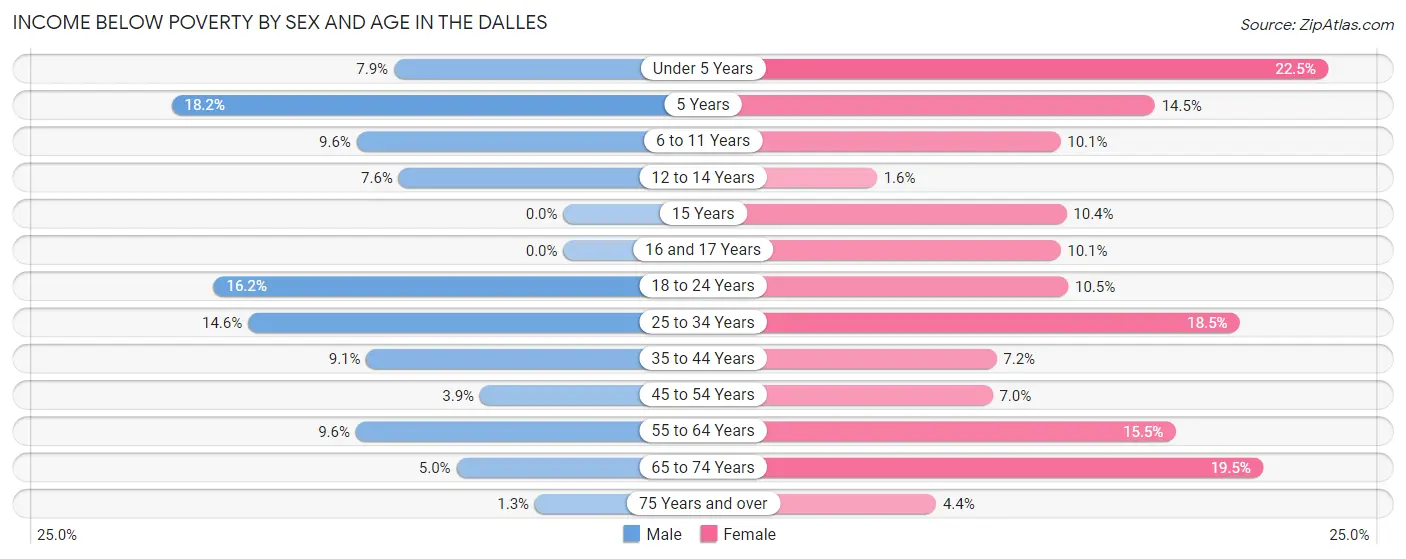
| Age Bracket | Male | Female |
| Under 5 Years | 40 (7.9%) | 87 (22.5%) |
| 5 Years | 10 (18.2%) | 27 (14.5%) |
| 6 to 11 Years | 56 (9.6%) | 56 (10.1%) |
| 12 to 14 Years | 21 (7.6%) | 7 (1.6%) |
| 15 Years | 0 (0.0%) | 10 (10.4%) |
| 16 and 17 Years | 0 (0.0%) | 22 (10.1%) |
| 18 to 24 Years | 87 (16.2%) | 80 (10.5%) |
| 25 to 34 Years | 168 (14.6%) | 207 (18.4%) |
| 35 to 44 Years | 102 (9.1%) | 69 (7.2%) |
| 45 to 54 Years | 27 (3.9%) | 60 (7.0%) |
| 55 to 64 Years | 83 (9.6%) | 149 (15.5%) |
| 65 to 74 Years | 42 (5.0%) | 175 (19.5%) |
| 75 Years and over | 6 (1.3%) | 30 (4.4%) |
| Total | 642 (8.7%) | 979 (12.1%) |
Income Above Poverty by Sex and Age in The Dalles
According to the poverty statistics in The Dalles, males aged 15 years and females aged 12 to 14 years are the age groups that are most secure financially, with 100.0% of males and 98.4% of females in these age groups living above the poverty line.
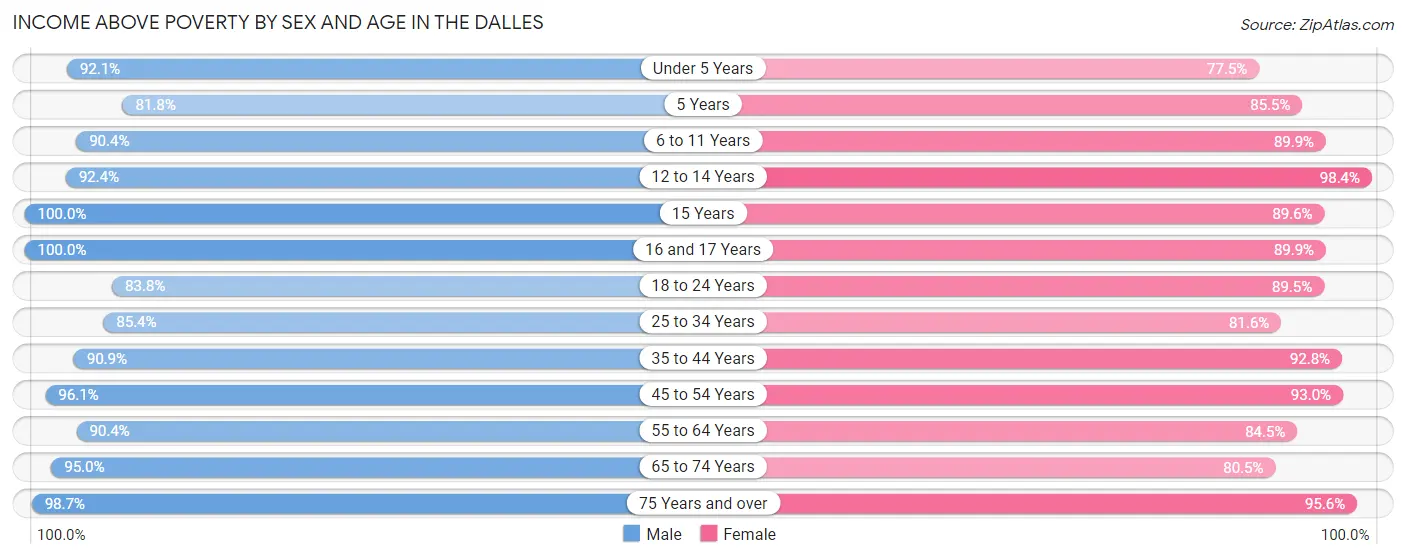
| Age Bracket | Male | Female |
| Under 5 Years | 469 (92.1%) | 299 (77.5%) |
| 5 Years | 45 (81.8%) | 159 (85.5%) |
| 6 to 11 Years | 528 (90.4%) | 496 (89.9%) |
| 12 to 14 Years | 254 (92.4%) | 424 (98.4%) |
| 15 Years | 112 (100.0%) | 86 (89.6%) |
| 16 and 17 Years | 196 (100.0%) | 195 (89.9%) |
| 18 to 24 Years | 449 (83.8%) | 682 (89.5%) |
| 25 to 34 Years | 980 (85.4%) | 915 (81.6%) |
| 35 to 44 Years | 1,014 (90.9%) | 893 (92.8%) |
| 45 to 54 Years | 671 (96.1%) | 798 (93.0%) |
| 55 to 64 Years | 779 (90.4%) | 814 (84.5%) |
| 65 to 74 Years | 804 (95.0%) | 721 (80.5%) |
| 75 Years and over | 449 (98.7%) | 657 (95.6%) |
| Total | 6,750 (91.3%) | 7,139 (87.9%) |
Income Below Poverty Among Married-Couple Families in The Dalles
The poverty statistics for married-couple families in The Dalles show that 2.4% or 66 of the total 2,762 families live below the poverty line. Families with 1 or 2 children have the highest poverty rate of 5.9%, comprising of 42 families. On the other hand, families with no children have the lowest poverty rate of 0.0%, which includes 0 families.
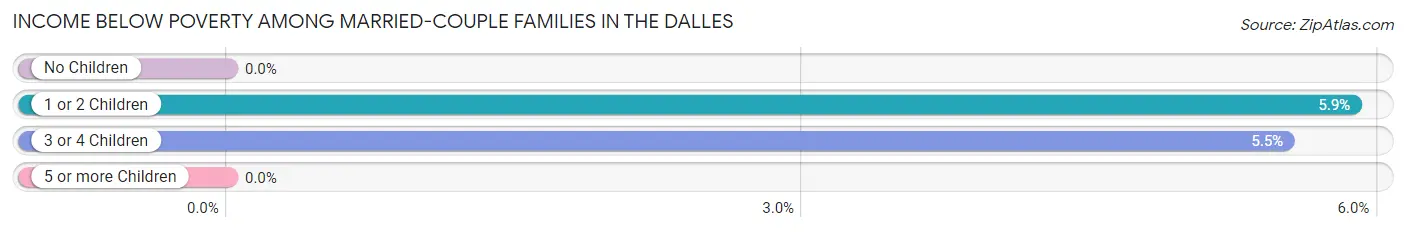
| Children | Above Poverty | Below Poverty |
| No Children | 1,611 (100.0%) | 0 (0.0%) |
| 1 or 2 Children | 674 (94.1%) | 42 (5.9%) |
| 3 or 4 Children | 411 (94.5%) | 24 (5.5%) |
| 5 or more Children | 0 (0.0%) | 0 (0.0%) |
| Total | 2,696 (97.6%) | 66 (2.4%) |
Income Below Poverty Among Single-Parent Households in The Dalles
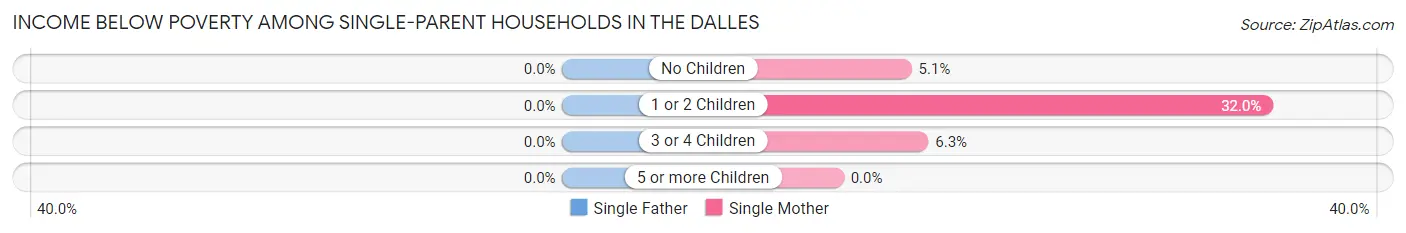
| Children | Single Father | Single Mother |
| No Children | 0 (0.0%) | 17 (5.1%) |
| 1 or 2 Children | 0 (0.0%) | 80 (32.0%) |
| 3 or 4 Children | 0 (0.0%) | 7 (6.3%) |
| 5 or more Children | 0 (0.0%) | 0 (0.0%) |
| Total | 0 (0.0%) | 104 (14.9%) |
Income Below Poverty Among Married-Couple vs Single-Parent Households in The Dalles
The poverty data for The Dalles shows that 66 of the married-couple family households (2.4%) and 104 of the single-parent households (10.0%) are living below the poverty level. Within the married-couple family households, those with 1 or 2 children have the highest poverty rate, with 42 households (5.9%) falling below the poverty line. Among the single-parent households, those with 1 or 2 children have the highest poverty rate, with 80 household (18.5%) living below poverty.
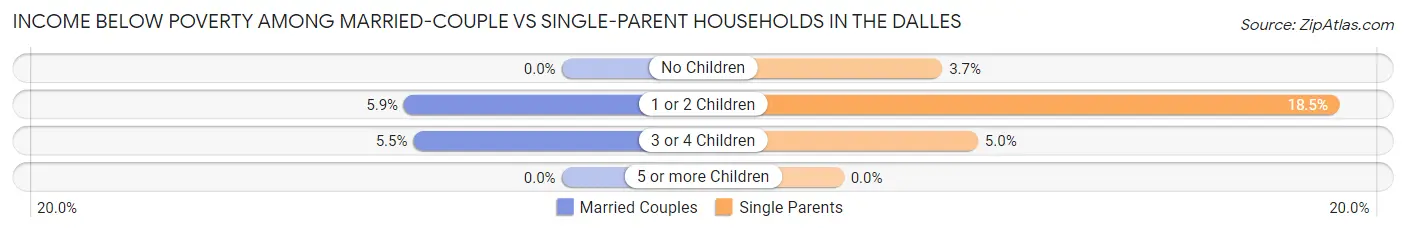
| Children | Married-Couple Families | Single-Parent Households |
| No Children | 0 (0.0%) | 17 (3.7%) |
| 1 or 2 Children | 42 (5.9%) | 80 (18.5%) |
| 3 or 4 Children | 24 (5.5%) | 7 (5.0%) |
| 5 or more Children | 0 (0.0%) | 0 (0.0%) |
| Total | 66 (2.4%) | 104 (10.0%) |
Race in The Dalles
The most populous races in The Dalles are White / Caucasian (13,261 | 82.9%), Hispanic or Latino (3,330 | 20.8%), and Two or more Races (1,922 | 12.0%).
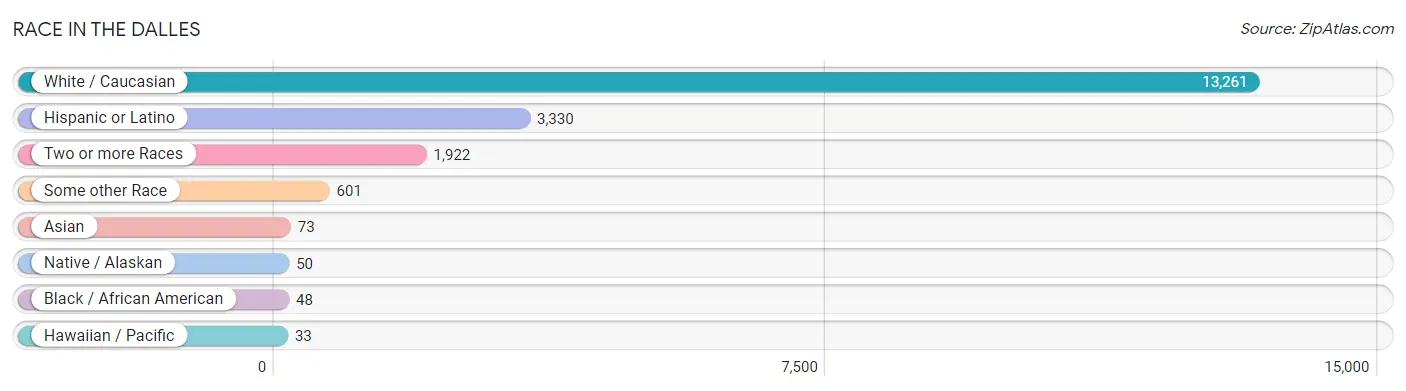
| Race | # Population | % Population |
| Asian | 73 | 0.5% |
| Black / African American | 48 | 0.3% |
| Hawaiian / Pacific | 33 | 0.2% |
| Hispanic or Latino | 3,330 | 20.8% |
| Native / Alaskan | 50 | 0.3% |
| White / Caucasian | 13,261 | 82.9% |
| Two or more Races | 1,922 | 12.0% |
| Some other Race | 601 | 3.8% |
| Total | 15,988 | 100.0% |
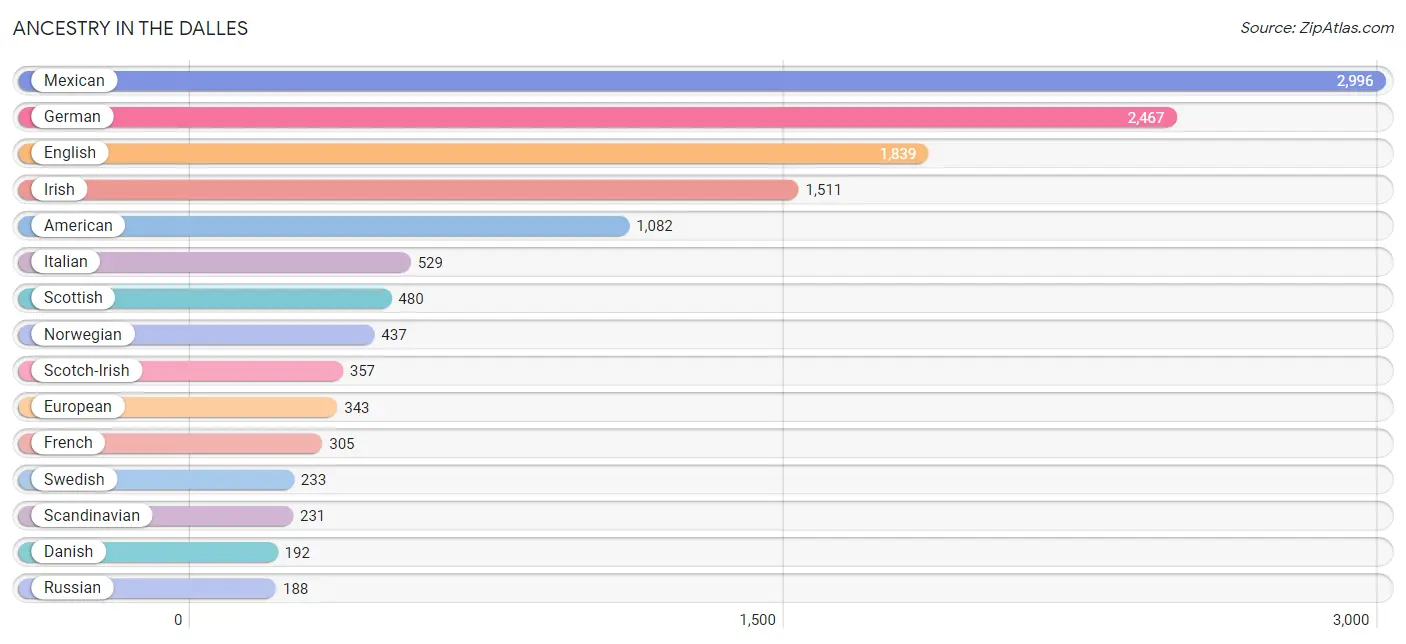
Ancestry in The Dalles
The most populous ancestries reported in The Dalles are Mexican (2,996 | 18.7%), German (2,467 | 15.4%), English (1,839 | 11.5%), Irish (1,511 | 9.5%), and American (1,082 | 6.8%), together accounting for 61.9% of all The Dalles residents.
| Ancestry | # Population | % Population |
| African | 88 | 0.5% |
| American | 1,082 | 6.8% |
| Arab | 34 | 0.2% |
| Armenian | 27 | 0.2% |
| Austrian | 14 | 0.1% |
| Belgian | 9 | 0.1% |
| Bhutanese | 7 | 0.0% |
| British | 110 | 0.7% |
| Bulgarian | 129 | 0.8% |
| Burmese | 133 | 0.8% |
| Cajun | 1 | 0.0% |
| Canadian | 16 | 0.1% |
| Celtic | 9 | 0.1% |
| Central American | 26 | 0.2% |
| Cherokee | 28 | 0.2% |
| Choctaw | 1 | 0.0% |
| Colombian | 9 | 0.1% |
| Creek | 1 | 0.0% |
| Croatian | 11 | 0.1% |
| Cuban | 74 | 0.5% |
| Czech | 161 | 1.0% |
| Danish | 192 | 1.2% |
| Dutch | 169 | 1.1% |
| Eastern European | 64 | 0.4% |
| Egyptian | 12 | 0.1% |
| English | 1,839 | 11.5% |
| European | 343 | 2.1% |
| Finnish | 11 | 0.1% |
| French | 305 | 1.9% |
| French Canadian | 145 | 0.9% |
| German | 2,467 | 15.4% |
| Greek | 15 | 0.1% |
| Guatemalan | 12 | 0.1% |
| Honduran | 1 | 0.0% |
| Hungarian | 7 | 0.0% |
| Icelander | 14 | 0.1% |
| Indian (Asian) | 28 | 0.2% |
| Irish | 1,511 | 9.5% |
| Iroquois | 25 | 0.2% |
| Italian | 529 | 3.3% |
| Korean | 14 | 0.1% |
| Lebanese | 10 | 0.1% |
| Lithuanian | 46 | 0.3% |
| Malaysian | 18 | 0.1% |
| Mexican | 2,996 | 18.7% |
| Navajo | 23 | 0.1% |
| Northern European | 59 | 0.4% |
| Norwegian | 437 | 2.7% |
| Panamanian | 13 | 0.1% |
| Polish | 130 | 0.8% |
| Portuguese | 5 | 0.0% |
| Puerto Rican | 19 | 0.1% |
| Romanian | 3 | 0.0% |
| Russian | 188 | 1.2% |
| Samoan | 28 | 0.2% |
| Scandinavian | 231 | 1.4% |
| Scotch-Irish | 357 | 2.2% |
| Scottish | 480 | 3.0% |
| Serbian | 6 | 0.0% |
| Slavic | 13 | 0.1% |
| Slovak | 8 | 0.1% |
| South American | 9 | 0.1% |
| Spaniard | 125 | 0.8% |
| Sri Lankan | 28 | 0.2% |
| Subsaharan African | 88 | 0.5% |
| Swedish | 233 | 1.5% |
| Swiss | 44 | 0.3% |
| Syrian | 11 | 0.1% |
| Thai | 7 | 0.0% |
| Ukrainian | 28 | 0.2% |
| Welsh | 164 | 1.0% |
| Yakama | 1 | 0.0% | View All 72 Rows |
Immigrants in The Dalles
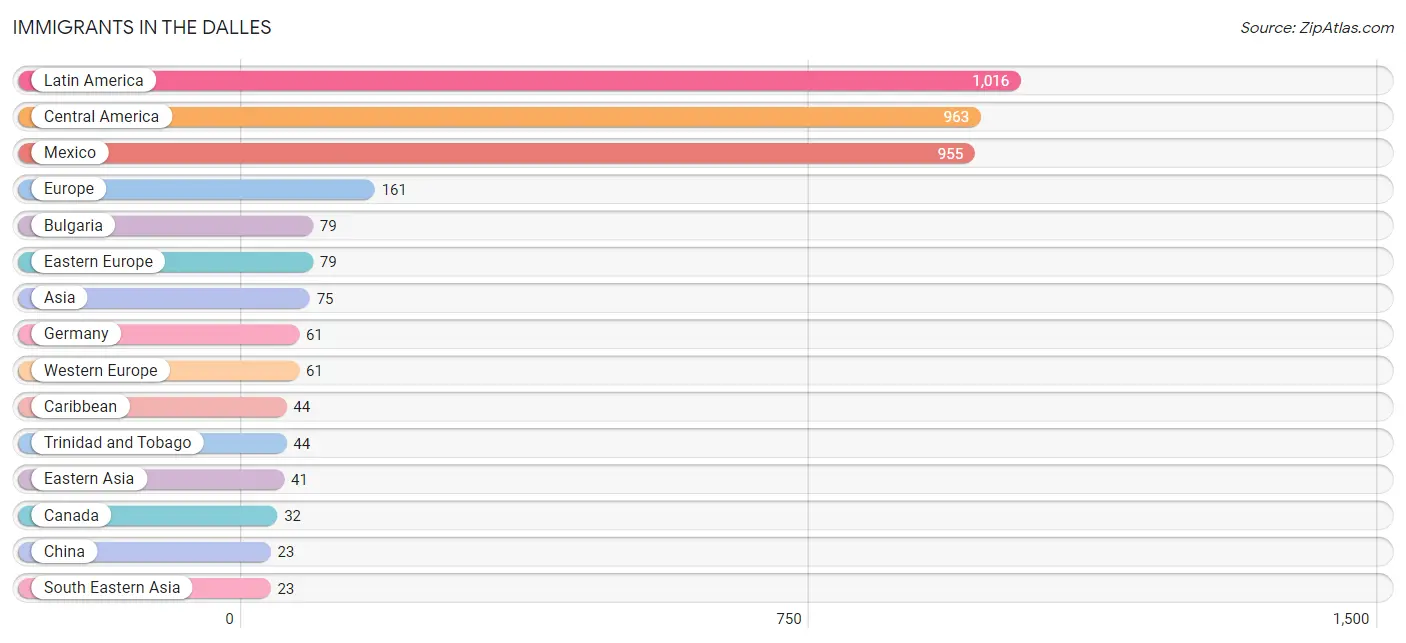
The most numerous immigrant groups reported in The Dalles came from Latin America (1,016 | 6.4%), Central America (963 | 6.0%), Mexico (955 | 6.0%), Europe (161 | 1.0%), and Bulgaria (79 | 0.5%), together accounting for 19.8% of all The Dalles residents.
| Immigration Origin | # Population | % Population |
| Asia | 75 | 0.5% |
| Bulgaria | 79 | 0.5% |
| Canada | 32 | 0.2% |
| Caribbean | 44 | 0.3% |
| Central America | 963 | 6.0% |
| China | 23 | 0.1% |
| Colombia | 9 | 0.1% |
| Denmark | 8 | 0.1% |
| Eastern Asia | 41 | 0.3% |
| Eastern Europe | 79 | 0.5% |
| England | 9 | 0.1% |
| Europe | 161 | 1.0% |
| Fiji | 18 | 0.1% |
| Germany | 61 | 0.4% |
| Guatemala | 7 | 0.0% |
| Honduras | 1 | 0.0% |
| Hong Kong | 14 | 0.1% |
| India | 10 | 0.1% |
| Korea | 18 | 0.1% |
| Laos | 18 | 0.1% |
| Latin America | 1,016 | 6.4% |
| Mexico | 955 | 6.0% |
| Northern Europe | 21 | 0.1% |
| Oceania | 18 | 0.1% |
| Philippines | 5 | 0.0% |
| South America | 9 | 0.1% |
| South Central Asia | 10 | 0.1% |
| South Eastern Asia | 23 | 0.1% |
| Trinidad and Tobago | 44 | 0.3% |
| Western Asia | 1 | 0.0% |
| Western Europe | 61 | 0.4% |
| Yemen | 1 | 0.0% | View All 32 Rows |
Sex and Age in The Dalles
Sex and Age in The Dalles
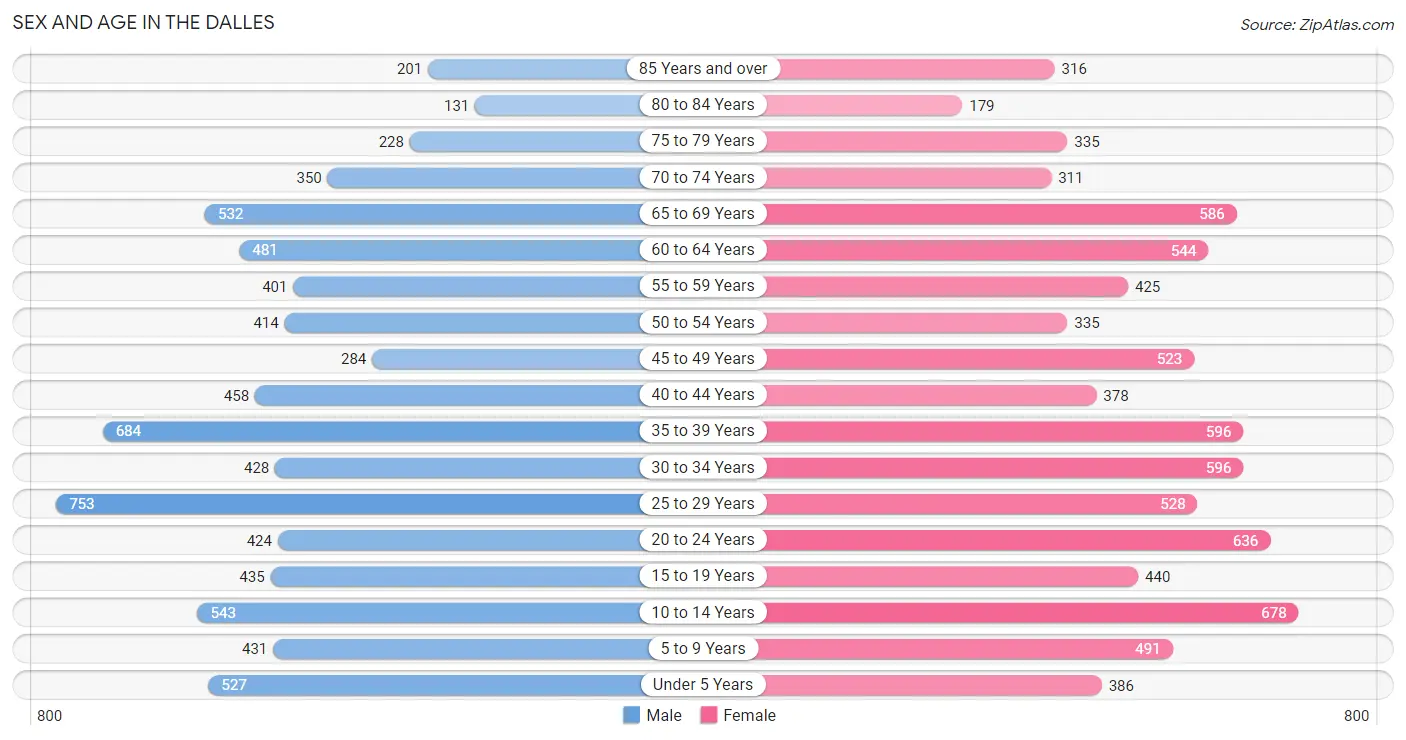
The most populous age groups in The Dalles are 25 to 29 Years (753 | 9.8%) for men and 10 to 14 Years (678 | 8.2%) for women.
| Age Bracket | Male | Female |
| Under 5 Years | 527 (6.8%) | 386 (4.7%) |
| 5 to 9 Years | 431 (5.6%) | 491 (5.9%) |
| 10 to 14 Years | 543 (7.0%) | 678 (8.2%) |
| 15 to 19 Years | 435 (5.7%) | 440 (5.3%) |
| 20 to 24 Years | 424 (5.5%) | 636 (7.7%) |
| 25 to 29 Years | 753 (9.8%) | 528 (6.4%) |
| 30 to 34 Years | 428 (5.6%) | 596 (7.2%) |
| 35 to 39 Years | 684 (8.9%) | 596 (7.2%) |
| 40 to 44 Years | 458 (5.9%) | 378 (4.6%) |
| 45 to 49 Years | 284 (3.7%) | 523 (6.3%) |
| 50 to 54 Years | 414 (5.4%) | 335 (4.0%) |
| 55 to 59 Years | 401 (5.2%) | 425 (5.1%) |
| 60 to 64 Years | 481 (6.2%) | 544 (6.6%) |
| 65 to 69 Years | 532 (6.9%) | 586 (7.1%) |
| 70 to 74 Years | 350 (4.5%) | 311 (3.7%) |
| 75 to 79 Years | 228 (3.0%) | 335 (4.0%) |
| 80 to 84 Years | 131 (1.7%) | 179 (2.2%) |
| 85 Years and over | 201 (2.6%) | 316 (3.8%) |
| Total | 7,705 (100.0%) | 8,283 (100.0%) |
Families and Households in The Dalles
Median Family Size in The Dalles
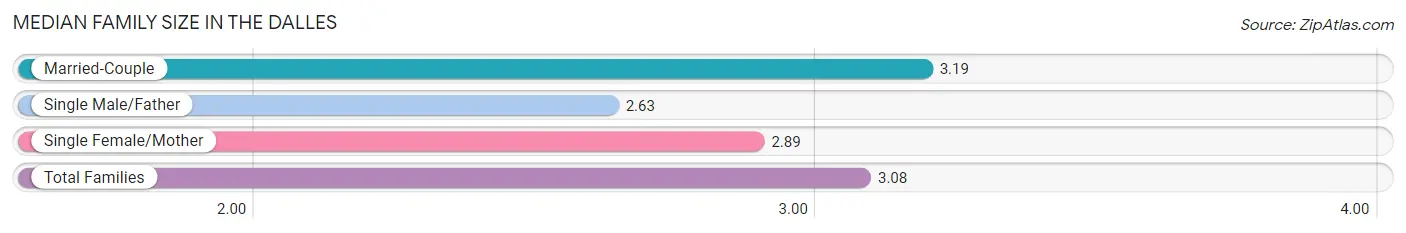
The median family size in The Dalles is 3.08 persons per family, with married-couple families (2,762 | 72.7%) accounting for the largest median family size of 3.19 persons per family. On the other hand, single male/father families (339 | 8.9%) represent the smallest median family size with 2.63 persons per family.
| Family Type | # Families | Family Size |
| Married-Couple | 2,762 (72.7%) | 3.19 |
| Single Male/Father | 339 (8.9%) | 2.63 |
| Single Female/Mother | 697 (18.3%) | 2.89 |
| Total Families | 3,798 (100.0%) | 3.08 |
Median Household Size in The Dalles
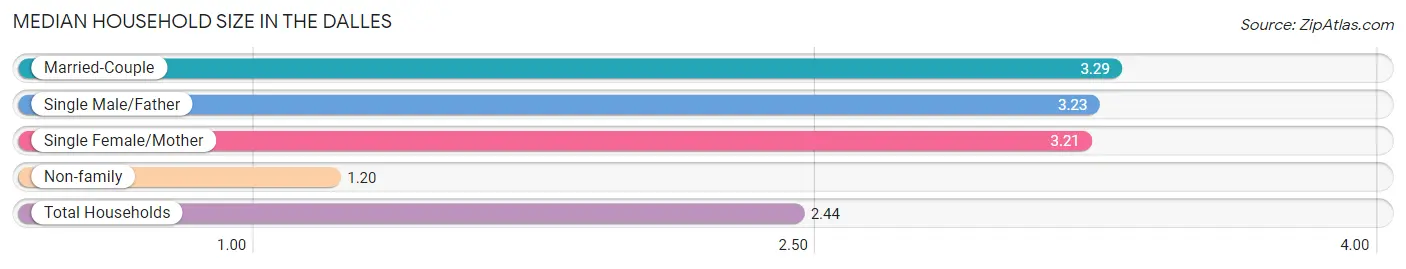
The median household size in The Dalles is 2.44 persons per household, with married-couple households (2,762 | 43.6%) accounting for the largest median household size of 3.29 persons per household. non-family households (2,543 | 40.1%) represent the smallest median household size with 1.20 persons per household.
| Household Type | # Households | Household Size |
| Married-Couple | 2,762 (43.6%) | 3.29 |
| Single Male/Father | 339 (5.3%) | 3.23 |
| Single Female/Mother | 697 (11.0%) | 3.21 |
| Non-family | 2,543 (40.1%) | 1.20 |
| Total Households | 6,341 (100.0%) | 2.44 |
Household Size by Marriage Status in The Dalles
Out of a total of 6,341 households in The Dalles, 3,798 (59.9%) are family households, while 2,543 (40.1%) are nonfamily households. The most numerous type of family households are 2-person households, comprising 1,733, and the most common type of nonfamily households are 1-person households, comprising 2,001.
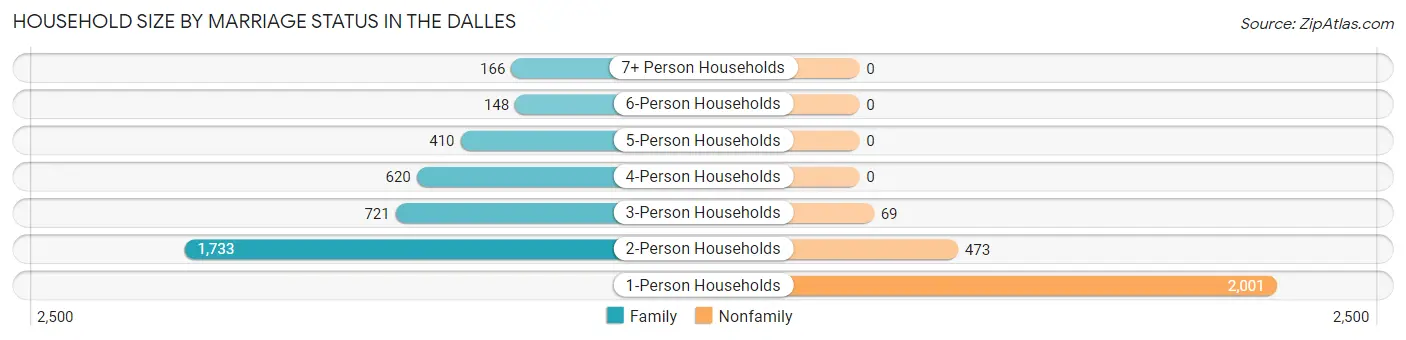
| Household Size | Family Households | Nonfamily Households |
| 1-Person Households | - | 2,001 (31.6%) |
| 2-Person Households | 1,733 (27.3%) | 473 (7.5%) |
| 3-Person Households | 721 (11.4%) | 69 (1.1%) |
| 4-Person Households | 620 (9.8%) | 0 (0.0%) |
| 5-Person Households | 410 (6.5%) | 0 (0.0%) |
| 6-Person Households | 148 (2.3%) | 0 (0.0%) |
| 7+ Person Households | 166 (2.6%) | 0 (0.0%) |
| Total | 3,798 (59.9%) | 2,543 (40.1%) |
Female Fertility in The Dalles
Fertility by Age in The Dalles
Average fertility rate in The Dalles is 51.0 births per 1,000 women. Women in the age bracket of 35 to 50 years have the highest fertility rate with 78.0 births per 1,000 women. Women in the age bracket of 35 to 50 years acount for 64.2% of all women with births.
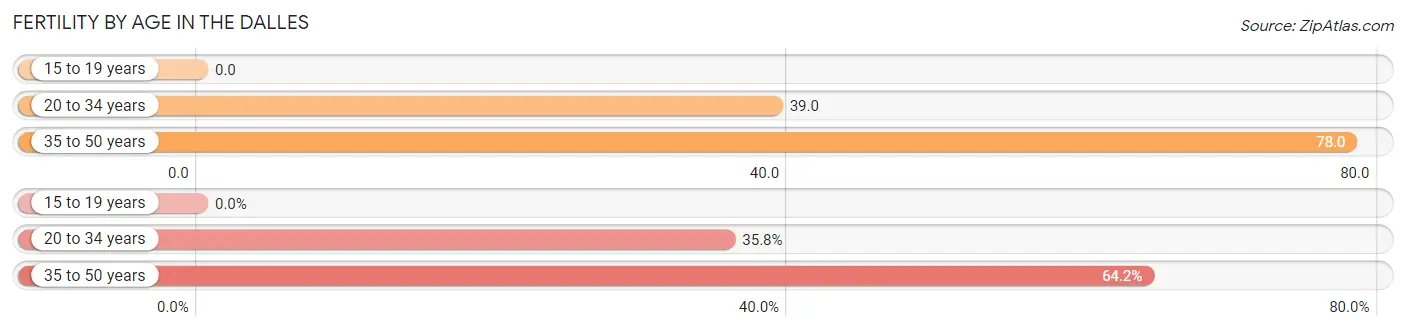
| Age Bracket | Women with Births | Births / 1,000 Women |
| 15 to 19 years | 0 (0.0%) | 0.0 |
| 20 to 34 years | 68 (35.8%) | 39.0 |
| 35 to 50 years | 122 (64.2%) | 78.0 |
| Total | 190 (100.0%) | 51.0 |
Fertility by Age by Marriage Status in The Dalles
73.7% of women with births (190) in The Dalles are married. The highest percentage of unmarried women with births falls into 20 to 34 years age bracket with 26.5% of them unmarried at the time of birth, while the lowest percentage of unmarried women with births belong to 35 to 50 years age bracket with 26.2% of them unmarried.
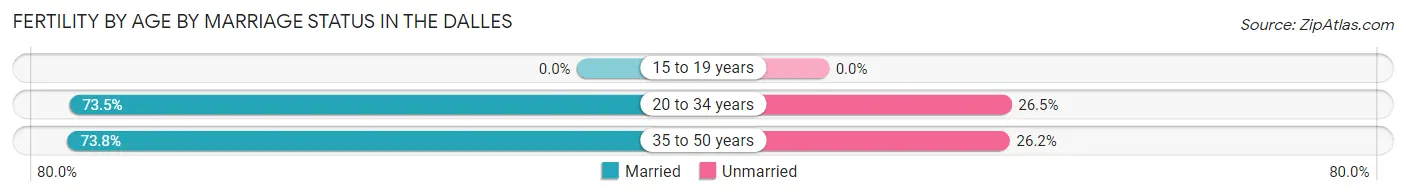
| Age Bracket | Married | Unmarried |
| 15 to 19 years | 0 (0.0%) | 0 (0.0%) |
| 20 to 34 years | 50 (73.5%) | 18 (26.5%) |
| 35 to 50 years | 90 (73.8%) | 32 (26.2%) |
| Total | 140 (73.7%) | 50 (26.3%) |
Fertility by Education in The Dalles
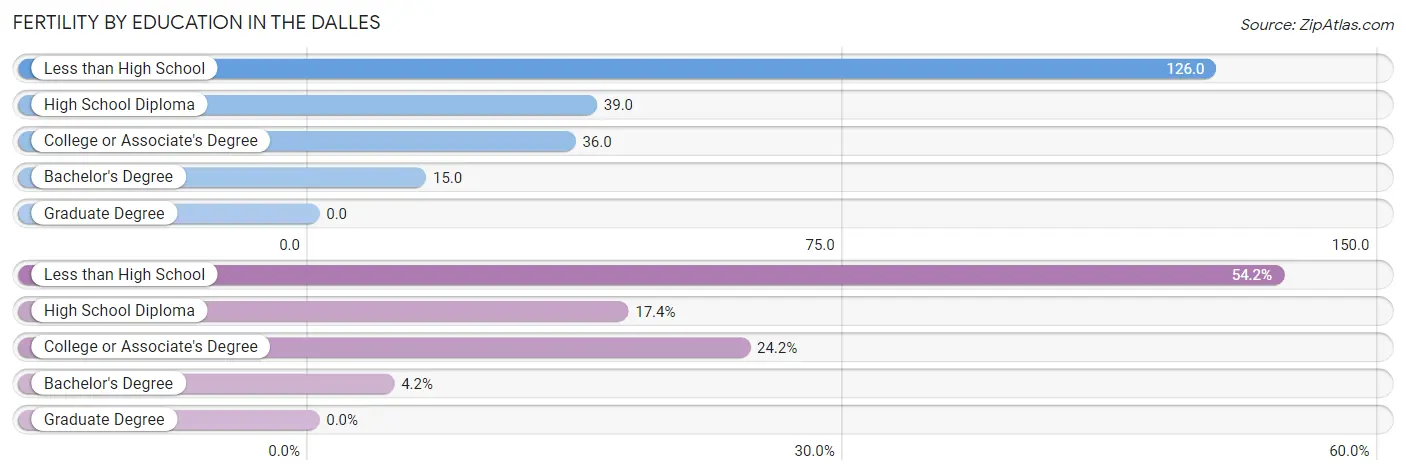
| Educational Attainment | Women with Births | Births / 1,000 Women |
| Less than High School | 103 (54.2%) | 126.0 |
| High School Diploma | 33 (17.4%) | 39.0 |
| College or Associate's Degree | 46 (24.2%) | 36.0 |
| Bachelor's Degree | 8 (4.2%) | 15.0 |
| Graduate Degree | 0 (0.0%) | 0.0 |
| Total | 190 (100.0%) | 51.0 |
Fertility by Education by Marriage Status in The Dalles
26.3% of women with births in The Dalles are unmarried. Women with the educational attainment of college or associate's degree are most likely to be married with 100.0% of them married at childbirth, while women with the educational attainment of less than high school are least likely to be married with 39.8% of them unmarried at childbirth.
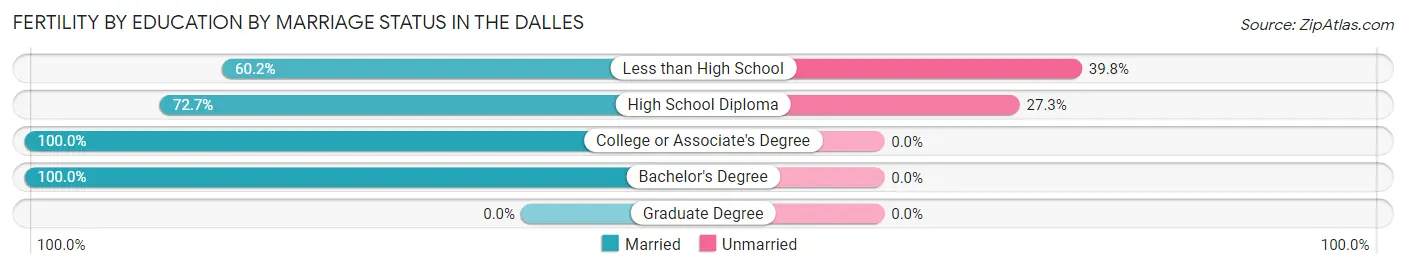
| Educational Attainment | Married | Unmarried |
| Less than High School | 62 (60.2%) | 41 (39.8%) |
| High School Diploma | 24 (72.7%) | 9 (27.3%) |
| College or Associate's Degree | 46 (100.0%) | 0 (0.0%) |
| Bachelor's Degree | 8 (100.0%) | 0 (0.0%) |
| Graduate Degree | 0 (0.0%) | 0 (0.0%) |
| Total | 140 (73.7%) | 50 (26.3%) |
Employment Characteristics in The Dalles
Employment by Class of Employer in The Dalles
Among the 6,972 employed individuals in The Dalles, private company employees (4,496 | 64.5%), not-for-profit organizations (609 | 8.7%), and state government employees (582 | 8.4%) make up the most common classes of employment.
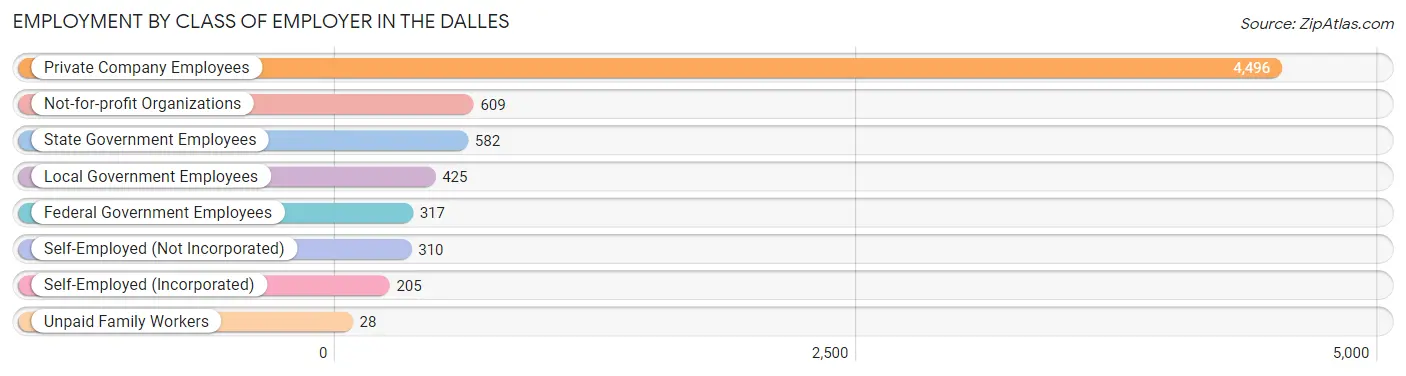
| Employer Class | # Employees | % Employees |
| Private Company Employees | 4,496 | 64.5% |
| Self-Employed (Incorporated) | 205 | 2.9% |
| Self-Employed (Not Incorporated) | 310 | 4.4% |
| Not-for-profit Organizations | 609 | 8.7% |
| Local Government Employees | 425 | 6.1% |
| State Government Employees | 582 | 8.4% |
| Federal Government Employees | 317 | 4.5% |
| Unpaid Family Workers | 28 | 0.4% |
| Total | 6,972 | 100.0% |
Employment Status by Age in The Dalles
According to the labor force statistics for The Dalles, out of the total population over 16 years of age (12,719), 60.9% or 7,746 individuals are in the labor force, with 7.1% or 550 of them unemployed. The age group with the highest labor force participation rate is 20 to 24 years, with 90.2% or 956 individuals in the labor force. Within the labor force, the 20 to 24 years age range has the highest percentage of unemployed individuals, with 17.1% or 163 of them being unemployed.
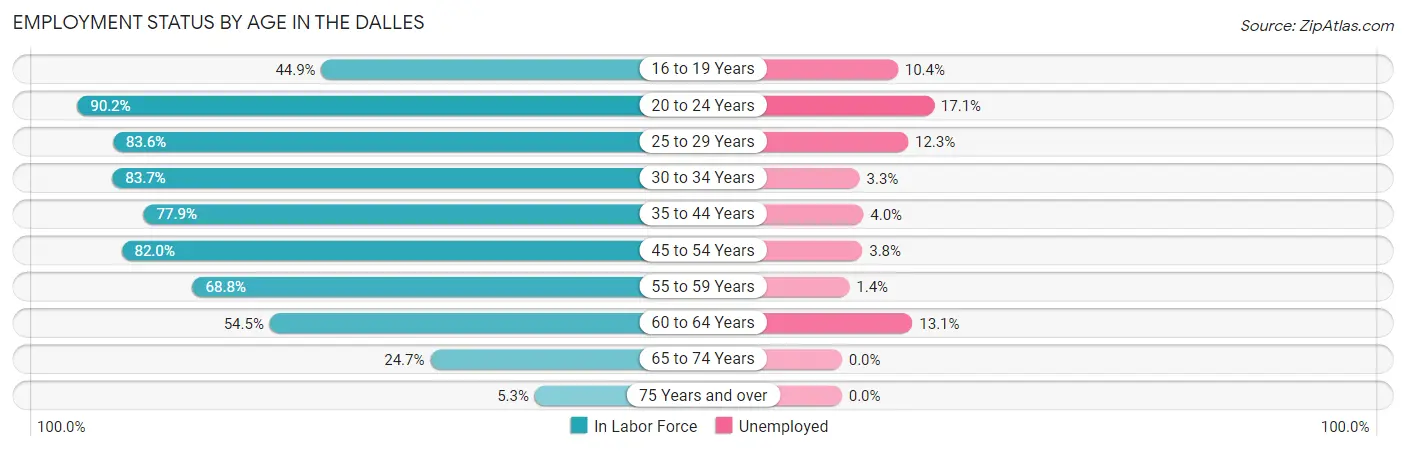
| Age Bracket | In Labor Force | Unemployed |
| 16 to 19 Years | 297 (44.9%) | 31 (10.4%) |
| 20 to 24 Years | 956 (90.2%) | 163 (17.1%) |
| 25 to 29 Years | 1,071 (83.6%) | 132 (12.3%) |
| 30 to 34 Years | 857 (83.7%) | 28 (3.3%) |
| 35 to 44 Years | 1,648 (77.9%) | 66 (4.0%) |
| 45 to 54 Years | 1,276 (82.0%) | 48 (3.8%) |
| 55 to 59 Years | 568 (68.8%) | 8 (1.4%) |
| 60 to 64 Years | 559 (54.5%) | 73 (13.1%) |
| 65 to 74 Years | 439 (24.7%) | 0 (0.0%) |
| 75 Years and over | 74 (5.3%) | 0 (0.0%) |
| Total | 7,746 (60.9%) | 550 (7.1%) |
Employment Status by Educational Attainment in The Dalles
According to labor force statistics for The Dalles, 76.4% of individuals (5,981) out of the total population between 25 and 64 years of age (7,828) are in the labor force, with 5.9% or 353 of them being unemployed. The group with the highest labor force participation rate are those with the educational attainment of bachelor's degree or higher, with 85.9% or 1,576 individuals in the labor force. Within the labor force, individuals with high school diploma education have the highest percentage of unemployment, with 11.5% or 169 of them being unemployed.
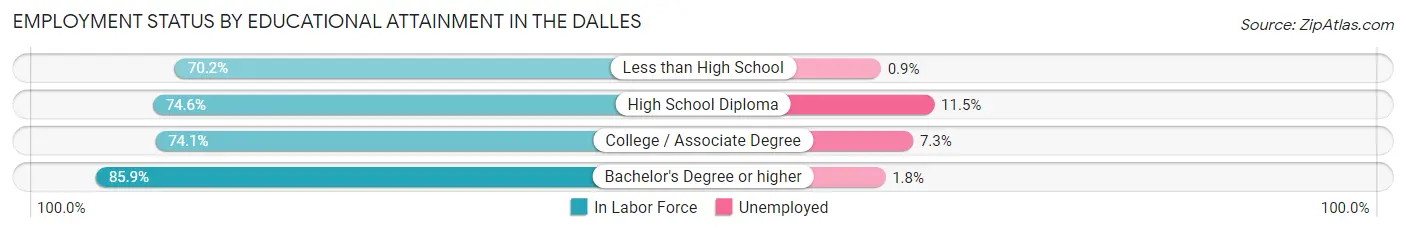
| Educational Attainment | In Labor Force | Unemployed |
| Less than High School | 852 (70.2%) | 11 (0.9%) |
| High School Diploma | 1,467 (74.6%) | 226 (11.5%) |
| College / Associate Degree | 2,085 (74.1%) | 205 (7.3%) |
| Bachelor's Degree or higher | 1,576 (85.9%) | 33 (1.8%) |
| Total | 5,981 (76.4%) | 462 (5.9%) |
Employment Occupations by Sex in The Dalles
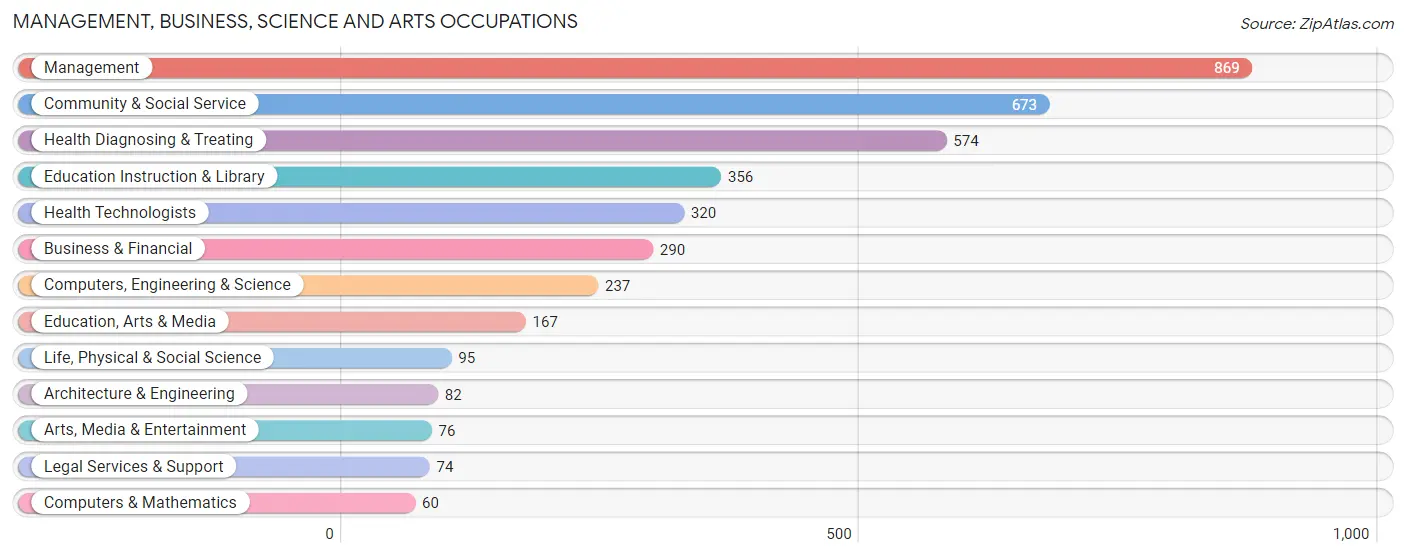
Management, Business, Science and Arts Occupations
The most common Management, Business, Science and Arts occupations in The Dalles are Management (869 | 12.1%), Community & Social Service (673 | 9.4%), Health Diagnosing & Treating (574 | 8.0%), Education Instruction & Library (356 | 5.0%), and Health Technologists (320 | 4.5%).
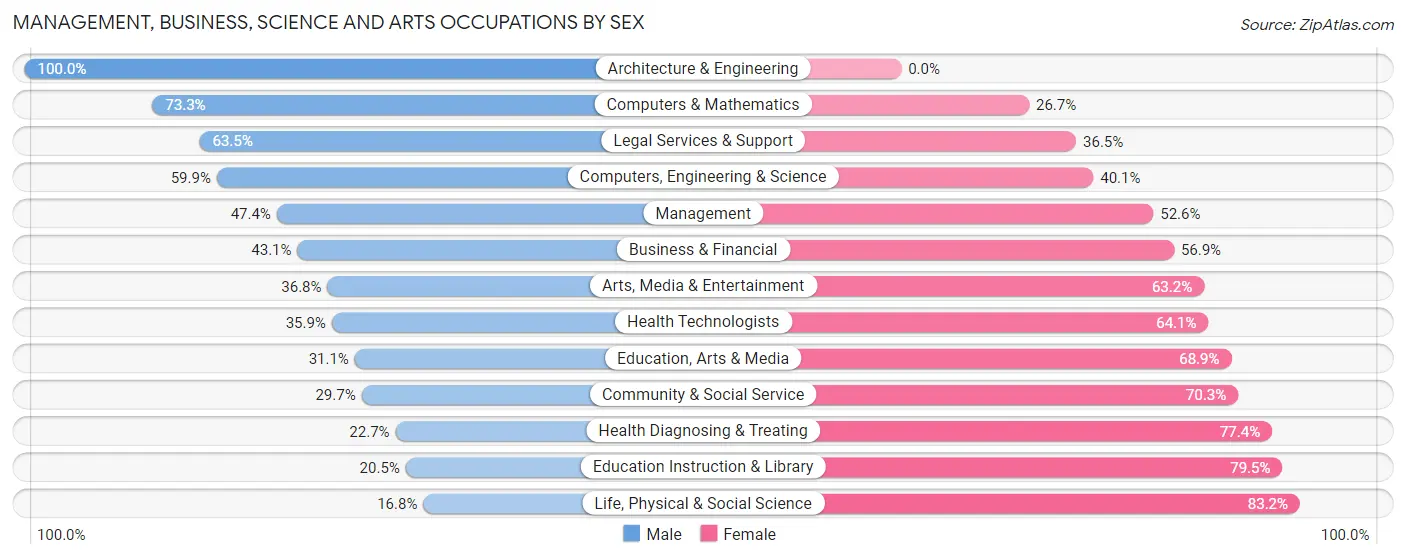
Management, Business, Science and Arts Occupations by Sex
Within the Management, Business, Science and Arts occupations in The Dalles, the most male-oriented occupations are Architecture & Engineering (100.0%), Computers & Mathematics (73.3%), and Legal Services & Support (63.5%), while the most female-oriented occupations are Life, Physical & Social Science (83.2%), Education Instruction & Library (79.5%), and Health Diagnosing & Treating (77.3%).
| Occupation | Male | Female |
| Management | 412 (47.4%) | 457 (52.6%) |
| Business & Financial | 125 (43.1%) | 165 (56.9%) |
| Computers, Engineering & Science | 142 (59.9%) | 95 (40.1%) |
| Computers & Mathematics | 44 (73.3%) | 16 (26.7%) |
| Architecture & Engineering | 82 (100.0%) | 0 (0.0%) |
| Life, Physical & Social Science | 16 (16.8%) | 79 (83.2%) |
| Community & Social Service | 200 (29.7%) | 473 (70.3%) |
| Education, Arts & Media | 52 (31.1%) | 115 (68.9%) |
| Legal Services & Support | 47 (63.5%) | 27 (36.5%) |
| Education Instruction & Library | 73 (20.5%) | 283 (79.5%) |
| Arts, Media & Entertainment | 28 (36.8%) | 48 (63.2%) |
| Health Diagnosing & Treating | 130 (22.7%) | 444 (77.3%) |
| Health Technologists | 115 (35.9%) | 205 (64.1%) |
| Total (Category) | 1,009 (38.2%) | 1,634 (61.8%) |
| Total (Overall) | 3,461 (48.3%) | 3,704 (51.7%) |
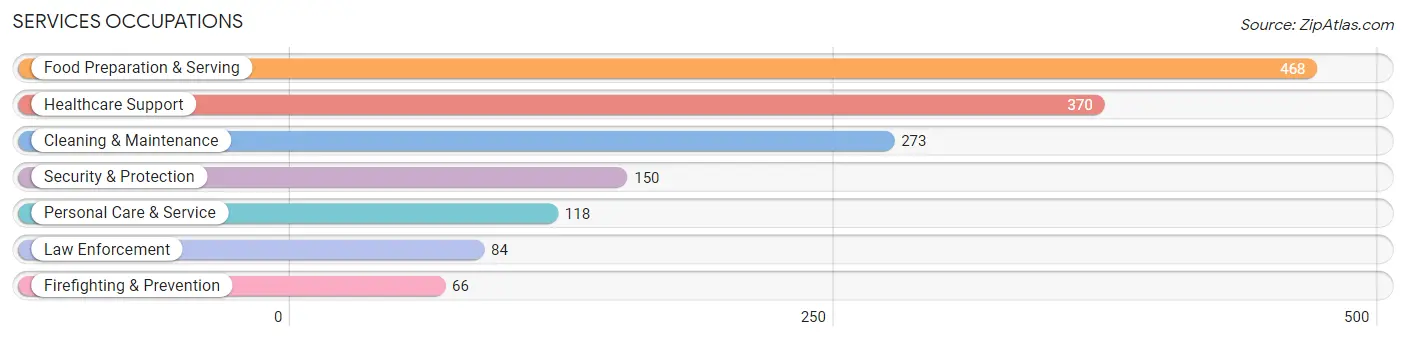
Services Occupations
The most common Services occupations in The Dalles are Food Preparation & Serving (468 | 6.5%), Healthcare Support (370 | 5.2%), Cleaning & Maintenance (273 | 3.8%), Security & Protection (150 | 2.1%), and Personal Care & Service (118 | 1.7%).
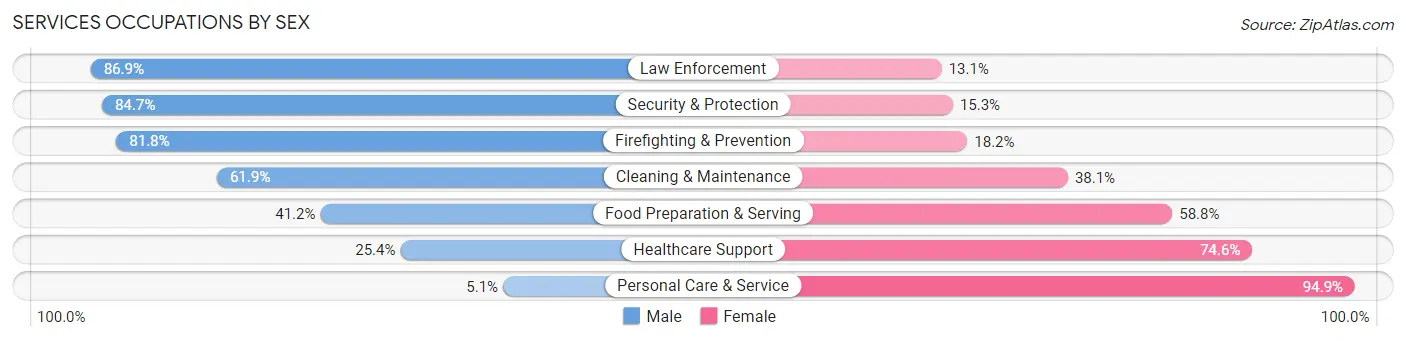
Services Occupations by Sex
Within the Services occupations in The Dalles, the most male-oriented occupations are Law Enforcement (86.9%), Security & Protection (84.7%), and Firefighting & Prevention (81.8%), while the most female-oriented occupations are Personal Care & Service (94.9%), Healthcare Support (74.6%), and Food Preparation & Serving (58.8%).
| Occupation | Male | Female |
| Healthcare Support | 94 (25.4%) | 276 (74.6%) |
| Security & Protection | 127 (84.7%) | 23 (15.3%) |
| Firefighting & Prevention | 54 (81.8%) | 12 (18.2%) |
| Law Enforcement | 73 (86.9%) | 11 (13.1%) |
| Food Preparation & Serving | 193 (41.2%) | 275 (58.8%) |
| Cleaning & Maintenance | 169 (61.9%) | 104 (38.1%) |
| Personal Care & Service | 6 (5.1%) | 112 (94.9%) |
| Total (Category) | 589 (42.7%) | 790 (57.3%) |
| Total (Overall) | 3,461 (48.3%) | 3,704 (51.7%) |
Sales and Office Occupations
The most common Sales and Office occupations in The Dalles are Office & Administration (829 | 11.6%), and Sales & Related (608 | 8.5%).
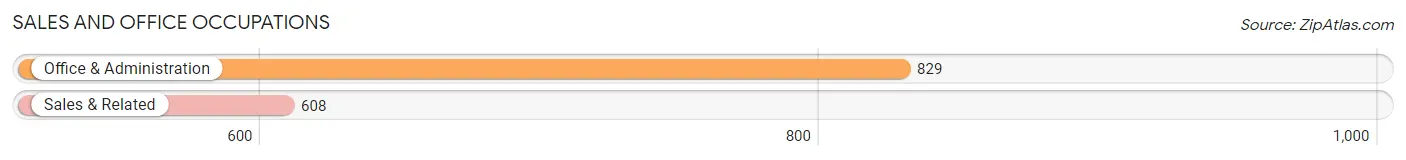
Sales and Office Occupations by Sex
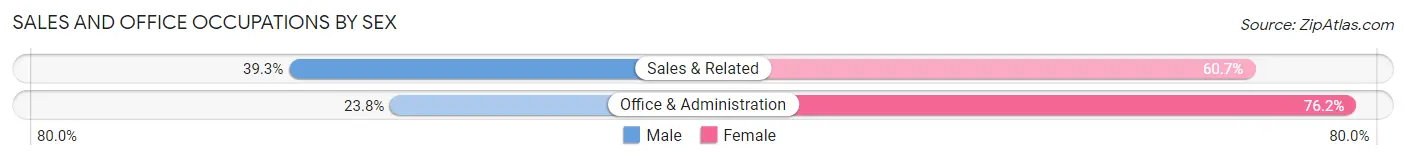
| Occupation | Male | Female |
| Sales & Related | 239 (39.3%) | 369 (60.7%) |
| Office & Administration | 197 (23.8%) | 632 (76.2%) |
| Total (Category) | 436 (30.3%) | 1,001 (69.7%) |
| Total (Overall) | 3,461 (48.3%) | 3,704 (51.7%) |
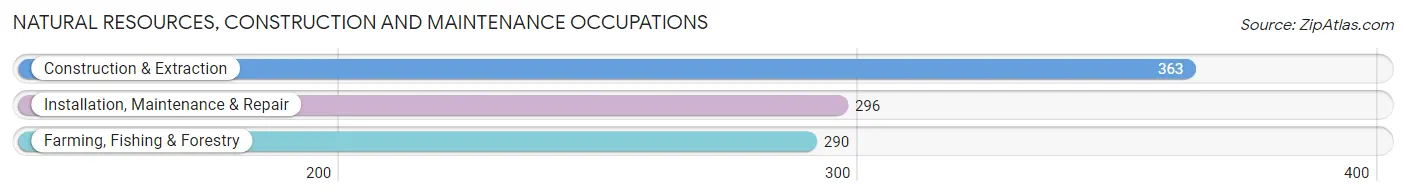
Natural Resources, Construction and Maintenance Occupations
The most common Natural Resources, Construction and Maintenance occupations in The Dalles are Construction & Extraction (363 | 5.1%), Installation, Maintenance & Repair (296 | 4.1%), and Farming, Fishing & Forestry (290 | 4.1%).
Natural Resources, Construction and Maintenance Occupations by Sex
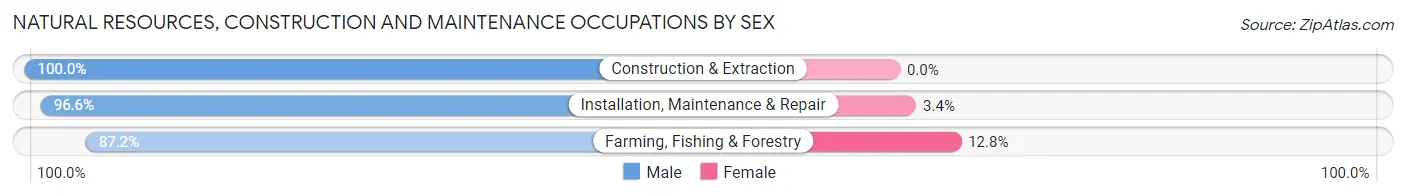
| Occupation | Male | Female |
| Farming, Fishing & Forestry | 253 (87.2%) | 37 (12.8%) |
| Construction & Extraction | 363 (100.0%) | 0 (0.0%) |
| Installation, Maintenance & Repair | 286 (96.6%) | 10 (3.4%) |
| Total (Category) | 902 (95.1%) | 47 (5.0%) |
| Total (Overall) | 3,461 (48.3%) | 3,704 (51.7%) |
Production, Transportation and Moving Occupations
The most common Production, Transportation and Moving occupations in The Dalles are Production (399 | 5.6%), Material Moving (180 | 2.5%), and Transportation (178 | 2.5%).
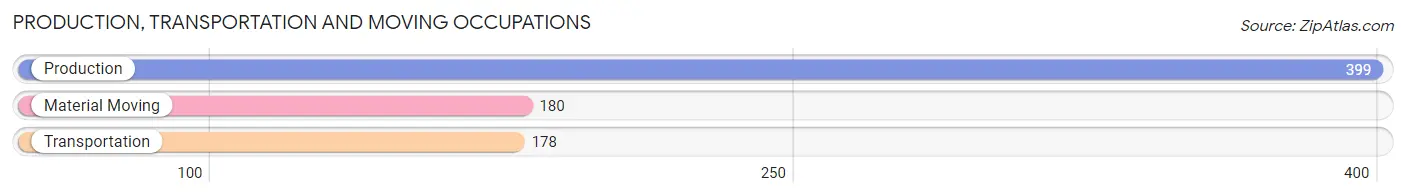
Production, Transportation and Moving Occupations by Sex
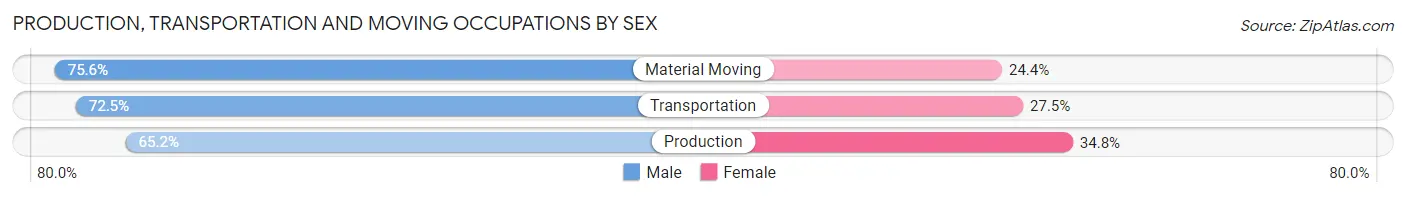
| Occupation | Male | Female |
| Production | 260 (65.2%) | 139 (34.8%) |
| Transportation | 129 (72.5%) | 49 (27.5%) |
| Material Moving | 136 (75.6%) | 44 (24.4%) |
| Total (Category) | 525 (69.4%) | 232 (30.6%) |
| Total (Overall) | 3,461 (48.3%) | 3,704 (51.7%) |
Employment Industries by Sex in The Dalles
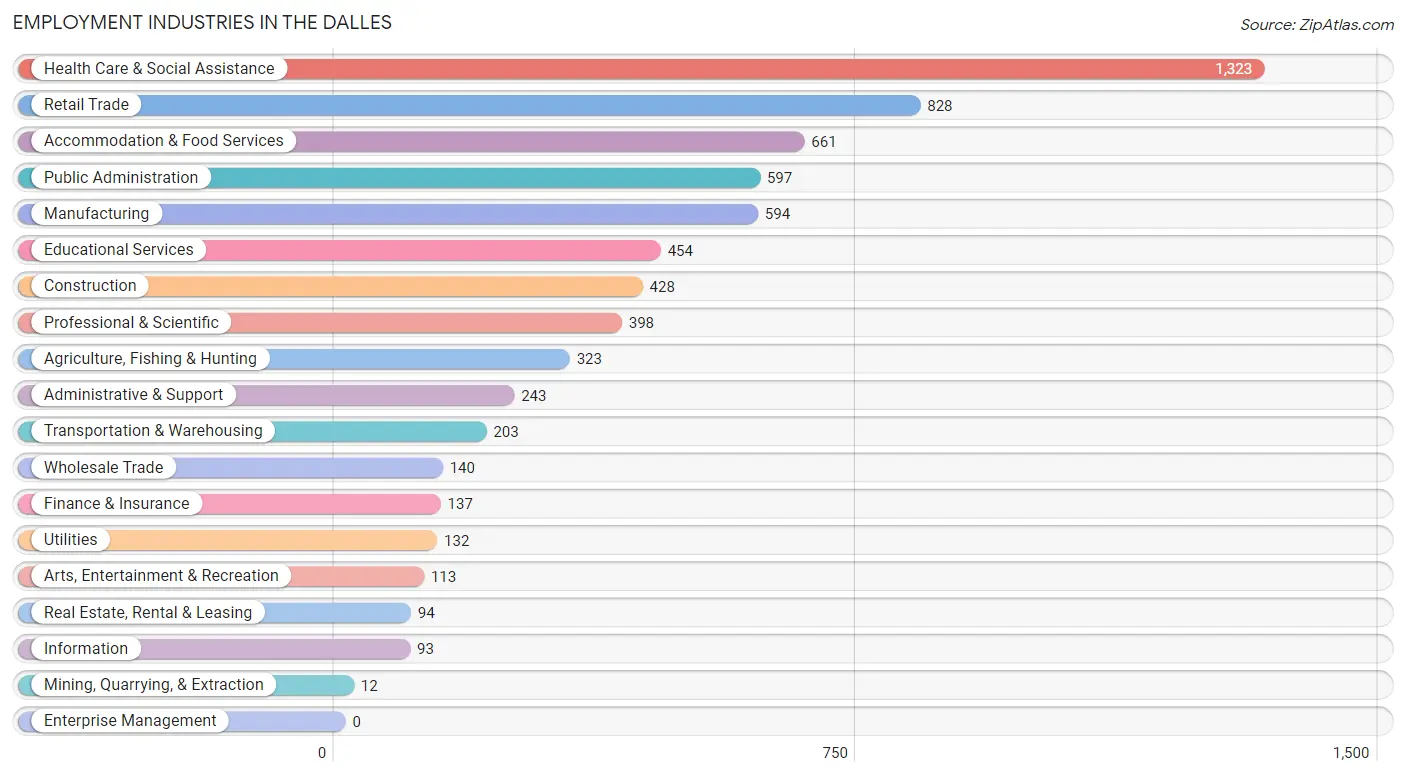
Employment Industries in The Dalles
The major employment industries in The Dalles include Health Care & Social Assistance (1,323 | 18.5%), Retail Trade (828 | 11.6%), Accommodation & Food Services (661 | 9.2%), Public Administration (597 | 8.3%), and Manufacturing (594 | 8.3%).
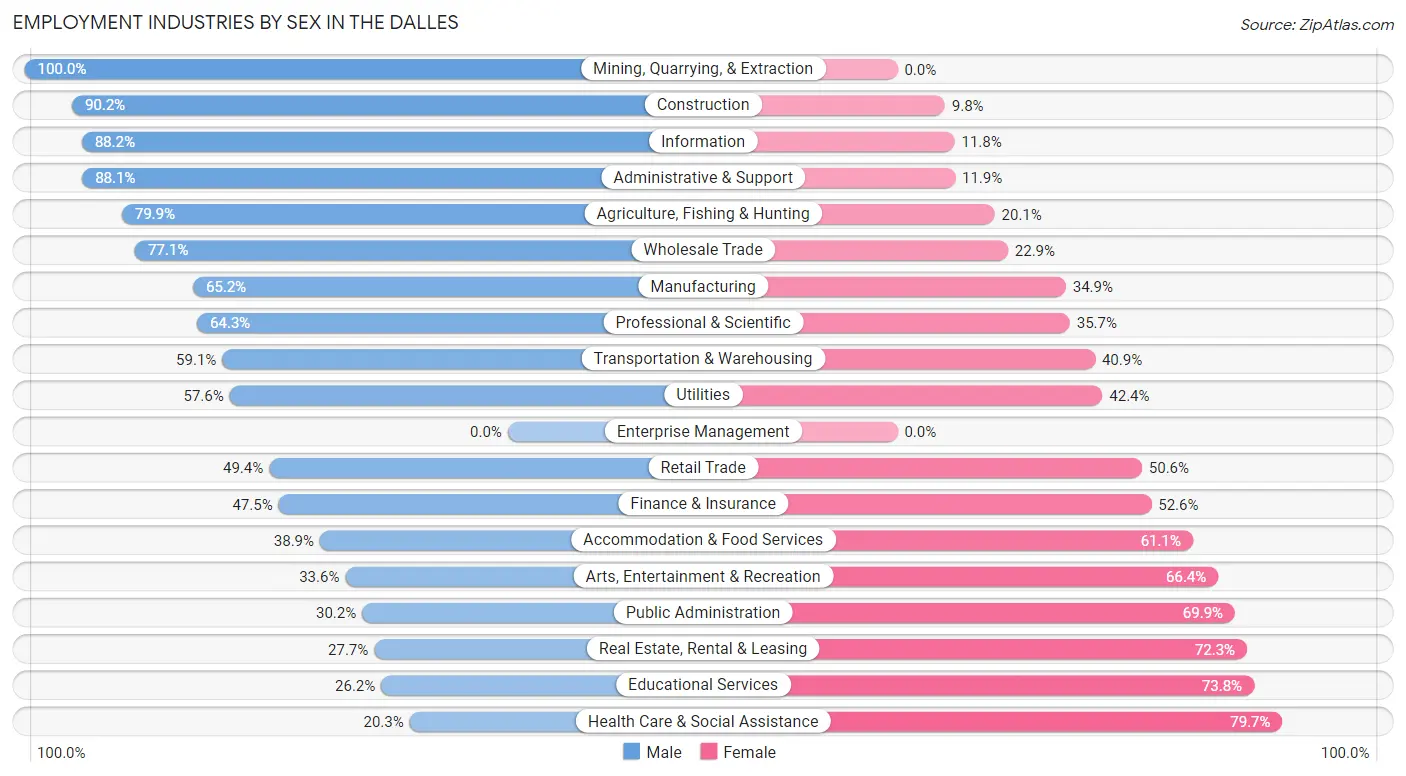
Employment Industries by Sex in The Dalles
The The Dalles industries that see more men than women are Mining, Quarrying, & Extraction (100.0%), Construction (90.2%), and Information (88.2%), whereas the industries that tend to have a higher number of women are Health Care & Social Assistance (79.7%), Educational Services (73.8%), and Real Estate, Rental & Leasing (72.3%).
| Industry | Male | Female |
| Agriculture, Fishing & Hunting | 258 (79.9%) | 65 (20.1%) |
| Mining, Quarrying, & Extraction | 12 (100.0%) | 0 (0.0%) |
| Construction | 386 (90.2%) | 42 (9.8%) |
| Manufacturing | 387 (65.1%) | 207 (34.8%) |
| Wholesale Trade | 108 (77.1%) | 32 (22.9%) |
| Retail Trade | 409 (49.4%) | 419 (50.6%) |
| Transportation & Warehousing | 120 (59.1%) | 83 (40.9%) |
| Utilities | 76 (57.6%) | 56 (42.4%) |
| Information | 82 (88.2%) | 11 (11.8%) |
| Finance & Insurance | 65 (47.4%) | 72 (52.5%) |
| Real Estate, Rental & Leasing | 26 (27.7%) | 68 (72.3%) |
| Professional & Scientific | 256 (64.3%) | 142 (35.7%) |
| Enterprise Management | 0 (0.0%) | 0 (0.0%) |
| Administrative & Support | 214 (88.1%) | 29 (11.9%) |
| Educational Services | 119 (26.2%) | 335 (73.8%) |
| Health Care & Social Assistance | 269 (20.3%) | 1,054 (79.7%) |
| Arts, Entertainment & Recreation | 38 (33.6%) | 75 (66.4%) |
| Accommodation & Food Services | 257 (38.9%) | 404 (61.1%) |
| Public Administration | 180 (30.1%) | 417 (69.9%) |
| Total | 3,461 (48.3%) | 3,704 (51.7%) |
Education in The Dalles
School Enrollment in The Dalles
The most common levels of schooling among the 3,688 students in The Dalles are middle school (1,029 | 27.9%), high school (787 | 21.3%), and elementary school (697 | 18.9%).
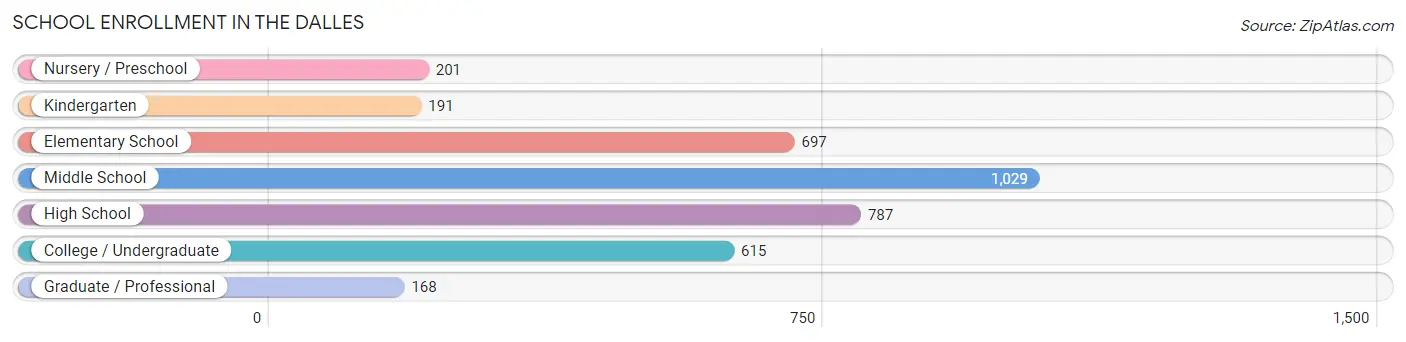
| School Level | # Students | % Students |
| Nursery / Preschool | 201 | 5.4% |
| Kindergarten | 191 | 5.2% |
| Elementary School | 697 | 18.9% |
| Middle School | 1,029 | 27.9% |
| High School | 787 | 21.3% |
| College / Undergraduate | 615 | 16.7% |
| Graduate / Professional | 168 | 4.6% |
| Total | 3,688 | 100.0% |
School Enrollment by Age by Funding Source in The Dalles
Out of a total of 3,688 students who are enrolled in schools in The Dalles, 520 (14.1%) attend a private institution, while the remaining 3,168 (85.9%) are enrolled in public schools. The age group of 25 to 34 year olds has the highest likelihood of being enrolled in private schools, with 97 (42.9% in the age bracket) enrolled. Conversely, the age group of 15 to 17 year olds has the lowest likelihood of being enrolled in a private school, with 603 (95.6% in the age bracket) attending a public institution.
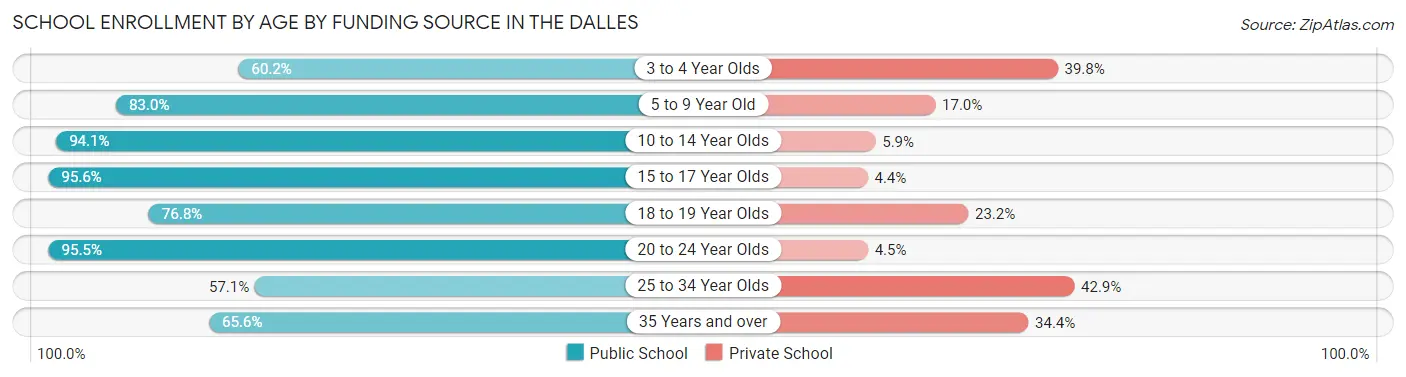
| Age Bracket | Public School | Private School |
| 3 to 4 Year Olds | 71 (60.2%) | 47 (39.8%) |
| 5 to 9 Year Old | 721 (83.0%) | 148 (17.0%) |
| 10 to 14 Year Olds | 1,103 (94.1%) | 69 (5.9%) |
| 15 to 17 Year Olds | 603 (95.6%) | 28 (4.4%) |
| 18 to 19 Year Olds | 136 (76.8%) | 41 (23.2%) |
| 20 to 24 Year Olds | 256 (95.5%) | 12 (4.5%) |
| 25 to 34 Year Olds | 129 (57.1%) | 97 (42.9%) |
| 35 Years and over | 149 (65.6%) | 78 (34.4%) |
| Total | 3,168 (85.9%) | 520 (14.1%) |
Educational Attainment by Field of Study in The Dalles
Business (350 | 13.1%), education (335 | 12.5%), liberal arts & history (308 | 11.5%), bio, nature & agricultural (236 | 8.8%), and engineering (233 | 8.7%) are the most common fields of study among 2,672 individuals in The Dalles who have obtained a bachelor's degree or higher.
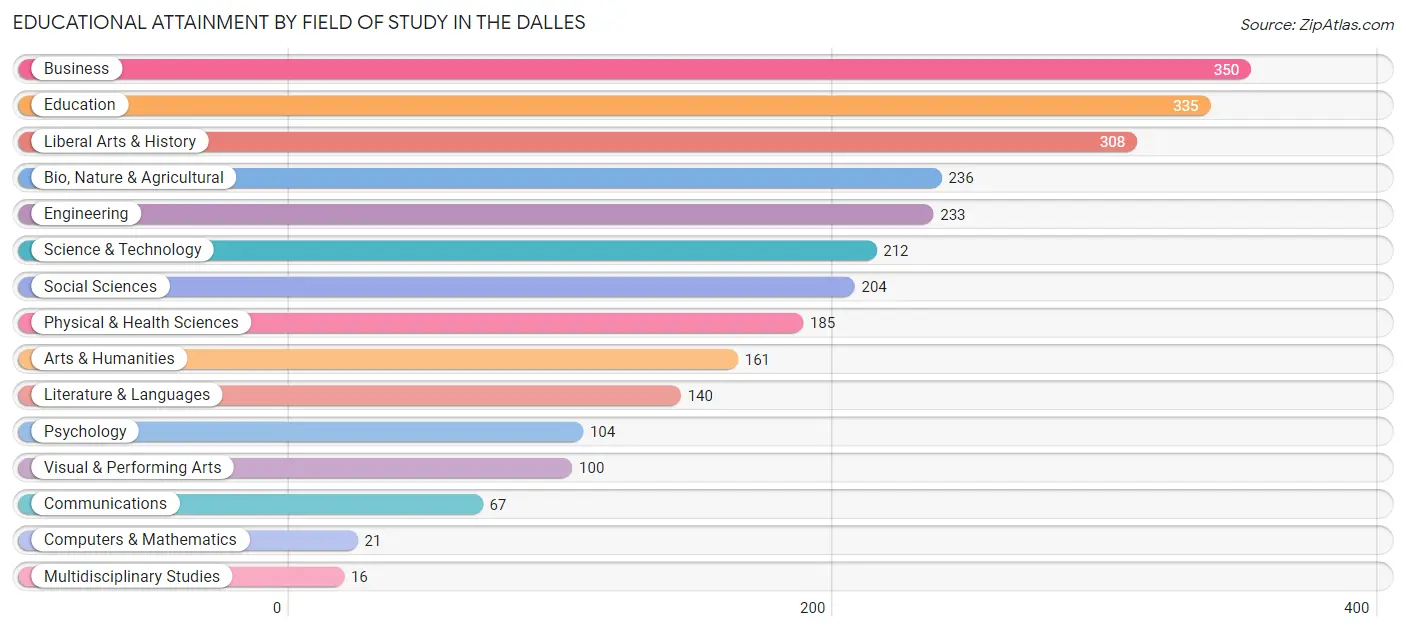
| Field of Study | # Graduates | % Graduates |
| Computers & Mathematics | 21 | 0.8% |
| Bio, Nature & Agricultural | 236 | 8.8% |
| Physical & Health Sciences | 185 | 6.9% |
| Psychology | 104 | 3.9% |
| Social Sciences | 204 | 7.6% |
| Engineering | 233 | 8.7% |
| Multidisciplinary Studies | 16 | 0.6% |
| Science & Technology | 212 | 7.9% |
| Business | 350 | 13.1% |
| Education | 335 | 12.5% |
| Literature & Languages | 140 | 5.2% |
| Liberal Arts & History | 308 | 11.5% |
| Visual & Performing Arts | 100 | 3.7% |
| Communications | 67 | 2.5% |
| Arts & Humanities | 161 | 6.0% |
| Total | 2,672 | 100.0% |
Transportation & Commute in The Dalles
Vehicle Availability by Sex in The Dalles
The most prevalent vehicle ownership categories in The Dalles are males with 2 vehicles (1,323, accounting for 38.8%) and females with 2 vehicles (1,367, making up 37.3%).
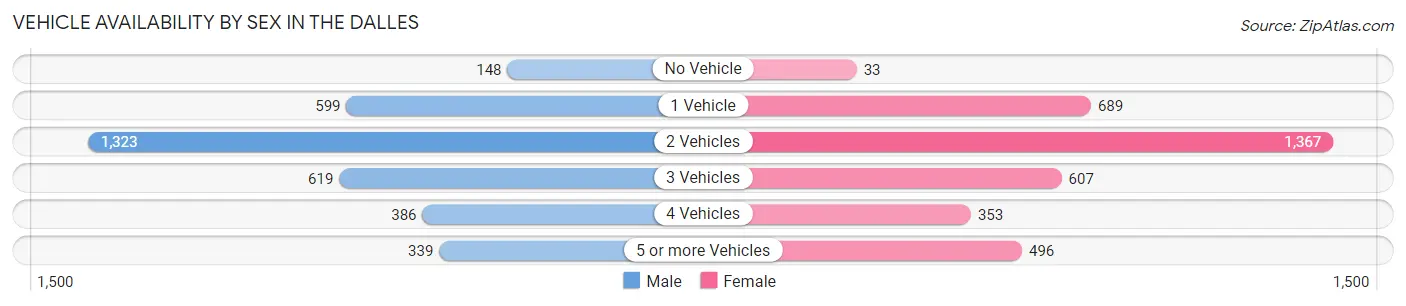
| Vehicles Available | Male | Female |
| No Vehicle | 148 (4.3%) | 33 (0.9%) |
| 1 Vehicle | 599 (17.5%) | 689 (19.4%) |
| 2 Vehicles | 1,323 (38.8%) | 1,367 (38.6%) |
| 3 Vehicles | 619 (18.1%) | 607 (17.1%) |
| 4 Vehicles | 386 (11.3%) | 353 (10.0%) |
| 5 or more Vehicles | 339 (9.9%) | 496 (14.0%) |
| Total | 3,414 (100.0%) | 3,545 (100.0%) |
Commute Time in The Dalles
The most frequently occuring commute durations in The Dalles are 5 to 9 minutes (2,353 commuters, 36.0%), 10 to 14 minutes (1,597 commuters, 24.4%), and 30 to 34 minutes (584 commuters, 8.9%).
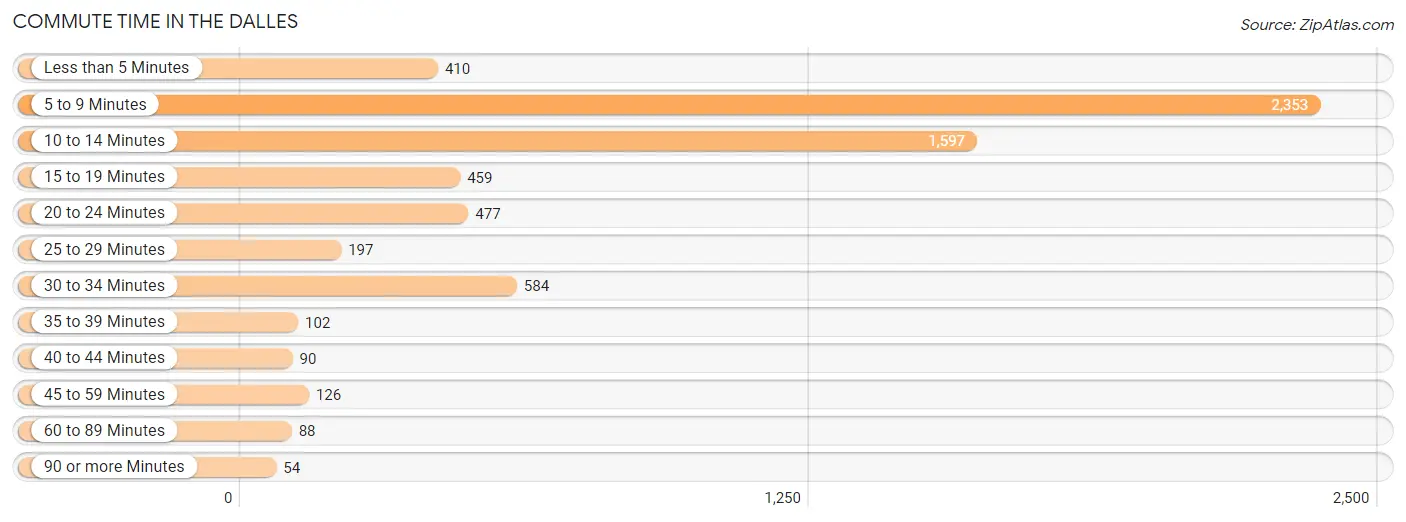
| Commute Time | # Commuters | % Commuters |
| Less than 5 Minutes | 410 | 6.3% |
| 5 to 9 Minutes | 2,353 | 36.0% |
| 10 to 14 Minutes | 1,597 | 24.4% |
| 15 to 19 Minutes | 459 | 7.0% |
| 20 to 24 Minutes | 477 | 7.3% |
| 25 to 29 Minutes | 197 | 3.0% |
| 30 to 34 Minutes | 584 | 8.9% |
| 35 to 39 Minutes | 102 | 1.6% |
| 40 to 44 Minutes | 90 | 1.4% |
| 45 to 59 Minutes | 126 | 1.9% |
| 60 to 89 Minutes | 88 | 1.3% |
| 90 or more Minutes | 54 | 0.8% |
Commute Time by Sex in The Dalles
The most common commute times in The Dalles are 5 to 9 minutes (1,144 commuters, 35.3%) for males and 5 to 9 minutes (1,209 commuters, 36.7%) for females.
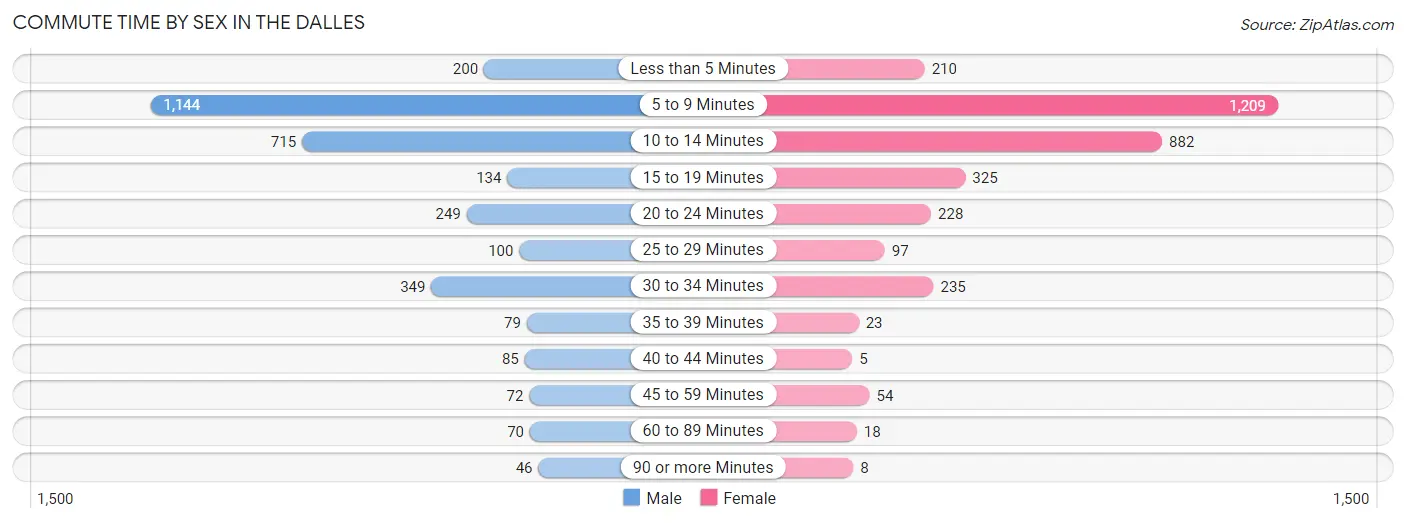
| Commute Time | Male | Female |
| Less than 5 Minutes | 200 (6.2%) | 210 (6.4%) |
| 5 to 9 Minutes | 1,144 (35.3%) | 1,209 (36.7%) |
| 10 to 14 Minutes | 715 (22.1%) | 882 (26.8%) |
| 15 to 19 Minutes | 134 (4.1%) | 325 (9.9%) |
| 20 to 24 Minutes | 249 (7.7%) | 228 (6.9%) |
| 25 to 29 Minutes | 100 (3.1%) | 97 (2.9%) |
| 30 to 34 Minutes | 349 (10.8%) | 235 (7.1%) |
| 35 to 39 Minutes | 79 (2.4%) | 23 (0.7%) |
| 40 to 44 Minutes | 85 (2.6%) | 5 (0.2%) |
| 45 to 59 Minutes | 72 (2.2%) | 54 (1.6%) |
| 60 to 89 Minutes | 70 (2.2%) | 18 (0.5%) |
| 90 or more Minutes | 46 (1.4%) | 8 (0.2%) |
Time of Departure to Work by Sex in The Dalles
The most frequent times of departure to work in The Dalles are 7:30 AM to 7:59 AM (556, 17.1%) for males and 8:00 AM to 8:29 AM (551, 16.7%) for females.
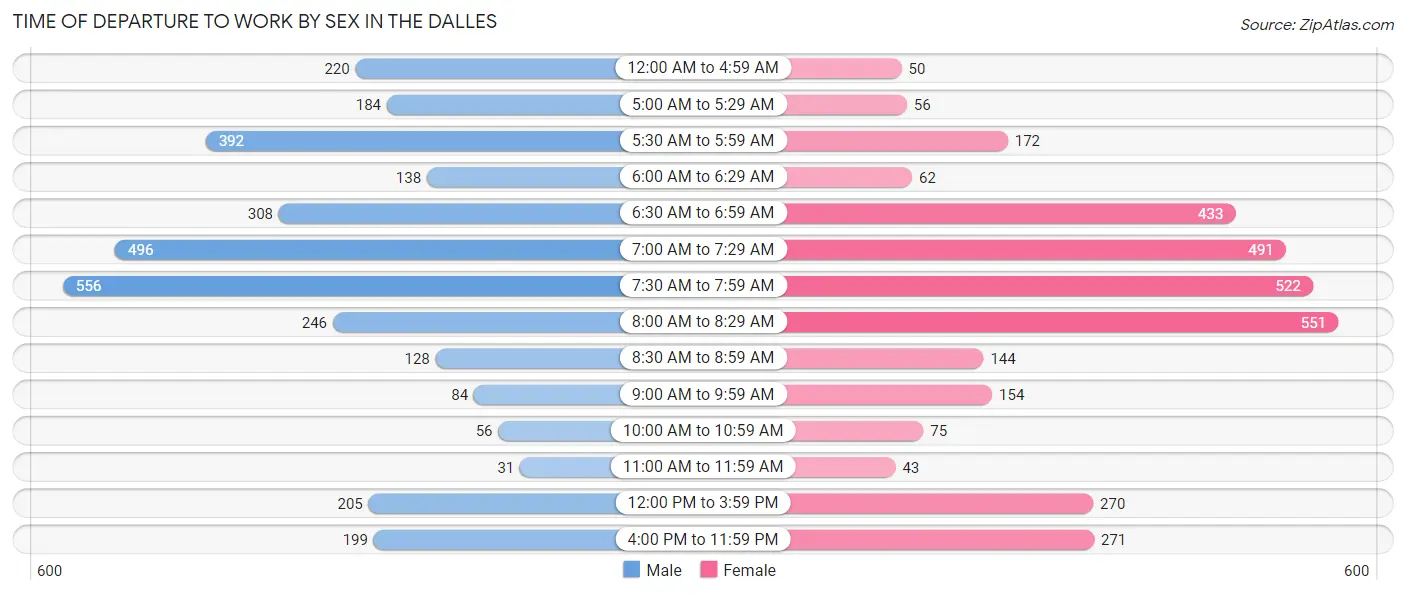
| Time of Departure | Male | Female |
| 12:00 AM to 4:59 AM | 220 (6.8%) | 50 (1.5%) |
| 5:00 AM to 5:29 AM | 184 (5.7%) | 56 (1.7%) |
| 5:30 AM to 5:59 AM | 392 (12.1%) | 172 (5.2%) |
| 6:00 AM to 6:29 AM | 138 (4.3%) | 62 (1.9%) |
| 6:30 AM to 6:59 AM | 308 (9.5%) | 433 (13.2%) |
| 7:00 AM to 7:29 AM | 496 (15.3%) | 491 (14.9%) |
| 7:30 AM to 7:59 AM | 556 (17.1%) | 522 (15.9%) |
| 8:00 AM to 8:29 AM | 246 (7.6%) | 551 (16.7%) |
| 8:30 AM to 8:59 AM | 128 (4.0%) | 144 (4.4%) |
| 9:00 AM to 9:59 AM | 84 (2.6%) | 154 (4.7%) |
| 10:00 AM to 10:59 AM | 56 (1.7%) | 75 (2.3%) |
| 11:00 AM to 11:59 AM | 31 (1.0%) | 43 (1.3%) |
| 12:00 PM to 3:59 PM | 205 (6.3%) | 270 (8.2%) |
| 4:00 PM to 11:59 PM | 199 (6.1%) | 271 (8.2%) |
| Total | 3,243 (100.0%) | 3,294 (100.0%) |
Housing Occupancy in The Dalles
Occupancy by Ownership in The Dalles
Of the total 6,341 dwellings in The Dalles, owner-occupied units account for 3,806 (60.0%), while renter-occupied units make up 2,535 (40.0%).
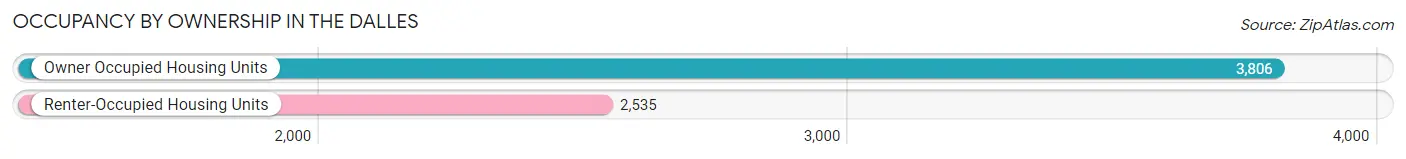
| Occupancy | # Housing Units | % Housing Units |
| Owner Occupied Housing Units | 3,806 | 60.0% |
| Renter-Occupied Housing Units | 2,535 | 40.0% |
| Total Occupied Housing Units | 6,341 | 100.0% |
Occupancy by Household Size in The Dalles
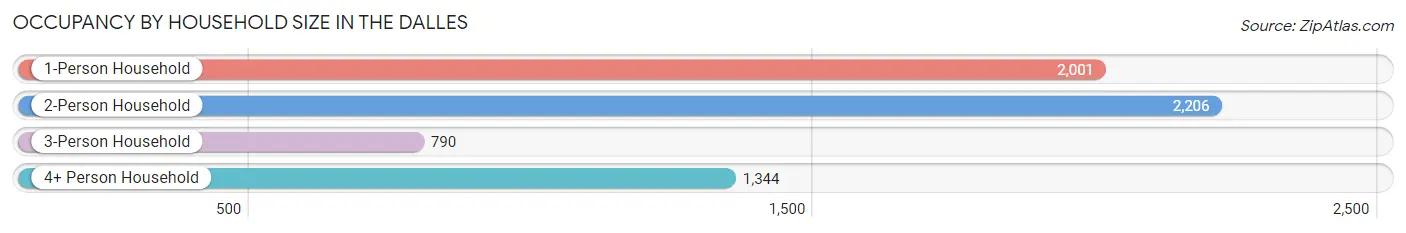
| Household Size | # Housing Units | % Housing Units |
| 1-Person Household | 2,001 | 31.6% |
| 2-Person Household | 2,206 | 34.8% |
| 3-Person Household | 790 | 12.5% |
| 4+ Person Household | 1,344 | 21.2% |
| Total Housing Units | 6,341 | 100.0% |
Occupancy by Ownership by Household Size in The Dalles
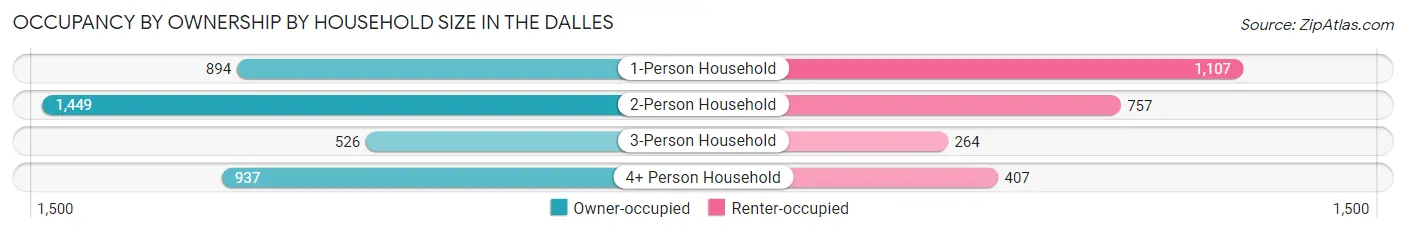
| Household Size | Owner-occupied | Renter-occupied |
| 1-Person Household | 894 (44.7%) | 1,107 (55.3%) |
| 2-Person Household | 1,449 (65.7%) | 757 (34.3%) |
| 3-Person Household | 526 (66.6%) | 264 (33.4%) |
| 4+ Person Household | 937 (69.7%) | 407 (30.3%) |
| Total Housing Units | 3,806 (60.0%) | 2,535 (40.0%) |
Occupancy by Educational Attainment in The Dalles
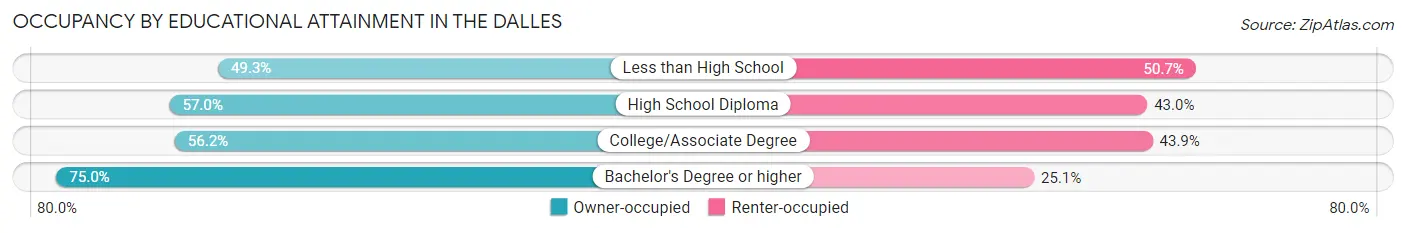
| Household Size | Owner-occupied | Renter-occupied |
| Less than High School | 405 (49.3%) | 416 (50.7%) |
| High School Diploma | 891 (57.0%) | 672 (43.0%) |
| College/Associate Degree | 1,361 (56.1%) | 1,063 (43.9%) |
| Bachelor's Degree or higher | 1,149 (75.0%) | 384 (25.1%) |
Occupancy by Age of Householder in The Dalles
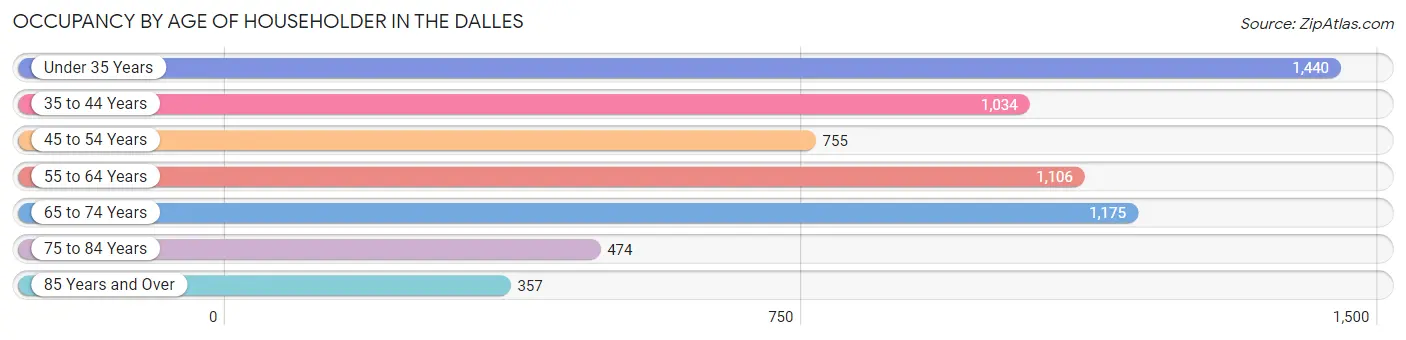
| Age Bracket | # Households | % Households |
| Under 35 Years | 1,440 | 22.7% |
| 35 to 44 Years | 1,034 | 16.3% |
| 45 to 54 Years | 755 | 11.9% |
| 55 to 64 Years | 1,106 | 17.4% |
| 65 to 74 Years | 1,175 | 18.5% |
| 75 to 84 Years | 474 | 7.5% |
| 85 Years and Over | 357 | 5.6% |
| Total | 6,341 | 100.0% |
Housing Finances in The Dalles
Median Income by Occupancy in The Dalles
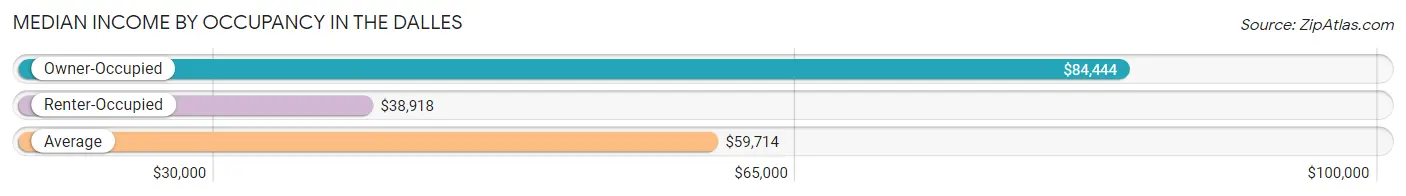
| Occupancy Type | # Households | Median Income |
| Owner-Occupied | 3,806 (60.0%) | $84,444 |
| Renter-Occupied | 2,535 (40.0%) | $38,918 |
| Average | 6,341 (100.0%) | $59,714 |
Occupancy by Householder Income Bracket in The Dalles
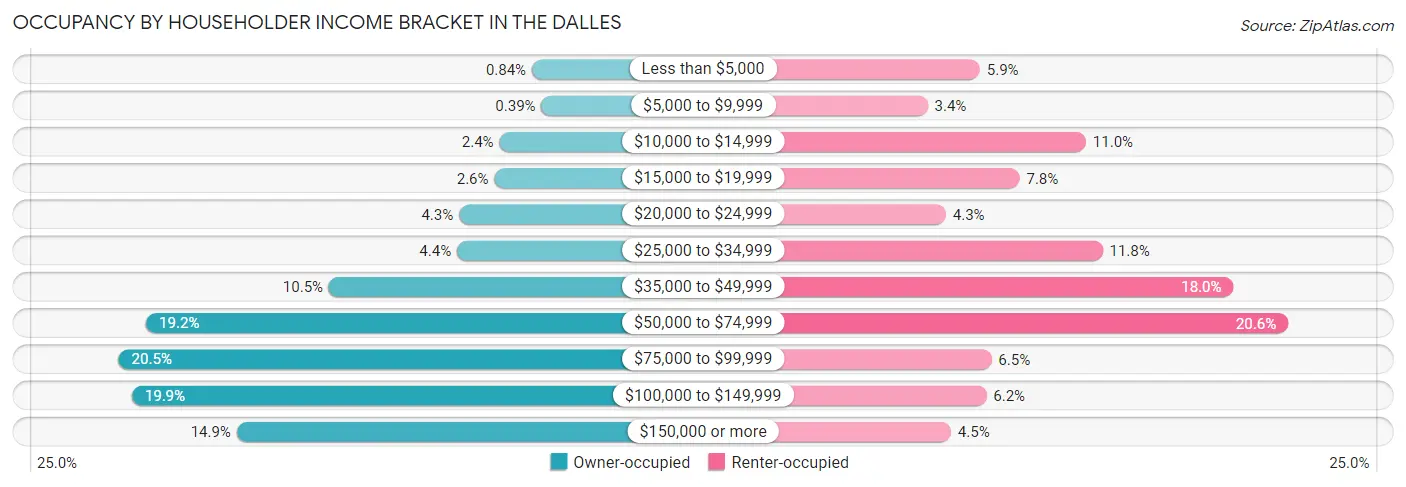
| Income Bracket | Owner-occupied | Renter-occupied |
| Less than $5,000 | 32 (0.8%) | 150 (5.9%) |
| $5,000 to $9,999 | 15 (0.4%) | 87 (3.4%) |
| $10,000 to $14,999 | 91 (2.4%) | 278 (11.0%) |
| $15,000 to $19,999 | 100 (2.6%) | 198 (7.8%) |
| $20,000 to $24,999 | 164 (4.3%) | 109 (4.3%) |
| $25,000 to $34,999 | 168 (4.4%) | 298 (11.8%) |
| $35,000 to $49,999 | 400 (10.5%) | 456 (18.0%) |
| $50,000 to $74,999 | 731 (19.2%) | 522 (20.6%) |
| $75,000 to $99,999 | 781 (20.5%) | 164 (6.5%) |
| $100,000 to $149,999 | 757 (19.9%) | 158 (6.2%) |
| $150,000 or more | 567 (14.9%) | 115 (4.5%) |
| Total | 3,806 (100.0%) | 2,535 (100.0%) |
Monthly Housing Cost Tiers in The Dalles
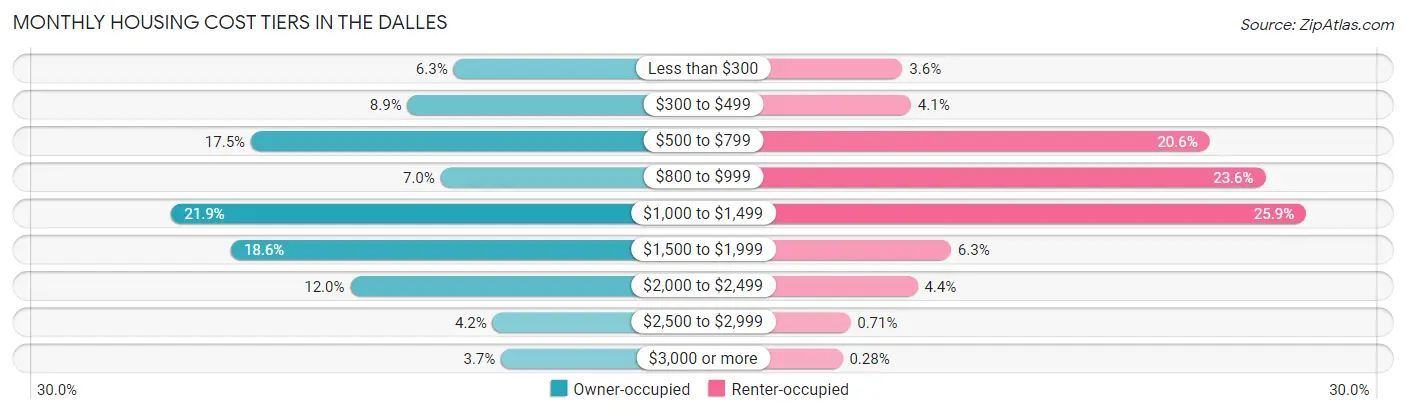
| Monthly Cost | Owner-occupied | Renter-occupied |
| Less than $300 | 240 (6.3%) | 91 (3.6%) |
| $300 to $499 | 337 (8.8%) | 103 (4.1%) |
| $500 to $799 | 666 (17.5%) | 521 (20.5%) |
| $800 to $999 | 267 (7.0%) | 599 (23.6%) |
| $1,000 to $1,499 | 833 (21.9%) | 656 (25.9%) |
| $1,500 to $1,999 | 708 (18.6%) | 159 (6.3%) |
| $2,000 to $2,499 | 457 (12.0%) | 112 (4.4%) |
| $2,500 to $2,999 | 158 (4.2%) | 18 (0.7%) |
| $3,000 or more | 140 (3.7%) | 7 (0.3%) |
| Total | 3,806 (100.0%) | 2,535 (100.0%) |
Physical Housing Characteristics in The Dalles
Housing Structures in The Dalles
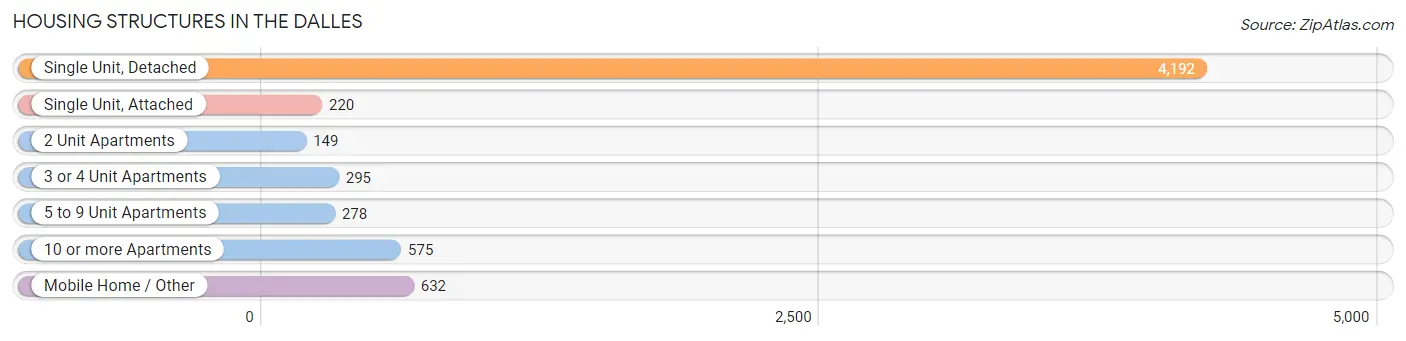
| Structure Type | # Housing Units | % Housing Units |
| Single Unit, Detached | 4,192 | 66.1% |
| Single Unit, Attached | 220 | 3.5% |
| 2 Unit Apartments | 149 | 2.4% |
| 3 or 4 Unit Apartments | 295 | 4.6% |
| 5 to 9 Unit Apartments | 278 | 4.4% |
| 10 or more Apartments | 575 | 9.1% |
| Mobile Home / Other | 632 | 10.0% |
| Total | 6,341 | 100.0% |
Housing Structures by Occupancy in The Dalles
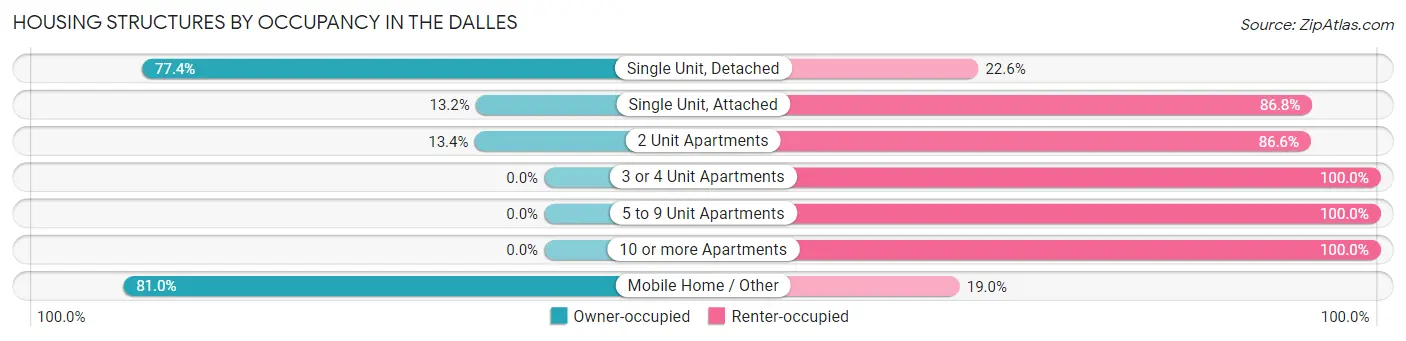
| Structure Type | Owner-occupied | Renter-occupied |
| Single Unit, Detached | 3,245 (77.4%) | 947 (22.6%) |
| Single Unit, Attached | 29 (13.2%) | 191 (86.8%) |
| 2 Unit Apartments | 20 (13.4%) | 129 (86.6%) |
| 3 or 4 Unit Apartments | 0 (0.0%) | 295 (100.0%) |
| 5 to 9 Unit Apartments | 0 (0.0%) | 278 (100.0%) |
| 10 or more Apartments | 0 (0.0%) | 575 (100.0%) |
| Mobile Home / Other | 512 (81.0%) | 120 (19.0%) |
| Total | 3,806 (60.0%) | 2,535 (40.0%) |
Housing Structures by Number of Rooms in The Dalles
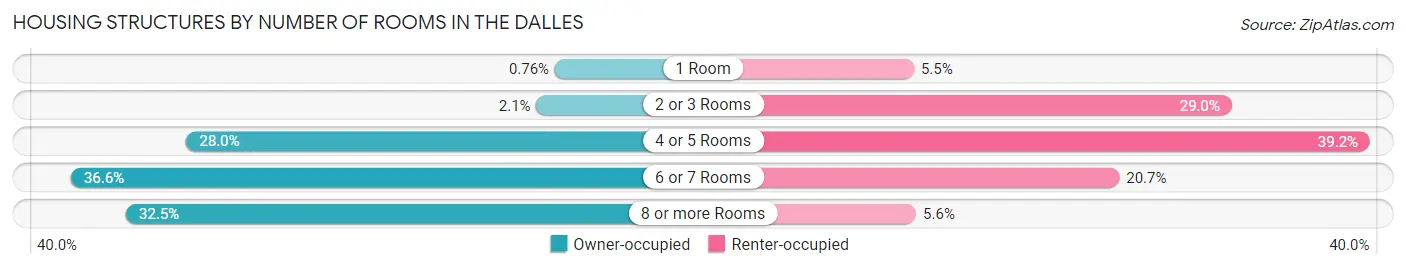
| Number of Rooms | Owner-occupied | Renter-occupied |
| 1 Room | 29 (0.8%) | 139 (5.5%) |
| 2 or 3 Rooms | 81 (2.1%) | 735 (29.0%) |
| 4 or 5 Rooms | 1,067 (28.0%) | 994 (39.2%) |
| 6 or 7 Rooms | 1,392 (36.6%) | 524 (20.7%) |
| 8 or more Rooms | 1,237 (32.5%) | 143 (5.6%) |
| Total | 3,806 (100.0%) | 2,535 (100.0%) |
Housing Structure by Heating Type in The Dalles
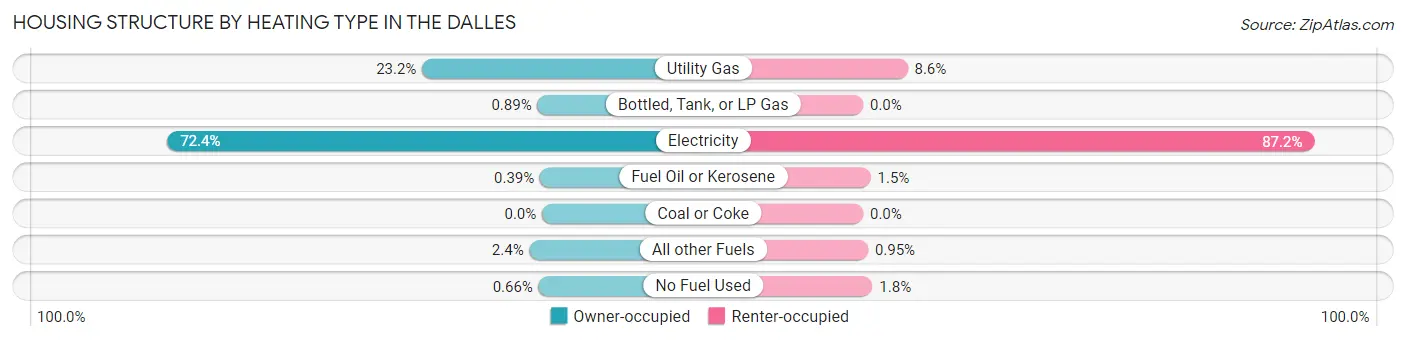
| Heating Type | Owner-occupied | Renter-occupied |
| Utility Gas | 882 (23.2%) | 218 (8.6%) |
| Bottled, Tank, or LP Gas | 34 (0.9%) | 0 (0.0%) |
| Electricity | 2,757 (72.4%) | 2,210 (87.2%) |
| Fuel Oil or Kerosene | 15 (0.4%) | 37 (1.5%) |
| Coal or Coke | 0 (0.0%) | 0 (0.0%) |
| All other Fuels | 93 (2.4%) | 24 (0.9%) |
| No Fuel Used | 25 (0.7%) | 46 (1.8%) |
| Total | 3,806 (100.0%) | 2,535 (100.0%) |
Household Vehicle Usage in The Dalles
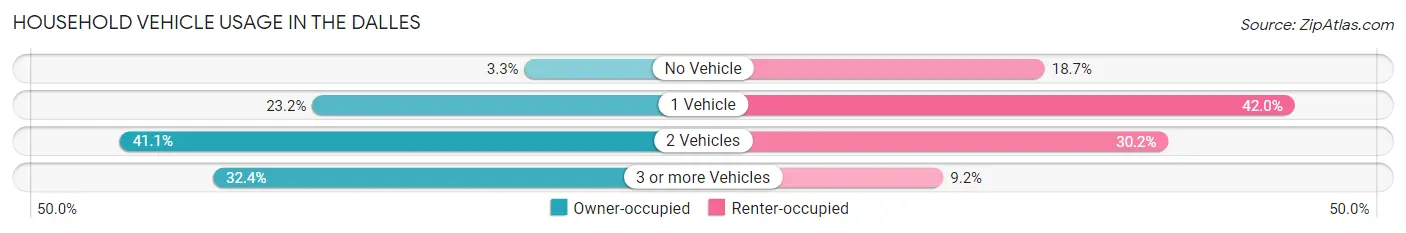
| Vehicles per Household | Owner-occupied | Renter-occupied |
| No Vehicle | 127 (3.3%) | 473 (18.7%) |
| 1 Vehicle | 881 (23.2%) | 1,064 (42.0%) |
| 2 Vehicles | 1,565 (41.1%) | 765 (30.2%) |
| 3 or more Vehicles | 1,233 (32.4%) | 233 (9.2%) |
| Total | 3,806 (100.0%) | 2,535 (100.0%) |
Real Estate & Mortgages in The Dalles
Real Estate and Mortgage Overview in The Dalles
| Characteristic | Without Mortgage | With Mortgage |
| Housing Units | 1,342 | 2,464 |
| Median Property Value | $255,700 | $294,200 |
| Median Household Income | $53,276 | $474 |
| Monthly Housing Costs | $540 | $140 |
| Real Estate Taxes | $2,574 | $56 |
Property Value by Mortgage Status in The Dalles
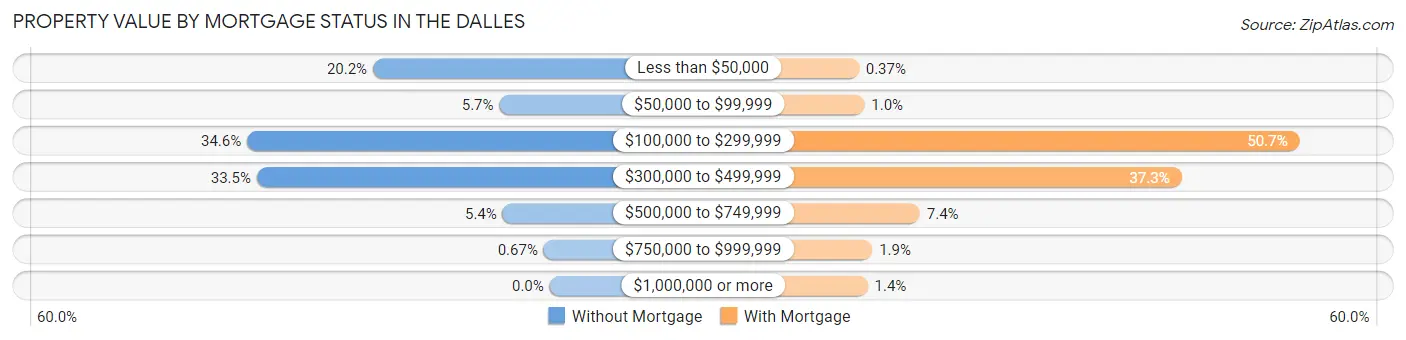
| Property Value | Without Mortgage | With Mortgage |
| Less than $50,000 | 271 (20.2%) | 9 (0.4%) |
| $50,000 to $99,999 | 77 (5.7%) | 25 (1.0%) |
| $100,000 to $299,999 | 464 (34.6%) | 1,250 (50.7%) |
| $300,000 to $499,999 | 449 (33.5%) | 918 (37.3%) |
| $500,000 to $749,999 | 72 (5.4%) | 181 (7.3%) |
| $750,000 to $999,999 | 9 (0.7%) | 47 (1.9%) |
| $1,000,000 or more | 0 (0.0%) | 34 (1.4%) |
| Total | 1,342 (100.0%) | 2,464 (100.0%) |
Household Income by Mortgage Status in The Dalles
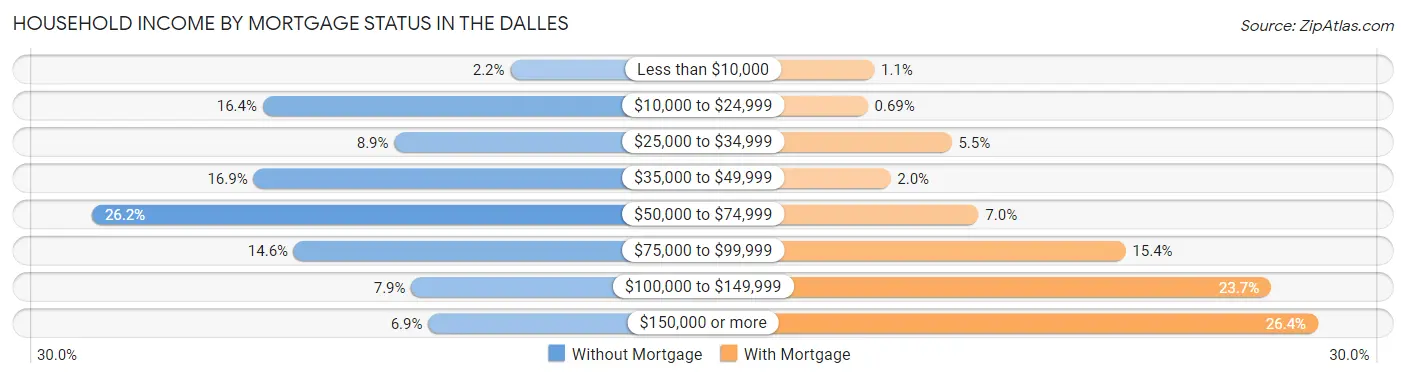
| Household Income | Without Mortgage | With Mortgage |
| Less than $10,000 | 30 (2.2%) | 26 (1.1%) |
| $10,000 to $24,999 | 220 (16.4%) | 17 (0.7%) |
| $25,000 to $34,999 | 119 (8.9%) | 135 (5.5%) |
| $35,000 to $49,999 | 227 (16.9%) | 49 (2.0%) |
| $50,000 to $74,999 | 351 (26.2%) | 173 (7.0%) |
| $75,000 to $99,999 | 196 (14.6%) | 380 (15.4%) |
| $100,000 to $149,999 | 106 (7.9%) | 585 (23.7%) |
| $150,000 or more | 93 (6.9%) | 651 (26.4%) |
| Total | 1,342 (100.0%) | 2,464 (100.0%) |
Property Value to Household Income Ratio in The Dalles
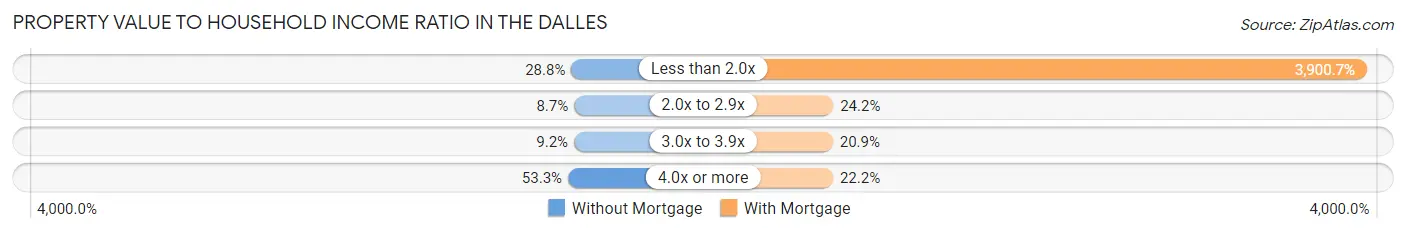
| Value-to-Income Ratio | Without Mortgage | With Mortgage |
| Less than 2.0x | 387 (28.8%) | 96,114 (3,900.7%) |
| 2.0x to 2.9x | 117 (8.7%) | 595 (24.1%) |
| 3.0x to 3.9x | 123 (9.2%) | 515 (20.9%) |
| 4.0x or more | 715 (53.3%) | 548 (22.2%) |
| Total | 1,342 (100.0%) | 2,464 (100.0%) |
Real Estate Taxes by Mortgage Status in The Dalles
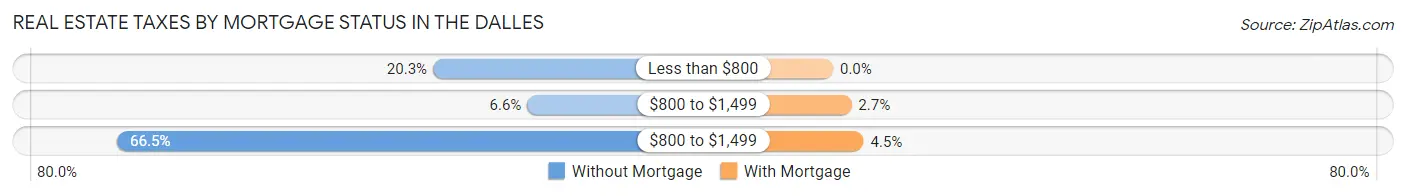
| Property Taxes | Without Mortgage | With Mortgage |
| Less than $800 | 273 (20.3%) | 0 (0.0%) |
| $800 to $1,499 | 88 (6.6%) | 66 (2.7%) |
| $800 to $1,499 | 892 (66.5%) | 110 (4.5%) |
| Total | 1,342 (100.0%) | 2,464 (100.0%) |
Health & Disability in The Dalles
Health Insurance Coverage by Age in The Dalles
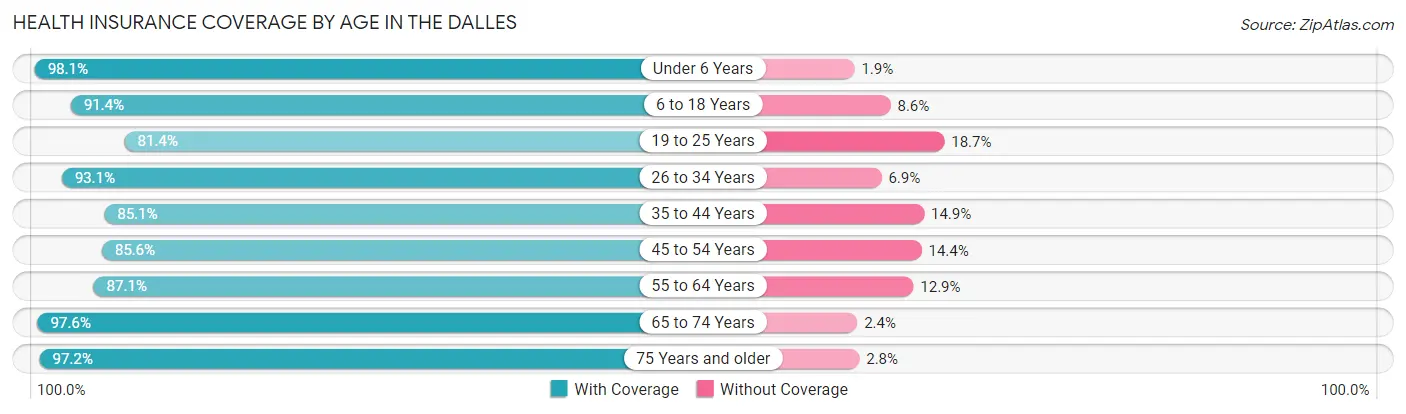
| Age Bracket | With Coverage | Without Coverage |
| Under 6 Years | 1,136 (98.1%) | 22 (1.9%) |
| 6 to 18 Years | 2,449 (91.4%) | 231 (8.6%) |
| 19 to 25 Years | 1,099 (81.4%) | 252 (18.6%) |
| 26 to 34 Years | 1,879 (93.1%) | 140 (6.9%) |
| 35 to 44 Years | 1,769 (85.1%) | 309 (14.9%) |
| 45 to 54 Years | 1,332 (85.6%) | 224 (14.4%) |
| 55 to 64 Years | 1,590 (87.1%) | 235 (12.9%) |
| 65 to 74 Years | 1,700 (97.6%) | 42 (2.4%) |
| 75 Years and older | 1,110 (97.2%) | 32 (2.8%) |
| Total | 14,064 (90.4%) | 1,487 (9.6%) |
Health Insurance Coverage by Citizenship Status in The Dalles
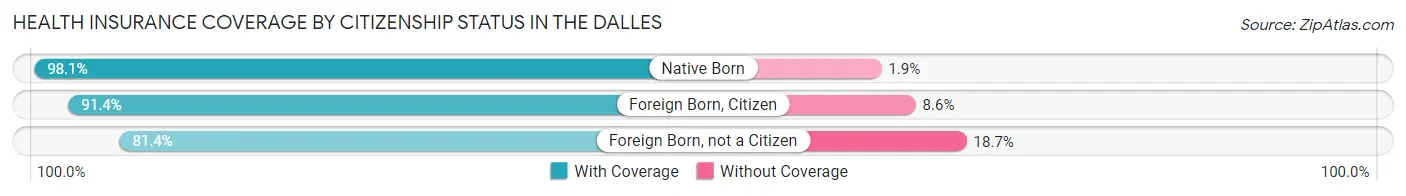
| Citizenship Status | With Coverage | Without Coverage |
| Native Born | 1,136 (98.1%) | 22 (1.9%) |
| Foreign Born, Citizen | 2,449 (91.4%) | 231 (8.6%) |
| Foreign Born, not a Citizen | 1,099 (81.4%) | 252 (18.6%) |
Health Insurance Coverage by Household Income in The Dalles
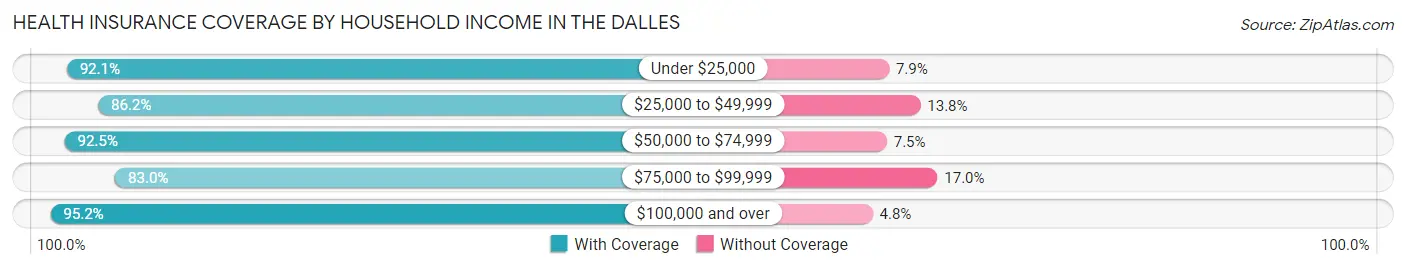
| Household Income | With Coverage | Without Coverage |
| Under $25,000 | 1,387 (92.1%) | 119 (7.9%) |
| $25,000 to $49,999 | 2,521 (86.2%) | 403 (13.8%) |
| $50,000 to $74,999 | 2,816 (92.5%) | 228 (7.5%) |
| $75,000 to $99,999 | 2,403 (83.0%) | 491 (17.0%) |
| $100,000 and over | 4,836 (95.2%) | 246 (4.8%) |
Public vs Private Health Insurance Coverage by Age in The Dalles
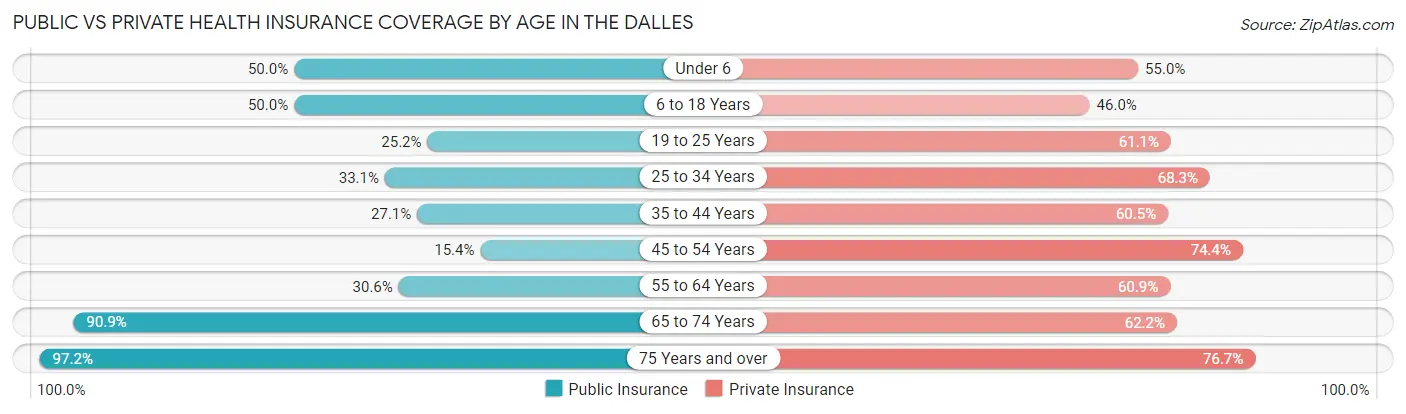
| Age Bracket | Public Insurance | Private Insurance |
| Under 6 | 579 (50.0%) | 637 (55.0%) |
| 6 to 18 Years | 1,340 (50.0%) | 1,233 (46.0%) |
| 19 to 25 Years | 341 (25.2%) | 825 (61.1%) |
| 25 to 34 Years | 669 (33.1%) | 1,379 (68.3%) |
| 35 to 44 Years | 564 (27.1%) | 1,258 (60.5%) |
| 45 to 54 Years | 240 (15.4%) | 1,158 (74.4%) |
| 55 to 64 Years | 558 (30.6%) | 1,112 (60.9%) |
| 65 to 74 Years | 1,584 (90.9%) | 1,083 (62.2%) |
| 75 Years and over | 1,110 (97.2%) | 876 (76.7%) |
| Total | 6,985 (44.9%) | 9,561 (61.5%) |
Disability Status by Sex by Age in The Dalles
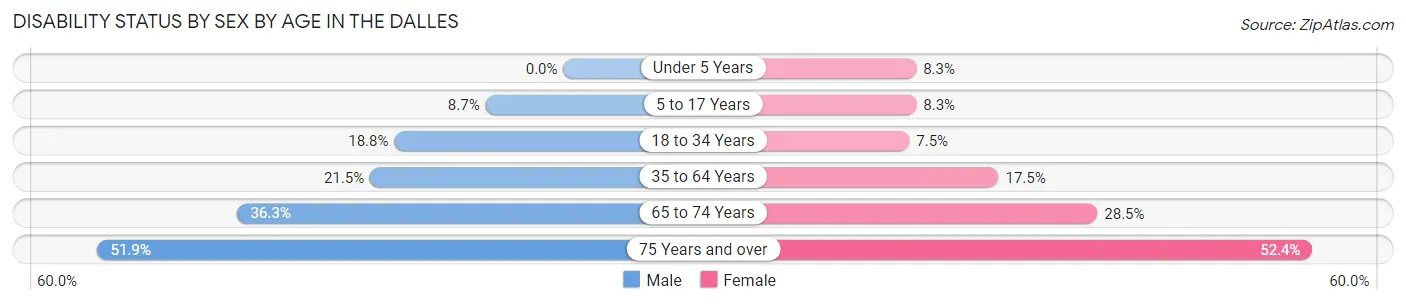
| Age Bracket | Male | Female |
| Under 5 Years | 0 (0.0%) | 32 (8.3%) |
| 5 to 17 Years | 111 (8.7%) | 123 (8.3%) |
| 18 to 34 Years | 312 (18.8%) | 141 (7.5%) |
| 35 to 64 Years | 576 (21.5%) | 486 (17.5%) |
| 65 to 74 Years | 307 (36.3%) | 255 (28.5%) |
| 75 Years and over | 236 (51.9%) | 360 (52.4%) |
Disability Class by Sex by Age in The Dalles
Disability Class: Hearing Difficulty
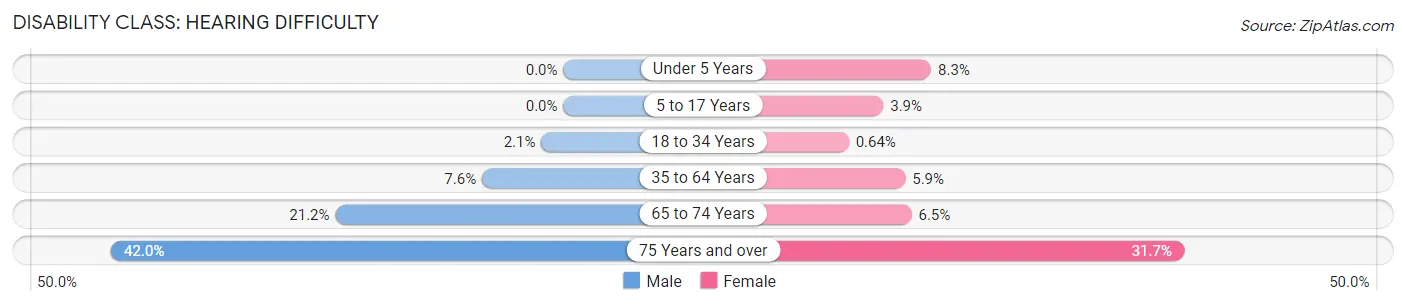
| Age Bracket | Male | Female |
| Under 5 Years | 0 (0.0%) | 32 (8.3%) |
| 5 to 17 Years | 0 (0.0%) | 57 (3.8%) |
| 18 to 34 Years | 34 (2.1%) | 12 (0.6%) |
| 35 to 64 Years | 202 (7.5%) | 164 (5.9%) |
| 65 to 74 Years | 179 (21.2%) | 58 (6.5%) |
| 75 Years and over | 191 (42.0%) | 218 (31.7%) |
Disability Class: Vision Difficulty
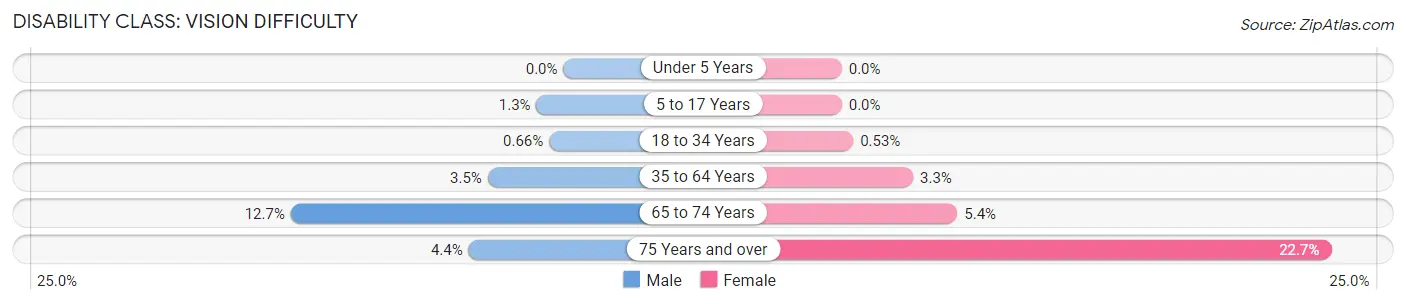
| Age Bracket | Male | Female |
| Under 5 Years | 0 (0.0%) | 0 (0.0%) |
| 5 to 17 Years | 16 (1.3%) | 0 (0.0%) |
| 18 to 34 Years | 11 (0.7%) | 10 (0.5%) |
| 35 to 64 Years | 94 (3.5%) | 92 (3.3%) |
| 65 to 74 Years | 107 (12.7%) | 48 (5.4%) |
| 75 Years and over | 20 (4.4%) | 156 (22.7%) |
Disability Class: Cognitive Difficulty
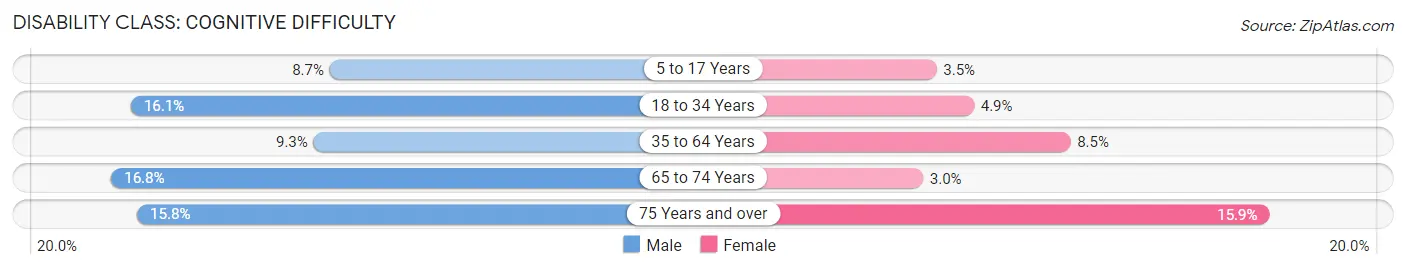
| Age Bracket | Male | Female |
| 5 to 17 Years | 111 (8.7%) | 52 (3.5%) |
| 18 to 34 Years | 266 (16.1%) | 92 (4.9%) |
| 35 to 64 Years | 248 (9.3%) | 236 (8.5%) |
| 65 to 74 Years | 142 (16.8%) | 27 (3.0%) |
| 75 Years and over | 72 (15.8%) | 109 (15.9%) |
Disability Class: Ambulatory Difficulty
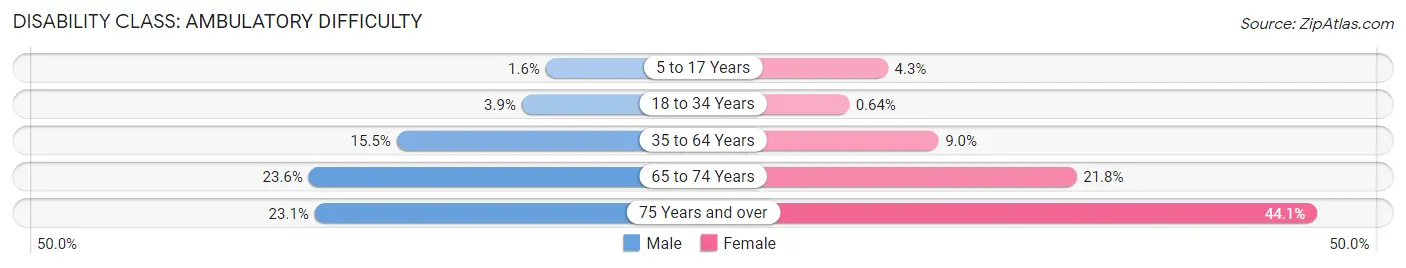
| Age Bracket | Male | Female |
| 5 to 17 Years | 21 (1.6%) | 63 (4.3%) |
| 18 to 34 Years | 64 (3.9%) | 12 (0.6%) |
| 35 to 64 Years | 414 (15.5%) | 249 (8.9%) |
| 65 to 74 Years | 200 (23.6%) | 195 (21.8%) |
| 75 Years and over | 105 (23.1%) | 303 (44.1%) |
Disability Class: Self-Care Difficulty
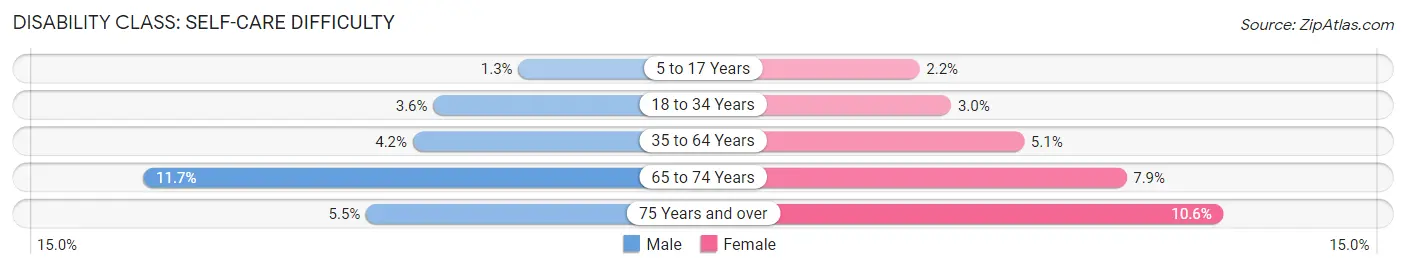
| Age Bracket | Male | Female |
| 5 to 17 Years | 16 (1.3%) | 32 (2.2%) |
| 18 to 34 Years | 60 (3.6%) | 57 (3.0%) |
| 35 to 64 Years | 112 (4.2%) | 141 (5.1%) |
| 65 to 74 Years | 99 (11.7%) | 71 (7.9%) |
| 75 Years and over | 25 (5.5%) | 73 (10.6%) |
Technology Access in The Dalles
Computing Device Access in The Dalles
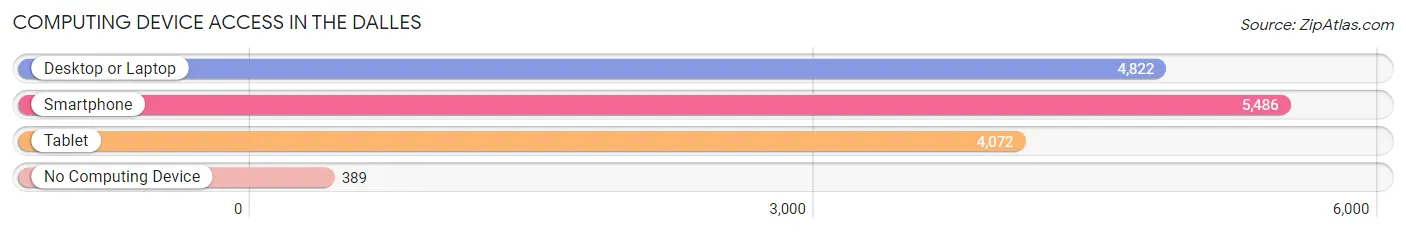
| Device Type | # Households | % Households |
| Desktop or Laptop | 4,822 | 76.0% |
| Smartphone | 5,486 | 86.5% |
| Tablet | 4,072 | 64.2% |
| No Computing Device | 389 | 6.1% |
| Total | 6,341 | 100.0% |
Internet Access in The Dalles
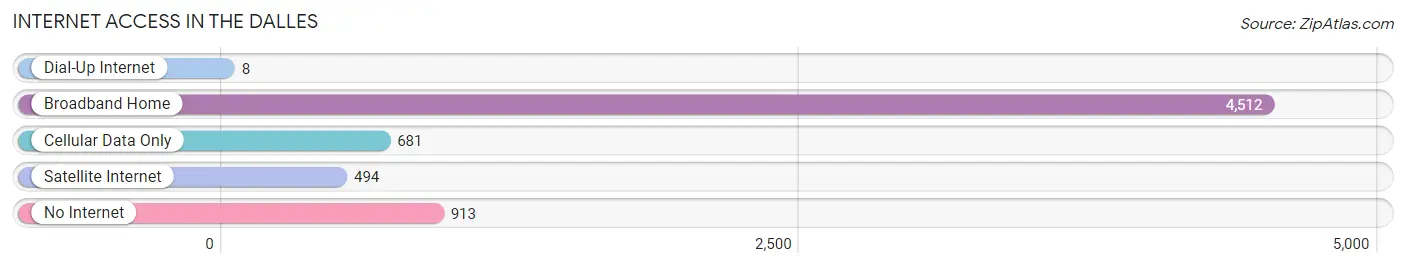
| Internet Type | # Households | % Households |
| Dial-Up Internet | 8 | 0.1% |
| Broadband Home | 4,512 | 71.2% |
| Cellular Data Only | 681 | 10.7% |
| Satellite Internet | 494 | 7.8% |
| No Internet | 913 | 14.4% |
| Total | 6,341 | 100.0% |
The Dalles Summary
The Dalles, Oregon is a city located in Wasco County in the state of Oregon. It is situated on the Columbia River, approximately 80 miles east of Portland. The city is the county seat of Wasco County and is the largest city in the county. The population of The Dalles was estimated to be 13,620 in 2019.
History
The Dalles was first inhabited by Native Americans, including the Wasco, Wishram, and Chinook tribes. The area was first explored by Europeans in 1805, when Lewis and Clark passed through the area. The first permanent settlement was established in 1821, when the Hudson's Bay Company established Fort Dalles. The fort was used as a trading post and was the first permanent settlement in the area.
In 1855, the city was incorporated as The Dalles. The city was named after the rapids of the Columbia River, which were known as the "Dalles of the Columbia". The city quickly grew and became an important trading center for the region. In the late 19th century, The Dalles was a major stop on the Oregon Trail.
Geography
The Dalles is located in the Columbia River Gorge, a deep canyon that was carved by the Columbia River. The city is situated on the north bank of the river, and is surrounded by the Cascade Mountains to the east and the Columbia Plateau to the west. The city has a total area of 8.3 square miles, of which 8.2 square miles is land and 0.1 square miles is water.
The climate in The Dalles is semi-arid, with hot summers and cold winters. The average annual precipitation is 11.3 inches, with most of the precipitation occurring in the winter months.
Economy
The economy of The Dalles is largely based on agriculture and tourism. The city is home to several wineries, and is a popular destination for wine tasting. The city is also home to several fruit orchards, and is a major producer of apples, pears, and cherries.
The city is also home to several manufacturing companies, including a paper mill, a steel mill, and a food processing plant. The city is also home to several retail stores, restaurants, and other businesses.
Demographics
The population of The Dalles was estimated to be 13,620 in 2019. The population is predominantly white, with a small Hispanic population. The median household income is $41,845, and the median home value is $182,400. The city has a poverty rate of 16.3%, and the unemployment rate is 4.2%.
The city is served by the Wasco County School District, which includes four elementary schools, one middle school, and one high school. The city is also home to several private schools, including a Catholic school and a Christian school.
Conclusion
The Dalles, Oregon is a city located in Wasco County in the state of Oregon. It is situated on the Columbia River, approximately 80 miles east of Portland. The city is the county seat of Wasco County and is the largest city in the county. The population of The Dalles was estimated to be 13,620 in 2019. The city is largely based on agriculture and tourism, and is home to several wineries, fruit orchards, manufacturing companies, and other businesses. The population is predominantly white, with a small Hispanic population. The median household income is $41,845, and the median home value is $182,400. The city is served by the Wasco County School District, which includes four elementary schools, one middle school, and one high school.
Common Questions
What is Per Capita Income in The Dalles?
Per Capita income in The Dalles is $35,644.
What is the Median Family Income in The Dalles?
Median Family Income in The Dalles is $79,114.
What is the Median Household income in The Dalles?
Median Household Income in The Dalles is $59,714.
What is Income or Wage Gap in The Dalles?
Income or Wage Gap in The Dalles is 32.9%.
Women in The Dalles earn 67.1 cents for every dollar earned by a man.
What is Family Income Deficit in The Dalles?
Family Income Deficit in The Dalles is $10,905.
Families that are below poverty line in The Dalles earn $10,905 less on average than the poverty threshold level.
What is Inequality or Gini Index in The Dalles?
Inequality or Gini Index in The Dalles is 0.50.
What is the Total Population of The Dalles?
Total Population of The Dalles is 15,988.
What is the Total Male Population of The Dalles?
Total Male Population of The Dalles is 7,705.
What is the Total Female Population of The Dalles?
Total Female Population of The Dalles is 8,283.
What is the Ratio of Males per 100 Females in The Dalles?
There are 93.02 Males per 100 Females in The Dalles.
What is the Ratio of Females per 100 Males in The Dalles?
There are 107.50 Females per 100 Males in The Dalles.
What is the Median Population Age in The Dalles?
Median Population Age in The Dalles is 37.4 Years.
What is the Average Family Size in The Dalles
Average Family Size in The Dalles is 3.1 People.
What is the Average Household Size in The Dalles
Average Household Size in The Dalles is 2.4 People.
How Large is the Labor Force in The Dalles?
There are 7,746 People in the Labor Forcein in The Dalles.
What is the Percentage of People in the Labor Force in The Dalles?
60.9% of People are in the Labor Force in The Dalles.
What is the Unemployment Rate in The Dalles?
Unemployment Rate in The Dalles is 7.1%.