Oatfield, OR Map & Demographics
Oatfield Map
Oatfield Overview
$43,783
PER CAPITA INCOME
$110,871
AVG FAMILY INCOME
$100,467
AVG HOUSEHOLD INCOME
23.4%
WAGE / INCOME GAP [ % ]
76.6¢/ $1
WAGE / INCOME GAP [ $ ]
0.37
INEQUALITY / GINI INDEX
13,073
TOTAL POPULATION
6,039
MALE POPULATION
7,034
FEMALE POPULATION
85.85
MALES / 100 FEMALES
116.48
FEMALES / 100 MALES
46.5
MEDIAN AGE
2.9
AVG FAMILY SIZE
2.6
AVG HOUSEHOLD SIZE
6,519
LABOR FORCE [ PEOPLE ]
58.6%
PERCENT IN LABOR FORCE
4.5%
UNEMPLOYMENT RATE
Income in Oatfield
Income Overview in Oatfield
Per Capita Income in Oatfield is $43,783, while median incomes of families and households are $110,871 and $100,467 respectively.
| Characteristic | Number | Measure |
| Per Capita Income | 13,073 | $43,783 |
| Median Family Income | 3,572 | $110,871 |
| Mean Family Income | 3,572 | $128,455 |
| Median Household Income | 4,841 | $100,467 |
| Mean Household Income | 4,841 | $112,687 |
| Income Deficit | 3,572 | $0 |
| Wage / Income Gap (%) | 13,073 | 23.37% |
| Wage / Income Gap ($) | 13,073 | 76.63¢ per $1 |
| Gini / Inequality Index | 13,073 | 0.37 |
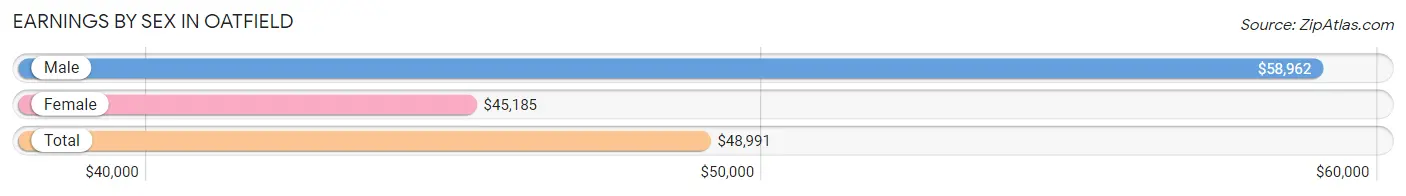
Earnings by Sex in Oatfield
Average Earnings in Oatfield are $48,991, $58,962 for men and $45,185 for women, a difference of 23.4%.
| Sex | Number | Average Earnings |
| Male | 3,402 (49.4%) | $58,962 |
| Female | 3,488 (50.6%) | $45,185 |
| Total | 6,890 (100.0%) | $48,991 |
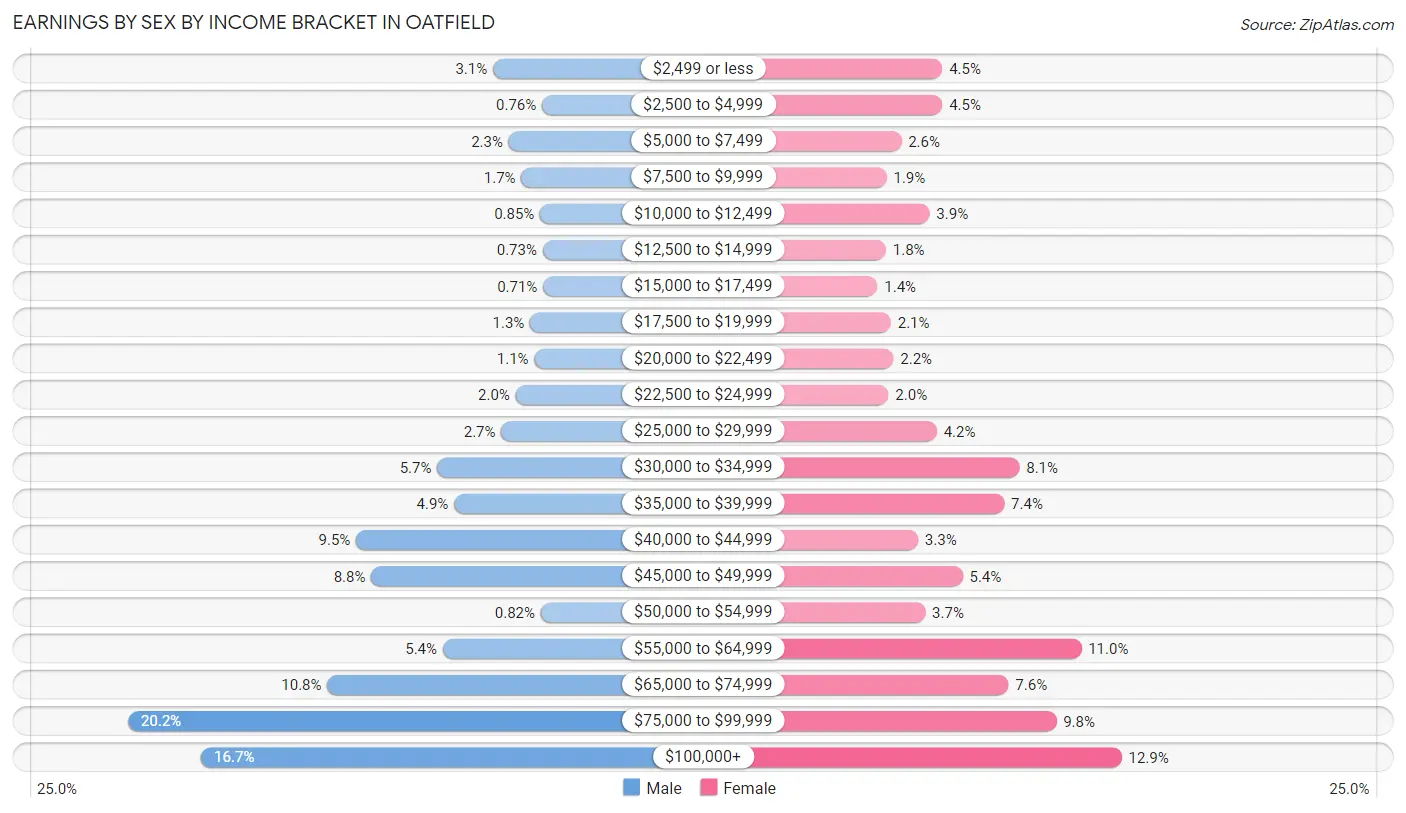
Earnings by Sex by Income Bracket in Oatfield
The most common earnings brackets in Oatfield are $75,000 to $99,999 for men (686 | 20.2%) and $100,000+ for women (449 | 12.9%).
| Income | Male | Female |
| $2,499 or less | 104 (3.1%) | 156 (4.5%) |
| $2,500 to $4,999 | 26 (0.8%) | 156 (4.5%) |
| $5,000 to $7,499 | 79 (2.3%) | 89 (2.5%) |
| $7,500 to $9,999 | 59 (1.7%) | 65 (1.9%) |
| $10,000 to $12,499 | 29 (0.9%) | 135 (3.9%) |
| $12,500 to $14,999 | 25 (0.7%) | 64 (1.8%) |
| $15,000 to $17,499 | 24 (0.7%) | 50 (1.4%) |
| $17,500 to $19,999 | 45 (1.3%) | 72 (2.1%) |
| $20,000 to $22,499 | 38 (1.1%) | 76 (2.2%) |
| $22,500 to $24,999 | 68 (2.0%) | 68 (1.9%) |
| $25,000 to $29,999 | 91 (2.7%) | 147 (4.2%) |
| $30,000 to $34,999 | 193 (5.7%) | 282 (8.1%) |
| $35,000 to $39,999 | 166 (4.9%) | 257 (7.4%) |
| $40,000 to $44,999 | 322 (9.5%) | 116 (3.3%) |
| $45,000 to $49,999 | 298 (8.8%) | 189 (5.4%) |
| $50,000 to $54,999 | 28 (0.8%) | 128 (3.7%) |
| $55,000 to $64,999 | 184 (5.4%) | 383 (11.0%) |
| $65,000 to $74,999 | 368 (10.8%) | 264 (7.6%) |
| $75,000 to $99,999 | 686 (20.2%) | 342 (9.8%) |
| $100,000+ | 569 (16.7%) | 449 (12.9%) |
| Total | 3,402 (100.0%) | 3,488 (100.0%) |
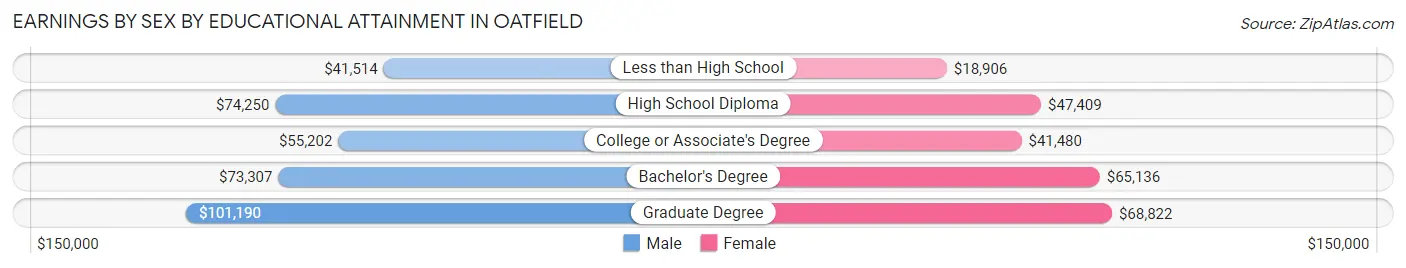
Earnings by Sex by Educational Attainment in Oatfield
Average earnings in Oatfield are $67,624 for men and $50,167 for women, a difference of 25.8%. Men with an educational attainment of graduate degree enjoy the highest average annual earnings of $101,190, while those with less than high school education earn the least with $41,514. Women with an educational attainment of graduate degree earn the most with the average annual earnings of $68,822, while those with less than high school education have the smallest earnings of $18,906.
| Educational Attainment | Male Income | Female Income |
| Less than High School | $41,514 | $18,906 |
| High School Diploma | $74,250 | $47,409 |
| College or Associate's Degree | $55,202 | $41,480 |
| Bachelor's Degree | $73,307 | $65,136 |
| Graduate Degree | $101,190 | $68,822 |
| Total | $67,624 | $50,167 |
Family Income in Oatfield
Family Income Brackets in Oatfield
According to the Oatfield family income data, there are 964 families falling into the $100,000 to $149,999 income range, which is the most common income bracket and makes up 27.0% of all families. Conversely, the $10,000 to $14,999 income bracket is the least frequent group with only 43 families (1.2%) belonging to this category.
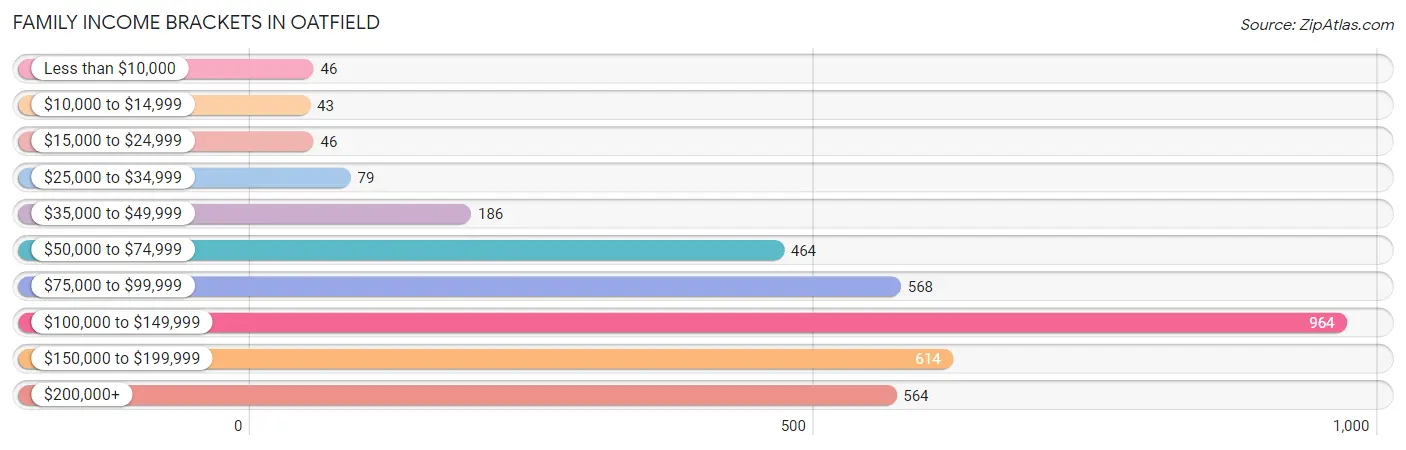
| Income Bracket | # Families | % Families |
| Less than $10,000 | 46 | 1.3% |
| $10,000 to $14,999 | 43 | 1.2% |
| $15,000 to $24,999 | 46 | 1.3% |
| $25,000 to $34,999 | 79 | 2.2% |
| $35,000 to $49,999 | 186 | 5.2% |
| $50,000 to $74,999 | 464 | 13.0% |
| $75,000 to $99,999 | 568 | 15.9% |
| $100,000 to $149,999 | 964 | 27.0% |
| $150,000 to $199,999 | 614 | 17.2% |
| $200,000+ | 564 | 15.8% |
Family Income by Famaliy Size in Oatfield
4-person families (703 | 19.7%) account for the highest median family income in Oatfield with $161,431 per family, while 2-person families (2,037 | 57.0%) have the highest median income of $50,184 per family member.
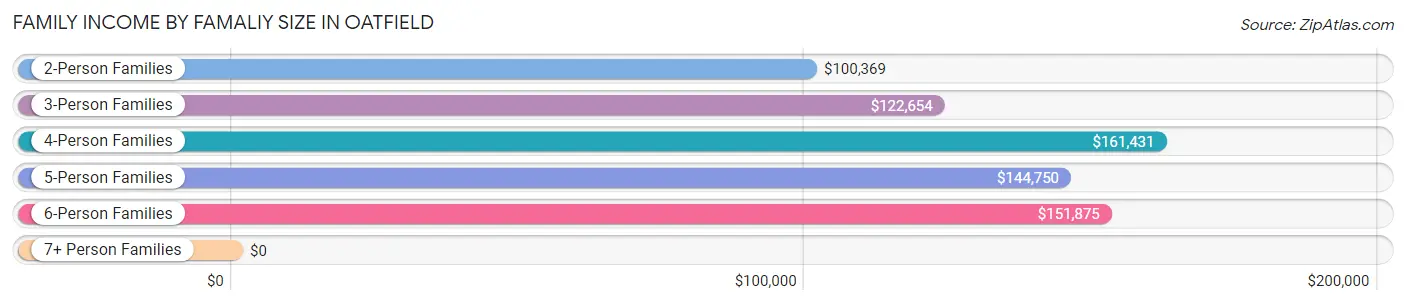
| Income Bracket | # Families | Median Income |
| 2-Person Families | 2,037 (57.0%) | $100,369 |
| 3-Person Families | 619 (17.3%) | $122,654 |
| 4-Person Families | 703 (19.7%) | $161,431 |
| 5-Person Families | 136 (3.8%) | $144,750 |
| 6-Person Families | 64 (1.8%) | $151,875 |
| 7+ Person Families | 13 (0.4%) | $0 |
| Total | 3,572 (100.0%) | $110,871 |
Family Income by Number of Earners in Oatfield
The median family income in Oatfield is $110,871, with families comprising 3+ earners (395) having the highest median family income of $169,135, while families with no earners (617) have the lowest median family income of $68,750, accounting for 11.1% and 17.3% of families, respectively.
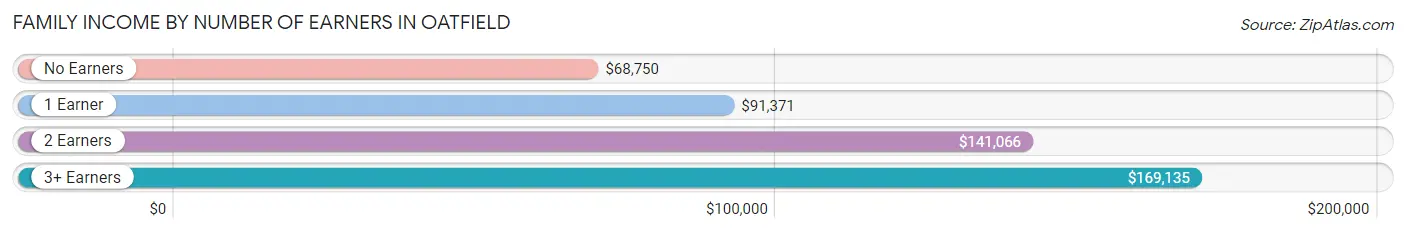
| Number of Earners | # Families | Median Income |
| No Earners | 617 (17.3%) | $68,750 |
| 1 Earner | 922 (25.8%) | $91,371 |
| 2 Earners | 1,638 (45.9%) | $141,066 |
| 3+ Earners | 395 (11.1%) | $169,135 |
| Total | 3,572 (100.0%) | $110,871 |
Household Income in Oatfield
Household Income Brackets in Oatfield
With 1,123 households falling in the category, the $100,000 to $149,999 income range is the most frequent in Oatfield, accounting for 23.2% of all households. In contrast, only 111 households (2.3%) fall into the $10,000 to $14,999 income bracket, making it the least populous group.
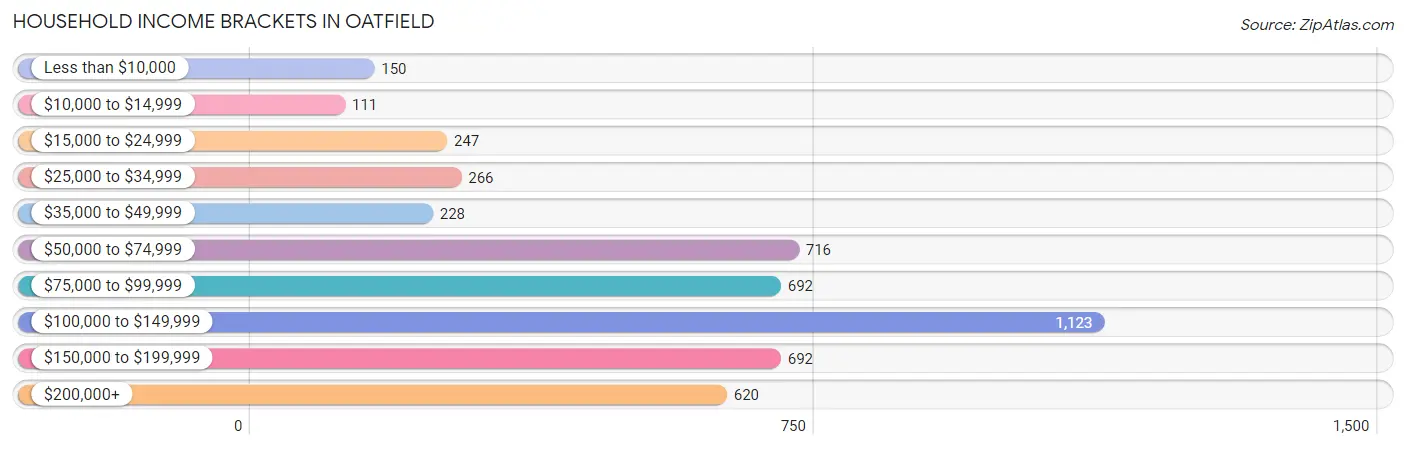
| Income Bracket | # Households | % Households |
| Less than $10,000 | 150 | 3.1% |
| $10,000 to $14,999 | 111 | 2.3% |
| $15,000 to $24,999 | 247 | 5.1% |
| $25,000 to $34,999 | 266 | 5.5% |
| $35,000 to $49,999 | 228 | 4.7% |
| $50,000 to $74,999 | 716 | 14.8% |
| $75,000 to $99,999 | 692 | 14.3% |
| $100,000 to $149,999 | 1,123 | 23.2% |
| $150,000 to $199,999 | 692 | 14.3% |
| $200,000+ | 620 | 12.8% |
Household Income by Householder Age in Oatfield
The median household income in Oatfield is $100,467, with the highest median household income of $141,180 found in the 25 to 44 years age bracket for the primary householder. A total of 1,398 households (28.9%) fall into this category. Meanwhile, the 15 to 24 years age bracket for the primary householder has the lowest median household income of $0, with 16 households (0.3%) in this group.
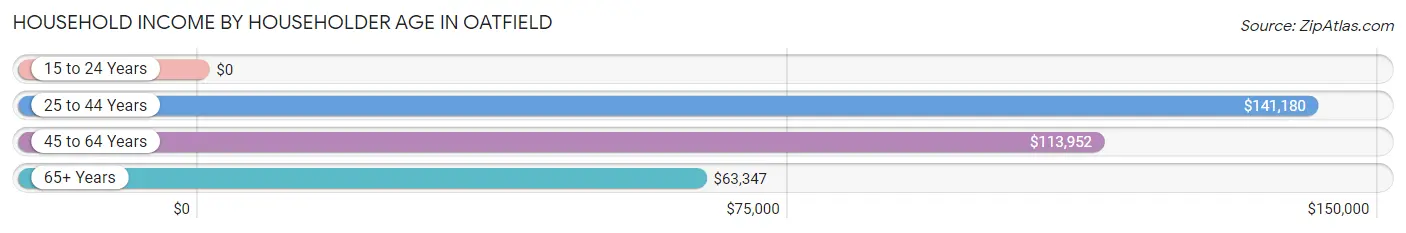
| Income Bracket | # Households | Median Income |
| 15 to 24 Years | 16 (0.3%) | $0 |
| 25 to 44 Years | 1,398 (28.9%) | $141,180 |
| 45 to 64 Years | 1,636 (33.8%) | $113,952 |
| 65+ Years | 1,791 (37.0%) | $63,347 |
| Total | 4,841 (100.0%) | $100,467 |
Poverty in Oatfield
Income Below Poverty by Sex and Age in Oatfield
With 8.4% poverty level for males and 10.6% for females among the residents of Oatfield, 65 to 74 year old males and 16 and 17 year old females are the most vulnerable to poverty, with 178 males (19.8%) and 23 females (60.5%) in their respective age groups living below the poverty level.
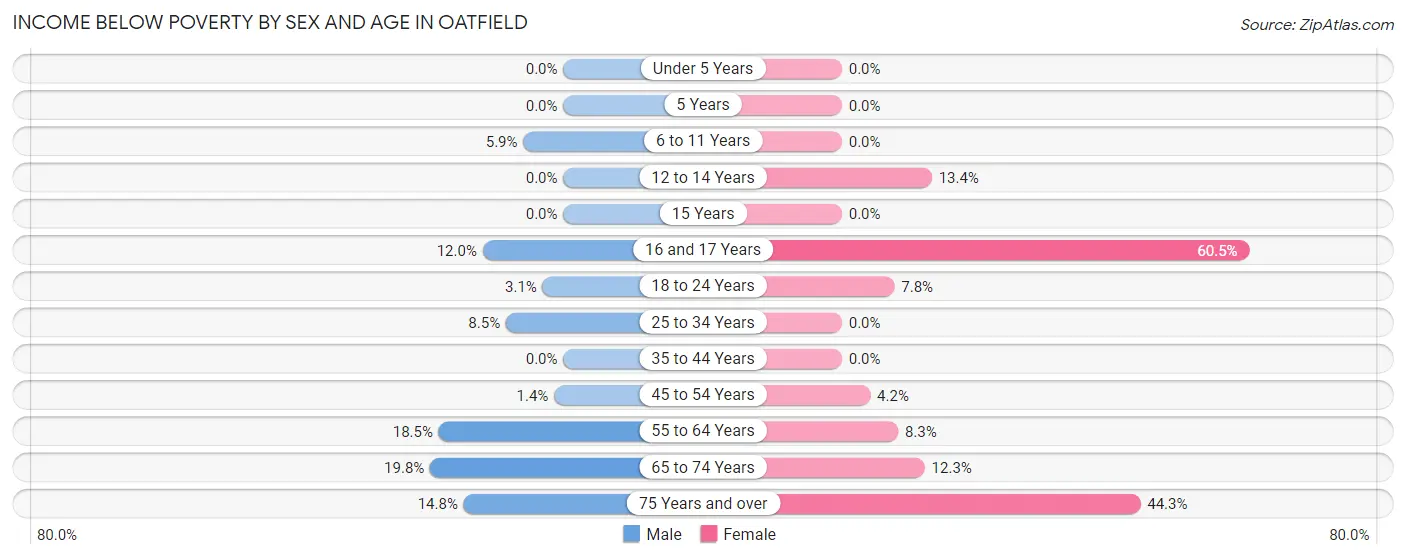
| Age Bracket | Male | Female |
| Under 5 Years | 0 (0.0%) | 0 (0.0%) |
| 5 Years | 0 (0.0%) | 0 (0.0%) |
| 6 to 11 Years | 12 (5.9%) | 0 (0.0%) |
| 12 to 14 Years | 0 (0.0%) | 51 (13.4%) |
| 15 Years | 0 (0.0%) | 0 (0.0%) |
| 16 and 17 Years | 14 (12.0%) | 23 (60.5%) |
| 18 to 24 Years | 13 (3.1%) | 35 (7.8%) |
| 25 to 34 Years | 46 (8.5%) | 0 (0.0%) |
| 35 to 44 Years | 0 (0.0%) | 0 (0.0%) |
| 45 to 54 Years | 10 (1.4%) | 31 (4.2%) |
| 55 to 64 Years | 166 (18.5%) | 81 (8.3%) |
| 65 to 74 Years | 178 (19.8%) | 135 (12.3%) |
| 75 Years and over | 63 (14.8%) | 383 (44.3%) |
| Total | 502 (8.4%) | 739 (10.6%) |
Income Above Poverty by Sex and Age in Oatfield
According to the poverty statistics in Oatfield, males aged under 5 years and females aged under 5 years are the age groups that are most secure financially, with 100.0% of males and 100.0% of females in these age groups living above the poverty line.
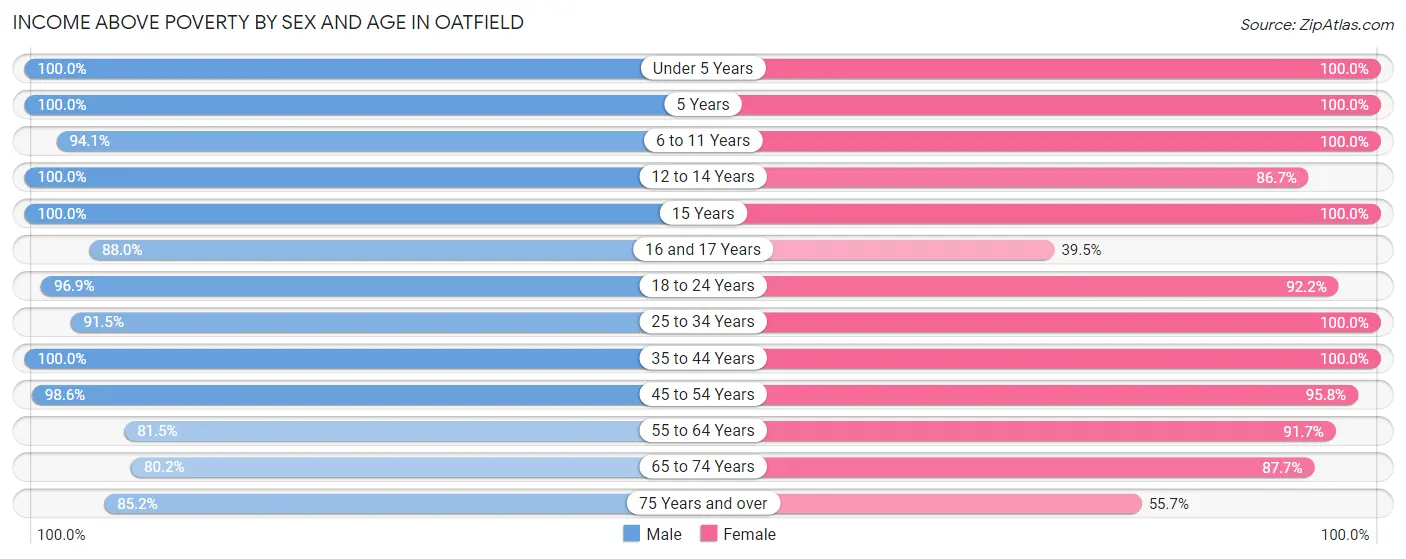
| Age Bracket | Male | Female |
| Under 5 Years | 392 (100.0%) | 278 (100.0%) |
| 5 Years | 47 (100.0%) | 160 (100.0%) |
| 6 to 11 Years | 190 (94.1%) | 199 (100.0%) |
| 12 to 14 Years | 130 (100.0%) | 331 (86.7%) |
| 15 Years | 64 (100.0%) | 49 (100.0%) |
| 16 and 17 Years | 103 (88.0%) | 15 (39.5%) |
| 18 to 24 Years | 410 (96.9%) | 413 (92.2%) |
| 25 to 34 Years | 494 (91.5%) | 669 (100.0%) |
| 35 to 44 Years | 1,073 (100.0%) | 1,095 (100.0%) |
| 45 to 54 Years | 727 (98.6%) | 706 (95.8%) |
| 55 to 64 Years | 732 (81.5%) | 890 (91.7%) |
| 65 to 74 Years | 722 (80.2%) | 963 (87.7%) |
| 75 Years and over | 363 (85.2%) | 481 (55.7%) |
| Total | 5,447 (91.6%) | 6,249 (89.4%) |
Income Below Poverty Among Married-Couple Families in Oatfield
The poverty statistics for married-couple families in Oatfield show that 3.0% or 94 of the total 3,139 families live below the poverty line. Families with no children have the highest poverty rate of 4.4%, comprising of 94 families. On the other hand, families with 1 or 2 children have the lowest poverty rate of 0.0%, which includes 0 families.
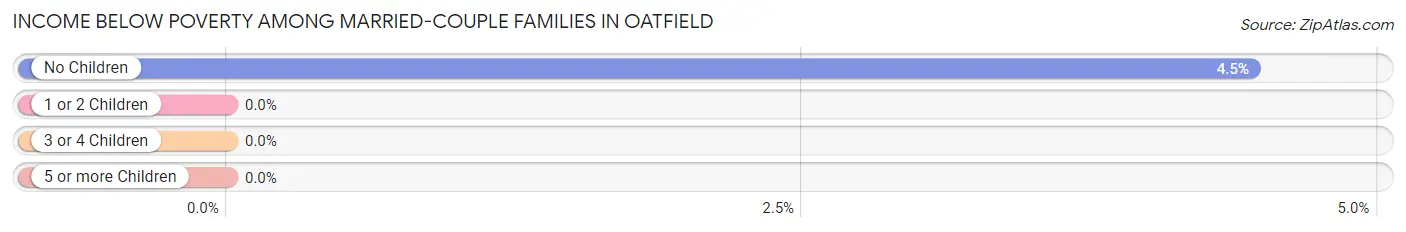
| Children | Above Poverty | Below Poverty |
| No Children | 2,017 (95.6%) | 94 (4.4%) |
| 1 or 2 Children | 990 (100.0%) | 0 (0.0%) |
| 3 or 4 Children | 38 (100.0%) | 0 (0.0%) |
| 5 or more Children | 0 (0.0%) | 0 (0.0%) |
| Total | 3,045 (97.0%) | 94 (3.0%) |
Income Below Poverty Among Single-Parent Households in Oatfield
According to the poverty data in Oatfield, 26.4% or 38 single-father households and 4.2% or 12 single-mother households are living below the poverty line. Among single-father households, those with 3 or 4 children have the highest poverty rate, with 23 households (100.0%) experiencing poverty. Likewise, among single-mother households, those with 1 or 2 children have the highest poverty rate, with 12 households (12.5%) falling below the poverty line.
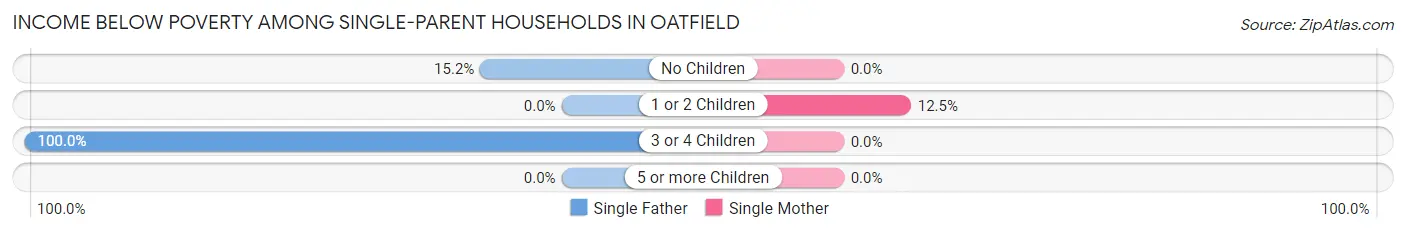
| Children | Single Father | Single Mother |
| No Children | 15 (15.1%) | 0 (0.0%) |
| 1 or 2 Children | 0 (0.0%) | 12 (12.5%) |
| 3 or 4 Children | 23 (100.0%) | 0 (0.0%) |
| 5 or more Children | 0 (0.0%) | 0 (0.0%) |
| Total | 38 (26.4%) | 12 (4.2%) |
Income Below Poverty Among Married-Couple vs Single-Parent Households in Oatfield
The poverty data for Oatfield shows that 94 of the married-couple family households (3.0%) and 50 of the single-parent households (11.6%) are living below the poverty level. Within the married-couple family households, those with no children have the highest poverty rate, with 94 households (4.4%) falling below the poverty line. Among the single-parent households, those with 3 or 4 children have the highest poverty rate, with 23 household (100.0%) living below poverty.
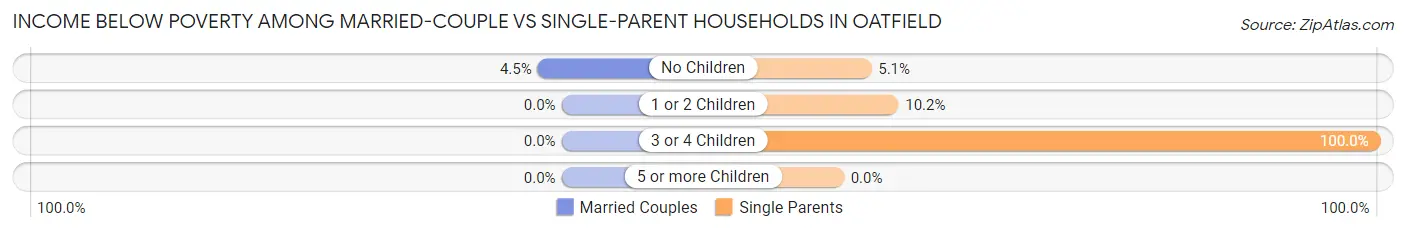
| Children | Married-Couple Families | Single-Parent Households |
| No Children | 94 (4.4%) | 15 (5.1%) |
| 1 or 2 Children | 0 (0.0%) | 12 (10.2%) |
| 3 or 4 Children | 0 (0.0%) | 23 (100.0%) |
| 5 or more Children | 0 (0.0%) | 0 (0.0%) |
| Total | 94 (3.0%) | 50 (11.6%) |
Race in Oatfield
The most populous races in Oatfield are White / Caucasian (10,803 | 82.6%), Hispanic or Latino (1,369 | 10.5%), and Two or more Races (984 | 7.5%).
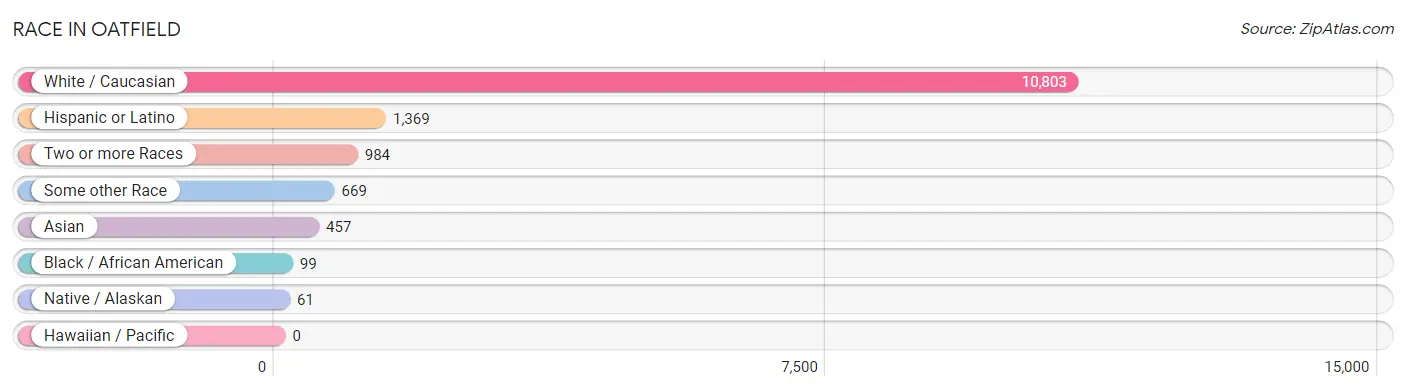
| Race | # Population | % Population |
| Asian | 457 | 3.5% |
| Black / African American | 99 | 0.8% |
| Hawaiian / Pacific | 0 | 0.0% |
| Hispanic or Latino | 1,369 | 10.5% |
| Native / Alaskan | 61 | 0.5% |
| White / Caucasian | 10,803 | 82.6% |
| Two or more Races | 984 | 7.5% |
| Some other Race | 669 | 5.1% |
| Total | 13,073 | 100.0% |
Ancestry in Oatfield
The most populous ancestries reported in Oatfield are German (2,296 | 17.6%), English (1,671 | 12.8%), Irish (1,270 | 9.7%), Mexican (1,004 | 7.7%), and Norwegian (849 | 6.5%), together accounting for 54.2% of all Oatfield residents.
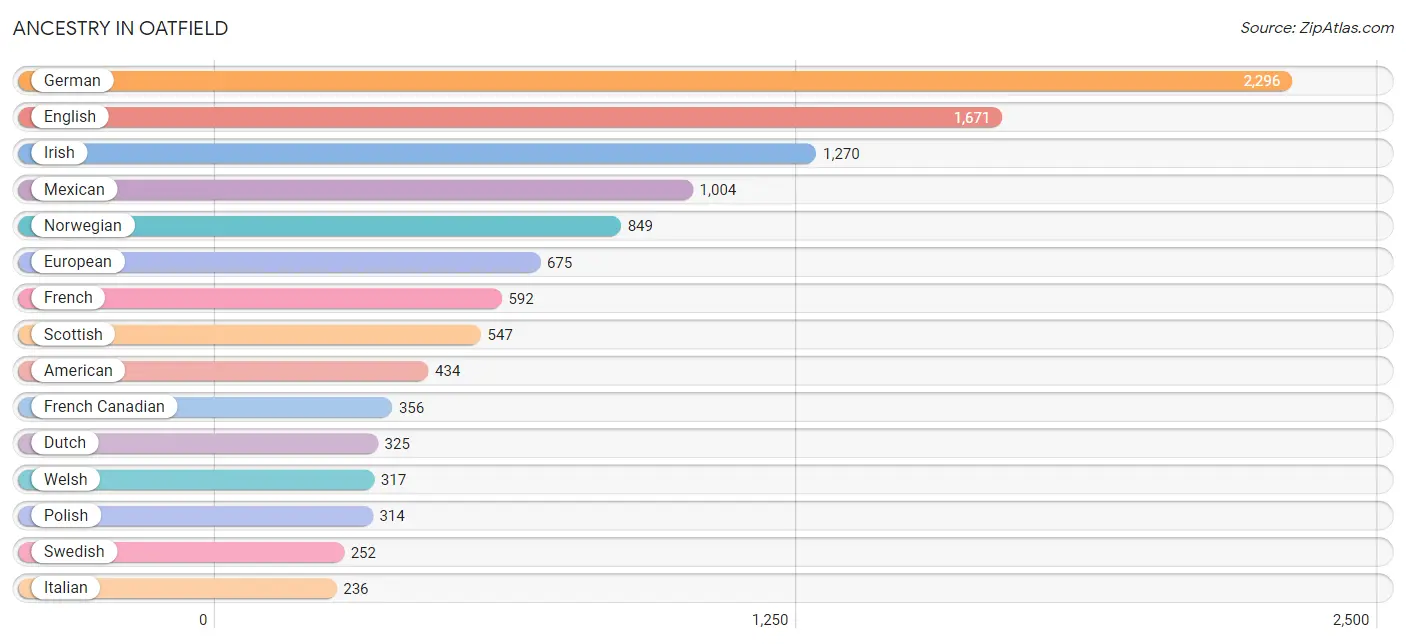
| Ancestry | # Population | % Population |
| African | 18 | 0.1% |
| American | 434 | 3.3% |
| Arab | 15 | 0.1% |
| Austrian | 49 | 0.4% |
| Belgian | 12 | 0.1% |
| Bhutanese | 139 | 1.1% |
| British | 202 | 1.5% |
| Burmese | 87 | 0.7% |
| Canadian | 30 | 0.2% |
| Celtic | 13 | 0.1% |
| Central American | 106 | 0.8% |
| Cherokee | 74 | 0.6% |
| Chilean | 31 | 0.2% |
| Croatian | 86 | 0.7% |
| Cuban | 32 | 0.2% |
| Czech | 150 | 1.1% |
| Danish | 164 | 1.3% |
| Dominican | 97 | 0.7% |
| Dutch | 325 | 2.5% |
| Eastern European | 75 | 0.6% |
| English | 1,671 | 12.8% |
| Estonian | 19 | 0.2% |
| European | 675 | 5.2% |
| Finnish | 109 | 0.8% |
| French | 592 | 4.5% |
| French Canadian | 356 | 2.7% |
| German | 2,296 | 17.6% |
| Greek | 14 | 0.1% |
| Honduran | 66 | 0.5% |
| Hungarian | 34 | 0.3% |
| Indian (Asian) | 43 | 0.3% |
| Iranian | 11 | 0.1% |
| Irish | 1,270 | 9.7% |
| Italian | 236 | 1.8% |
| Japanese | 196 | 1.5% |
| Kenyan | 17 | 0.1% |
| Korean | 113 | 0.9% |
| Lithuanian | 39 | 0.3% |
| Mexican | 1,004 | 7.7% |
| Native Hawaiian | 187 | 1.4% |
| Navajo | 29 | 0.2% |
| Northern European | 35 | 0.3% |
| Norwegian | 849 | 6.5% |
| Pakistani | 6 | 0.1% |
| Polish | 314 | 2.4% |
| Portuguese | 64 | 0.5% |
| Puerto Rican | 42 | 0.3% |
| Russian | 154 | 1.2% |
| Salvadoran | 40 | 0.3% |
| Scandinavian | 141 | 1.1% |
| Scotch-Irish | 79 | 0.6% |
| Scottish | 547 | 4.2% |
| Sioux | 23 | 0.2% |
| Slavic | 34 | 0.3% |
| South African | 53 | 0.4% |
| South American | 31 | 0.2% |
| Spaniard | 20 | 0.2% |
| Sri Lankan | 124 | 0.9% |
| Subsaharan African | 88 | 0.7% |
| Swedish | 252 | 1.9% |
| Swiss | 163 | 1.3% |
| Syrian | 15 | 0.1% |
| Thai | 22 | 0.2% |
| Welsh | 317 | 2.4% | View All 64 Rows |
Immigrants in Oatfield
The most numerous immigrant groups reported in Oatfield came from Latin America (508 | 3.9%), Central America (439 | 3.4%), Mexico (339 | 2.6%), Asia (241 | 1.8%), and South Eastern Asia (197 | 1.5%), together accounting for 13.2% of all Oatfield residents.
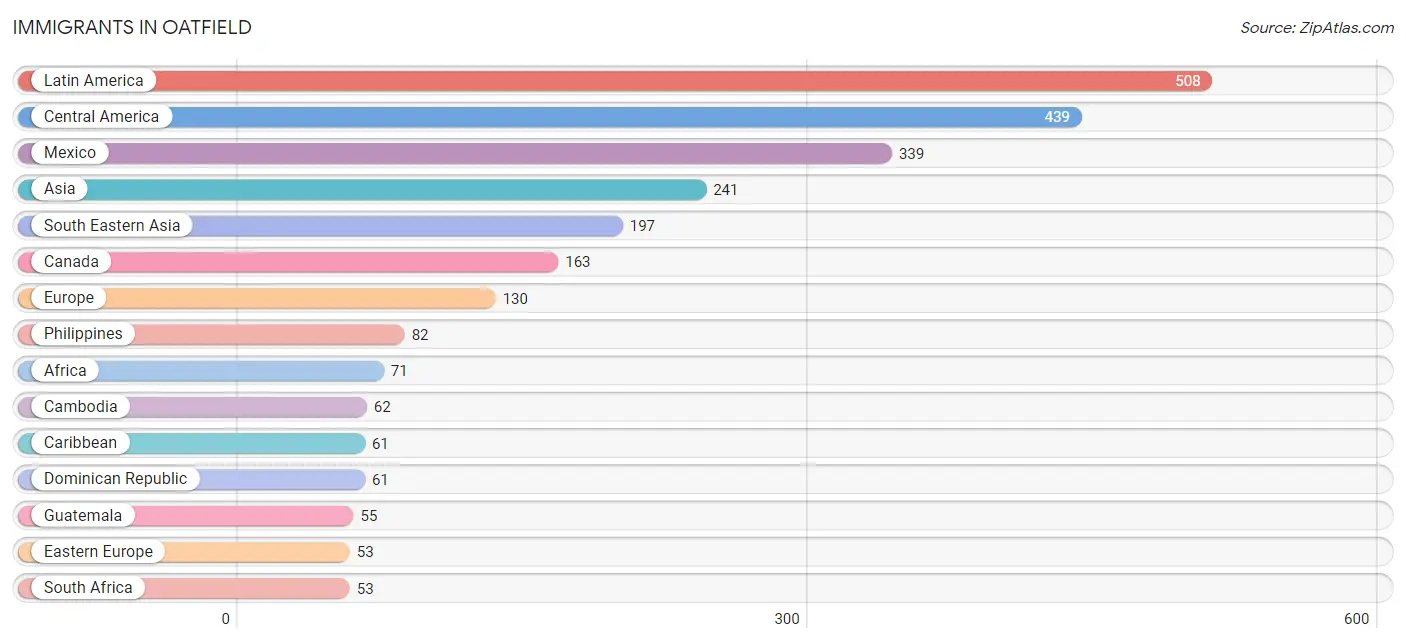
| Immigration Origin | # Population | % Population |
| Africa | 71 | 0.5% |
| Asia | 241 | 1.8% |
| Cambodia | 62 | 0.5% |
| Canada | 163 | 1.3% |
| Caribbean | 61 | 0.5% |
| Central America | 439 | 3.4% |
| Chile | 8 | 0.1% |
| China | 6 | 0.1% |
| Dominican Republic | 61 | 0.5% |
| Eastern Africa | 18 | 0.1% |
| Eastern Asia | 20 | 0.2% |
| Eastern Europe | 53 | 0.4% |
| El Salvador | 14 | 0.1% |
| England | 20 | 0.2% |
| Ethiopia | 18 | 0.1% |
| Europe | 130 | 1.0% |
| Germany | 1 | 0.0% |
| Guatemala | 55 | 0.4% |
| Honduras | 31 | 0.2% |
| India | 10 | 0.1% |
| Korea | 14 | 0.1% |
| Latin America | 508 | 3.9% |
| Mexico | 339 | 2.6% |
| Netherlands | 14 | 0.1% |
| Northern Europe | 31 | 0.2% |
| Pakistan | 14 | 0.1% |
| Philippines | 82 | 0.6% |
| Russia | 23 | 0.2% |
| South Africa | 53 | 0.4% |
| South America | 8 | 0.1% |
| South Central Asia | 24 | 0.2% |
| South Eastern Asia | 197 | 1.5% |
| Switzerland | 31 | 0.2% |
| Ukraine | 11 | 0.1% |
| Vietnam | 53 | 0.4% |
| Western Europe | 46 | 0.4% | View All 36 Rows |
Sex and Age in Oatfield
Sex and Age in Oatfield
The most populous age groups in Oatfield are 40 to 44 Years (560 | 9.3%) for men and 65 to 69 Years (638 | 9.1%) for women.
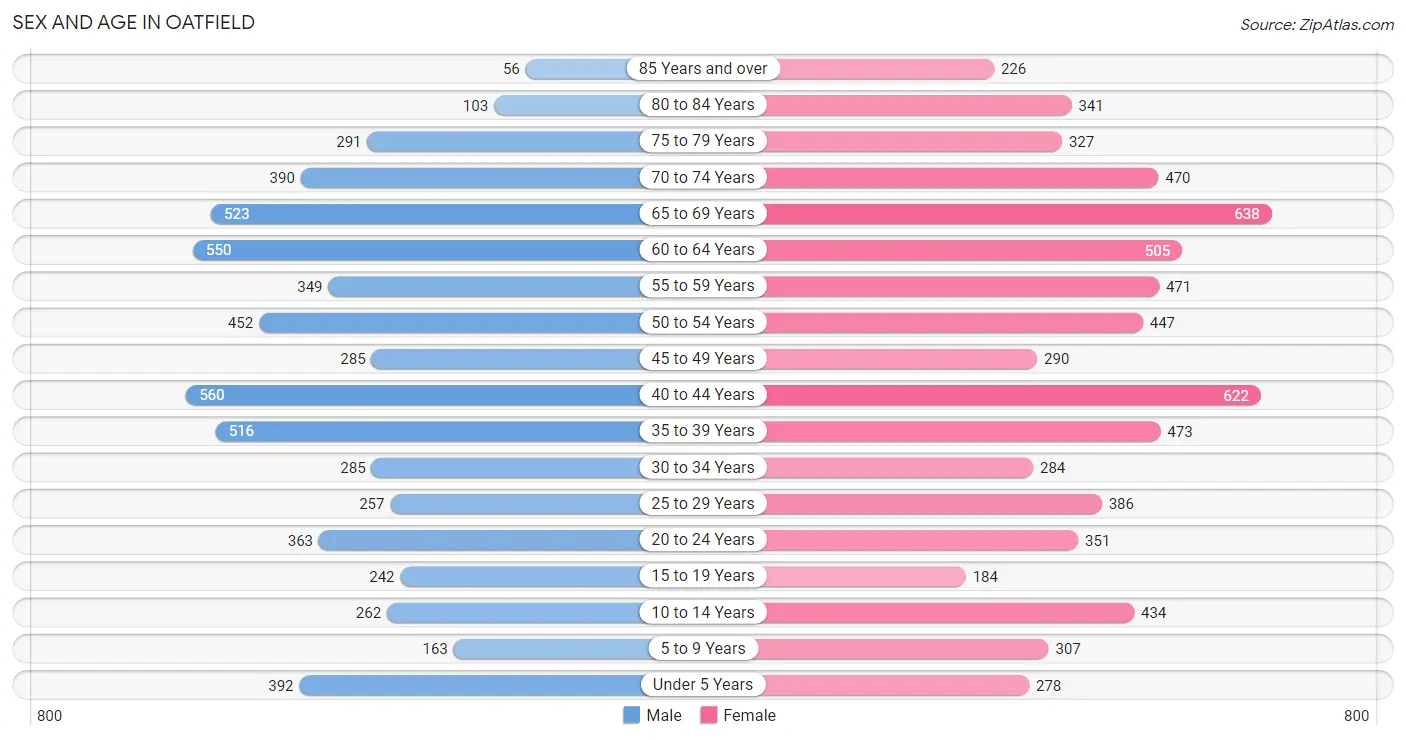
| Age Bracket | Male | Female |
| Under 5 Years | 392 (6.5%) | 278 (4.0%) |
| 5 to 9 Years | 163 (2.7%) | 307 (4.4%) |
| 10 to 14 Years | 262 (4.3%) | 434 (6.2%) |
| 15 to 19 Years | 242 (4.0%) | 184 (2.6%) |
| 20 to 24 Years | 363 (6.0%) | 351 (5.0%) |
| 25 to 29 Years | 257 (4.3%) | 386 (5.5%) |
| 30 to 34 Years | 285 (4.7%) | 284 (4.0%) |
| 35 to 39 Years | 516 (8.5%) | 473 (6.7%) |
| 40 to 44 Years | 560 (9.3%) | 622 (8.8%) |
| 45 to 49 Years | 285 (4.7%) | 290 (4.1%) |
| 50 to 54 Years | 452 (7.5%) | 447 (6.4%) |
| 55 to 59 Years | 349 (5.8%) | 471 (6.7%) |
| 60 to 64 Years | 550 (9.1%) | 505 (7.2%) |
| 65 to 69 Years | 523 (8.7%) | 638 (9.1%) |
| 70 to 74 Years | 390 (6.5%) | 470 (6.7%) |
| 75 to 79 Years | 291 (4.8%) | 327 (4.6%) |
| 80 to 84 Years | 103 (1.7%) | 341 (4.9%) |
| 85 Years and over | 56 (0.9%) | 226 (3.2%) |
| Total | 6,039 (100.0%) | 7,034 (100.0%) |
Families and Households in Oatfield
Median Family Size in Oatfield
The median family size in Oatfield is 2.94 persons per family, with married-couple families (3,139 | 87.9%) accounting for the largest median family size of 2.97 persons per family. On the other hand, single male/father families (144 | 4.0%) represent the smallest median family size with 2.58 persons per family.
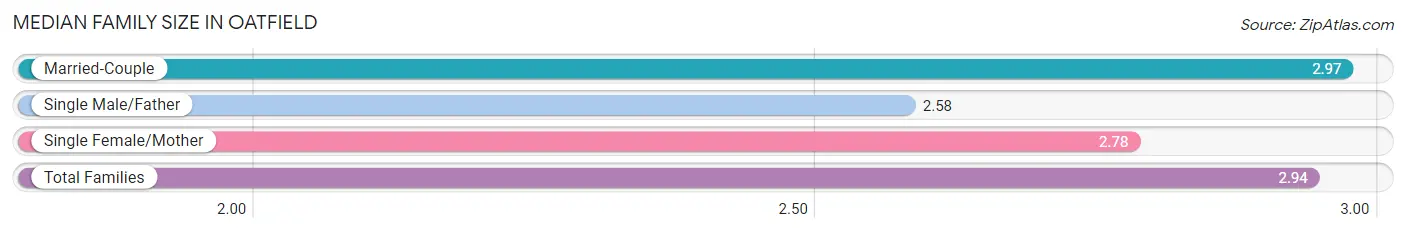
| Family Type | # Families | Family Size |
| Married-Couple | 3,139 (87.9%) | 2.97 |
| Single Male/Father | 144 (4.0%) | 2.58 |
| Single Female/Mother | 289 (8.1%) | 2.78 |
| Total Families | 3,572 (100.0%) | 2.94 |
Median Household Size in Oatfield
The median household size in Oatfield is 2.61 persons per household, with single female/mother households (289 | 6.0%) accounting for the largest median household size of 3.37 persons per household. non-family households (1,269 | 26.2%) represent the smallest median household size with 1.31 persons per household.
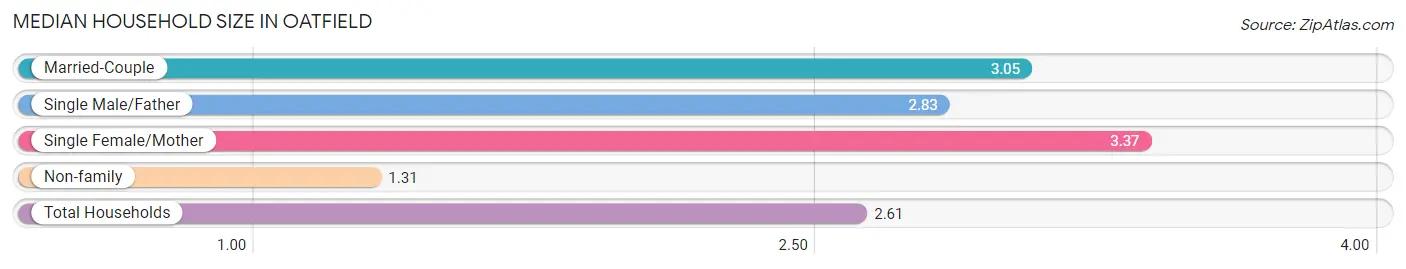
| Household Type | # Households | Household Size |
| Married-Couple | 3,139 (64.8%) | 3.05 |
| Single Male/Father | 144 (3.0%) | 2.83 |
| Single Female/Mother | 289 (6.0%) | 3.37 |
| Non-family | 1,269 (26.2%) | 1.31 |
| Total Households | 4,841 (100.0%) | 2.61 |
Household Size by Marriage Status in Oatfield
Out of a total of 4,841 households in Oatfield, 3,572 (73.8%) are family households, while 1,269 (26.2%) are nonfamily households. The most numerous type of family households are 2-person households, comprising 1,874, and the most common type of nonfamily households are 1-person households, comprising 1,007.
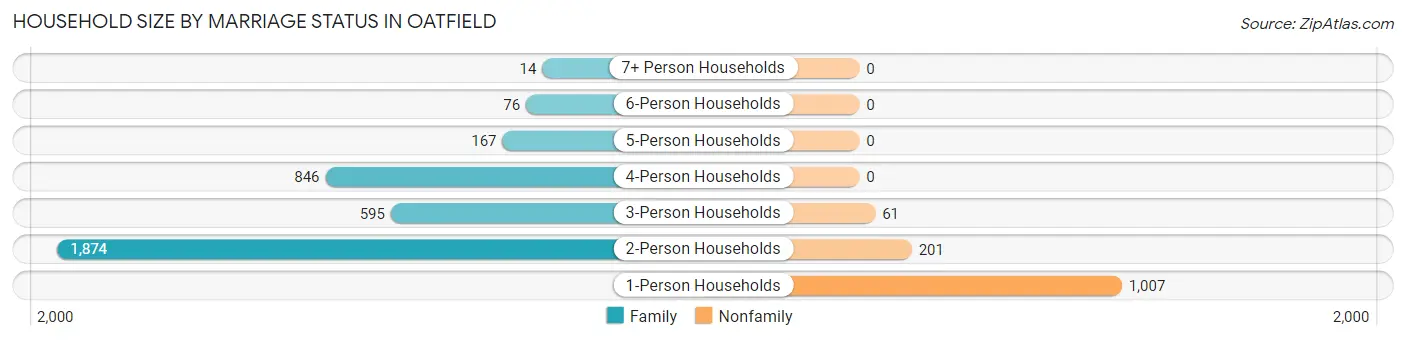
| Household Size | Family Households | Nonfamily Households |
| 1-Person Households | - | 1,007 (20.8%) |
| 2-Person Households | 1,874 (38.7%) | 201 (4.2%) |
| 3-Person Households | 595 (12.3%) | 61 (1.3%) |
| 4-Person Households | 846 (17.5%) | 0 (0.0%) |
| 5-Person Households | 167 (3.5%) | 0 (0.0%) |
| 6-Person Households | 76 (1.6%) | 0 (0.0%) |
| 7+ Person Households | 14 (0.3%) | 0 (0.0%) |
| Total | 3,572 (73.8%) | 1,269 (26.2%) |
Female Fertility in Oatfield
Fertility by Age in Oatfield
Average fertility rate in Oatfield is 81.0 births per 1,000 women. Women in the age bracket of 35 to 50 years have the highest fertility rate with 103.0 births per 1,000 women. Women in the age bracket of 35 to 50 years acount for 67.6% of all women with births.
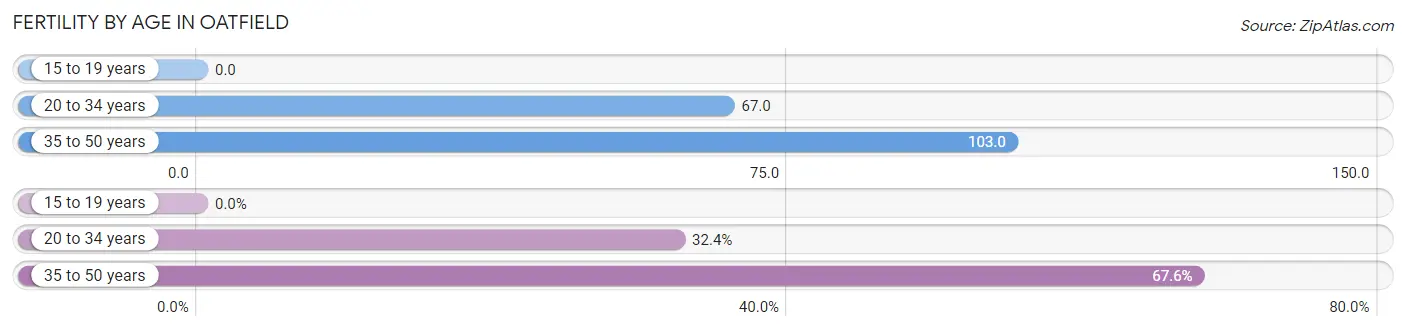
| Age Bracket | Women with Births | Births / 1,000 Women |
| 15 to 19 years | 0 (0.0%) | 0.0 |
| 20 to 34 years | 68 (32.4%) | 67.0 |
| 35 to 50 years | 142 (67.6%) | 103.0 |
| Total | 210 (100.0%) | 81.0 |
Fertility by Age by Marriage Status in Oatfield
91.0% of women with births (210) in Oatfield are married. The highest percentage of unmarried women with births falls into 20 to 34 years age bracket with 27.9% of them unmarried at the time of birth, while the lowest percentage of unmarried women with births belong to 35 to 50 years age bracket with 0.0% of them unmarried.
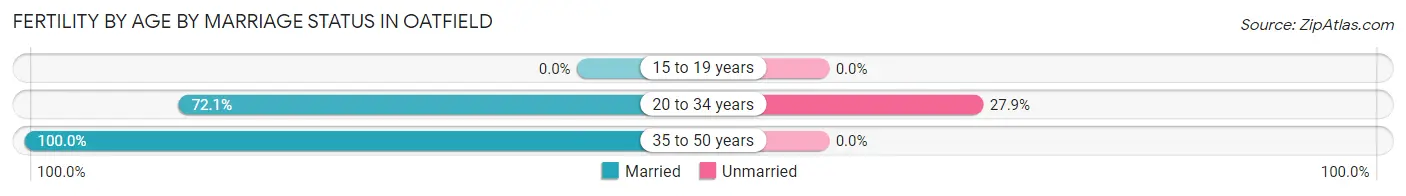
| Age Bracket | Married | Unmarried |
| 15 to 19 years | 0 (0.0%) | 0 (0.0%) |
| 20 to 34 years | 49 (72.1%) | 19 (27.9%) |
| 35 to 50 years | 142 (100.0%) | 0 (0.0%) |
| Total | 191 (90.9%) | 19 (9.0%) |
Fertility by Education in Oatfield
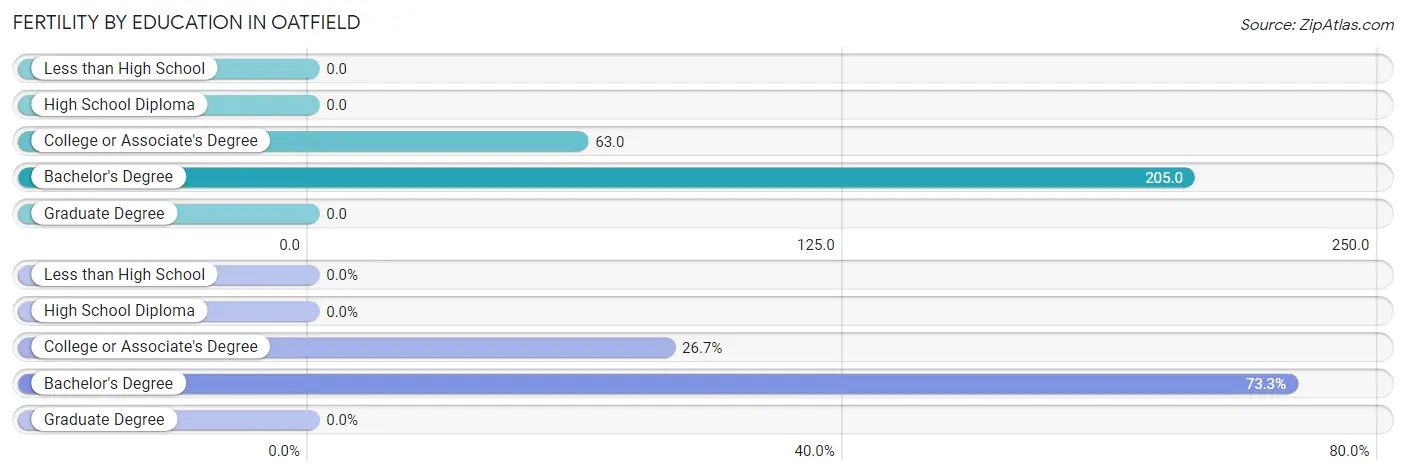
| Educational Attainment | Women with Births | Births / 1,000 Women |
| Less than High School | 0 (0.0%) | 0.0 |
| High School Diploma | 0 (0.0%) | 0.0 |
| College or Associate's Degree | 56 (26.7%) | 63.0 |
| Bachelor's Degree | 154 (73.3%) | 205.0 |
| Graduate Degree | 0 (0.0%) | 0.0 |
| Total | 210 (100.0%) | 81.0 |
Fertility by Education by Marriage Status in Oatfield
9.0% of women with births in Oatfield are unmarried. Women with the educational attainment of bachelor's degree are most likely to be married with 100.0% of them married at childbirth, while women with the educational attainment of college or associate's degree are least likely to be married with 33.9% of them unmarried at childbirth.
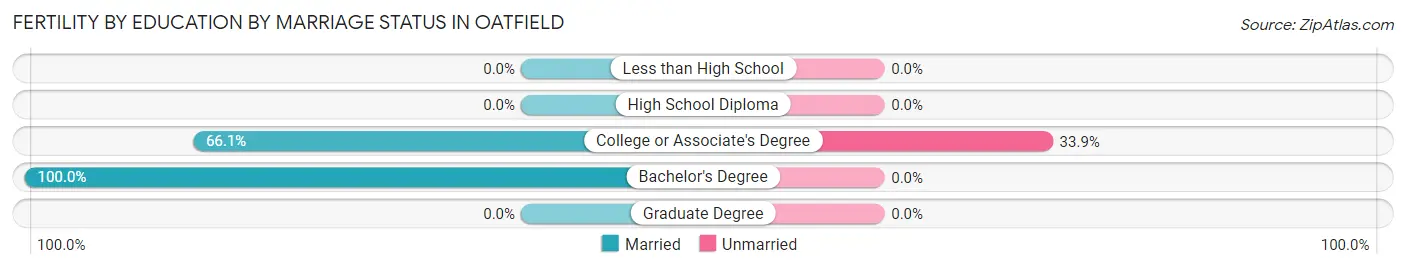
| Educational Attainment | Married | Unmarried |
| Less than High School | 0 (0.0%) | 0 (0.0%) |
| High School Diploma | 0 (0.0%) | 0 (0.0%) |
| College or Associate's Degree | 37 (66.1%) | 19 (33.9%) |
| Bachelor's Degree | 154 (100.0%) | 0 (0.0%) |
| Graduate Degree | 0 (0.0%) | 0 (0.0%) |
| Total | 191 (90.9%) | 19 (9.0%) |
Employment Characteristics in Oatfield
Employment by Class of Employer in Oatfield
Among the 6,054 employed individuals in Oatfield, private company employees (3,891 | 64.3%), self-employed (not incorporated) (729 | 12.0%), and local government employees (652 | 10.8%) make up the most common classes of employment.
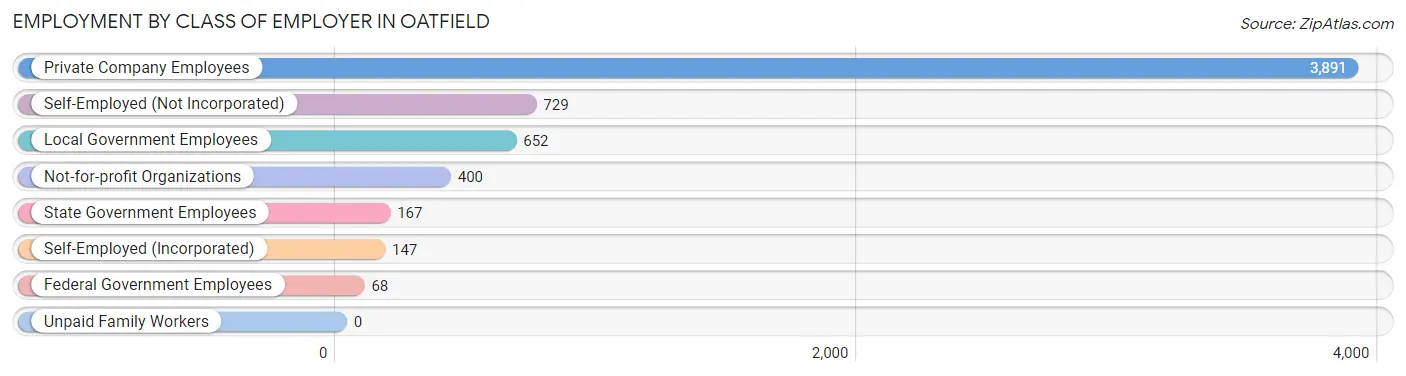
| Employer Class | # Employees | % Employees |
| Private Company Employees | 3,891 | 64.3% |
| Self-Employed (Incorporated) | 147 | 2.4% |
| Self-Employed (Not Incorporated) | 729 | 12.0% |
| Not-for-profit Organizations | 400 | 6.6% |
| Local Government Employees | 652 | 10.8% |
| State Government Employees | 167 | 2.8% |
| Federal Government Employees | 68 | 1.1% |
| Unpaid Family Workers | 0 | 0.0% |
| Total | 6,054 | 100.0% |
Employment Status by Age in Oatfield
According to the labor force statistics for Oatfield, out of the total population over 16 years of age (11,124), 58.6% or 6,519 individuals are in the labor force, with 4.5% or 293 of them unemployed. The age group with the highest labor force participation rate is 30 to 34 years, with 91.0% or 518 individuals in the labor force. Within the labor force, the 75 years and over age range has the highest percentage of unemployed individuals, with 40.0% or 10 of them being unemployed.
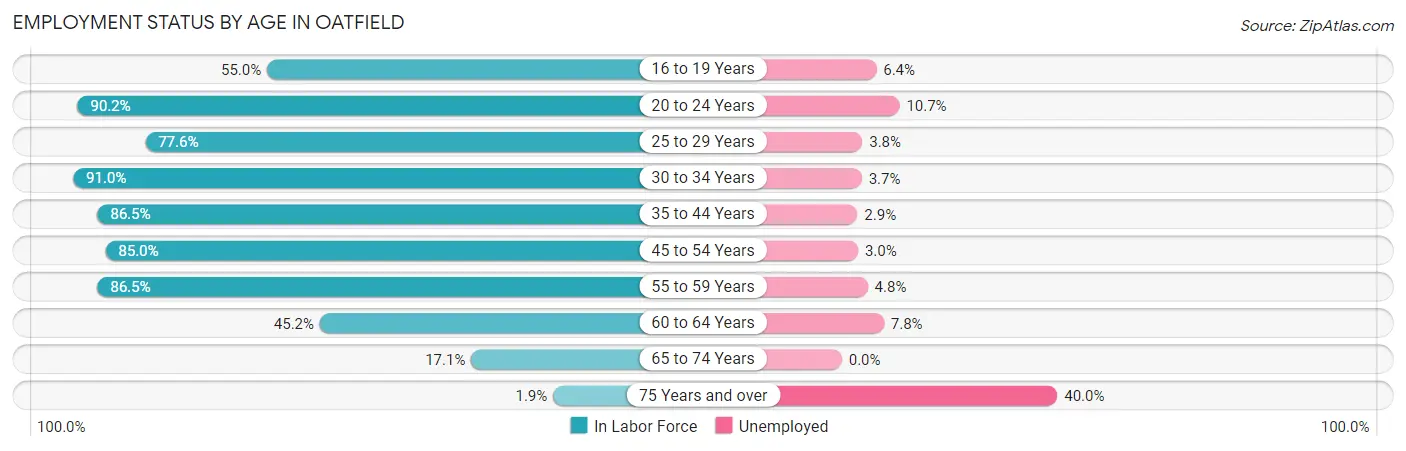
| Age Bracket | In Labor Force | Unemployed |
| 16 to 19 Years | 172 (55.0%) | 11 (6.4%) |
| 20 to 24 Years | 644 (90.2%) | 69 (10.7%) |
| 25 to 29 Years | 499 (77.6%) | 19 (3.8%) |
| 30 to 34 Years | 518 (91.0%) | 19 (3.7%) |
| 35 to 44 Years | 1,878 (86.5%) | 54 (2.9%) |
| 45 to 54 Years | 1,253 (85.0%) | 38 (3.0%) |
| 55 to 59 Years | 709 (86.5%) | 34 (4.8%) |
| 60 to 64 Years | 477 (45.2%) | 37 (7.8%) |
| 65 to 74 Years | 346 (17.1%) | 0 (0.0%) |
| 75 Years and over | 26 (1.9%) | 10 (40.0%) |
| Total | 6,519 (58.6%) | 293 (4.5%) |
Employment Status by Educational Attainment in Oatfield
According to labor force statistics for Oatfield, 79.2% of individuals (5,332) out of the total population between 25 and 64 years of age (6,732) are in the labor force, with 3.8% or 203 of them being unemployed. The group with the highest labor force participation rate are those with the educational attainment of bachelor's degree or higher, with 88.5% or 2,348 individuals in the labor force. Within the labor force, individuals with college / associate degree education have the highest percentage of unemployment, with 7.1% or 126 of them being unemployed.
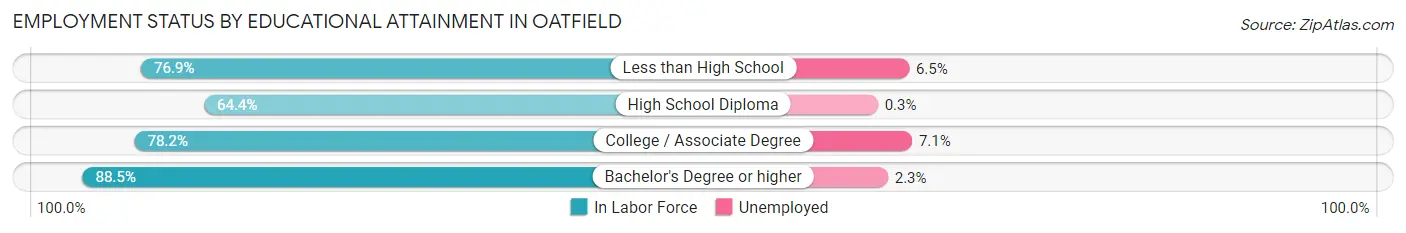
| Educational Attainment | In Labor Force | Unemployed |
| Less than High School | 293 (76.9%) | 25 (6.5%) |
| High School Diploma | 916 (64.4%) | 4 (0.3%) |
| College / Associate Degree | 1,779 (78.2%) | 162 (7.1%) |
| Bachelor's Degree or higher | 2,348 (88.5%) | 61 (2.3%) |
| Total | 5,332 (79.2%) | 256 (3.8%) |
Employment Occupations by Sex in Oatfield
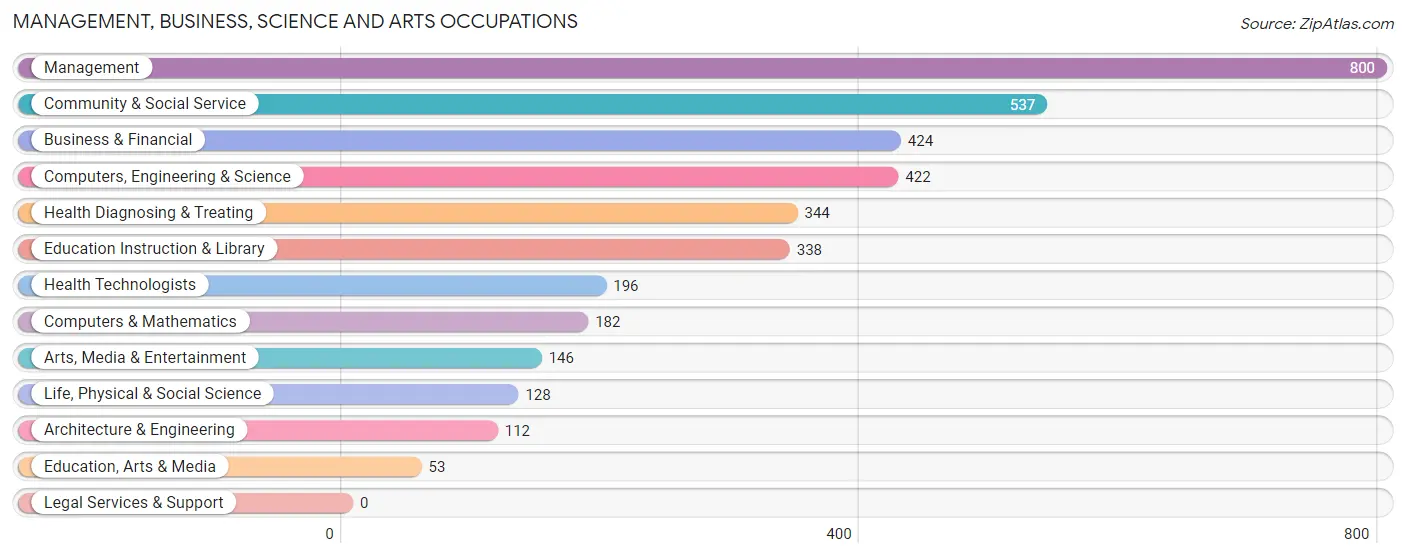
Management, Business, Science and Arts Occupations
The most common Management, Business, Science and Arts occupations in Oatfield are Management (800 | 12.9%), Community & Social Service (537 | 8.6%), Business & Financial (424 | 6.8%), Computers, Engineering & Science (422 | 6.8%), and Health Diagnosing & Treating (344 | 5.5%).
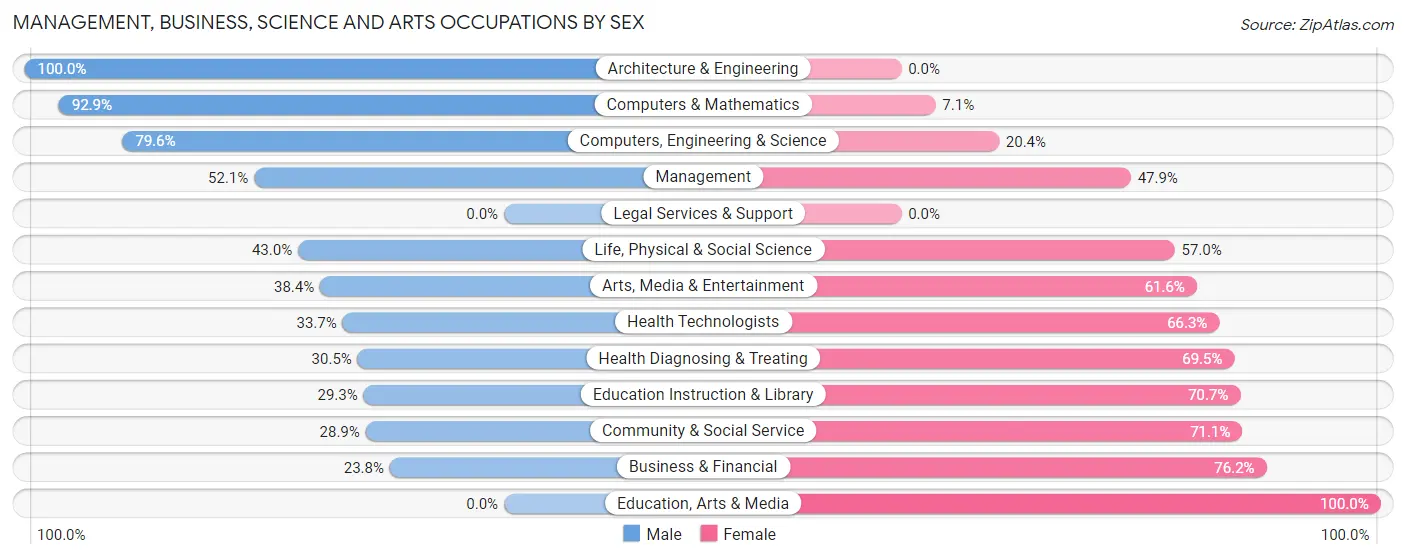
Management, Business, Science and Arts Occupations by Sex
Within the Management, Business, Science and Arts occupations in Oatfield, the most male-oriented occupations are Architecture & Engineering (100.0%), Computers & Mathematics (92.9%), and Computers, Engineering & Science (79.6%), while the most female-oriented occupations are Education, Arts & Media (100.0%), Business & Financial (76.2%), and Community & Social Service (71.1%).
| Occupation | Male | Female |
| Management | 417 (52.1%) | 383 (47.9%) |
| Business & Financial | 101 (23.8%) | 323 (76.2%) |
| Computers, Engineering & Science | 336 (79.6%) | 86 (20.4%) |
| Computers & Mathematics | 169 (92.9%) | 13 (7.1%) |
| Architecture & Engineering | 112 (100.0%) | 0 (0.0%) |
| Life, Physical & Social Science | 55 (43.0%) | 73 (57.0%) |
| Community & Social Service | 155 (28.9%) | 382 (71.1%) |
| Education, Arts & Media | 0 (0.0%) | 53 (100.0%) |
| Legal Services & Support | 0 (0.0%) | 0 (0.0%) |
| Education Instruction & Library | 99 (29.3%) | 239 (70.7%) |
| Arts, Media & Entertainment | 56 (38.4%) | 90 (61.6%) |
| Health Diagnosing & Treating | 105 (30.5%) | 239 (69.5%) |
| Health Technologists | 66 (33.7%) | 130 (66.3%) |
| Total (Category) | 1,114 (44.1%) | 1,413 (55.9%) |
| Total (Overall) | 3,058 (49.1%) | 3,170 (50.9%) |
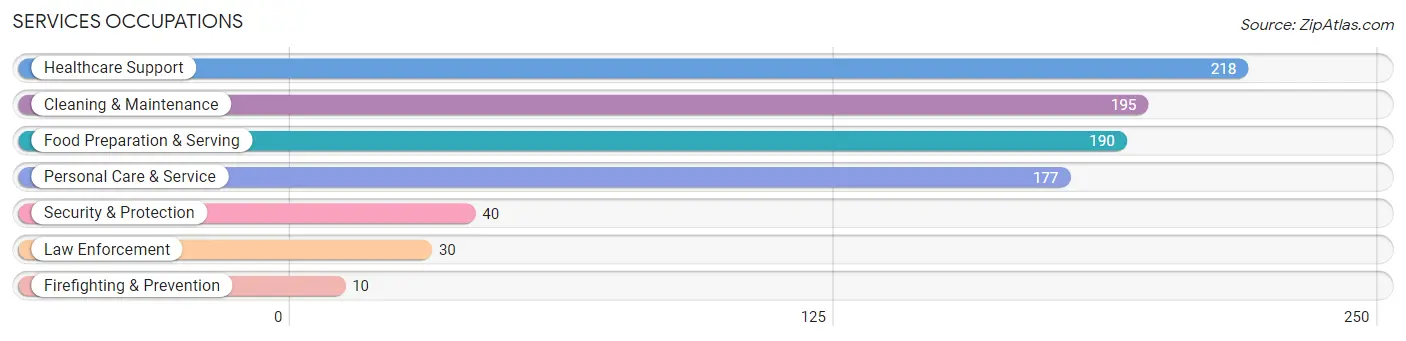
Services Occupations
The most common Services occupations in Oatfield are Healthcare Support (218 | 3.5%), Cleaning & Maintenance (195 | 3.1%), Food Preparation & Serving (190 | 3.0%), Personal Care & Service (177 | 2.8%), and Security & Protection (40 | 0.6%).
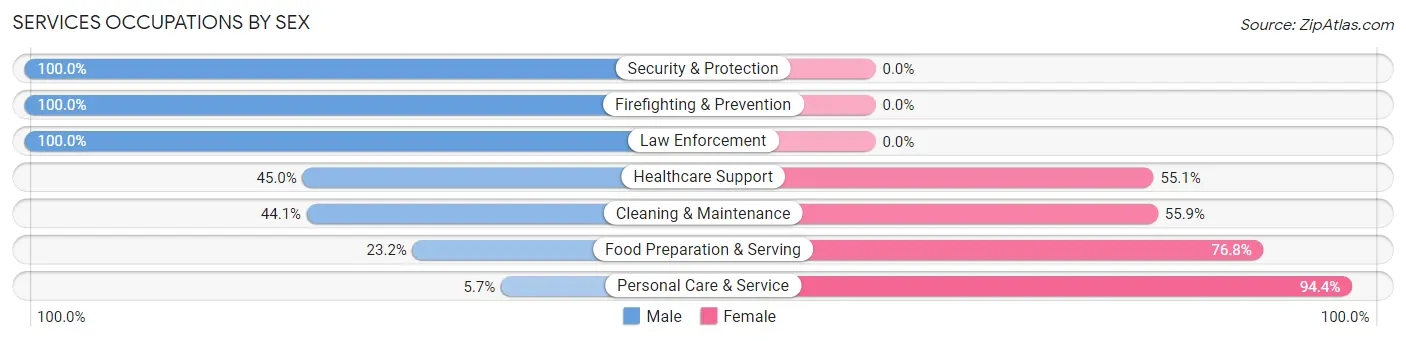
Services Occupations by Sex
Within the Services occupations in Oatfield, the most male-oriented occupations are Security & Protection (100.0%), Firefighting & Prevention (100.0%), and Law Enforcement (100.0%), while the most female-oriented occupations are Personal Care & Service (94.4%), Food Preparation & Serving (76.8%), and Cleaning & Maintenance (55.9%).
| Occupation | Male | Female |
| Healthcare Support | 98 (45.0%) | 120 (55.0%) |
| Security & Protection | 40 (100.0%) | 0 (0.0%) |
| Firefighting & Prevention | 10 (100.0%) | 0 (0.0%) |
| Law Enforcement | 30 (100.0%) | 0 (0.0%) |
| Food Preparation & Serving | 44 (23.2%) | 146 (76.8%) |
| Cleaning & Maintenance | 86 (44.1%) | 109 (55.9%) |
| Personal Care & Service | 10 (5.7%) | 167 (94.4%) |
| Total (Category) | 278 (33.9%) | 542 (66.1%) |
| Total (Overall) | 3,058 (49.1%) | 3,170 (50.9%) |
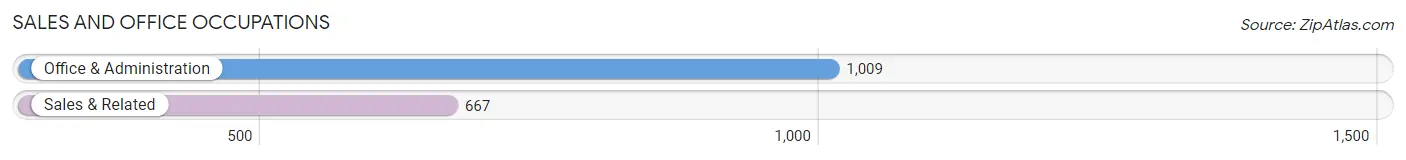
Sales and Office Occupations
The most common Sales and Office occupations in Oatfield are Office & Administration (1,009 | 16.2%), and Sales & Related (667 | 10.7%).
Sales and Office Occupations by Sex
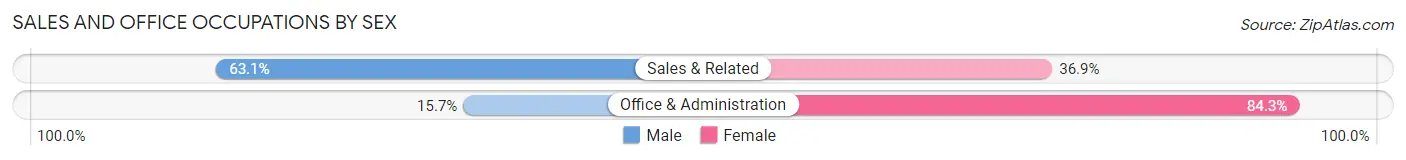
| Occupation | Male | Female |
| Sales & Related | 421 (63.1%) | 246 (36.9%) |
| Office & Administration | 158 (15.7%) | 851 (84.3%) |
| Total (Category) | 579 (34.5%) | 1,097 (65.4%) |
| Total (Overall) | 3,058 (49.1%) | 3,170 (50.9%) |
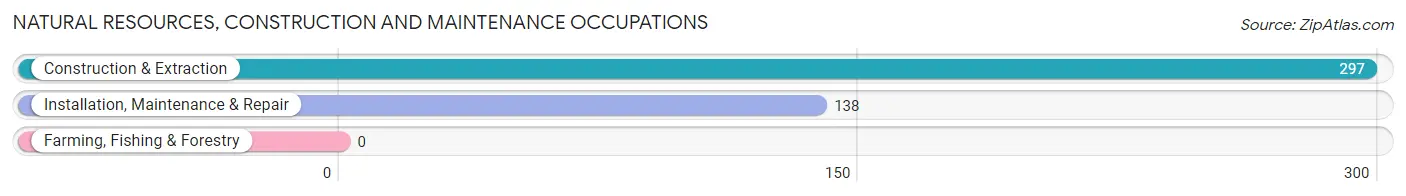
Natural Resources, Construction and Maintenance Occupations
The most common Natural Resources, Construction and Maintenance occupations in Oatfield are Construction & Extraction (297 | 4.8%), and Installation, Maintenance & Repair (138 | 2.2%).
Natural Resources, Construction and Maintenance Occupations by Sex
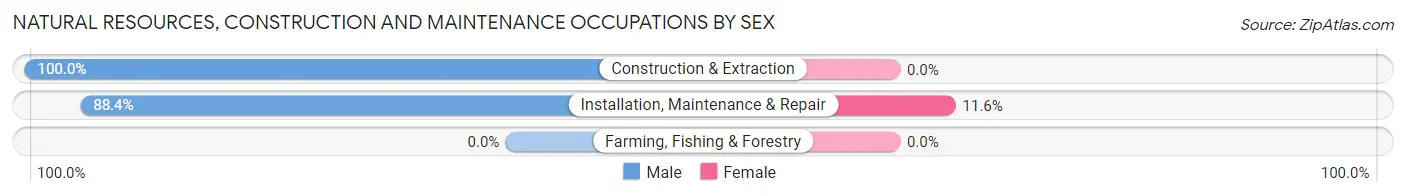
| Occupation | Male | Female |
| Farming, Fishing & Forestry | 0 (0.0%) | 0 (0.0%) |
| Construction & Extraction | 297 (100.0%) | 0 (0.0%) |
| Installation, Maintenance & Repair | 122 (88.4%) | 16 (11.6%) |
| Total (Category) | 419 (96.3%) | 16 (3.7%) |
| Total (Overall) | 3,058 (49.1%) | 3,170 (50.9%) |
Production, Transportation and Moving Occupations
The most common Production, Transportation and Moving occupations in Oatfield are Production (310 | 5.0%), Transportation (247 | 4.0%), and Material Moving (213 | 3.4%).
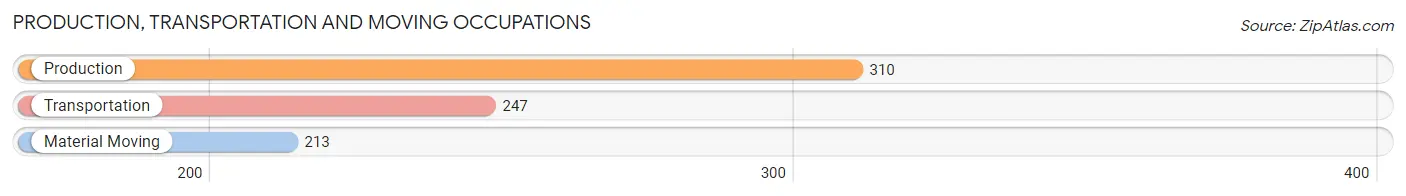
Production, Transportation and Moving Occupations by Sex
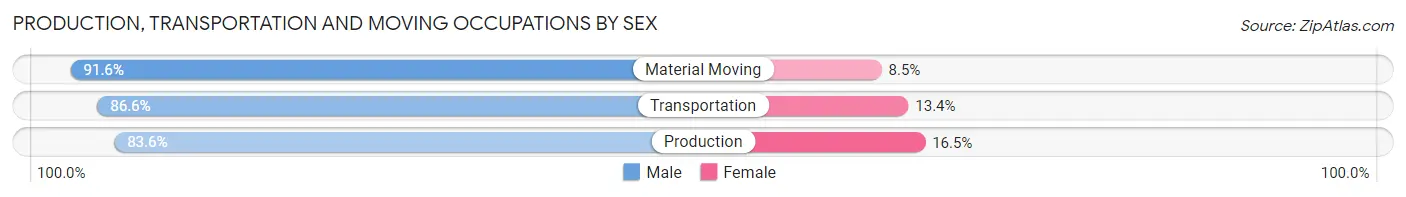
| Occupation | Male | Female |
| Production | 259 (83.6%) | 51 (16.5%) |
| Transportation | 214 (86.6%) | 33 (13.4%) |
| Material Moving | 195 (91.5%) | 18 (8.5%) |
| Total (Category) | 668 (86.8%) | 102 (13.3%) |
| Total (Overall) | 3,058 (49.1%) | 3,170 (50.9%) |
Employment Industries by Sex in Oatfield
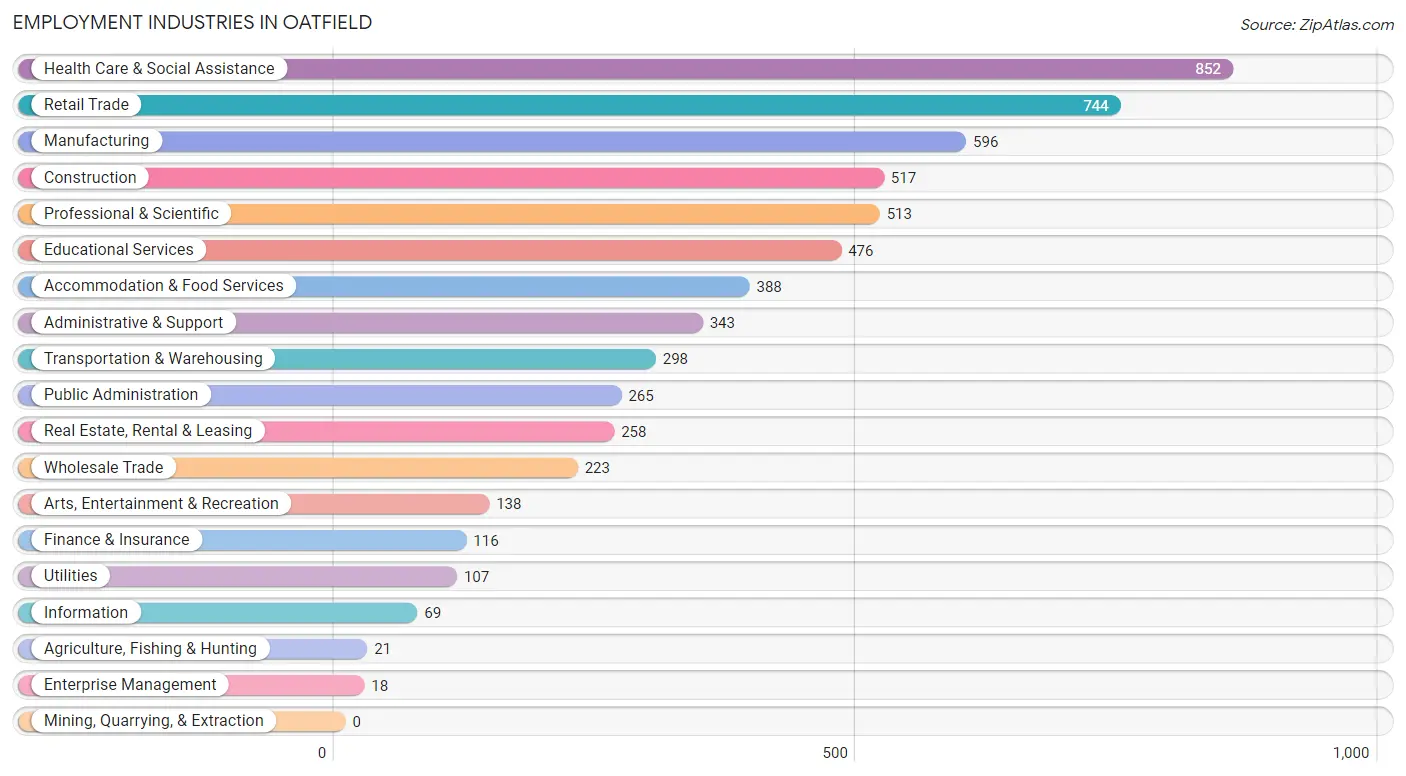
Employment Industries in Oatfield
The major employment industries in Oatfield include Health Care & Social Assistance (852 | 13.7%), Retail Trade (744 | 11.9%), Manufacturing (596 | 9.6%), Construction (517 | 8.3%), and Professional & Scientific (513 | 8.2%).
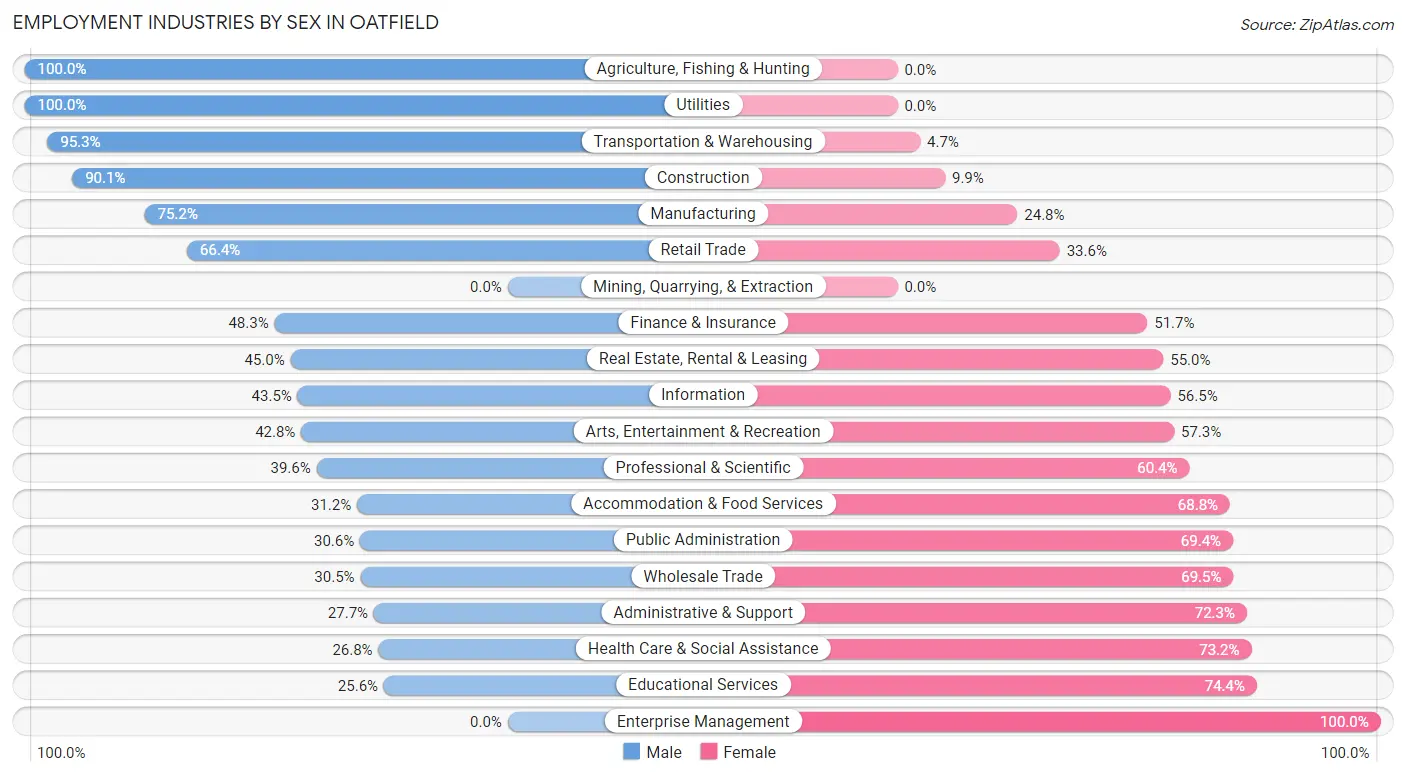
Employment Industries by Sex in Oatfield
The Oatfield industries that see more men than women are Agriculture, Fishing & Hunting (100.0%), Utilities (100.0%), and Transportation & Warehousing (95.3%), whereas the industries that tend to have a higher number of women are Enterprise Management (100.0%), Educational Services (74.4%), and Health Care & Social Assistance (73.2%).
| Industry | Male | Female |
| Agriculture, Fishing & Hunting | 21 (100.0%) | 0 (0.0%) |
| Mining, Quarrying, & Extraction | 0 (0.0%) | 0 (0.0%) |
| Construction | 466 (90.1%) | 51 (9.9%) |
| Manufacturing | 448 (75.2%) | 148 (24.8%) |
| Wholesale Trade | 68 (30.5%) | 155 (69.5%) |
| Retail Trade | 494 (66.4%) | 250 (33.6%) |
| Transportation & Warehousing | 284 (95.3%) | 14 (4.7%) |
| Utilities | 107 (100.0%) | 0 (0.0%) |
| Information | 30 (43.5%) | 39 (56.5%) |
| Finance & Insurance | 56 (48.3%) | 60 (51.7%) |
| Real Estate, Rental & Leasing | 116 (45.0%) | 142 (55.0%) |
| Professional & Scientific | 203 (39.6%) | 310 (60.4%) |
| Enterprise Management | 0 (0.0%) | 18 (100.0%) |
| Administrative & Support | 95 (27.7%) | 248 (72.3%) |
| Educational Services | 122 (25.6%) | 354 (74.4%) |
| Health Care & Social Assistance | 228 (26.8%) | 624 (73.2%) |
| Arts, Entertainment & Recreation | 59 (42.7%) | 79 (57.3%) |
| Accommodation & Food Services | 121 (31.2%) | 267 (68.8%) |
| Public Administration | 81 (30.6%) | 184 (69.4%) |
| Total | 3,058 (49.1%) | 3,170 (50.9%) |
Education in Oatfield
School Enrollment in Oatfield
The most common levels of schooling among the 2,034 students in Oatfield are college / undergraduate (502 | 24.7%), middle school (410 | 20.2%), and high school (410 | 20.2%).
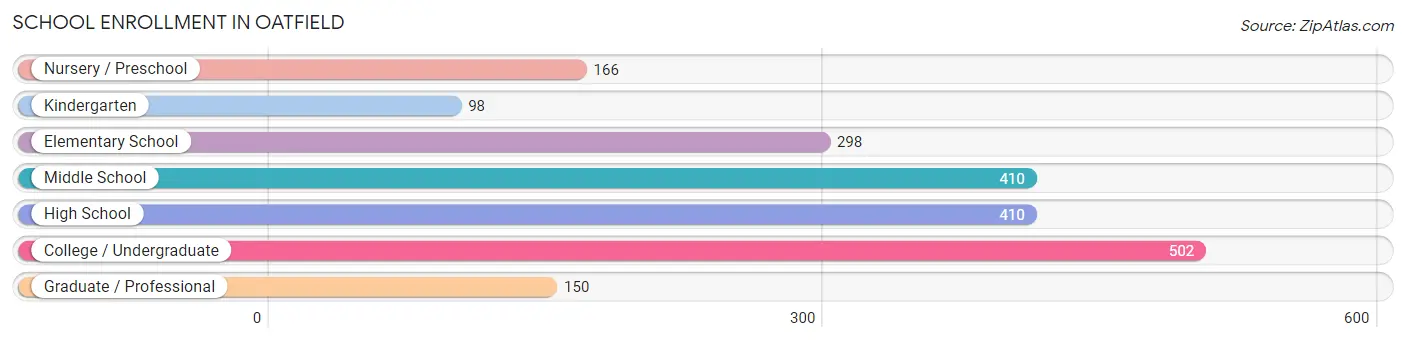
| School Level | # Students | % Students |
| Nursery / Preschool | 166 | 8.2% |
| Kindergarten | 98 | 4.8% |
| Elementary School | 298 | 14.6% |
| Middle School | 410 | 20.2% |
| High School | 410 | 20.2% |
| College / Undergraduate | 502 | 24.7% |
| Graduate / Professional | 150 | 7.4% |
| Total | 2,034 | 100.0% |
School Enrollment by Age by Funding Source in Oatfield
Out of a total of 2,034 students who are enrolled in schools in Oatfield, 393 (19.3%) attend a private institution, while the remaining 1,641 (80.7%) are enrolled in public schools. The age group of 3 to 4 year olds has the highest likelihood of being enrolled in private schools, with 63 (57.3% in the age bracket) enrolled. Conversely, the age group of 18 to 19 year olds has the lowest likelihood of being enrolled in a private school, with 84 (100.0% in the age bracket) attending a public institution.
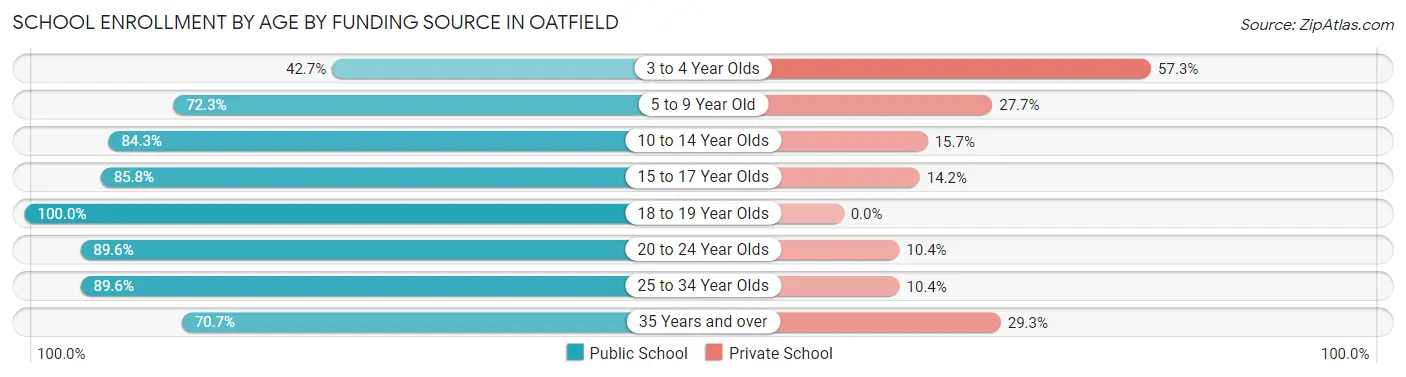
| Age Bracket | Public School | Private School |
| 3 to 4 Year Olds | 47 (42.7%) | 63 (57.3%) |
| 5 to 9 Year Old | 269 (72.3%) | 103 (27.7%) |
| 10 to 14 Year Olds | 533 (84.3%) | 99 (15.7%) |
| 15 to 17 Year Olds | 230 (85.8%) | 38 (14.2%) |
| 18 to 19 Year Olds | 84 (100.0%) | 0 (0.0%) |
| 20 to 24 Year Olds | 233 (89.6%) | 27 (10.4%) |
| 25 to 34 Year Olds | 129 (89.6%) | 15 (10.4%) |
| 35 Years and over | 116 (70.7%) | 48 (29.3%) |
| Total | 1,641 (80.7%) | 393 (19.3%) |
Educational Attainment by Field of Study in Oatfield
Business (665 | 16.1%), visual & performing arts (389 | 9.4%), science & technology (344 | 8.4%), bio, nature & agricultural (341 | 8.3%), and social sciences (302 | 7.3%) are the most common fields of study among 4,122 individuals in Oatfield who have obtained a bachelor's degree or higher.
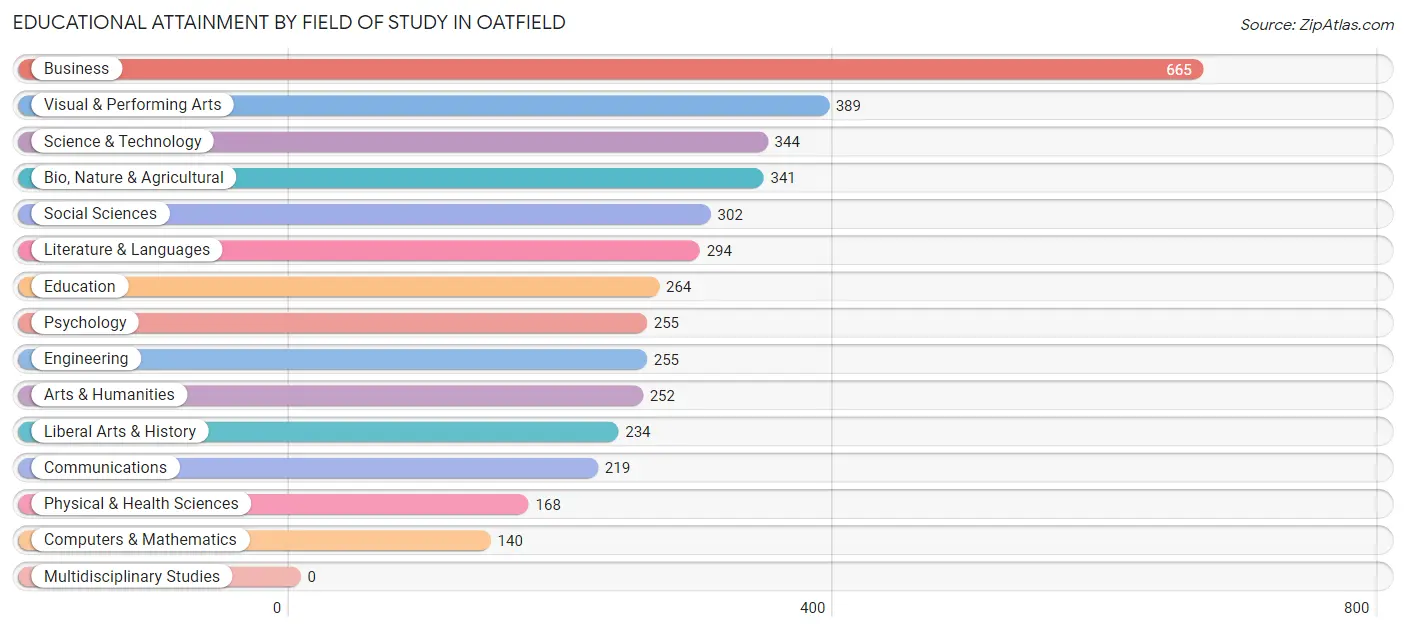
| Field of Study | # Graduates | % Graduates |
| Computers & Mathematics | 140 | 3.4% |
| Bio, Nature & Agricultural | 341 | 8.3% |
| Physical & Health Sciences | 168 | 4.1% |
| Psychology | 255 | 6.2% |
| Social Sciences | 302 | 7.3% |
| Engineering | 255 | 6.2% |
| Multidisciplinary Studies | 0 | 0.0% |
| Science & Technology | 344 | 8.4% |
| Business | 665 | 16.1% |
| Education | 264 | 6.4% |
| Literature & Languages | 294 | 7.1% |
| Liberal Arts & History | 234 | 5.7% |
| Visual & Performing Arts | 389 | 9.4% |
| Communications | 219 | 5.3% |
| Arts & Humanities | 252 | 6.1% |
| Total | 4,122 | 100.0% |
Transportation & Commute in Oatfield
Vehicle Availability by Sex in Oatfield
The most prevalent vehicle ownership categories in Oatfield are males with 2 vehicles (1,499, accounting for 49.7%) and females with 2 vehicles (1,496, making up 49.5%).
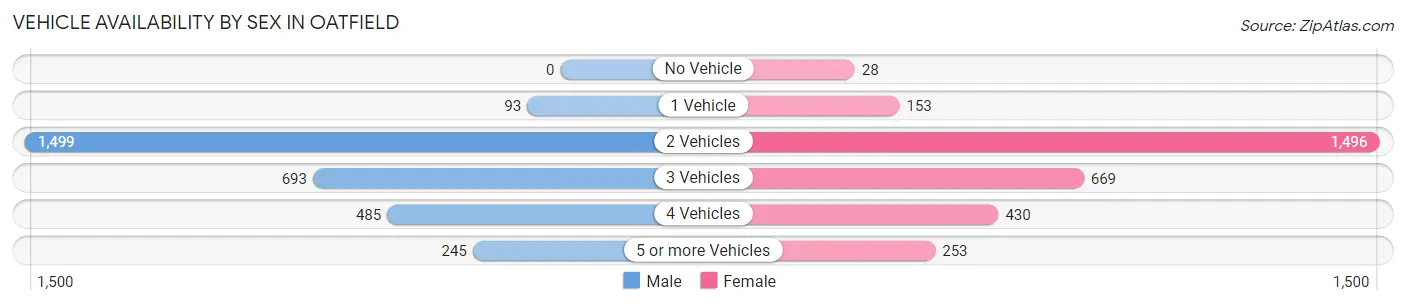
| Vehicles Available | Male | Female |
| No Vehicle | 0 (0.0%) | 28 (0.9%) |
| 1 Vehicle | 93 (3.1%) | 153 (5.1%) |
| 2 Vehicles | 1,499 (49.7%) | 1,496 (49.4%) |
| 3 Vehicles | 693 (23.0%) | 669 (22.1%) |
| 4 Vehicles | 485 (16.1%) | 430 (14.2%) |
| 5 or more Vehicles | 245 (8.1%) | 253 (8.4%) |
| Total | 3,015 (100.0%) | 3,029 (100.0%) |
Commute Time in Oatfield
The most frequently occuring commute durations in Oatfield are 30 to 34 minutes (980 commuters, 19.6%), 20 to 24 minutes (659 commuters, 13.2%), and 15 to 19 minutes (597 commuters, 11.9%).
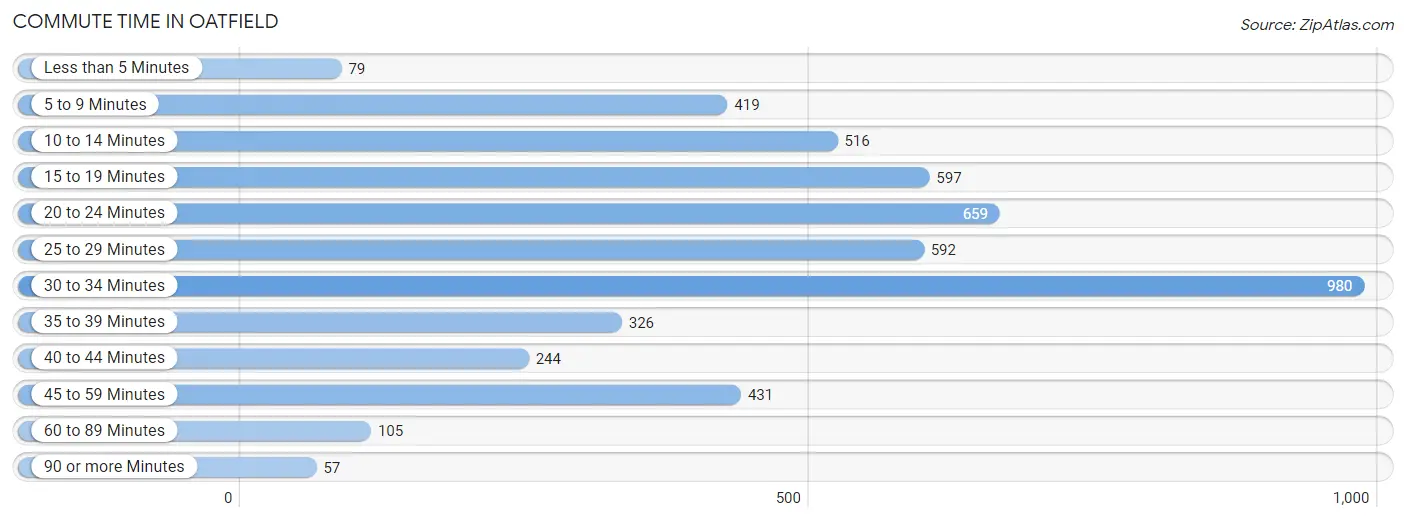
| Commute Time | # Commuters | % Commuters |
| Less than 5 Minutes | 79 | 1.6% |
| 5 to 9 Minutes | 419 | 8.4% |
| 10 to 14 Minutes | 516 | 10.3% |
| 15 to 19 Minutes | 597 | 11.9% |
| 20 to 24 Minutes | 659 | 13.2% |
| 25 to 29 Minutes | 592 | 11.8% |
| 30 to 34 Minutes | 980 | 19.6% |
| 35 to 39 Minutes | 326 | 6.5% |
| 40 to 44 Minutes | 244 | 4.9% |
| 45 to 59 Minutes | 431 | 8.6% |
| 60 to 89 Minutes | 105 | 2.1% |
| 90 or more Minutes | 57 | 1.1% |
Commute Time by Sex in Oatfield
The most common commute times in Oatfield are 30 to 34 minutes (557 commuters, 20.4%) for males and 30 to 34 minutes (423 commuters, 18.6%) for females.
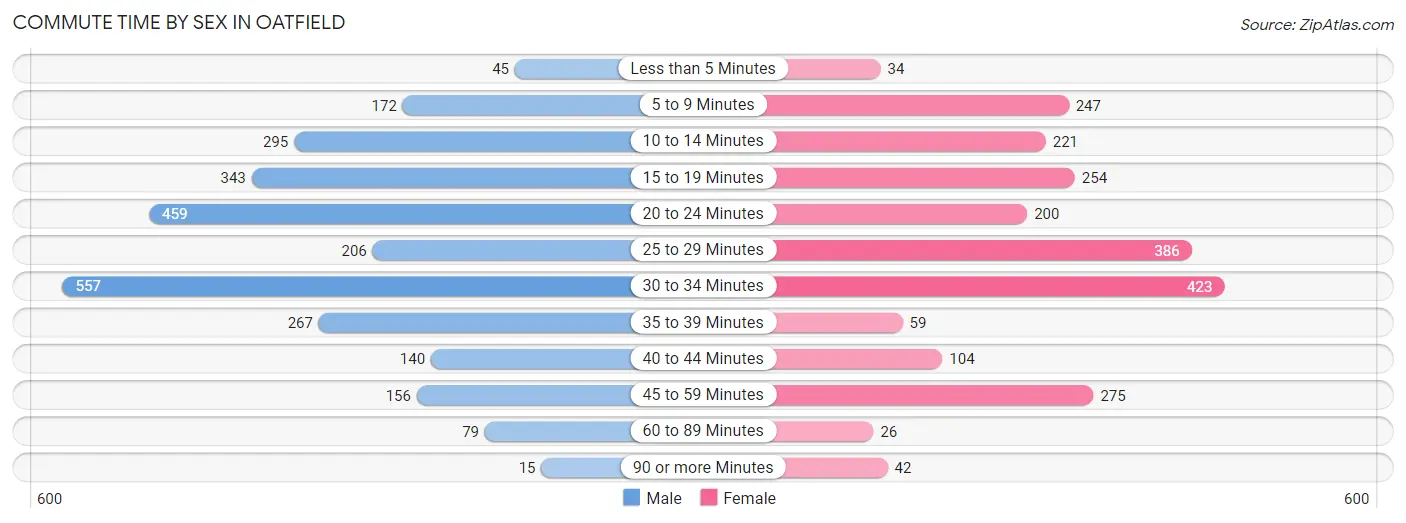
| Commute Time | Male | Female |
| Less than 5 Minutes | 45 (1.7%) | 34 (1.5%) |
| 5 to 9 Minutes | 172 (6.3%) | 247 (10.9%) |
| 10 to 14 Minutes | 295 (10.8%) | 221 (9.7%) |
| 15 to 19 Minutes | 343 (12.6%) | 254 (11.2%) |
| 20 to 24 Minutes | 459 (16.8%) | 200 (8.8%) |
| 25 to 29 Minutes | 206 (7.5%) | 386 (17.0%) |
| 30 to 34 Minutes | 557 (20.4%) | 423 (18.6%) |
| 35 to 39 Minutes | 267 (9.8%) | 59 (2.6%) |
| 40 to 44 Minutes | 140 (5.1%) | 104 (4.6%) |
| 45 to 59 Minutes | 156 (5.7%) | 275 (12.1%) |
| 60 to 89 Minutes | 79 (2.9%) | 26 (1.1%) |
| 90 or more Minutes | 15 (0.5%) | 42 (1.8%) |
Time of Departure to Work by Sex in Oatfield
The most frequent times of departure to work in Oatfield are 7:30 AM to 7:59 AM (316, 11.6%) for males and 7:30 AM to 7:59 AM (408, 18.0%) for females.
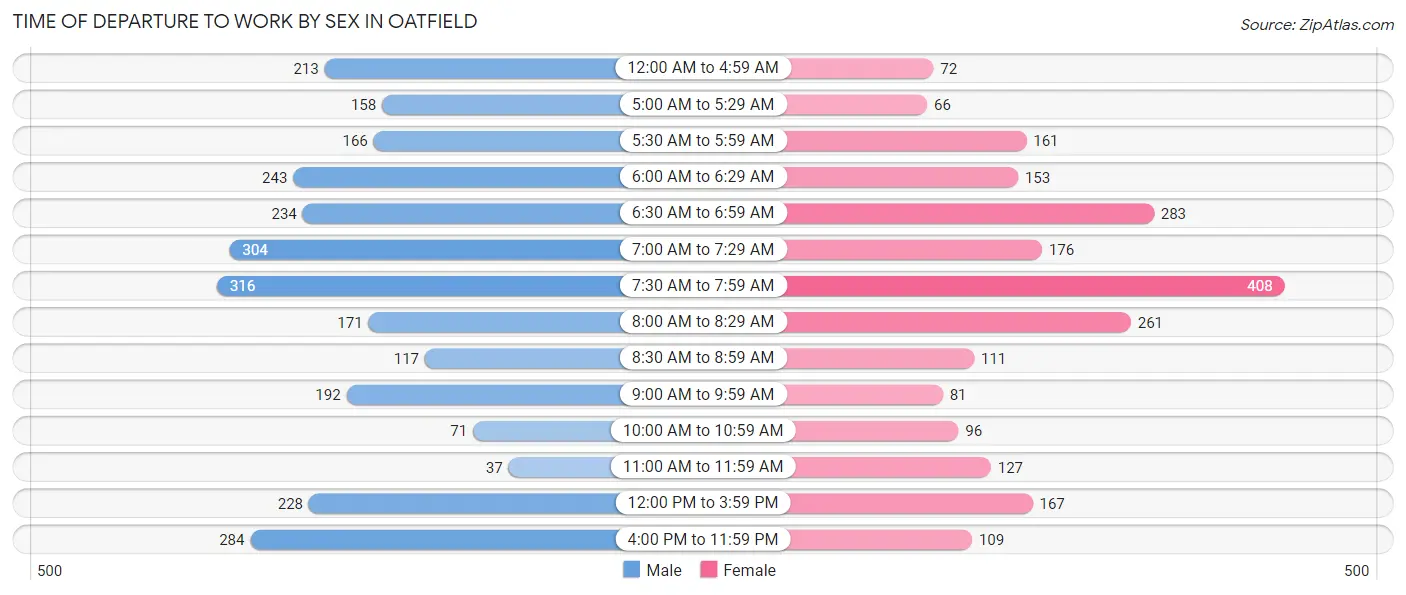
| Time of Departure | Male | Female |
| 12:00 AM to 4:59 AM | 213 (7.8%) | 72 (3.2%) |
| 5:00 AM to 5:29 AM | 158 (5.8%) | 66 (2.9%) |
| 5:30 AM to 5:59 AM | 166 (6.1%) | 161 (7.1%) |
| 6:00 AM to 6:29 AM | 243 (8.9%) | 153 (6.7%) |
| 6:30 AM to 6:59 AM | 234 (8.6%) | 283 (12.5%) |
| 7:00 AM to 7:29 AM | 304 (11.1%) | 176 (7.7%) |
| 7:30 AM to 7:59 AM | 316 (11.6%) | 408 (18.0%) |
| 8:00 AM to 8:29 AM | 171 (6.2%) | 261 (11.5%) |
| 8:30 AM to 8:59 AM | 117 (4.3%) | 111 (4.9%) |
| 9:00 AM to 9:59 AM | 192 (7.0%) | 81 (3.6%) |
| 10:00 AM to 10:59 AM | 71 (2.6%) | 96 (4.2%) |
| 11:00 AM to 11:59 AM | 37 (1.3%) | 127 (5.6%) |
| 12:00 PM to 3:59 PM | 228 (8.3%) | 167 (7.3%) |
| 4:00 PM to 11:59 PM | 284 (10.4%) | 109 (4.8%) |
| Total | 2,734 (100.0%) | 2,271 (100.0%) |
Housing Occupancy in Oatfield
Occupancy by Ownership in Oatfield
Of the total 4,841 dwellings in Oatfield, owner-occupied units account for 4,204 (86.8%), while renter-occupied units make up 637 (13.2%).
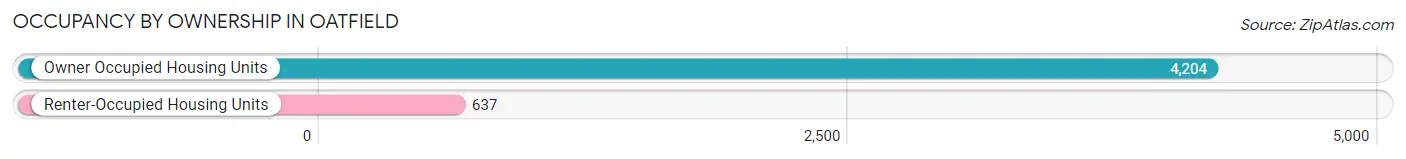
| Occupancy | # Housing Units | % Housing Units |
| Owner Occupied Housing Units | 4,204 | 86.8% |
| Renter-Occupied Housing Units | 637 | 13.2% |
| Total Occupied Housing Units | 4,841 | 100.0% |
Occupancy by Household Size in Oatfield
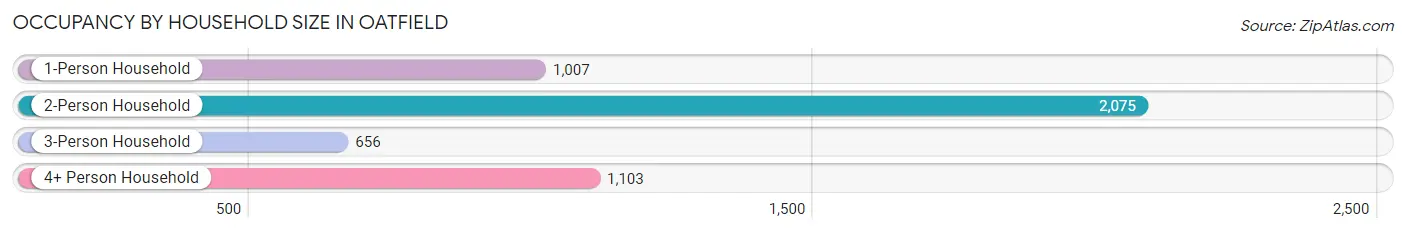
| Household Size | # Housing Units | % Housing Units |
| 1-Person Household | 1,007 | 20.8% |
| 2-Person Household | 2,075 | 42.9% |
| 3-Person Household | 656 | 13.6% |
| 4+ Person Household | 1,103 | 22.8% |
| Total Housing Units | 4,841 | 100.0% |
Occupancy by Ownership by Household Size in Oatfield
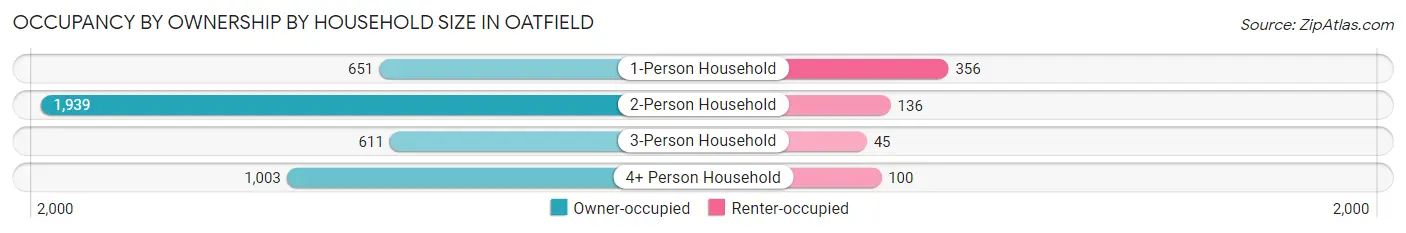
| Household Size | Owner-occupied | Renter-occupied |
| 1-Person Household | 651 (64.6%) | 356 (35.3%) |
| 2-Person Household | 1,939 (93.4%) | 136 (6.6%) |
| 3-Person Household | 611 (93.1%) | 45 (6.9%) |
| 4+ Person Household | 1,003 (90.9%) | 100 (9.1%) |
| Total Housing Units | 4,204 (86.8%) | 637 (13.2%) |
Occupancy by Educational Attainment in Oatfield
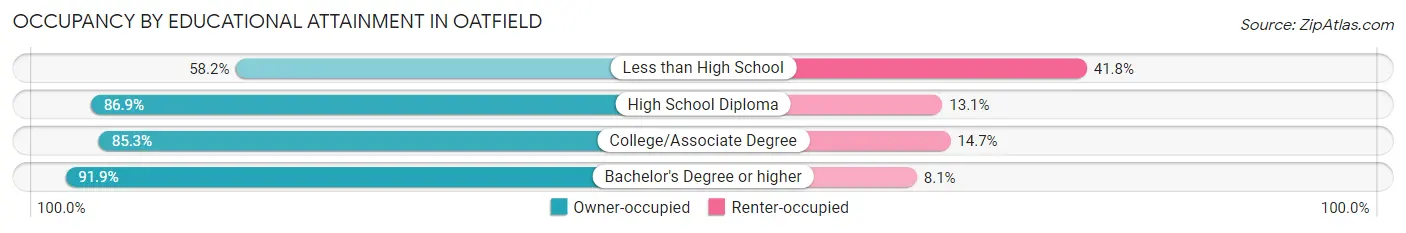
| Household Size | Owner-occupied | Renter-occupied |
| Less than High School | 152 (58.2%) | 109 (41.8%) |
| High School Diploma | 649 (86.9%) | 98 (13.1%) |
| College/Associate Degree | 1,546 (85.3%) | 267 (14.7%) |
| Bachelor's Degree or higher | 1,857 (91.9%) | 163 (8.1%) |
Occupancy by Age of Householder in Oatfield
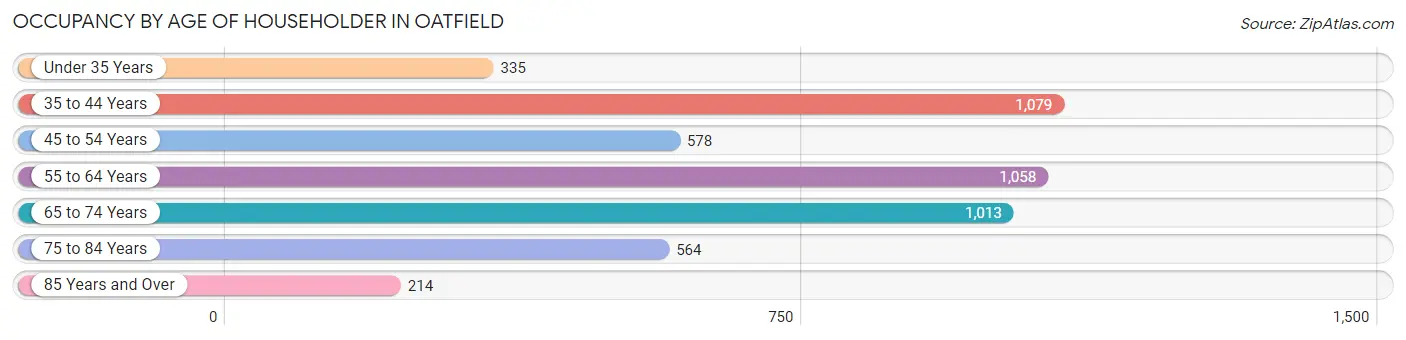
| Age Bracket | # Households | % Households |
| Under 35 Years | 335 | 6.9% |
| 35 to 44 Years | 1,079 | 22.3% |
| 45 to 54 Years | 578 | 11.9% |
| 55 to 64 Years | 1,058 | 21.8% |
| 65 to 74 Years | 1,013 | 20.9% |
| 75 to 84 Years | 564 | 11.7% |
| 85 Years and Over | 214 | 4.4% |
| Total | 4,841 | 100.0% |
Housing Finances in Oatfield
Median Income by Occupancy in Oatfield
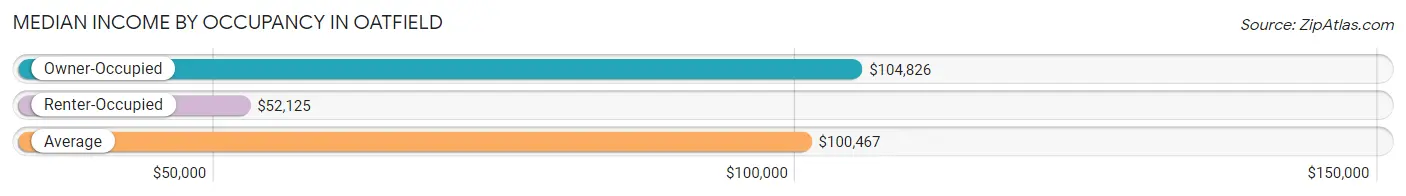
| Occupancy Type | # Households | Median Income |
| Owner-Occupied | 4,204 (86.8%) | $104,826 |
| Renter-Occupied | 637 (13.2%) | $52,125 |
| Average | 4,841 (100.0%) | $100,467 |
Occupancy by Householder Income Bracket in Oatfield
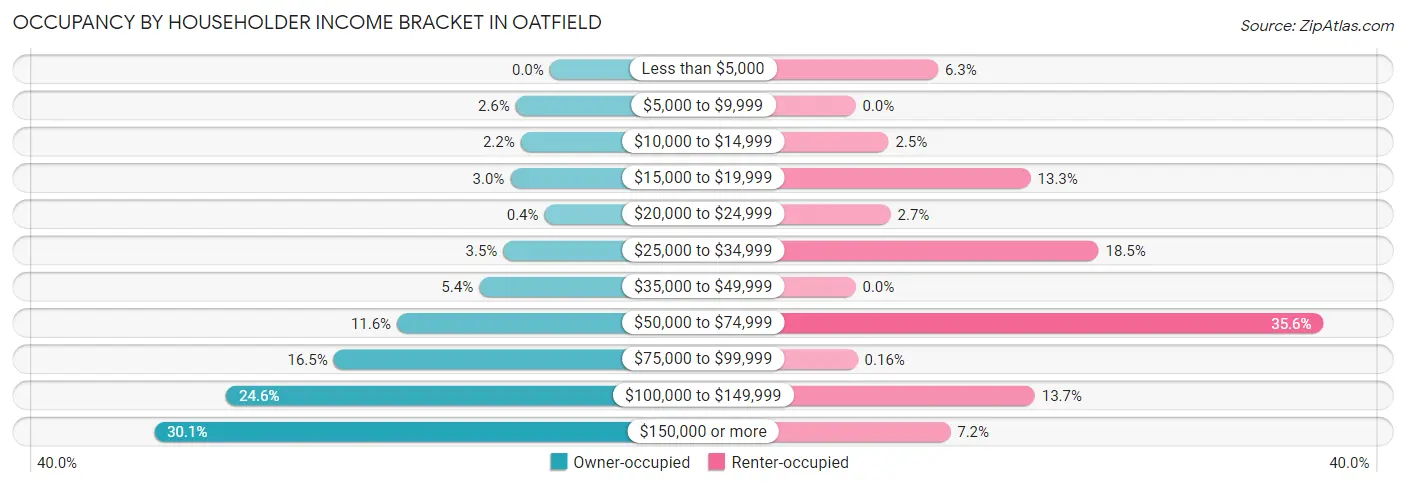
| Income Bracket | Owner-occupied | Renter-occupied |
| Less than $5,000 | 0 (0.0%) | 40 (6.3%) |
| $5,000 to $9,999 | 109 (2.6%) | 0 (0.0%) |
| $10,000 to $14,999 | 93 (2.2%) | 16 (2.5%) |
| $15,000 to $19,999 | 126 (3.0%) | 85 (13.3%) |
| $20,000 to $24,999 | 17 (0.4%) | 17 (2.7%) |
| $25,000 to $34,999 | 149 (3.5%) | 118 (18.5%) |
| $35,000 to $49,999 | 226 (5.4%) | 0 (0.0%) |
| $50,000 to $74,999 | 489 (11.6%) | 227 (35.6%) |
| $75,000 to $99,999 | 692 (16.5%) | 1 (0.2%) |
| $100,000 to $149,999 | 1,036 (24.6%) | 87 (13.7%) |
| $150,000 or more | 1,267 (30.1%) | 46 (7.2%) |
| Total | 4,204 (100.0%) | 637 (100.0%) |
Monthly Housing Cost Tiers in Oatfield
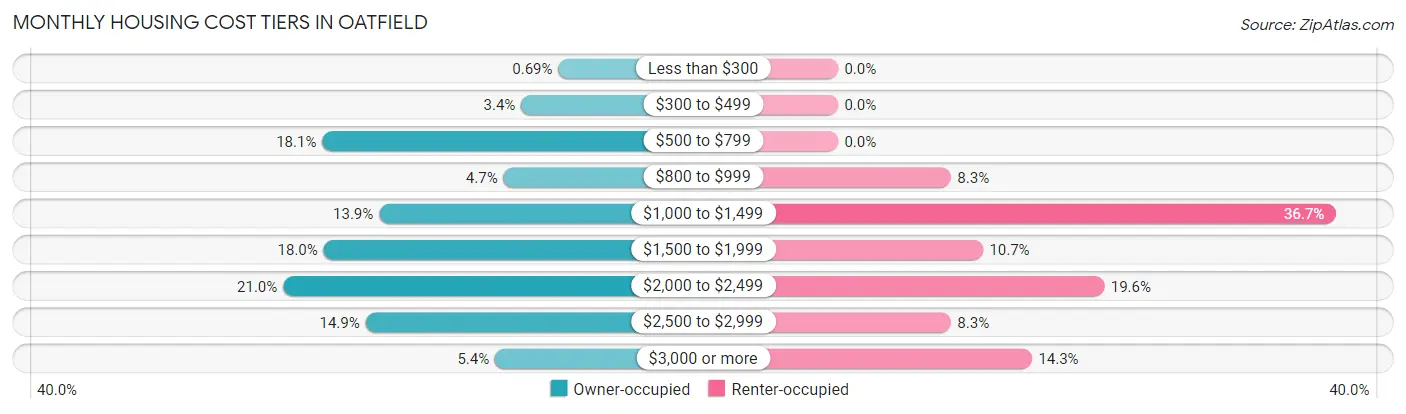
| Monthly Cost | Owner-occupied | Renter-occupied |
| Less than $300 | 29 (0.7%) | 0 (0.0%) |
| $300 to $499 | 144 (3.4%) | 0 (0.0%) |
| $500 to $799 | 760 (18.1%) | 0 (0.0%) |
| $800 to $999 | 199 (4.7%) | 53 (8.3%) |
| $1,000 to $1,499 | 584 (13.9%) | 234 (36.7%) |
| $1,500 to $1,999 | 756 (18.0%) | 68 (10.7%) |
| $2,000 to $2,499 | 881 (21.0%) | 125 (19.6%) |
| $2,500 to $2,999 | 626 (14.9%) | 53 (8.3%) |
| $3,000 or more | 225 (5.3%) | 91 (14.3%) |
| Total | 4,204 (100.0%) | 637 (100.0%) |
Physical Housing Characteristics in Oatfield
Housing Structures in Oatfield
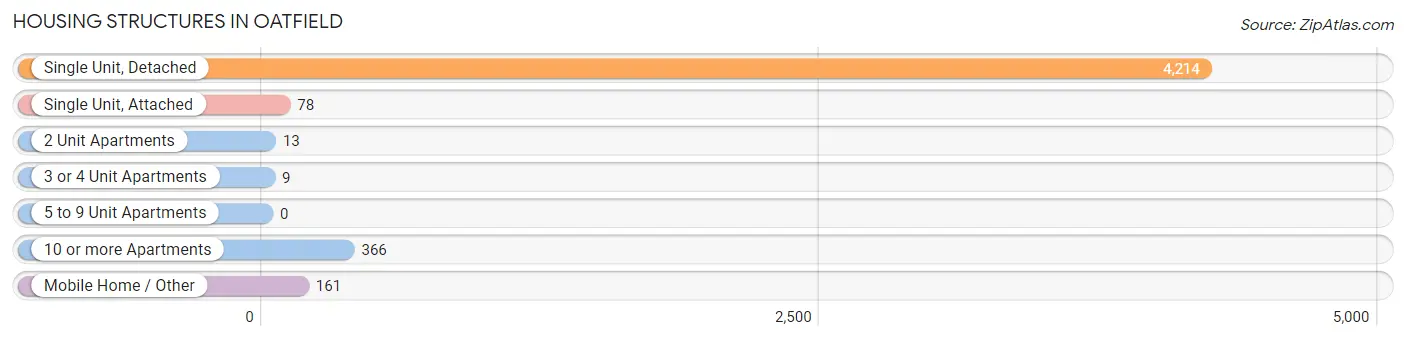
| Structure Type | # Housing Units | % Housing Units |
| Single Unit, Detached | 4,214 | 87.1% |
| Single Unit, Attached | 78 | 1.6% |
| 2 Unit Apartments | 13 | 0.3% |
| 3 or 4 Unit Apartments | 9 | 0.2% |
| 5 to 9 Unit Apartments | 0 | 0.0% |
| 10 or more Apartments | 366 | 7.6% |
| Mobile Home / Other | 161 | 3.3% |
| Total | 4,841 | 100.0% |
Housing Structures by Occupancy in Oatfield
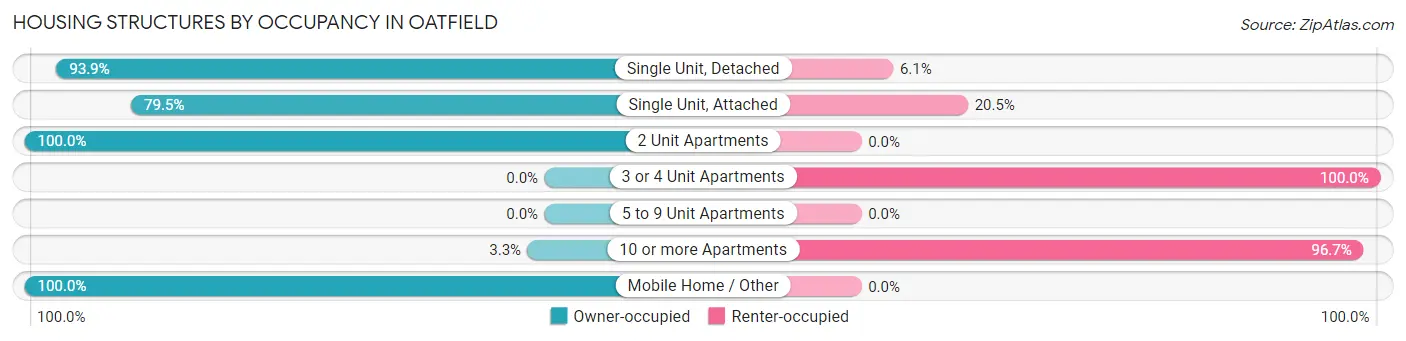
| Structure Type | Owner-occupied | Renter-occupied |
| Single Unit, Detached | 3,956 (93.9%) | 258 (6.1%) |
| Single Unit, Attached | 62 (79.5%) | 16 (20.5%) |
| 2 Unit Apartments | 13 (100.0%) | 0 (0.0%) |
| 3 or 4 Unit Apartments | 0 (0.0%) | 9 (100.0%) |
| 5 to 9 Unit Apartments | 0 (0.0%) | 0 (0.0%) |
| 10 or more Apartments | 12 (3.3%) | 354 (96.7%) |
| Mobile Home / Other | 161 (100.0%) | 0 (0.0%) |
| Total | 4,204 (86.8%) | 637 (13.2%) |
Housing Structures by Number of Rooms in Oatfield
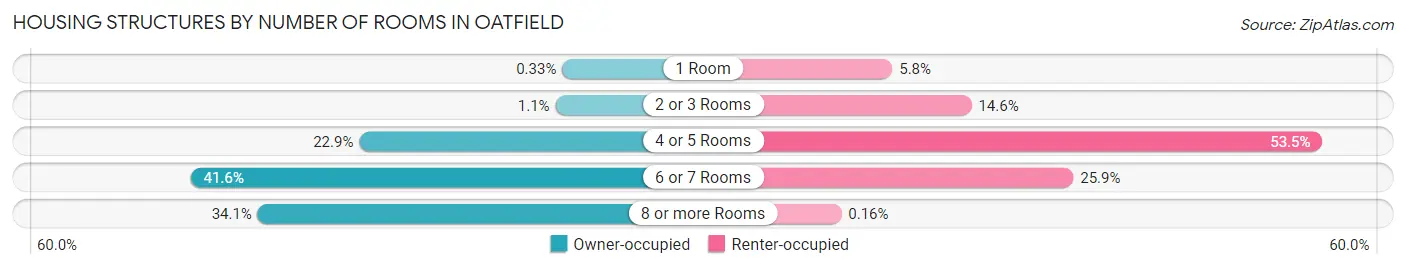
| Number of Rooms | Owner-occupied | Renter-occupied |
| 1 Room | 14 (0.3%) | 37 (5.8%) |
| 2 or 3 Rooms | 46 (1.1%) | 93 (14.6%) |
| 4 or 5 Rooms | 961 (22.9%) | 341 (53.5%) |
| 6 or 7 Rooms | 1,748 (41.6%) | 165 (25.9%) |
| 8 or more Rooms | 1,435 (34.1%) | 1 (0.2%) |
| Total | 4,204 (100.0%) | 637 (100.0%) |
Housing Structure by Heating Type in Oatfield
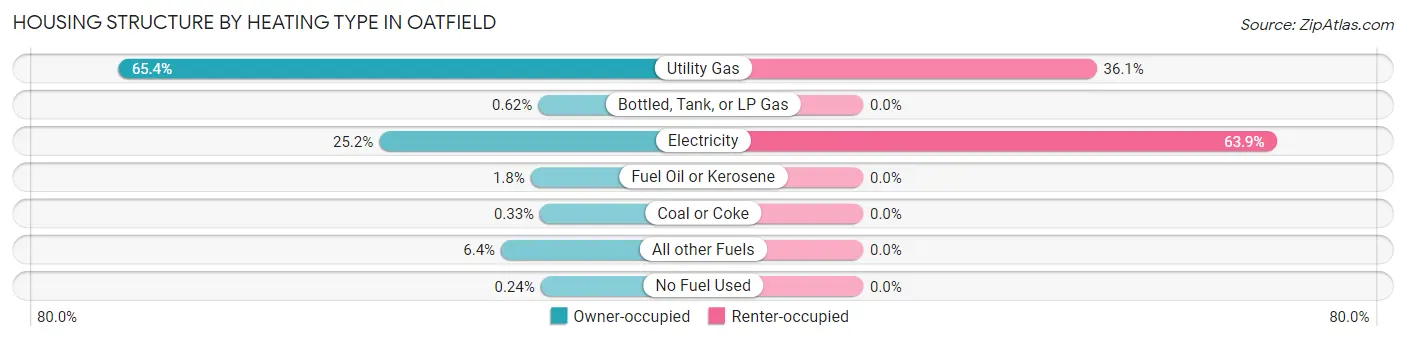
| Heating Type | Owner-occupied | Renter-occupied |
| Utility Gas | 2,751 (65.4%) | 230 (36.1%) |
| Bottled, Tank, or LP Gas | 26 (0.6%) | 0 (0.0%) |
| Electricity | 1,060 (25.2%) | 407 (63.9%) |
| Fuel Oil or Kerosene | 75 (1.8%) | 0 (0.0%) |
| Coal or Coke | 14 (0.3%) | 0 (0.0%) |
| All other Fuels | 268 (6.4%) | 0 (0.0%) |
| No Fuel Used | 10 (0.2%) | 0 (0.0%) |
| Total | 4,204 (100.0%) | 637 (100.0%) |
Household Vehicle Usage in Oatfield
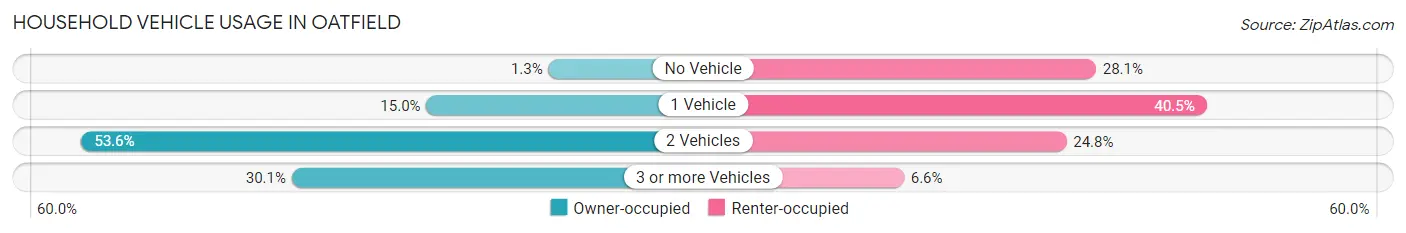
| Vehicles per Household | Owner-occupied | Renter-occupied |
| No Vehicle | 55 (1.3%) | 179 (28.1%) |
| 1 Vehicle | 630 (15.0%) | 258 (40.5%) |
| 2 Vehicles | 2,255 (53.6%) | 158 (24.8%) |
| 3 or more Vehicles | 1,264 (30.1%) | 42 (6.6%) |
| Total | 4,204 (100.0%) | 637 (100.0%) |
Real Estate & Mortgages in Oatfield
Real Estate and Mortgage Overview in Oatfield
| Characteristic | Without Mortgage | With Mortgage |
| Housing Units | 1,312 | 2,892 |
| Median Property Value | $511,600 | $483,400 |
| Median Household Income | $82,875 | $1,050 |
| Monthly Housing Costs | $694 | $225 |
| Real Estate Taxes | $4,650 | $0 |
Property Value by Mortgage Status in Oatfield
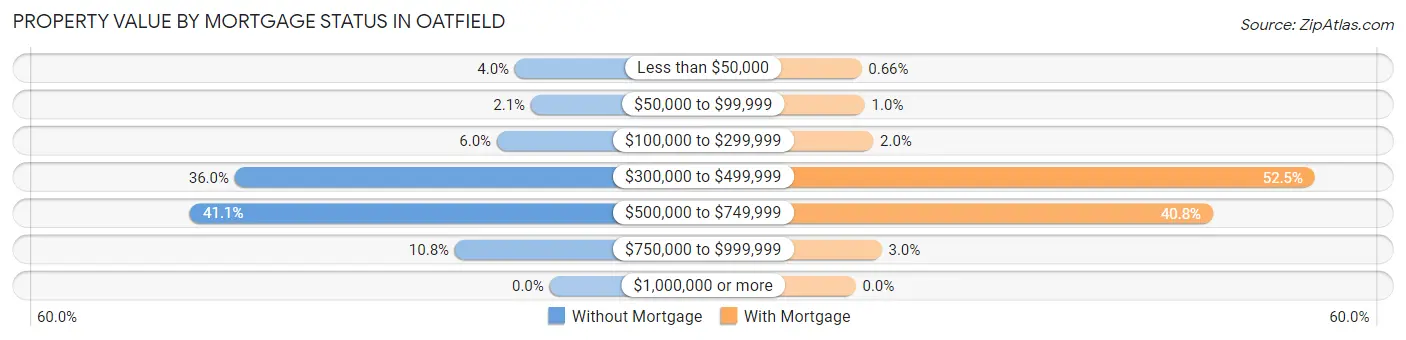
| Property Value | Without Mortgage | With Mortgage |
| Less than $50,000 | 52 (4.0%) | 19 (0.7%) |
| $50,000 to $99,999 | 28 (2.1%) | 30 (1.0%) |
| $100,000 to $299,999 | 79 (6.0%) | 58 (2.0%) |
| $300,000 to $499,999 | 472 (36.0%) | 1,518 (52.5%) |
| $500,000 to $749,999 | 539 (41.1%) | 1,181 (40.8%) |
| $750,000 to $999,999 | 142 (10.8%) | 86 (3.0%) |
| $1,000,000 or more | 0 (0.0%) | 0 (0.0%) |
| Total | 1,312 (100.0%) | 2,892 (100.0%) |
Household Income by Mortgage Status in Oatfield
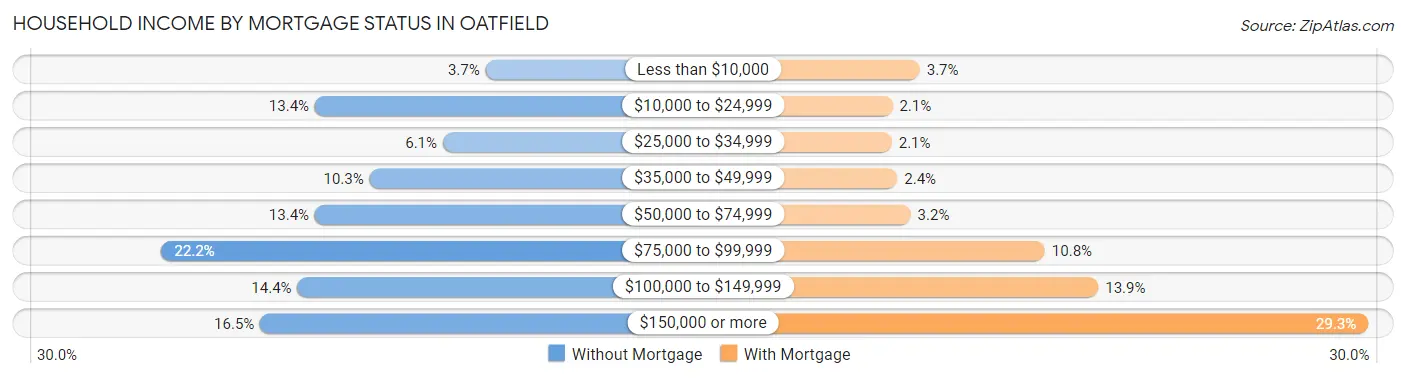
| Household Income | Without Mortgage | With Mortgage |
| Less than $10,000 | 48 (3.7%) | 106 (3.7%) |
| $10,000 to $24,999 | 176 (13.4%) | 61 (2.1%) |
| $25,000 to $34,999 | 80 (6.1%) | 60 (2.1%) |
| $35,000 to $49,999 | 135 (10.3%) | 69 (2.4%) |
| $50,000 to $74,999 | 176 (13.4%) | 91 (3.2%) |
| $75,000 to $99,999 | 291 (22.2%) | 313 (10.8%) |
| $100,000 to $149,999 | 189 (14.4%) | 401 (13.9%) |
| $150,000 or more | 217 (16.5%) | 847 (29.3%) |
| Total | 1,312 (100.0%) | 2,892 (100.0%) |
Property Value to Household Income Ratio in Oatfield
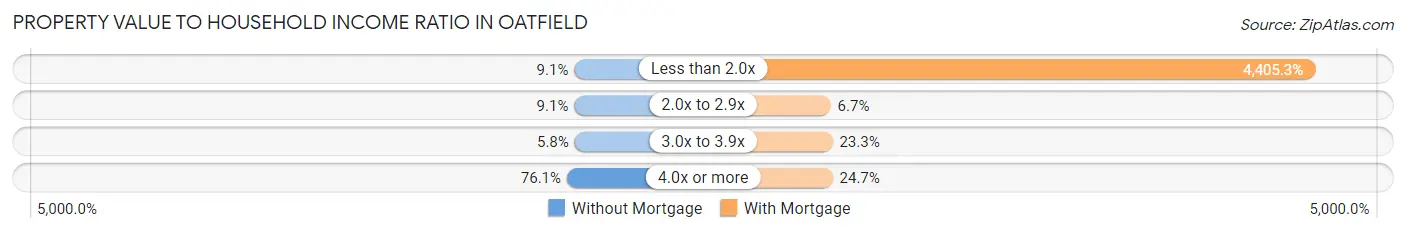
| Value-to-Income Ratio | Without Mortgage | With Mortgage |
| Less than 2.0x | 119 (9.1%) | 127,402 (4,405.3%) |
| 2.0x to 2.9x | 119 (9.1%) | 193 (6.7%) |
| 3.0x to 3.9x | 76 (5.8%) | 674 (23.3%) |
| 4.0x or more | 998 (76.1%) | 713 (24.6%) |
| Total | 1,312 (100.0%) | 2,892 (100.0%) |
Real Estate Taxes by Mortgage Status in Oatfield
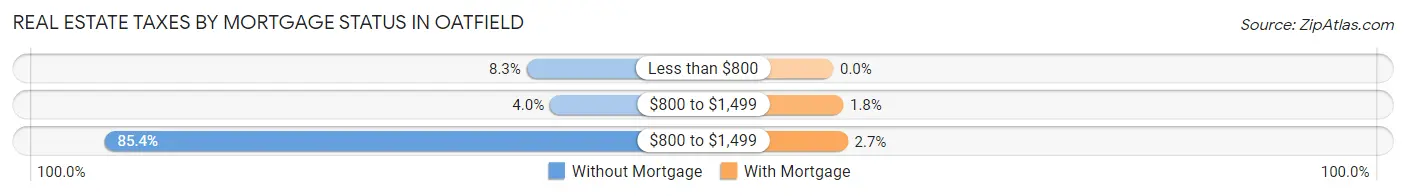
| Property Taxes | Without Mortgage | With Mortgage |
| Less than $800 | 109 (8.3%) | 0 (0.0%) |
| $800 to $1,499 | 53 (4.0%) | 53 (1.8%) |
| $800 to $1,499 | 1,120 (85.4%) | 77 (2.7%) |
| Total | 1,312 (100.0%) | 2,892 (100.0%) |
Health & Disability in Oatfield
Health Insurance Coverage by Age in Oatfield
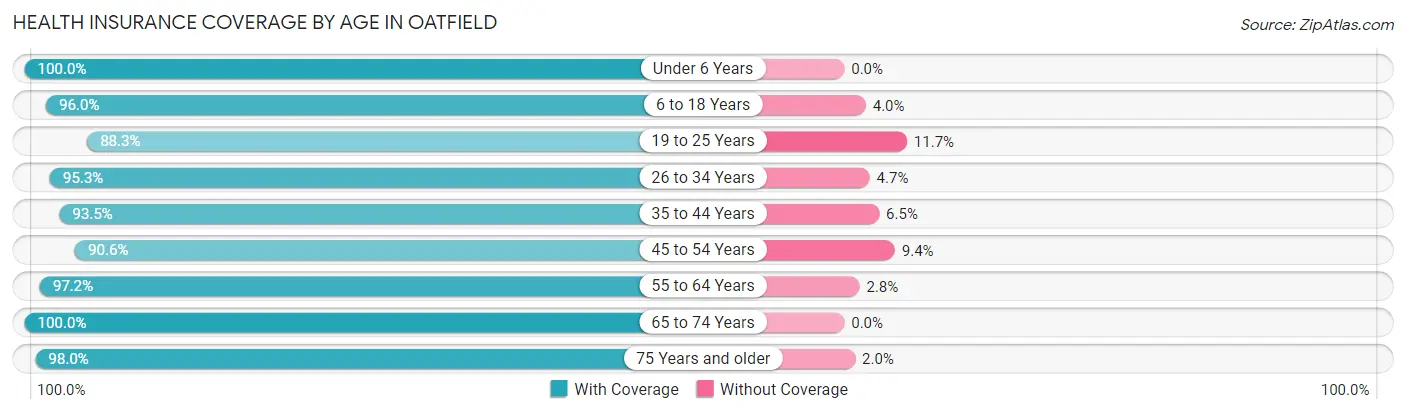
| Age Bracket | With Coverage | Without Coverage |
| Under 6 Years | 877 (100.0%) | 0 (0.0%) |
| 6 to 18 Years | 1,220 (96.0%) | 51 (4.0%) |
| 19 to 25 Years | 809 (88.3%) | 107 (11.7%) |
| 26 to 34 Years | 1,067 (95.3%) | 53 (4.7%) |
| 35 to 44 Years | 2,027 (93.5%) | 141 (6.5%) |
| 45 to 54 Years | 1,335 (90.6%) | 139 (9.4%) |
| 55 to 64 Years | 1,816 (97.2%) | 53 (2.8%) |
| 65 to 74 Years | 1,998 (100.0%) | 0 (0.0%) |
| 75 Years and older | 1,264 (98.0%) | 26 (2.0%) |
| Total | 12,413 (95.6%) | 570 (4.4%) |
Health Insurance Coverage by Citizenship Status in Oatfield
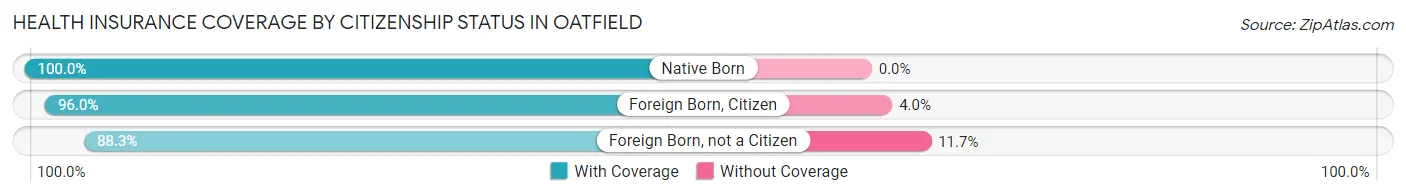
| Citizenship Status | With Coverage | Without Coverage |
| Native Born | 877 (100.0%) | 0 (0.0%) |
| Foreign Born, Citizen | 1,220 (96.0%) | 51 (4.0%) |
| Foreign Born, not a Citizen | 809 (88.3%) | 107 (11.7%) |
Health Insurance Coverage by Household Income in Oatfield
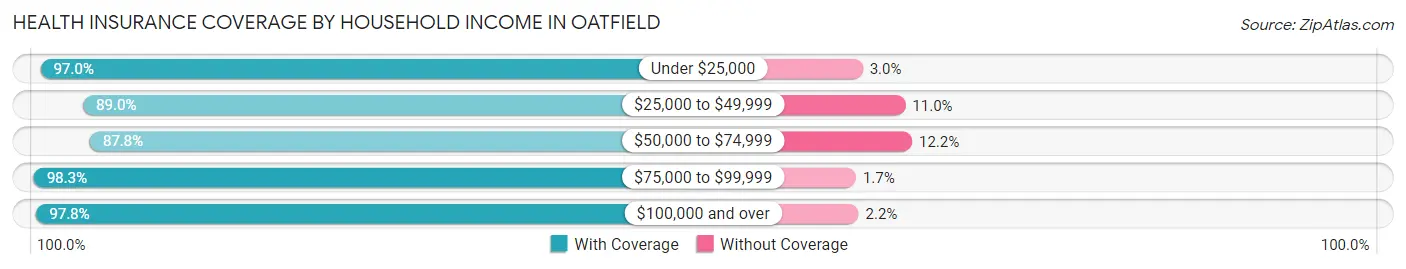
| Household Income | With Coverage | Without Coverage |
| Under $25,000 | 618 (97.0%) | 19 (3.0%) |
| $25,000 to $49,999 | 754 (89.0%) | 93 (11.0%) |
| $50,000 to $74,999 | 1,473 (87.8%) | 205 (12.2%) |
| $75,000 to $99,999 | 1,770 (98.3%) | 31 (1.7%) |
| $100,000 and over | 7,491 (97.8%) | 169 (2.2%) |
Public vs Private Health Insurance Coverage by Age in Oatfield
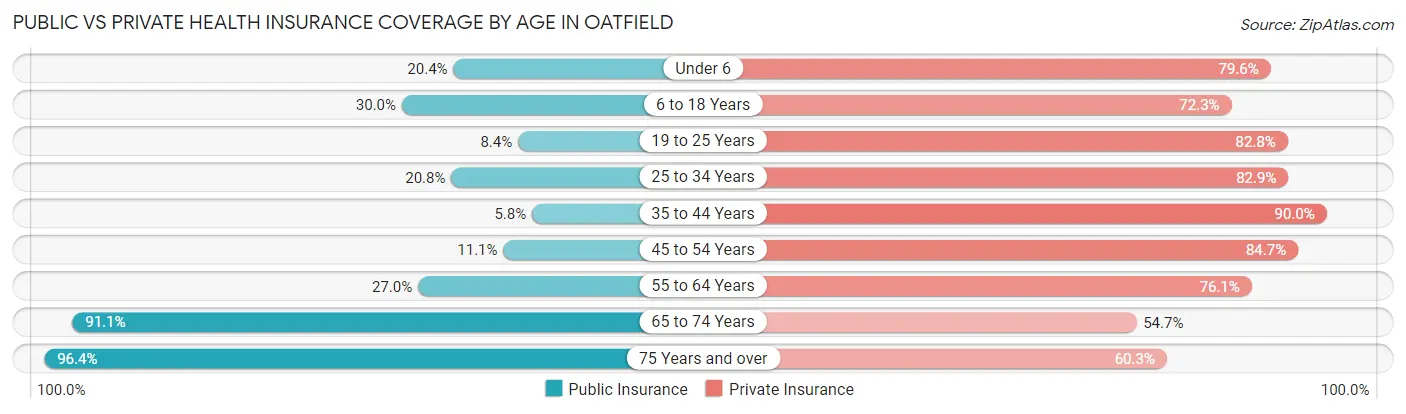
| Age Bracket | Public Insurance | Private Insurance |
| Under 6 | 179 (20.4%) | 698 (79.6%) |
| 6 to 18 Years | 381 (30.0%) | 919 (72.3%) |
| 19 to 25 Years | 77 (8.4%) | 758 (82.8%) |
| 25 to 34 Years | 233 (20.8%) | 928 (82.9%) |
| 35 to 44 Years | 126 (5.8%) | 1,951 (90.0%) |
| 45 to 54 Years | 164 (11.1%) | 1,248 (84.7%) |
| 55 to 64 Years | 504 (27.0%) | 1,422 (76.1%) |
| 65 to 74 Years | 1,821 (91.1%) | 1,092 (54.6%) |
| 75 Years and over | 1,243 (96.4%) | 778 (60.3%) |
| Total | 4,728 (36.4%) | 9,794 (75.4%) |
Disability Status by Sex by Age in Oatfield
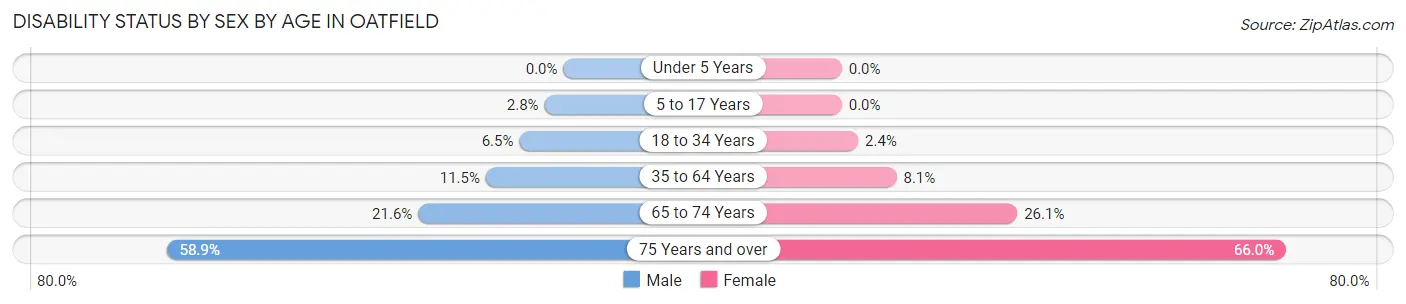
| Age Bracket | Male | Female |
| Under 5 Years | 0 (0.0%) | 0 (0.0%) |
| 5 to 17 Years | 17 (2.8%) | 0 (0.0%) |
| 18 to 34 Years | 63 (6.5%) | 27 (2.4%) |
| 35 to 64 Years | 312 (11.5%) | 228 (8.1%) |
| 65 to 74 Years | 194 (21.6%) | 286 (26.1%) |
| 75 Years and over | 251 (58.9%) | 570 (66.0%) |
Disability Class by Sex by Age in Oatfield
Disability Class: Hearing Difficulty
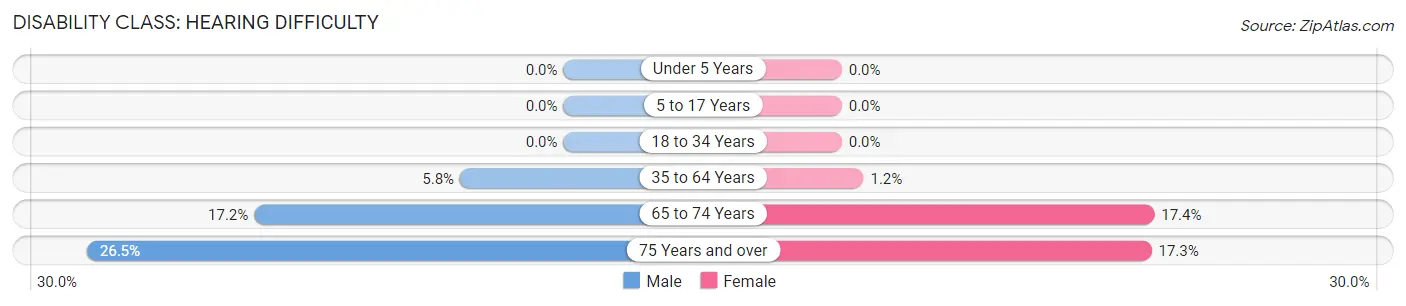
| Age Bracket | Male | Female |
| Under 5 Years | 0 (0.0%) | 0 (0.0%) |
| 5 to 17 Years | 0 (0.0%) | 0 (0.0%) |
| 18 to 34 Years | 0 (0.0%) | 0 (0.0%) |
| 35 to 64 Years | 156 (5.8%) | 34 (1.2%) |
| 65 to 74 Years | 155 (17.2%) | 191 (17.4%) |
| 75 Years and over | 113 (26.5%) | 149 (17.2%) |
Disability Class: Vision Difficulty
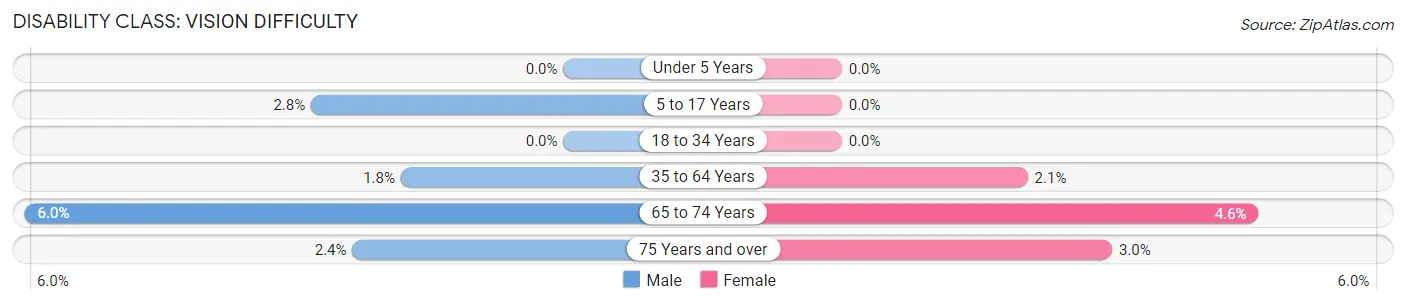
| Age Bracket | Male | Female |
| Under 5 Years | 0 (0.0%) | 0 (0.0%) |
| 5 to 17 Years | 17 (2.8%) | 0 (0.0%) |
| 18 to 34 Years | 0 (0.0%) | 0 (0.0%) |
| 35 to 64 Years | 49 (1.8%) | 58 (2.1%) |
| 65 to 74 Years | 54 (6.0%) | 51 (4.6%) |
| 75 Years and over | 10 (2.4%) | 26 (3.0%) |
Disability Class: Cognitive Difficulty
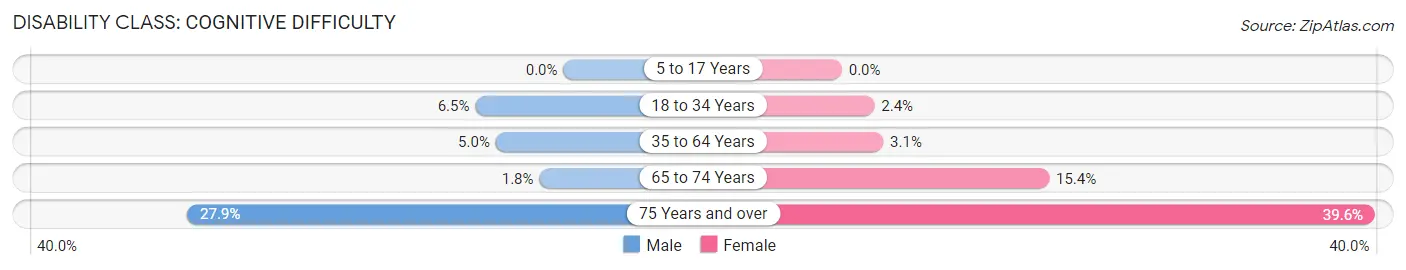
| Age Bracket | Male | Female |
| 5 to 17 Years | 0 (0.0%) | 0 (0.0%) |
| 18 to 34 Years | 63 (6.5%) | 27 (2.4%) |
| 35 to 64 Years | 136 (5.0%) | 86 (3.1%) |
| 65 to 74 Years | 16 (1.8%) | 169 (15.4%) |
| 75 Years and over | 119 (27.9%) | 342 (39.6%) |
Disability Class: Ambulatory Difficulty
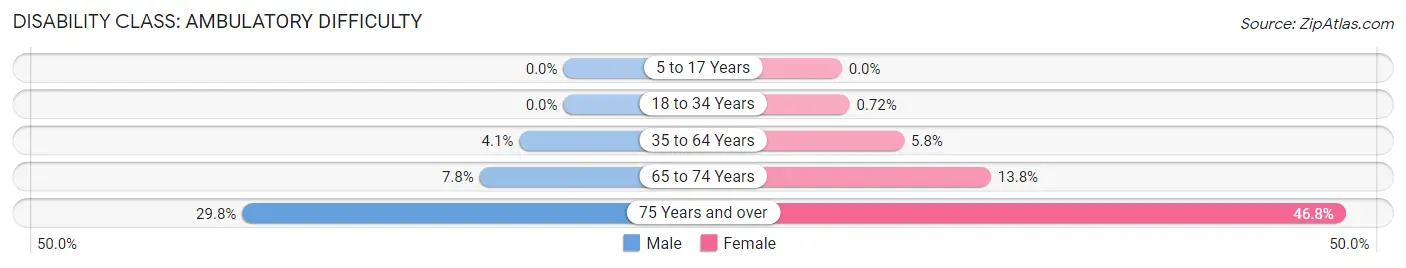
| Age Bracket | Male | Female |
| 5 to 17 Years | 0 (0.0%) | 0 (0.0%) |
| 18 to 34 Years | 0 (0.0%) | 8 (0.7%) |
| 35 to 64 Years | 111 (4.1%) | 162 (5.8%) |
| 65 to 74 Years | 70 (7.8%) | 152 (13.8%) |
| 75 Years and over | 127 (29.8%) | 404 (46.8%) |
Disability Class: Self-Care Difficulty
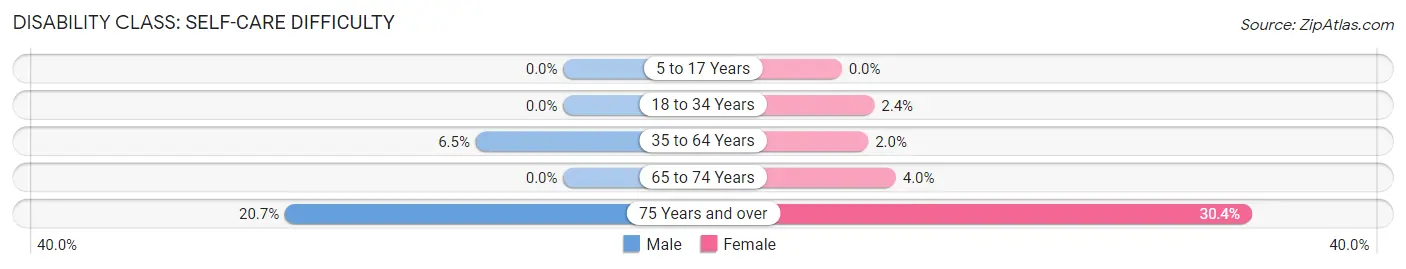
| Age Bracket | Male | Female |
| 5 to 17 Years | 0 (0.0%) | 0 (0.0%) |
| 18 to 34 Years | 0 (0.0%) | 27 (2.4%) |
| 35 to 64 Years | 176 (6.5%) | 55 (2.0%) |
| 65 to 74 Years | 0 (0.0%) | 44 (4.0%) |
| 75 Years and over | 88 (20.7%) | 263 (30.4%) |
Technology Access in Oatfield
Computing Device Access in Oatfield
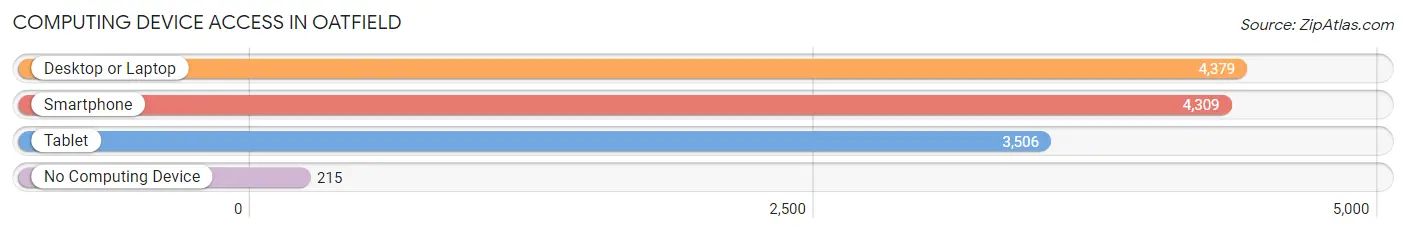
| Device Type | # Households | % Households |
| Desktop or Laptop | 4,379 | 90.5% |
| Smartphone | 4,309 | 89.0% |
| Tablet | 3,506 | 72.4% |
| No Computing Device | 215 | 4.4% |
| Total | 4,841 | 100.0% |
Internet Access in Oatfield
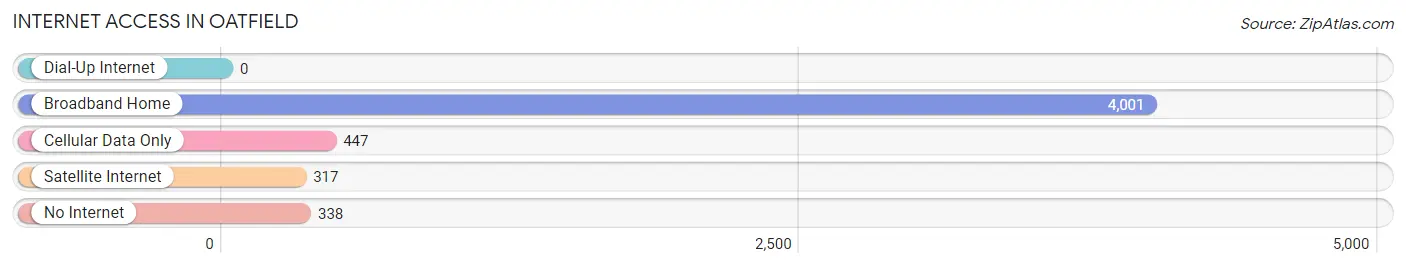
| Internet Type | # Households | % Households |
| Dial-Up Internet | 0 | 0.0% |
| Broadband Home | 4,001 | 82.7% |
| Cellular Data Only | 447 | 9.2% |
| Satellite Internet | 317 | 6.6% |
| No Internet | 338 | 7.0% |
| Total | 4,841 | 100.0% |
Oatfield Summary
Oatfield is an unincorporated community located in Clackamas County, Oregon, United States. It is situated in the foothills of the Cascade Mountains, approximately 10 miles south of Portland. The community is named after the Oatfield family, who settled in the area in the late 1800s.
History
The Oatfield family first settled in the area in the late 1800s. The family was originally from England and had immigrated to the United States in the mid-1800s. The family purchased land in the area and began farming. The family grew oats, wheat, and other crops, and raised livestock. The family also built a sawmill and a gristmill, which were used to process the crops they grew.
The Oatfield family was also involved in the local community. They built a schoolhouse and a church, and were active in the local government. The family also donated land for a cemetery, which is still in use today.
The Oatfield family continued to live in the area until the early 1900s, when they moved away. The community continued to grow and develop, and by the mid-1900s, it had become a small rural community.
Geography
Oatfield is located in the foothills of the Cascade Mountains, approximately 10 miles south of Portland. The community is situated in a valley, surrounded by rolling hills and forests. The area is known for its scenic beauty and is a popular destination for outdoor recreation.
The climate in Oatfield is mild and temperate. Summers are warm and dry, while winters are cool and wet. The average annual temperature is around 50 degrees Fahrenheit.
Economy
The economy of Oatfield is largely based on agriculture and forestry. The area is home to several farms, which produce a variety of crops, including oats, wheat, and other grains. The area is also home to several timber companies, which harvest and process timber from the surrounding forests.
In addition to agriculture and forestry, Oatfield is home to several small businesses, including restaurants, shops, and other services. The community is also home to a small airport, which serves the local area.
Demographics
As of the 2010 census, the population of Oatfield was 1,845. The population is largely white (94.3%), with a small minority population (5.7%). The median household income is $50,000, and the median age is 44.
Conclusion
Oatfield is a small rural community located in the foothills of the Cascade Mountains, approximately 10 miles south of Portland. The community is named after the Oatfield family, who settled in the area in the late 1800s. The economy of Oatfield is largely based on agriculture and forestry, and the population is largely white. The area is known for its scenic beauty and is a popular destination for outdoor recreation.
Common Questions
What is Per Capita Income in Oatfield?
Per Capita income in Oatfield is $43,783.
What is the Median Family Income in Oatfield?
Median Family Income in Oatfield is $110,871.
What is the Median Household income in Oatfield?
Median Household Income in Oatfield is $100,467.
What is Income or Wage Gap in Oatfield?
Income or Wage Gap in Oatfield is 23.4%.
Women in Oatfield earn 76.6 cents for every dollar earned by a man.
What is Inequality or Gini Index in Oatfield?
Inequality or Gini Index in Oatfield is 0.37.
What is the Total Population of Oatfield?
Total Population of Oatfield is 13,073.
What is the Total Male Population of Oatfield?
Total Male Population of Oatfield is 6,039.
What is the Total Female Population of Oatfield?
Total Female Population of Oatfield is 7,034.
What is the Ratio of Males per 100 Females in Oatfield?
There are 85.85 Males per 100 Females in Oatfield.
What is the Ratio of Females per 100 Males in Oatfield?
There are 116.48 Females per 100 Males in Oatfield.
What is the Median Population Age in Oatfield?
Median Population Age in Oatfield is 46.5 Years.
What is the Average Family Size in Oatfield
Average Family Size in Oatfield is 2.9 People.
What is the Average Household Size in Oatfield
Average Household Size in Oatfield is 2.6 People.
How Large is the Labor Force in Oatfield?
There are 6,519 People in the Labor Forcein in Oatfield.
What is the Percentage of People in the Labor Force in Oatfield?
58.6% of People are in the Labor Force in Oatfield.
What is the Unemployment Rate in Oatfield?
Unemployment Rate in Oatfield is 4.5%.