Chenoweth, OR Map & Demographics
Chenoweth Map
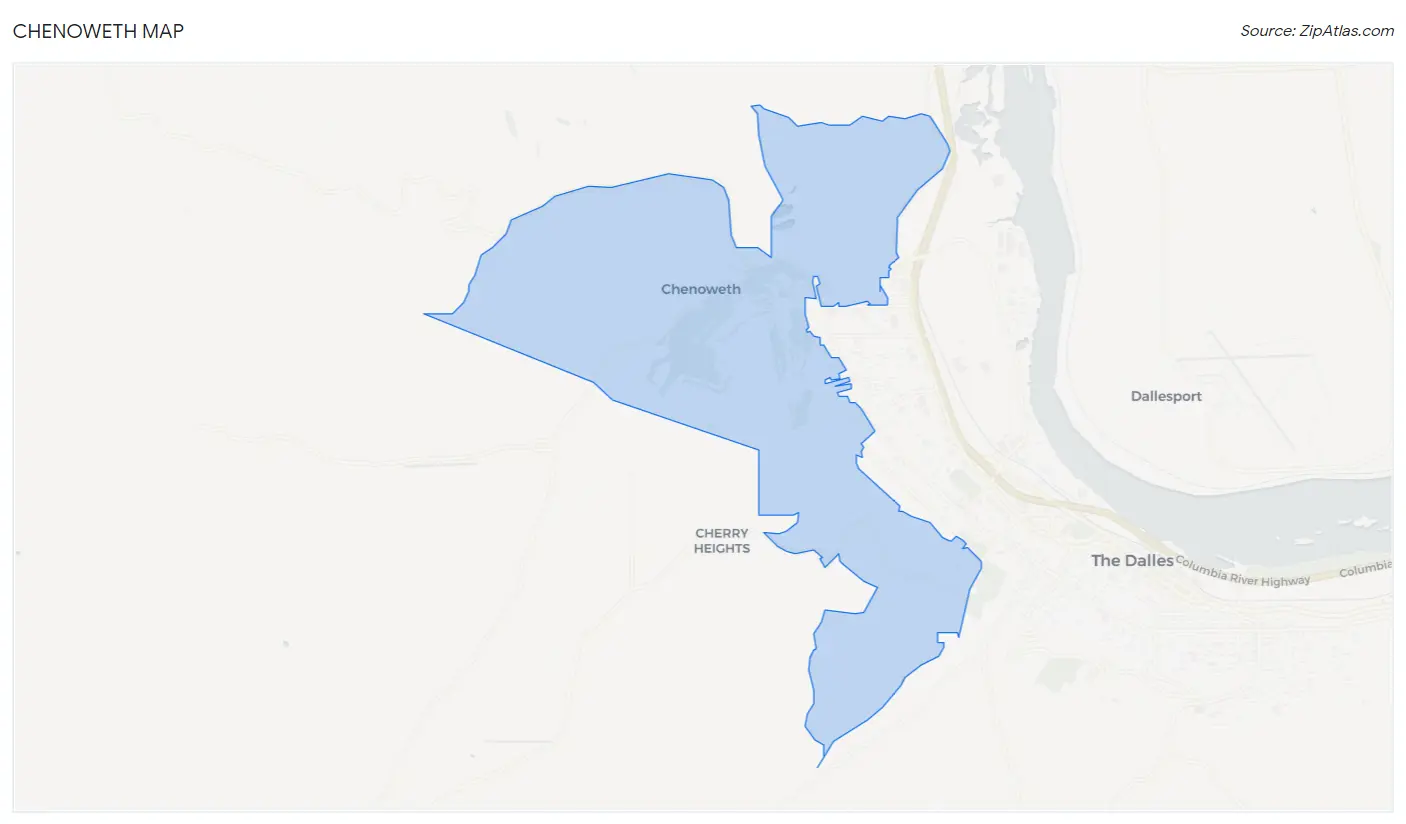
Chenoweth Overview
$33,971
PER CAPITA INCOME
$69,828
AVG FAMILY INCOME
$59,148
AVG HOUSEHOLD INCOME
44.8%
WAGE / INCOME GAP [ % ]
55.2¢/ $1
WAGE / INCOME GAP [ $ ]
0.43
INEQUALITY / GINI INDEX
1,717
TOTAL POPULATION
970
MALE POPULATION
747
FEMALE POPULATION
129.85
MALES / 100 FEMALES
77.01
FEMALES / 100 MALES
35.9
MEDIAN AGE
3.0
AVG FAMILY SIZE
2.5
AVG HOUSEHOLD SIZE
863
LABOR FORCE [ PEOPLE ]
66.0%
PERCENT IN LABOR FORCE
12.9%
UNEMPLOYMENT RATE
Income in Chenoweth
Income Overview in Chenoweth
Per Capita Income in Chenoweth is $33,971, while median incomes of families and households are $69,828 and $59,148 respectively.
| Characteristic | Number | Measure |
| Per Capita Income | 1,717 | $33,971 |
| Median Family Income | 472 | $69,828 |
| Mean Family Income | 472 | $98,148 |
| Median Household Income | 696 | $59,148 |
| Mean Household Income | 696 | $81,607 |
| Income Deficit | 472 | $0 |
| Wage / Income Gap (%) | 1,717 | 44.79% |
| Wage / Income Gap ($) | 1,717 | 55.21¢ per $1 |
| Gini / Inequality Index | 1,717 | 0.43 |
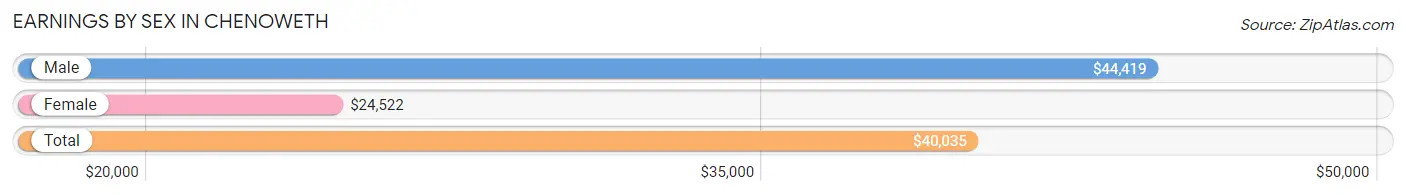
Earnings by Sex in Chenoweth
Average Earnings in Chenoweth are $40,035, $44,419 for men and $24,522 for women, a difference of 44.8%.
| Sex | Number | Average Earnings |
| Male | 490 (57.7%) | $44,419 |
| Female | 359 (42.3%) | $24,522 |
| Total | 849 (100.0%) | $40,035 |
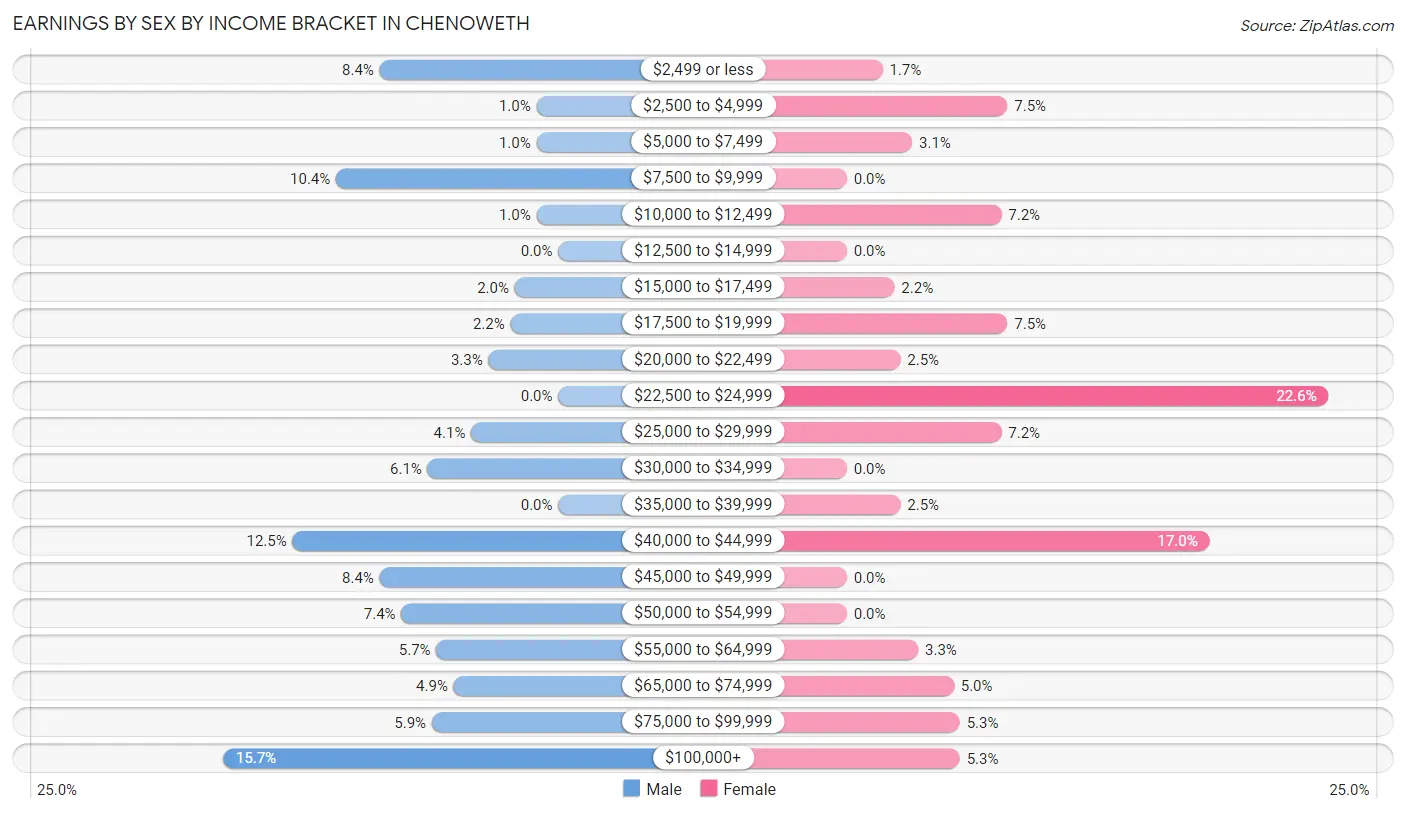
Earnings by Sex by Income Bracket in Chenoweth
The most common earnings brackets in Chenoweth are $100,000+ for men (77 | 15.7%) and $22,500 to $24,999 for women (81 | 22.6%).
| Income | Male | Female |
| $2,499 or less | 41 (8.4%) | 6 (1.7%) |
| $2,500 to $4,999 | 5 (1.0%) | 27 (7.5%) |
| $5,000 to $7,499 | 5 (1.0%) | 11 (3.1%) |
| $7,500 to $9,999 | 51 (10.4%) | 0 (0.0%) |
| $10,000 to $12,499 | 5 (1.0%) | 26 (7.2%) |
| $12,500 to $14,999 | 0 (0.0%) | 0 (0.0%) |
| $15,000 to $17,499 | 10 (2.0%) | 8 (2.2%) |
| $17,500 to $19,999 | 11 (2.2%) | 27 (7.5%) |
| $20,000 to $22,499 | 16 (3.3%) | 9 (2.5%) |
| $22,500 to $24,999 | 0 (0.0%) | 81 (22.6%) |
| $25,000 to $29,999 | 20 (4.1%) | 26 (7.2%) |
| $30,000 to $34,999 | 30 (6.1%) | 0 (0.0%) |
| $35,000 to $39,999 | 0 (0.0%) | 9 (2.5%) |
| $40,000 to $44,999 | 61 (12.4%) | 61 (17.0%) |
| $45,000 to $49,999 | 41 (8.4%) | 0 (0.0%) |
| $50,000 to $54,999 | 36 (7.3%) | 0 (0.0%) |
| $55,000 to $64,999 | 28 (5.7%) | 12 (3.3%) |
| $65,000 to $74,999 | 24 (4.9%) | 18 (5.0%) |
| $75,000 to $99,999 | 29 (5.9%) | 19 (5.3%) |
| $100,000+ | 77 (15.7%) | 19 (5.3%) |
| Total | 490 (100.0%) | 359 (100.0%) |
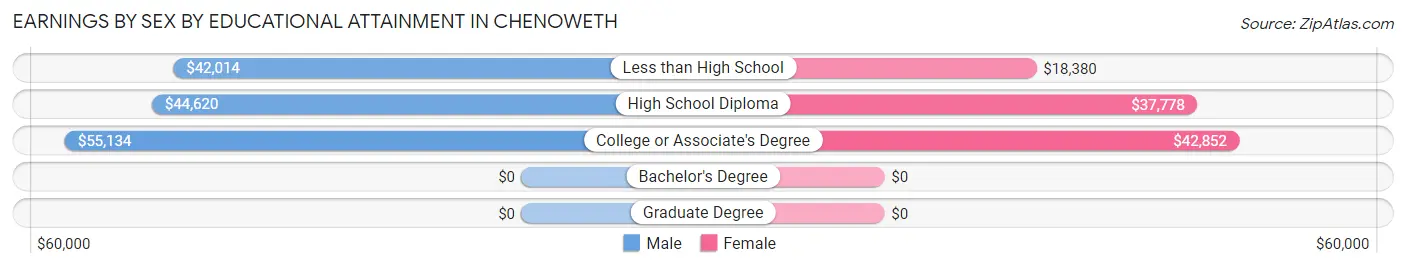
Earnings by Sex by Educational Attainment in Chenoweth
Average earnings in Chenoweth are $45,847 for men and $24,753 for women, a difference of 46.0%. Men with an educational attainment of college or associate's degree enjoy the highest average annual earnings of $55,134, while those with less than high school education earn the least with $42,014. Women with an educational attainment of college or associate's degree earn the most with the average annual earnings of $42,852, while those with less than high school education have the smallest earnings of $18,380.
| Educational Attainment | Male Income | Female Income |
| Less than High School | $42,014 | $18,380 |
| High School Diploma | $44,620 | $37,778 |
| College or Associate's Degree | $55,134 | $42,852 |
| Bachelor's Degree | - | - |
| Graduate Degree | - | - |
| Total | $45,847 | $24,753 |
Family Income in Chenoweth
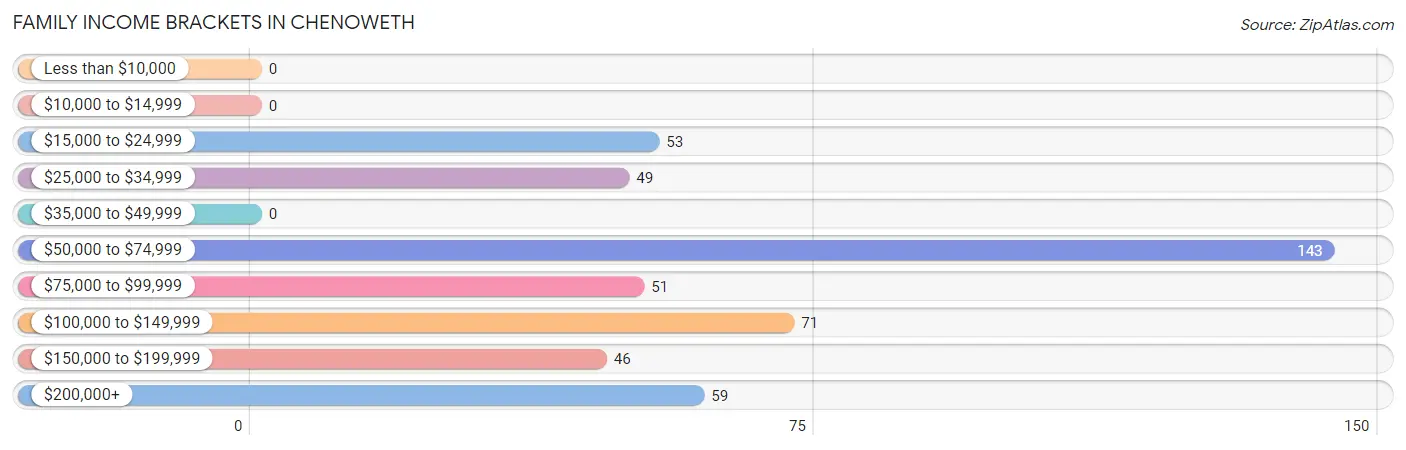
Family Income Brackets in Chenoweth
According to the Chenoweth family income data, there are 143 families falling into the $50,000 to $74,999 income range, which is the most common income bracket and makes up 30.3% of all families.
| Income Bracket | # Families | % Families |
| Less than $10,000 | 0 | 0.0% |
| $10,000 to $14,999 | 0 | 0.0% |
| $15,000 to $24,999 | 53 | 11.2% |
| $25,000 to $34,999 | 49 | 10.4% |
| $35,000 to $49,999 | 0 | 0.0% |
| $50,000 to $74,999 | 143 | 30.3% |
| $75,000 to $99,999 | 51 | 10.8% |
| $100,000 to $149,999 | 71 | 15.0% |
| $150,000 to $199,999 | 46 | 9.7% |
| $200,000+ | 59 | 12.5% |
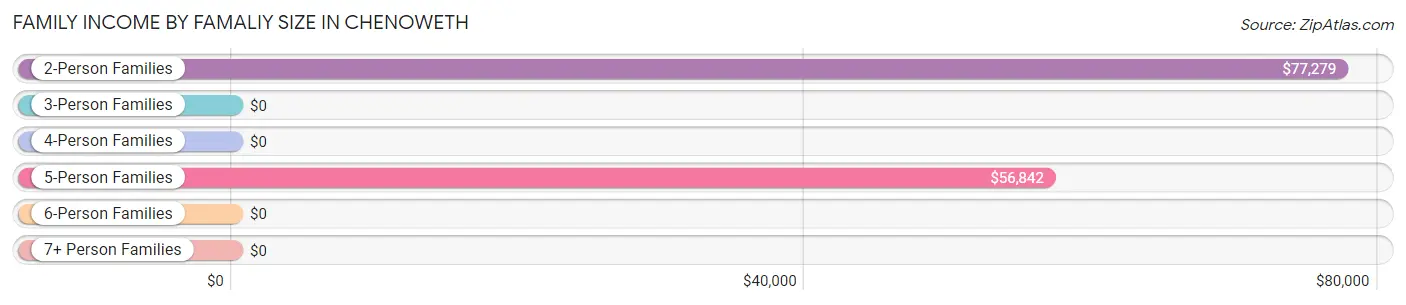
Family Income by Famaliy Size in Chenoweth
2-person families (281 | 59.5%) account for the highest median family income in Chenoweth with $77,279 per family, while 2-person families (281 | 59.5%) have the highest median income of $38,640 per family member.
| Income Bracket | # Families | Median Income |
| 2-Person Families | 281 (59.5%) | $77,279 |
| 3-Person Families | 44 (9.3%) | $0 |
| 4-Person Families | 33 (7.0%) | $0 |
| 5-Person Families | 106 (22.5%) | $56,842 |
| 6-Person Families | 8 (1.7%) | $0 |
| 7+ Person Families | 0 (0.0%) | $0 |
| Total | 472 (100.0%) | $69,828 |
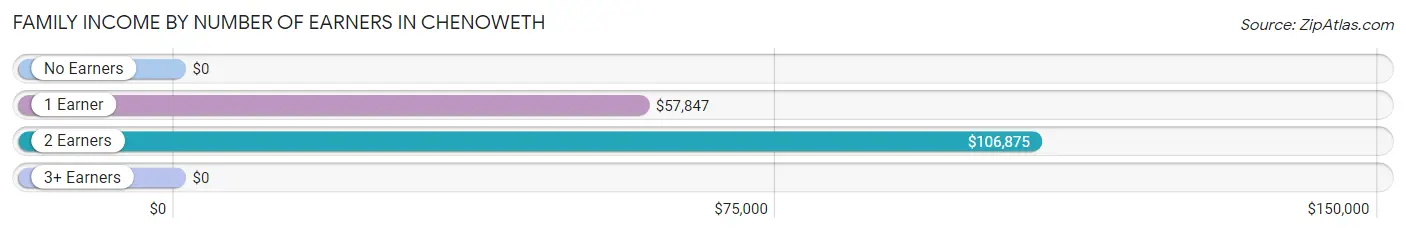
Family Income by Number of Earners in Chenoweth
| Number of Earners | # Families | Median Income |
| No Earners | 126 (26.7%) | $0 |
| 1 Earner | 59 (12.5%) | $57,847 |
| 2 Earners | 257 (54.4%) | $106,875 |
| 3+ Earners | 30 (6.4%) | $0 |
| Total | 472 (100.0%) | $69,828 |
Household Income in Chenoweth
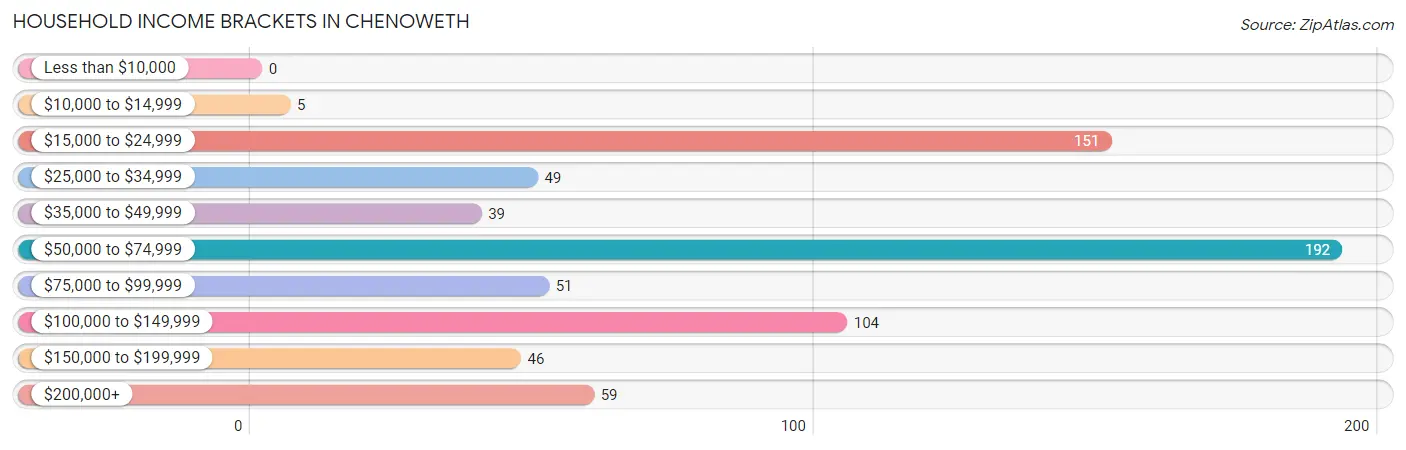
Household Income Brackets in Chenoweth
With 192 households falling in the category, the $50,000 to $74,999 income range is the most frequent in Chenoweth, accounting for 27.6% of all households.
| Income Bracket | # Households | % Households |
| Less than $10,000 | 0 | 0.0% |
| $10,000 to $14,999 | 5 | 0.7% |
| $15,000 to $24,999 | 151 | 21.7% |
| $25,000 to $34,999 | 49 | 7.0% |
| $35,000 to $49,999 | 39 | 5.6% |
| $50,000 to $74,999 | 192 | 27.6% |
| $75,000 to $99,999 | 51 | 7.3% |
| $100,000 to $149,999 | 104 | 14.9% |
| $150,000 to $199,999 | 46 | 6.6% |
| $200,000+ | 59 | 8.5% |
Household Income by Householder Age in Chenoweth
The median household income in Chenoweth is $59,148, with the highest median household income of $103,036 found in the 45 to 64 years age bracket for the primary householder. A total of 265 households (38.1%) fall into this category.
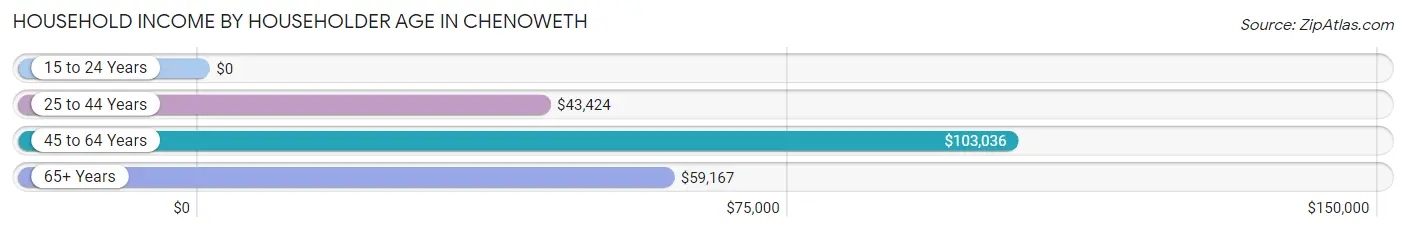
| Income Bracket | # Households | Median Income |
| 15 to 24 Years | 0 (0.0%) | $0 |
| 25 to 44 Years | 303 (43.5%) | $43,424 |
| 45 to 64 Years | 265 (38.1%) | $103,036 |
| 65+ Years | 128 (18.4%) | $59,167 |
| Total | 696 (100.0%) | $59,148 |
Poverty in Chenoweth
Income Below Poverty by Sex and Age in Chenoweth
With 13.5% poverty level for males and 17.7% for females among the residents of Chenoweth, under 5 year old males and under 5 year old females are the most vulnerable to poverty, with 12 males (60.0%) and 38 females (100.0%) in their respective age groups living below the poverty level.
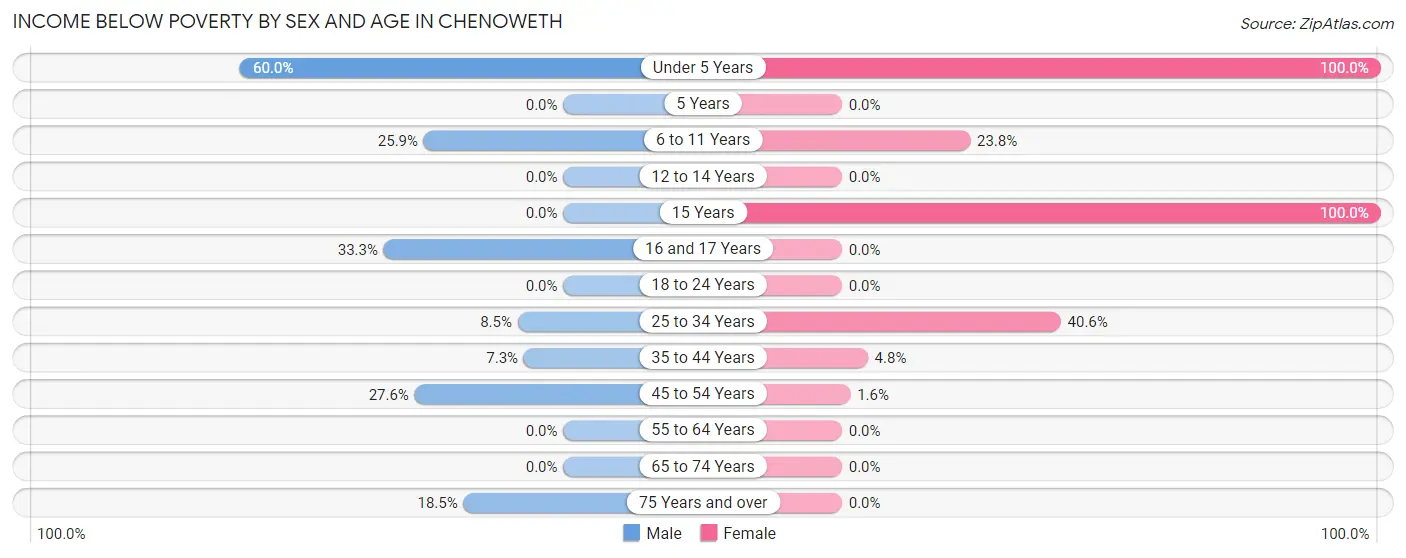
| Age Bracket | Male | Female |
| Under 5 Years | 12 (60.0%) | 38 (100.0%) |
| 5 Years | 0 (0.0%) | 0 (0.0%) |
| 6 to 11 Years | 51 (25.9%) | 15 (23.8%) |
| 12 to 14 Years | 0 (0.0%) | 0 (0.0%) |
| 15 Years | 0 (0.0%) | 7 (100.0%) |
| 16 and 17 Years | 10 (33.3%) | 0 (0.0%) |
| 18 to 24 Years | 0 (0.0%) | 0 (0.0%) |
| 25 to 34 Years | 12 (8.5%) | 65 (40.6%) |
| 35 to 44 Years | 9 (7.3%) | 6 (4.8%) |
| 45 to 54 Years | 32 (27.6%) | 1 (1.6%) |
| 55 to 64 Years | 0 (0.0%) | 0 (0.0%) |
| 65 to 74 Years | 0 (0.0%) | 0 (0.0%) |
| 75 Years and over | 5 (18.5%) | 0 (0.0%) |
| Total | 131 (13.5%) | 132 (17.7%) |
Income Above Poverty by Sex and Age in Chenoweth
According to the poverty statistics in Chenoweth, males aged 12 to 14 years and females aged 16 and 17 years are the age groups that are most secure financially, with 100.0% of males and 100.0% of females in these age groups living above the poverty line.
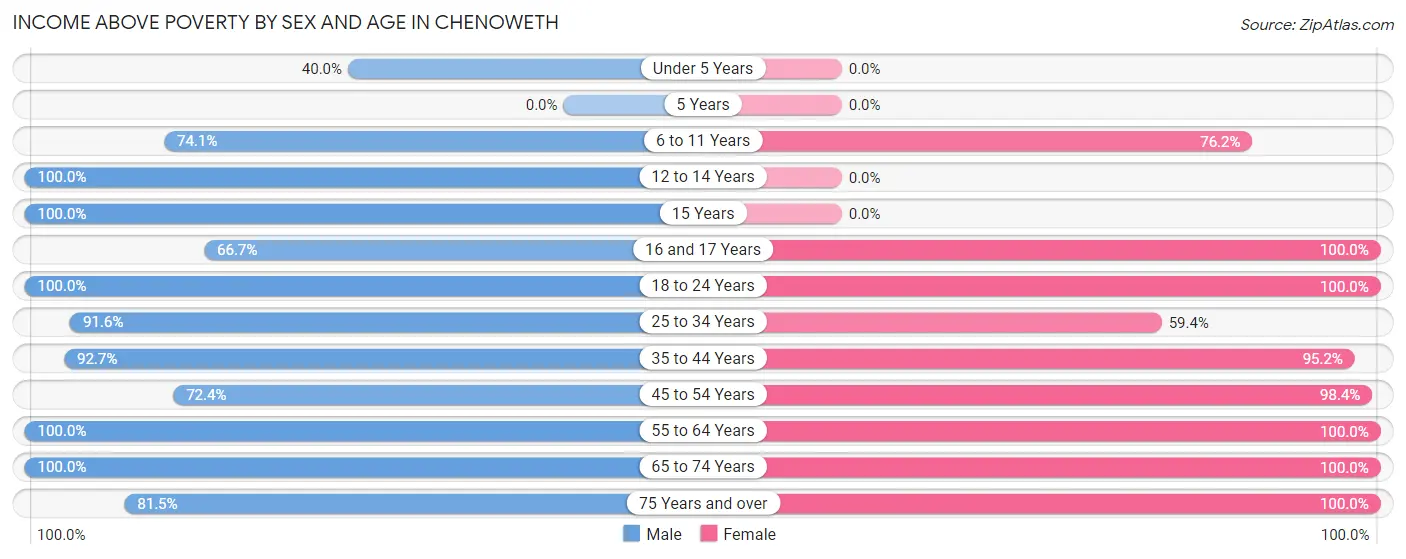
| Age Bracket | Male | Female |
| Under 5 Years | 8 (40.0%) | 0 (0.0%) |
| 5 Years | 0 (0.0%) | 0 (0.0%) |
| 6 to 11 Years | 146 (74.1%) | 48 (76.2%) |
| 12 to 14 Years | 68 (100.0%) | 0 (0.0%) |
| 15 Years | 17 (100.0%) | 0 (0.0%) |
| 16 and 17 Years | 20 (66.7%) | 15 (100.0%) |
| 18 to 24 Years | 40 (100.0%) | 36 (100.0%) |
| 25 to 34 Years | 130 (91.5%) | 95 (59.4%) |
| 35 to 44 Years | 114 (92.7%) | 119 (95.2%) |
| 45 to 54 Years | 84 (72.4%) | 63 (98.4%) |
| 55 to 64 Years | 116 (100.0%) | 134 (100.0%) |
| 65 to 74 Years | 74 (100.0%) | 63 (100.0%) |
| 75 Years and over | 22 (81.5%) | 42 (100.0%) |
| Total | 839 (86.5%) | 615 (82.3%) |
Income Below Poverty Among Married-Couple Families in Chenoweth
The poverty statistics for married-couple families in Chenoweth show that 4.6% or 17 of the total 367 families live below the poverty line. Families with 3 or 4 children have the highest poverty rate of 19.3%, comprising of 17 families. On the other hand, families with no children have the lowest poverty rate of 0.0%, which includes 0 families.
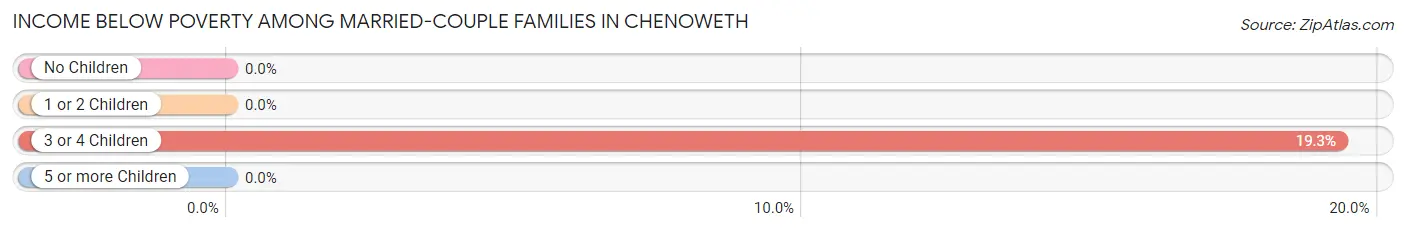
| Children | Above Poverty | Below Poverty |
| No Children | 213 (100.0%) | 0 (0.0%) |
| 1 or 2 Children | 66 (100.0%) | 0 (0.0%) |
| 3 or 4 Children | 71 (80.7%) | 17 (19.3%) |
| 5 or more Children | 0 (0.0%) | 0 (0.0%) |
| Total | 350 (95.4%) | 17 (4.6%) |
Income Below Poverty Among Single-Parent Households in Chenoweth
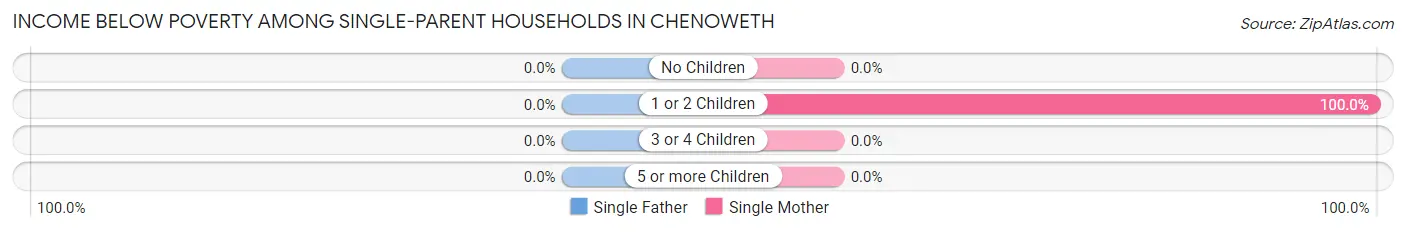
| Children | Single Father | Single Mother |
| No Children | 0 (0.0%) | 0 (0.0%) |
| 1 or 2 Children | 0 (0.0%) | 45 (100.0%) |
| 3 or 4 Children | 0 (0.0%) | 0 (0.0%) |
| 5 or more Children | 0 (0.0%) | 0 (0.0%) |
| Total | 0 (0.0%) | 45 (46.9%) |
Income Below Poverty Among Married-Couple vs Single-Parent Households in Chenoweth
The poverty data for Chenoweth shows that 17 of the married-couple family households (4.6%) and 45 of the single-parent households (42.9%) are living below the poverty level. Within the married-couple family households, those with 3 or 4 children have the highest poverty rate, with 17 households (19.3%) falling below the poverty line. Among the single-parent households, those with 1 or 2 children have the highest poverty rate, with 45 household (83.3%) living below poverty.
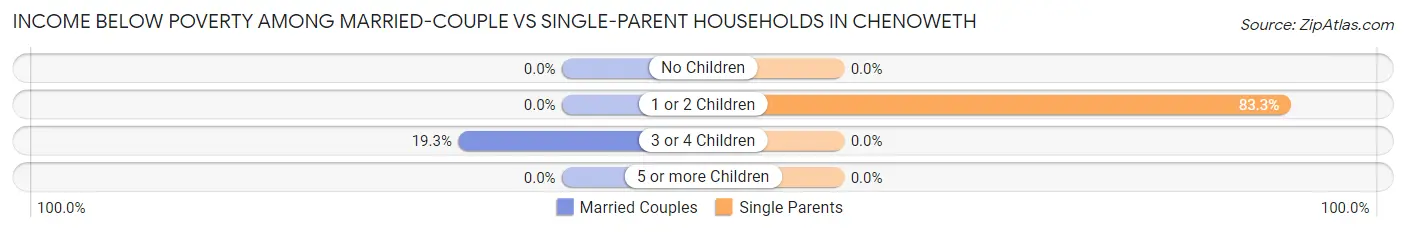
| Children | Married-Couple Families | Single-Parent Households |
| No Children | 0 (0.0%) | 0 (0.0%) |
| 1 or 2 Children | 0 (0.0%) | 45 (83.3%) |
| 3 or 4 Children | 17 (19.3%) | 0 (0.0%) |
| 5 or more Children | 0 (0.0%) | 0 (0.0%) |
| Total | 17 (4.6%) | 45 (42.9%) |
Race in Chenoweth
The most populous races in Chenoweth are White / Caucasian (1,197 | 69.7%), Hispanic or Latino (589 | 34.3%), and Two or more Races (453 | 26.4%).
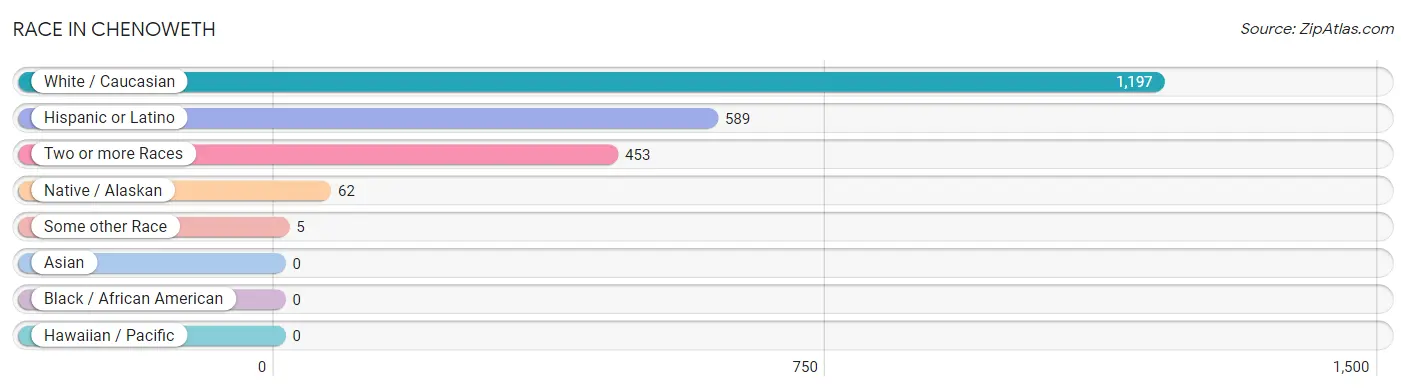
| Race | # Population | % Population |
| Asian | 0 | 0.0% |
| Black / African American | 0 | 0.0% |
| Hawaiian / Pacific | 0 | 0.0% |
| Hispanic or Latino | 589 | 34.3% |
| Native / Alaskan | 62 | 3.6% |
| White / Caucasian | 1,197 | 69.7% |
| Two or more Races | 453 | 26.4% |
| Some other Race | 5 | 0.3% |
| Total | 1,717 | 100.0% |
Ancestry in Chenoweth
The most populous ancestries reported in Chenoweth are Mexican (589 | 34.3%), German (189 | 11.0%), English (186 | 10.8%), Irish (91 | 5.3%), and Finnish (84 | 4.9%), together accounting for 66.3% of all Chenoweth residents.
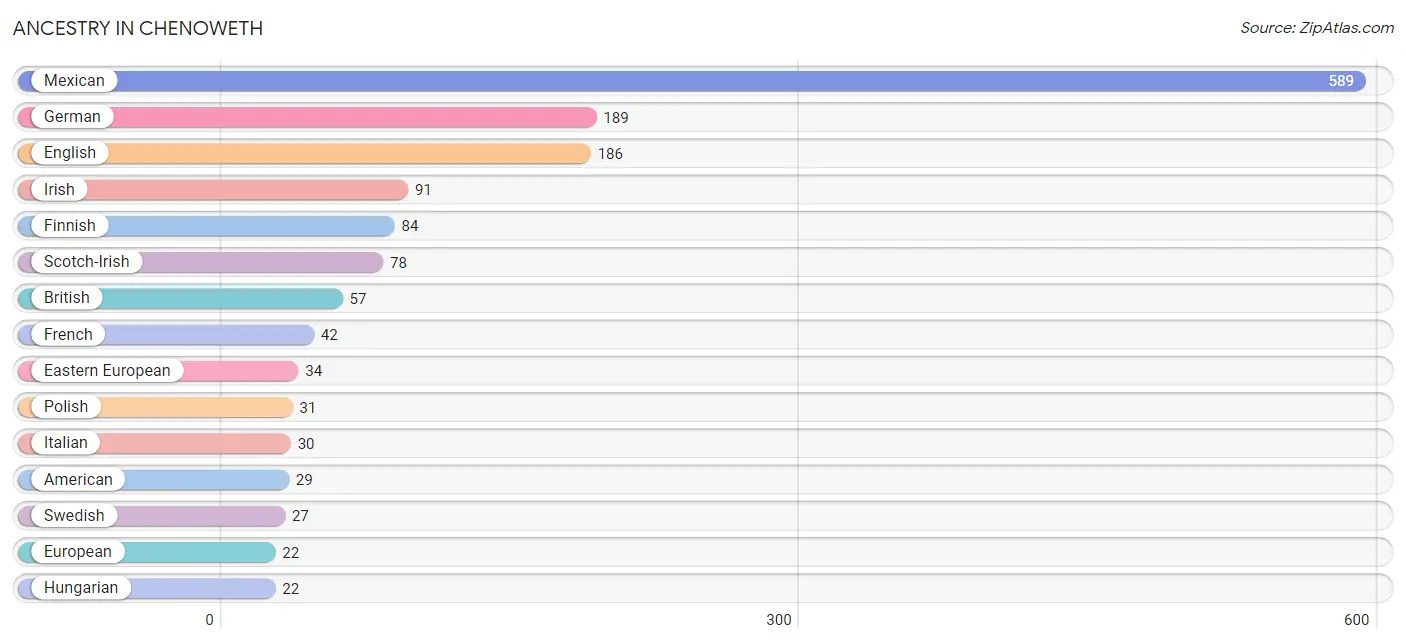
| Ancestry | # Population | % Population |
| American | 29 | 1.7% |
| Arab | 9 | 0.5% |
| British | 57 | 3.3% |
| Chinese | 9 | 0.5% |
| Czechoslovakian | 9 | 0.5% |
| Danish | 8 | 0.5% |
| Dutch | 7 | 0.4% |
| Eastern European | 34 | 2.0% |
| English | 186 | 10.8% |
| European | 22 | 1.3% |
| Finnish | 84 | 4.9% |
| French | 42 | 2.5% |
| French Canadian | 17 | 1.0% |
| German | 189 | 11.0% |
| Hungarian | 22 | 1.3% |
| Irish | 91 | 5.3% |
| Italian | 30 | 1.8% |
| Lebanese | 9 | 0.5% |
| Mexican | 589 | 34.3% |
| Norwegian | 16 | 0.9% |
| Polish | 31 | 1.8% |
| Scandinavian | 11 | 0.6% |
| Scotch-Irish | 78 | 4.5% |
| Scottish | 18 | 1.1% |
| Swedish | 27 | 1.6% |
| Swiss | 14 | 0.8% |
| Welsh | 5 | 0.3% | View All 27 Rows |
Immigrants in Chenoweth
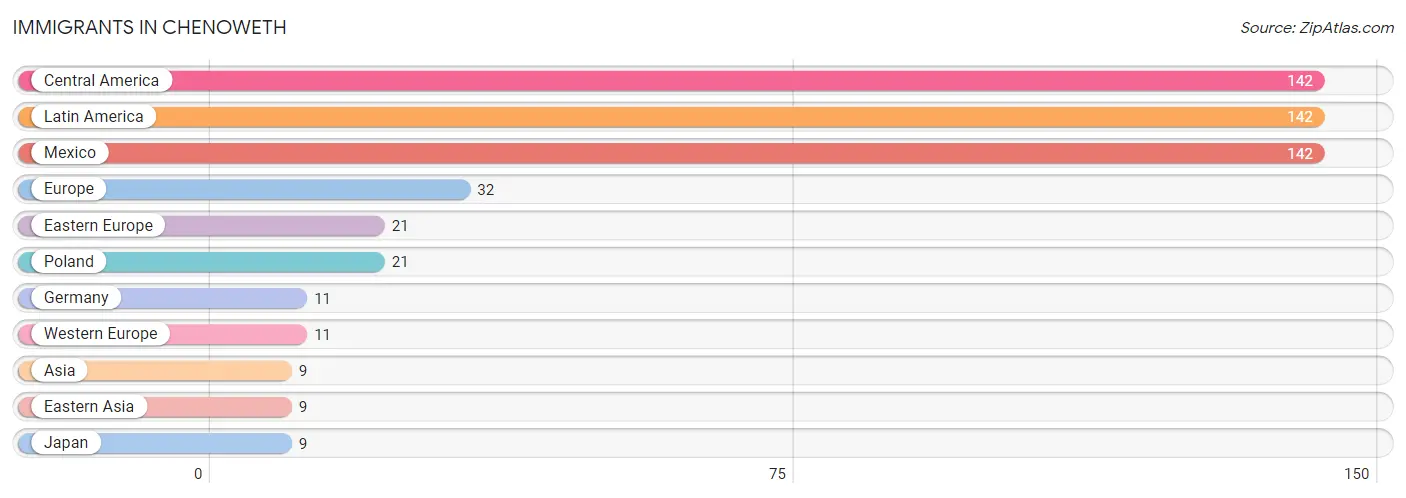
The most numerous immigrant groups reported in Chenoweth came from Central America (142 | 8.3%), Latin America (142 | 8.3%), Mexico (142 | 8.3%), Europe (32 | 1.9%), and Eastern Europe (21 | 1.2%), together accounting for 27.9% of all Chenoweth residents.
| Immigration Origin | # Population | % Population |
| Asia | 9 | 0.5% |
| Central America | 142 | 8.3% |
| Eastern Asia | 9 | 0.5% |
| Eastern Europe | 21 | 1.2% |
| Europe | 32 | 1.9% |
| Germany | 11 | 0.6% |
| Japan | 9 | 0.5% |
| Latin America | 142 | 8.3% |
| Mexico | 142 | 8.3% |
| Poland | 21 | 1.2% |
| Western Europe | 11 | 0.6% | View All 11 Rows |
Sex and Age in Chenoweth
Sex and Age in Chenoweth
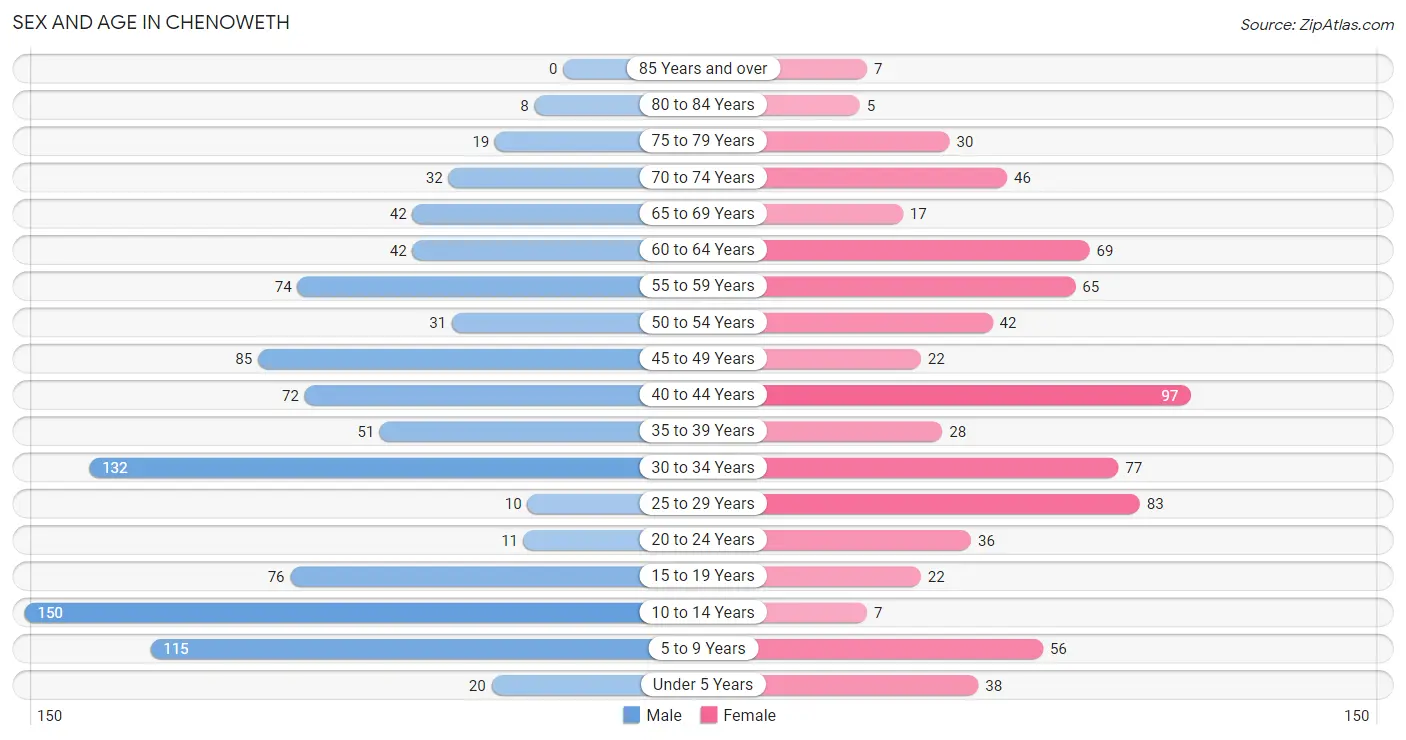
The most populous age groups in Chenoweth are 10 to 14 Years (150 | 15.5%) for men and 40 to 44 Years (97 | 13.0%) for women.
| Age Bracket | Male | Female |
| Under 5 Years | 20 (2.1%) | 38 (5.1%) |
| 5 to 9 Years | 115 (11.9%) | 56 (7.5%) |
| 10 to 14 Years | 150 (15.5%) | 7 (0.9%) |
| 15 to 19 Years | 76 (7.8%) | 22 (2.9%) |
| 20 to 24 Years | 11 (1.1%) | 36 (4.8%) |
| 25 to 29 Years | 10 (1.0%) | 83 (11.1%) |
| 30 to 34 Years | 132 (13.6%) | 77 (10.3%) |
| 35 to 39 Years | 51 (5.3%) | 28 (3.7%) |
| 40 to 44 Years | 72 (7.4%) | 97 (13.0%) |
| 45 to 49 Years | 85 (8.8%) | 22 (2.9%) |
| 50 to 54 Years | 31 (3.2%) | 42 (5.6%) |
| 55 to 59 Years | 74 (7.6%) | 65 (8.7%) |
| 60 to 64 Years | 42 (4.3%) | 69 (9.2%) |
| 65 to 69 Years | 42 (4.3%) | 17 (2.3%) |
| 70 to 74 Years | 32 (3.3%) | 46 (6.2%) |
| 75 to 79 Years | 19 (2.0%) | 30 (4.0%) |
| 80 to 84 Years | 8 (0.8%) | 5 (0.7%) |
| 85 Years and over | 0 (0.0%) | 7 (0.9%) |
| Total | 970 (100.0%) | 747 (100.0%) |
Families and Households in Chenoweth
Median Family Size in Chenoweth
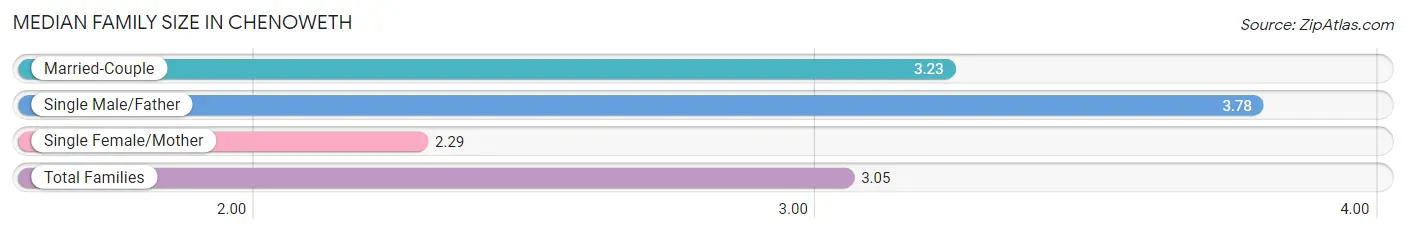
The median family size in Chenoweth is 3.05 persons per family, with single male/father families (9 | 1.9%) accounting for the largest median family size of 3.78 persons per family. On the other hand, single female/mother families (96 | 20.3%) represent the smallest median family size with 2.29 persons per family.
| Family Type | # Families | Family Size |
| Married-Couple | 367 (77.7%) | 3.23 |
| Single Male/Father | 9 (1.9%) | 3.78 |
| Single Female/Mother | 96 (20.3%) | 2.29 |
| Total Families | 472 (100.0%) | 3.05 |
Median Household Size in Chenoweth
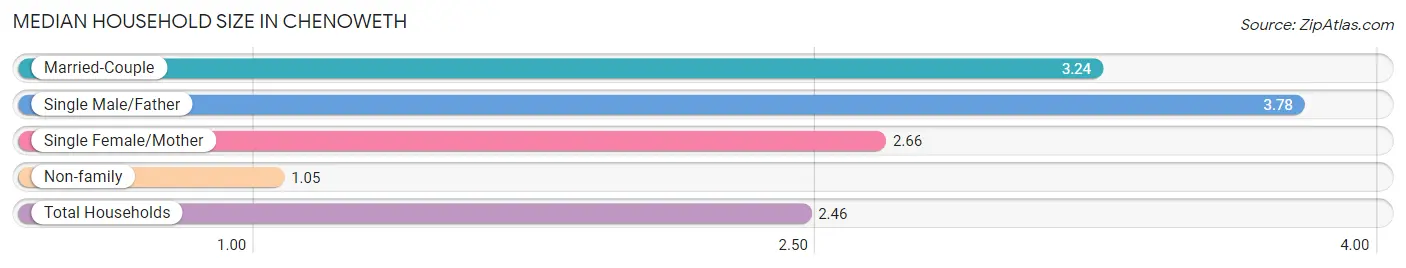
The median household size in Chenoweth is 2.46 persons per household, with single male/father households (9 | 1.3%) accounting for the largest median household size of 3.78 persons per household. non-family households (224 | 32.2%) represent the smallest median household size with 1.05 persons per household.
| Household Type | # Households | Household Size |
| Married-Couple | 367 (52.7%) | 3.24 |
| Single Male/Father | 9 (1.3%) | 3.78 |
| Single Female/Mother | 96 (13.8%) | 2.66 |
| Non-family | 224 (32.2%) | 1.05 |
| Total Households | 696 (100.0%) | 2.46 |
Household Size by Marriage Status in Chenoweth
Out of a total of 696 households in Chenoweth, 472 (67.8%) are family households, while 224 (32.2%) are nonfamily households. The most numerous type of family households are 2-person households, comprising 231, and the most common type of nonfamily households are 1-person households, comprising 215.
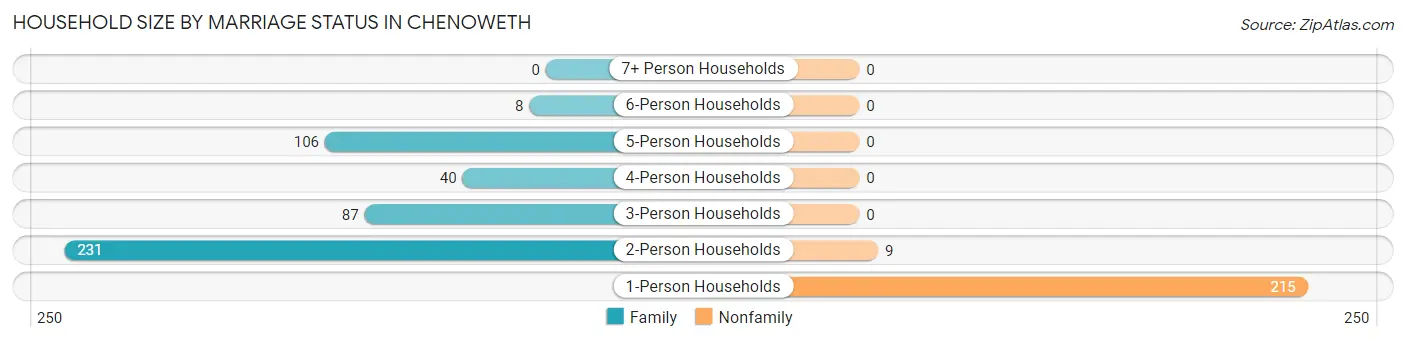
| Household Size | Family Households | Nonfamily Households |
| 1-Person Households | - | 215 (30.9%) |
| 2-Person Households | 231 (33.2%) | 9 (1.3%) |
| 3-Person Households | 87 (12.5%) | 0 (0.0%) |
| 4-Person Households | 40 (5.8%) | 0 (0.0%) |
| 5-Person Households | 106 (15.2%) | 0 (0.0%) |
| 6-Person Households | 8 (1.1%) | 0 (0.0%) |
| 7+ Person Households | 0 (0.0%) | 0 (0.0%) |
| Total | 472 (67.8%) | 224 (32.2%) |
Female Fertility in Chenoweth
Fertility by Age in Chenoweth
Average fertility rate in Chenoweth is 16.0 births per 1,000 women. Women in the age bracket of 35 to 50 years have the highest fertility rate with 41.0 births per 1,000 women. Women in the age bracket of 35 to 50 years acount for 100.0% of all women with births.
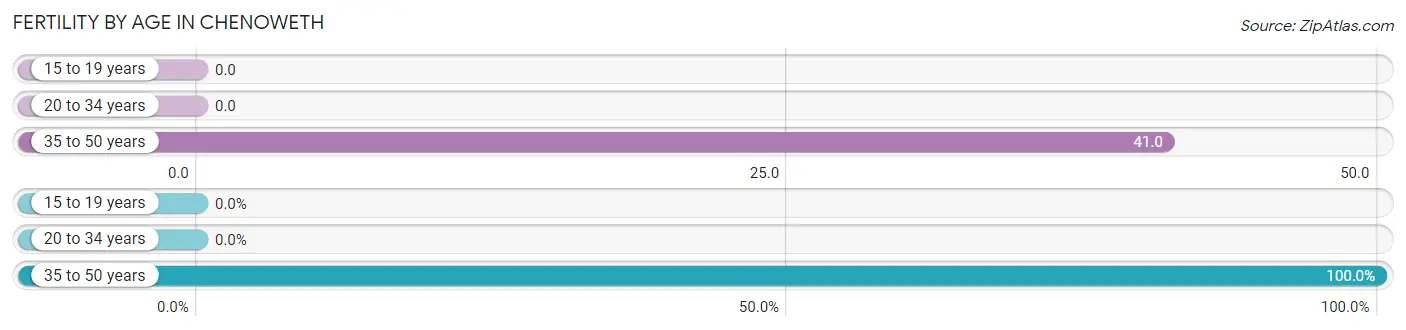
| Age Bracket | Women with Births | Births / 1,000 Women |
| 15 to 19 years | 0 (0.0%) | 0.0 |
| 20 to 34 years | 0 (0.0%) | 0.0 |
| 35 to 50 years | 6 (100.0%) | 41.0 |
| Total | 6 (100.0%) | 16.0 |
Fertility by Age by Marriage Status in Chenoweth
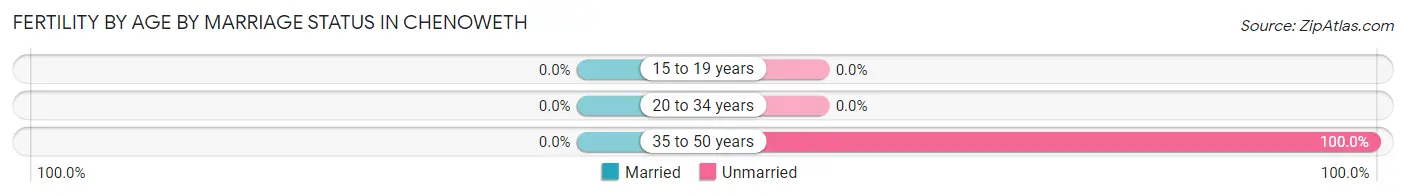
| Age Bracket | Married | Unmarried |
| 15 to 19 years | 0 (0.0%) | 0 (0.0%) |
| 20 to 34 years | 0 (0.0%) | 0 (0.0%) |
| 35 to 50 years | 0 (0.0%) | 6 (100.0%) |
| Total | 0 (0.0%) | 6 (100.0%) |
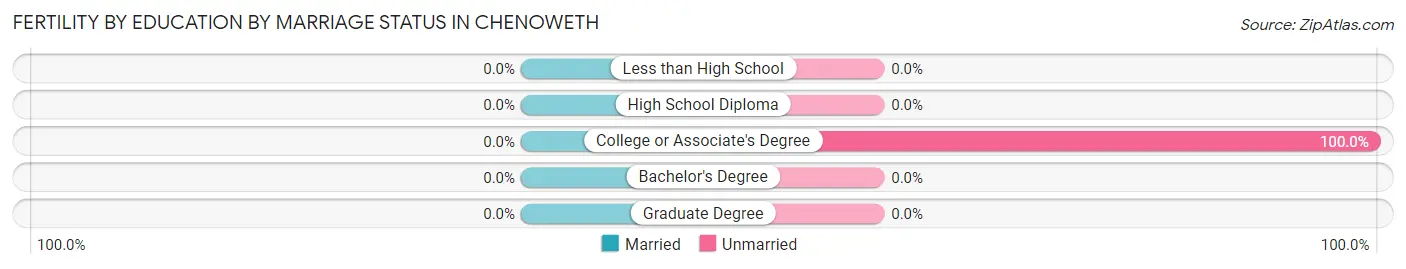
Fertility by Education in Chenoweth
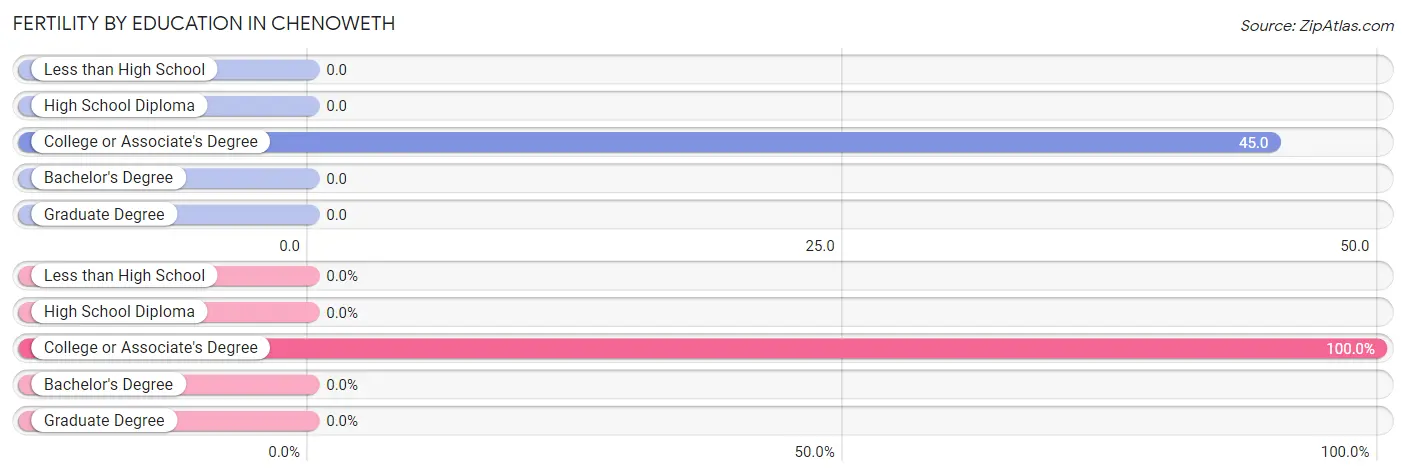
| Educational Attainment | Women with Births | Births / 1,000 Women |
| Less than High School | 0 (0.0%) | 0.0 |
| High School Diploma | 0 (0.0%) | 0.0 |
| College or Associate's Degree | 6 (100.0%) | 45.0 |
| Bachelor's Degree | 0 (0.0%) | 0.0 |
| Graduate Degree | 0 (0.0%) | 0.0 |
| Total | 6 (100.0%) | 16.0 |
Fertility by Education by Marriage Status in Chenoweth
| Educational Attainment | Married | Unmarried |
| Less than High School | 0 (0.0%) | 0 (0.0%) |
| High School Diploma | 0 (0.0%) | 0 (0.0%) |
| College or Associate's Degree | 0 (0.0%) | 6 (100.0%) |
| Bachelor's Degree | 0 (0.0%) | 0 (0.0%) |
| Graduate Degree | 0 (0.0%) | 0 (0.0%) |
| Total | 0 (0.0%) | 6 (100.0%) |
Employment Characteristics in Chenoweth
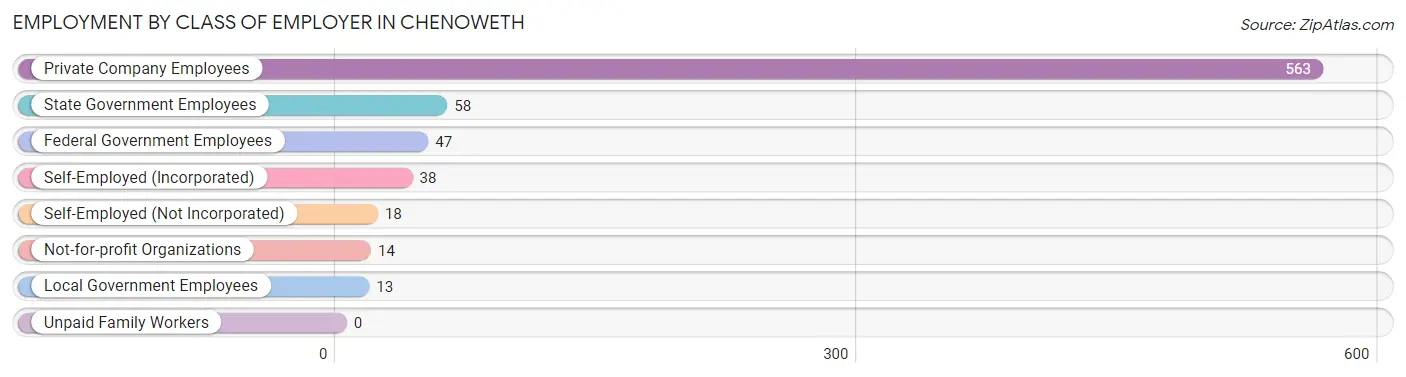
Employment by Class of Employer in Chenoweth
Among the 751 employed individuals in Chenoweth, private company employees (563 | 75.0%), state government employees (58 | 7.7%), and federal government employees (47 | 6.3%) make up the most common classes of employment.
| Employer Class | # Employees | % Employees |
| Private Company Employees | 563 | 75.0% |
| Self-Employed (Incorporated) | 38 | 5.1% |
| Self-Employed (Not Incorporated) | 18 | 2.4% |
| Not-for-profit Organizations | 14 | 1.9% |
| Local Government Employees | 13 | 1.7% |
| State Government Employees | 58 | 7.7% |
| Federal Government Employees | 47 | 6.3% |
| Unpaid Family Workers | 0 | 0.0% |
| Total | 751 | 100.0% |
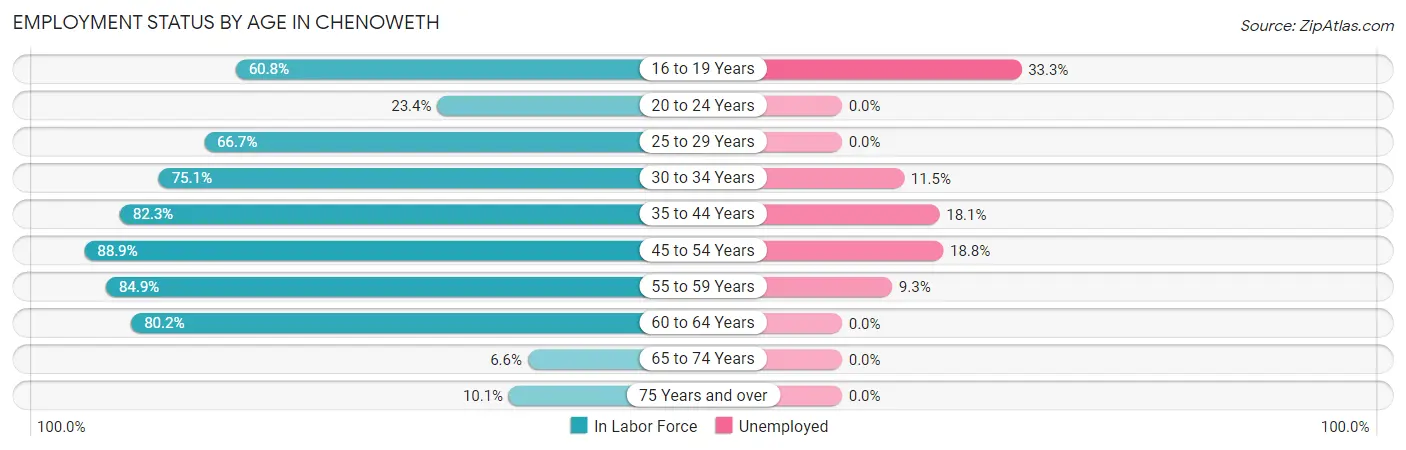
Employment Status by Age in Chenoweth
According to the labor force statistics for Chenoweth, out of the total population over 16 years of age (1,307), 66.0% or 863 individuals are in the labor force, with 12.9% or 111 of them unemployed. The age group with the highest labor force participation rate is 45 to 54 years, with 88.9% or 160 individuals in the labor force. Within the labor force, the 16 to 19 years age range has the highest percentage of unemployed individuals, with 33.3% or 15 of them being unemployed.
| Age Bracket | In Labor Force | Unemployed |
| 16 to 19 Years | 45 (60.8%) | 15 (33.3%) |
| 20 to 24 Years | 11 (23.4%) | 0 (0.0%) |
| 25 to 29 Years | 62 (66.7%) | 0 (0.0%) |
| 30 to 34 Years | 157 (75.1%) | 18 (11.5%) |
| 35 to 44 Years | 204 (82.3%) | 37 (18.1%) |
| 45 to 54 Years | 160 (88.9%) | 30 (18.8%) |
| 55 to 59 Years | 118 (84.9%) | 11 (9.3%) |
| 60 to 64 Years | 89 (80.2%) | 0 (0.0%) |
| 65 to 74 Years | 9 (6.6%) | 0 (0.0%) |
| 75 Years and over | 7 (10.1%) | 0 (0.0%) |
| Total | 863 (66.0%) | 111 (12.9%) |
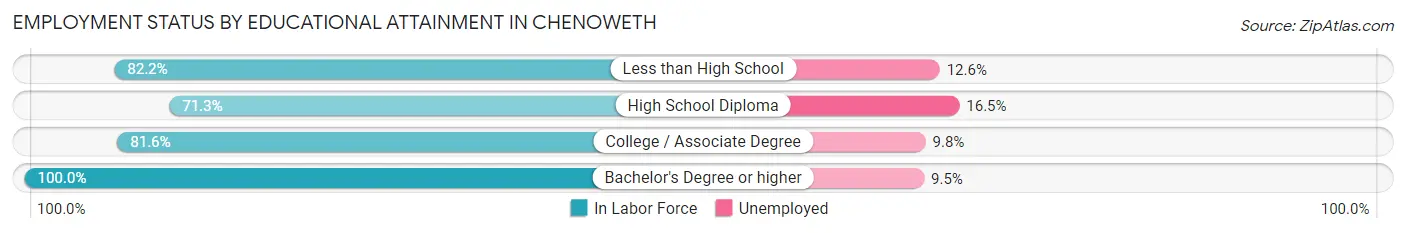
Employment Status by Educational Attainment in Chenoweth
According to labor force statistics for Chenoweth, 80.6% of individuals (790) out of the total population between 25 and 64 years of age (980) are in the labor force, with 12.2% or 96 of them being unemployed. The group with the highest labor force participation rate are those with the educational attainment of bachelor's degree or higher, with 100.0% or 116 individuals in the labor force. Within the labor force, individuals with high school diploma education have the highest percentage of unemployment, with 16.5% or 37 of them being unemployed.
| Educational Attainment | In Labor Force | Unemployed |
| Less than High School | 143 (82.2%) | 22 (12.6%) |
| High School Diploma | 224 (71.3%) | 52 (16.5%) |
| College / Associate Degree | 307 (81.6%) | 37 (9.8%) |
| Bachelor's Degree or higher | 116 (100.0%) | 11 (9.5%) |
| Total | 790 (80.6%) | 120 (12.2%) |
Employment Occupations by Sex in Chenoweth
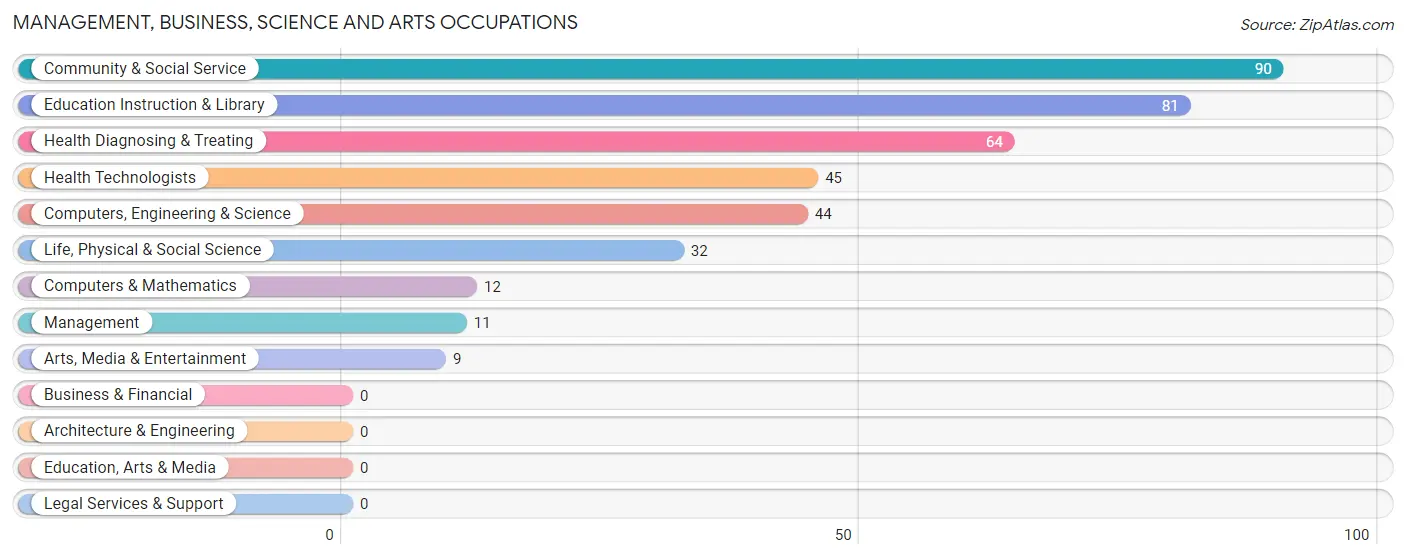
Management, Business, Science and Arts Occupations
The most common Management, Business, Science and Arts occupations in Chenoweth are Community & Social Service (90 | 12.0%), Education Instruction & Library (81 | 10.8%), Health Diagnosing & Treating (64 | 8.5%), Health Technologists (45 | 6.0%), and Computers, Engineering & Science (44 | 5.9%).
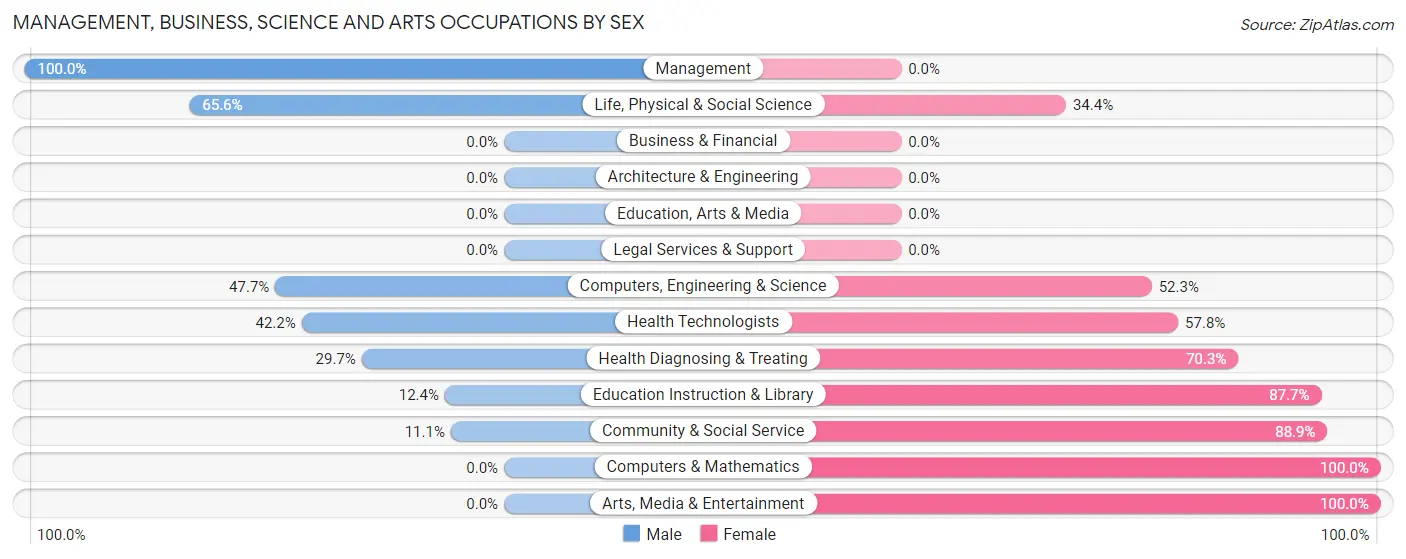
Management, Business, Science and Arts Occupations by Sex
Within the Management, Business, Science and Arts occupations in Chenoweth, the most male-oriented occupations are Management (100.0%), Life, Physical & Social Science (65.6%), and Computers, Engineering & Science (47.7%), while the most female-oriented occupations are Computers & Mathematics (100.0%), Arts, Media & Entertainment (100.0%), and Community & Social Service (88.9%).
| Occupation | Male | Female |
| Management | 11 (100.0%) | 0 (0.0%) |
| Business & Financial | 0 (0.0%) | 0 (0.0%) |
| Computers, Engineering & Science | 21 (47.7%) | 23 (52.3%) |
| Computers & Mathematics | 0 (0.0%) | 12 (100.0%) |
| Architecture & Engineering | 0 (0.0%) | 0 (0.0%) |
| Life, Physical & Social Science | 21 (65.6%) | 11 (34.4%) |
| Community & Social Service | 10 (11.1%) | 80 (88.9%) |
| Education, Arts & Media | 0 (0.0%) | 0 (0.0%) |
| Legal Services & Support | 0 (0.0%) | 0 (0.0%) |
| Education Instruction & Library | 10 (12.3%) | 71 (87.6%) |
| Arts, Media & Entertainment | 0 (0.0%) | 9 (100.0%) |
| Health Diagnosing & Treating | 19 (29.7%) | 45 (70.3%) |
| Health Technologists | 19 (42.2%) | 26 (57.8%) |
| Total (Category) | 61 (29.2%) | 148 (70.8%) |
| Total (Overall) | 437 (58.2%) | 314 (41.8%) |
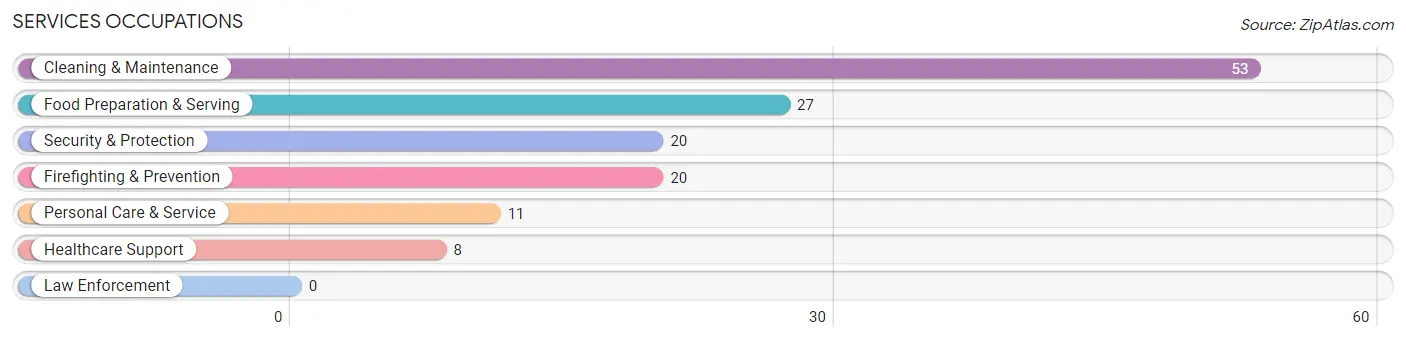
Services Occupations
The most common Services occupations in Chenoweth are Cleaning & Maintenance (53 | 7.1%), Food Preparation & Serving (27 | 3.6%), Security & Protection (20 | 2.7%), Firefighting & Prevention (20 | 2.7%), and Personal Care & Service (11 | 1.5%).
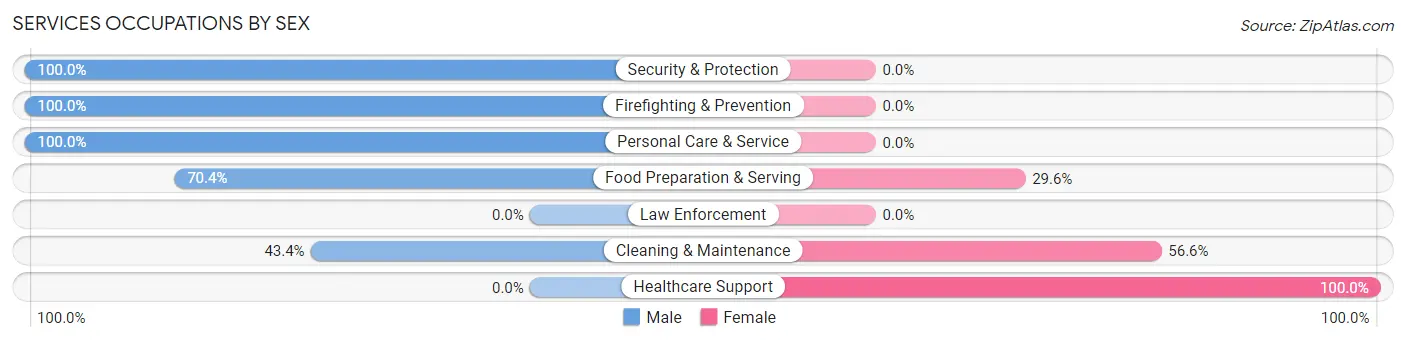
Services Occupations by Sex
Within the Services occupations in Chenoweth, the most male-oriented occupations are Security & Protection (100.0%), Firefighting & Prevention (100.0%), and Personal Care & Service (100.0%), while the most female-oriented occupations are Healthcare Support (100.0%), Cleaning & Maintenance (56.6%), and Food Preparation & Serving (29.6%).
| Occupation | Male | Female |
| Healthcare Support | 0 (0.0%) | 8 (100.0%) |
| Security & Protection | 20 (100.0%) | 0 (0.0%) |
| Firefighting & Prevention | 20 (100.0%) | 0 (0.0%) |
| Law Enforcement | 0 (0.0%) | 0 (0.0%) |
| Food Preparation & Serving | 19 (70.4%) | 8 (29.6%) |
| Cleaning & Maintenance | 23 (43.4%) | 30 (56.6%) |
| Personal Care & Service | 11 (100.0%) | 0 (0.0%) |
| Total (Category) | 73 (61.3%) | 46 (38.7%) |
| Total (Overall) | 437 (58.2%) | 314 (41.8%) |
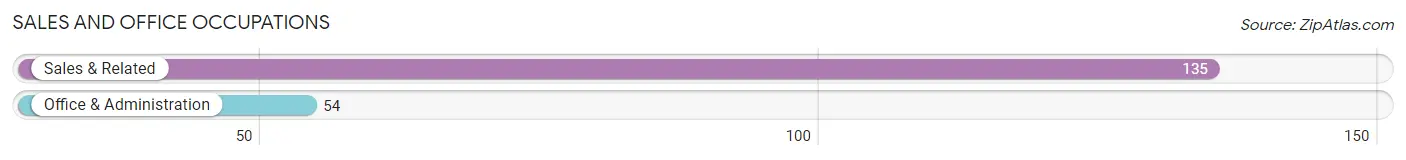
Sales and Office Occupations
The most common Sales and Office occupations in Chenoweth are Sales & Related (135 | 18.0%), and Office & Administration (54 | 7.2%).
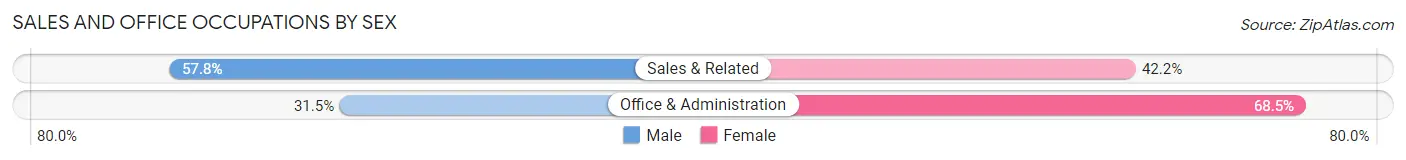
Sales and Office Occupations by Sex
| Occupation | Male | Female |
| Sales & Related | 78 (57.8%) | 57 (42.2%) |
| Office & Administration | 17 (31.5%) | 37 (68.5%) |
| Total (Category) | 95 (50.3%) | 94 (49.7%) |
| Total (Overall) | 437 (58.2%) | 314 (41.8%) |
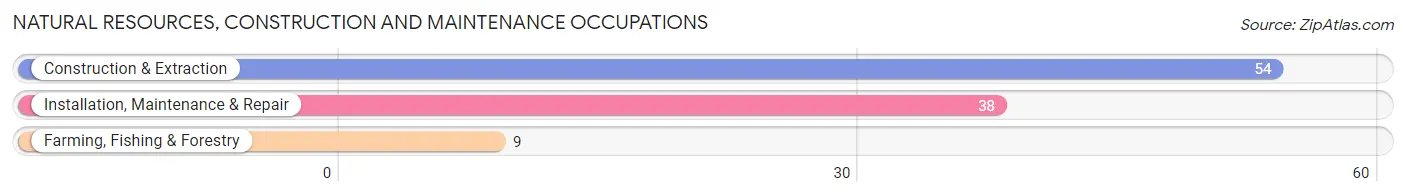
Natural Resources, Construction and Maintenance Occupations
The most common Natural Resources, Construction and Maintenance occupations in Chenoweth are Construction & Extraction (54 | 7.2%), Installation, Maintenance & Repair (38 | 5.1%), and Farming, Fishing & Forestry (9 | 1.2%).
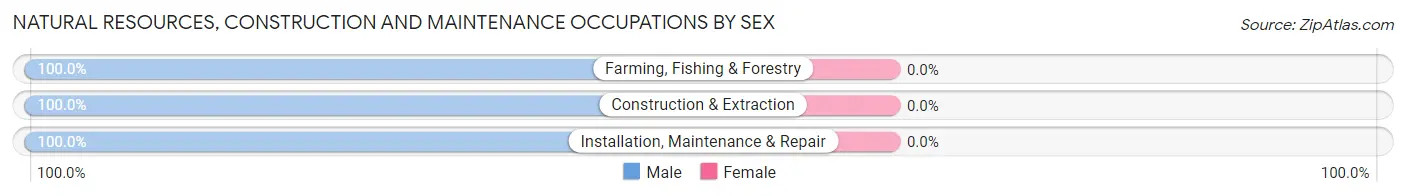
Natural Resources, Construction and Maintenance Occupations by Sex
| Occupation | Male | Female |
| Farming, Fishing & Forestry | 9 (100.0%) | 0 (0.0%) |
| Construction & Extraction | 54 (100.0%) | 0 (0.0%) |
| Installation, Maintenance & Repair | 38 (100.0%) | 0 (0.0%) |
| Total (Category) | 101 (100.0%) | 0 (0.0%) |
| Total (Overall) | 437 (58.2%) | 314 (41.8%) |
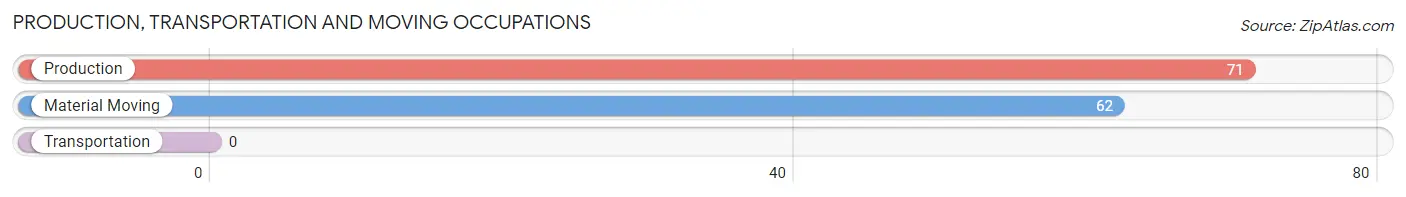
Production, Transportation and Moving Occupations
The most common Production, Transportation and Moving occupations in Chenoweth are Production (71 | 9.5%), and Material Moving (62 | 8.3%).
Production, Transportation and Moving Occupations by Sex
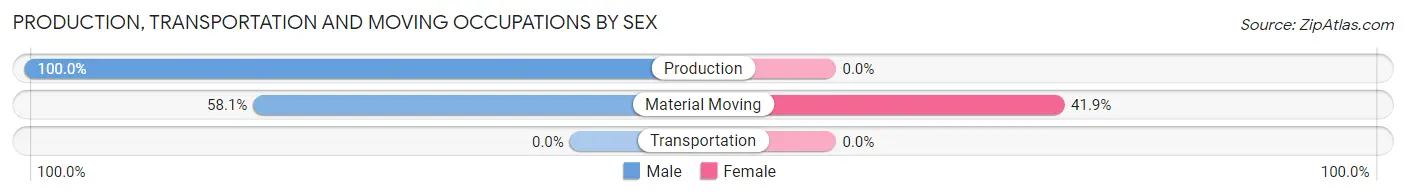
| Occupation | Male | Female |
| Production | 71 (100.0%) | 0 (0.0%) |
| Transportation | 0 (0.0%) | 0 (0.0%) |
| Material Moving | 36 (58.1%) | 26 (41.9%) |
| Total (Category) | 107 (80.4%) | 26 (19.6%) |
| Total (Overall) | 437 (58.2%) | 314 (41.8%) |
Employment Industries by Sex in Chenoweth
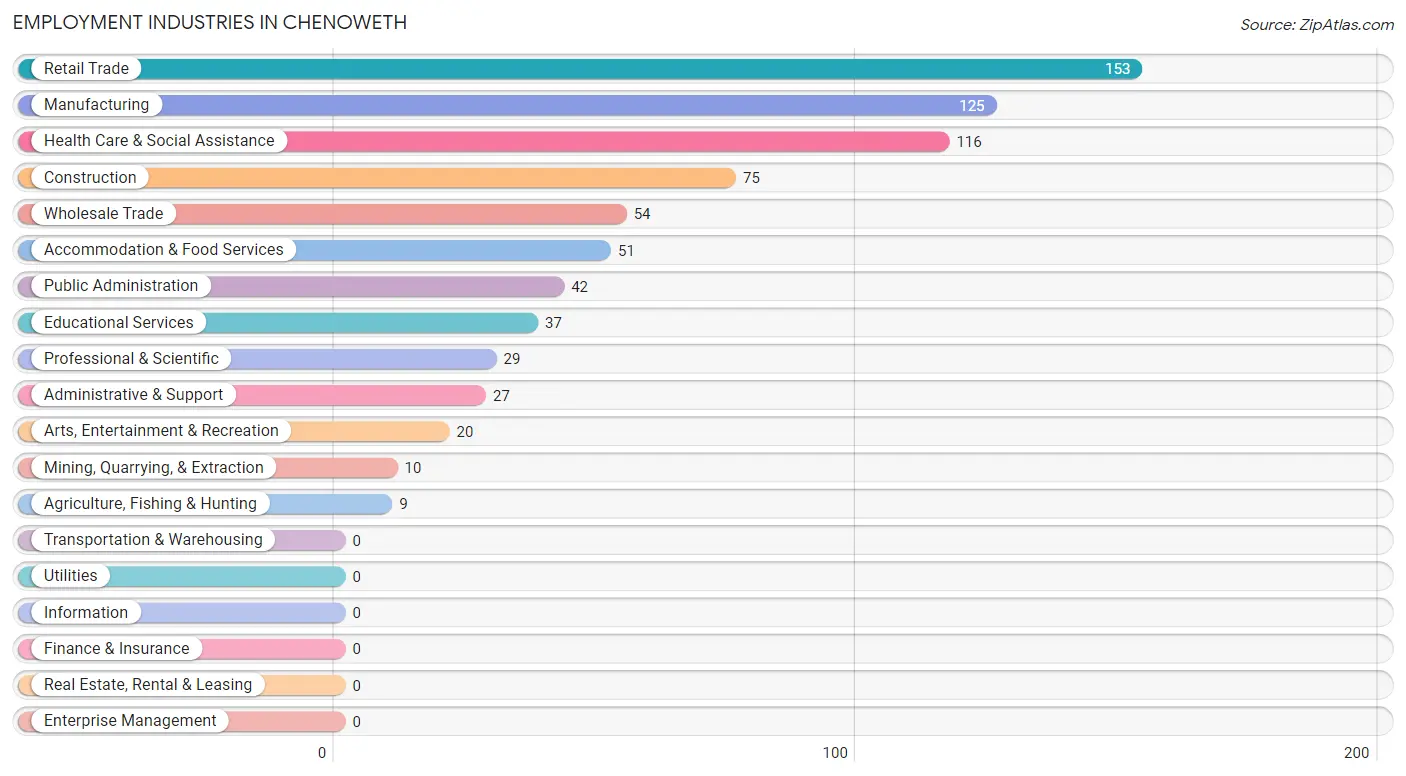
Employment Industries in Chenoweth
The major employment industries in Chenoweth include Retail Trade (153 | 20.4%), Manufacturing (125 | 16.6%), Health Care & Social Assistance (116 | 15.4%), Construction (75 | 10.0%), and Wholesale Trade (54 | 7.2%).
Employment Industries by Sex in Chenoweth
The Chenoweth industries that see more men than women are Agriculture, Fishing & Hunting (100.0%), Mining, Quarrying, & Extraction (100.0%), and Construction (100.0%), whereas the industries that tend to have a higher number of women are Professional & Scientific (100.0%), Health Care & Social Assistance (83.6%), and Educational Services (73.0%).
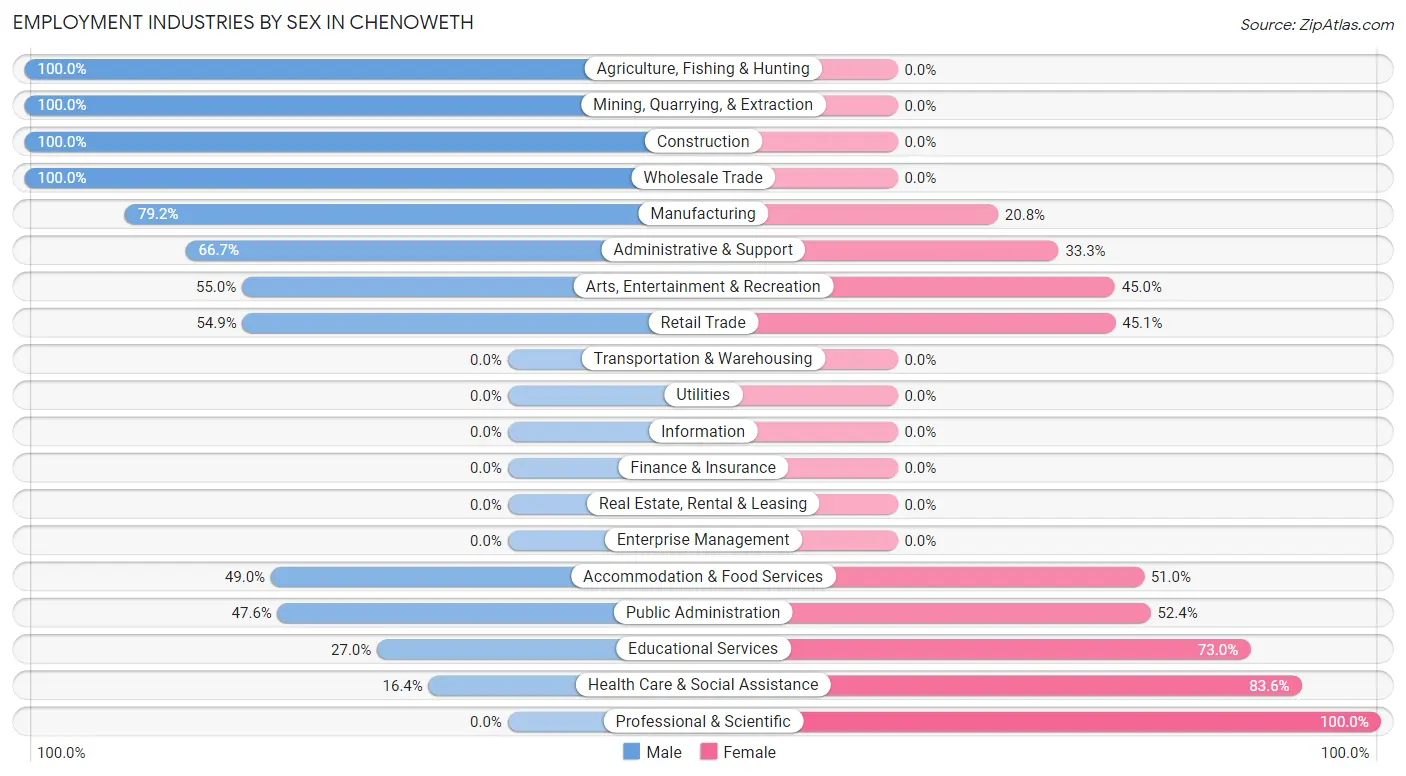
| Industry | Male | Female |
| Agriculture, Fishing & Hunting | 9 (100.0%) | 0 (0.0%) |
| Mining, Quarrying, & Extraction | 10 (100.0%) | 0 (0.0%) |
| Construction | 75 (100.0%) | 0 (0.0%) |
| Manufacturing | 99 (79.2%) | 26 (20.8%) |
| Wholesale Trade | 54 (100.0%) | 0 (0.0%) |
| Retail Trade | 84 (54.9%) | 69 (45.1%) |
| Transportation & Warehousing | 0 (0.0%) | 0 (0.0%) |
| Utilities | 0 (0.0%) | 0 (0.0%) |
| Information | 0 (0.0%) | 0 (0.0%) |
| Finance & Insurance | 0 (0.0%) | 0 (0.0%) |
| Real Estate, Rental & Leasing | 0 (0.0%) | 0 (0.0%) |
| Professional & Scientific | 0 (0.0%) | 29 (100.0%) |
| Enterprise Management | 0 (0.0%) | 0 (0.0%) |
| Administrative & Support | 18 (66.7%) | 9 (33.3%) |
| Educational Services | 10 (27.0%) | 27 (73.0%) |
| Health Care & Social Assistance | 19 (16.4%) | 97 (83.6%) |
| Arts, Entertainment & Recreation | 11 (55.0%) | 9 (45.0%) |
| Accommodation & Food Services | 25 (49.0%) | 26 (51.0%) |
| Public Administration | 20 (47.6%) | 22 (52.4%) |
| Total | 437 (58.2%) | 314 (41.8%) |
Education in Chenoweth
School Enrollment in Chenoweth
The most common levels of schooling among the 462 students in Chenoweth are elementary school (179 | 38.7%), middle school (128 | 27.7%), and high school (98 | 21.2%).
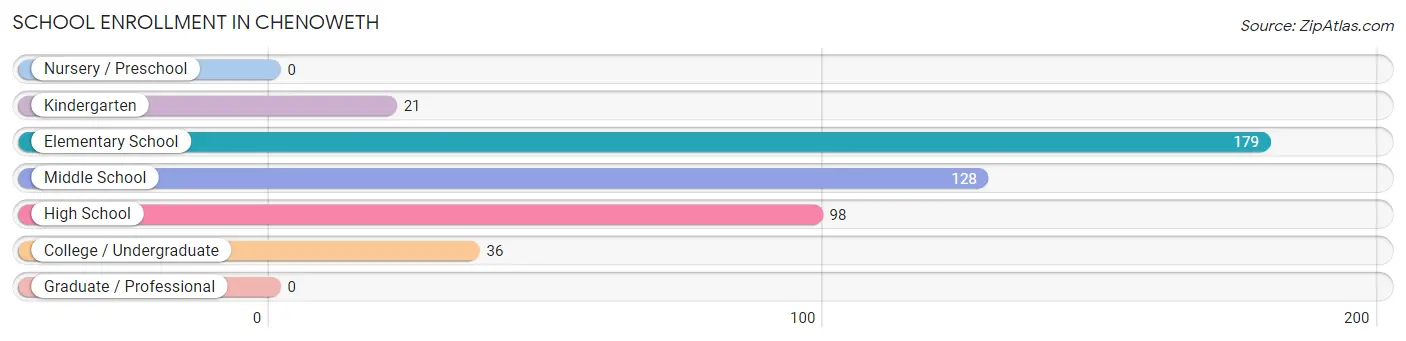
| School Level | # Students | % Students |
| Nursery / Preschool | 0 | 0.0% |
| Kindergarten | 21 | 4.5% |
| Elementary School | 179 | 38.7% |
| Middle School | 128 | 27.7% |
| High School | 98 | 21.2% |
| College / Undergraduate | 36 | 7.8% |
| Graduate / Professional | 0 | 0.0% |
| Total | 462 | 100.0% |
School Enrollment by Age by Funding Source in Chenoweth
Out of a total of 462 students who are enrolled in schools in Chenoweth, 40 (8.7%) attend a private institution, while the remaining 422 (91.3%) are enrolled in public schools. The age group of 5 to 9 year old has the highest likelihood of being enrolled in private schools, with 31 (18.1% in the age bracket) enrolled. Conversely, the age group of 15 to 17 year olds has the lowest likelihood of being enrolled in a private school, with 69 (100.0% in the age bracket) attending a public institution.
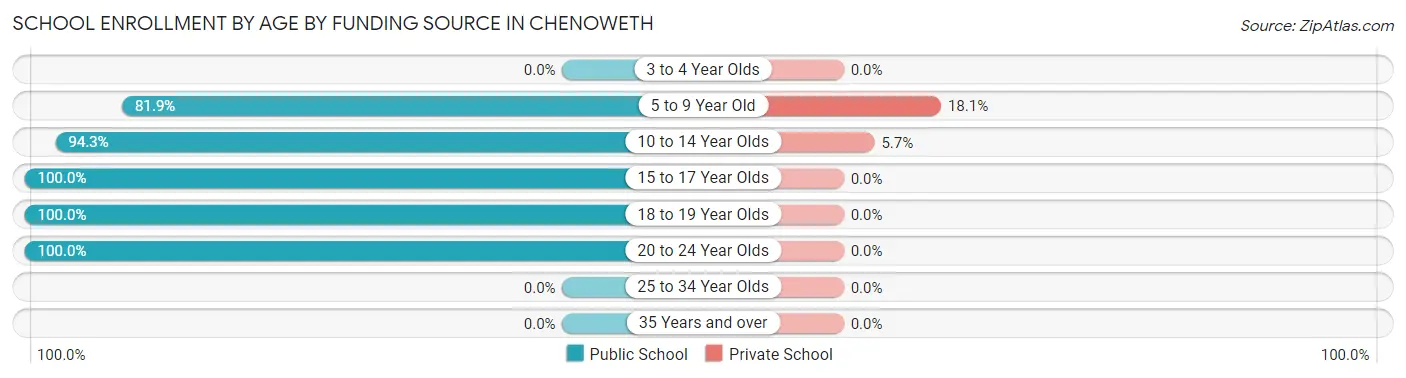
| Age Bracket | Public School | Private School |
| 3 to 4 Year Olds | 0 (0.0%) | 0 (0.0%) |
| 5 to 9 Year Old | 140 (81.9%) | 31 (18.1%) |
| 10 to 14 Year Olds | 148 (94.3%) | 9 (5.7%) |
| 15 to 17 Year Olds | 69 (100.0%) | 0 (0.0%) |
| 18 to 19 Year Olds | 29 (100.0%) | 0 (0.0%) |
| 20 to 24 Year Olds | 36 (100.0%) | 0 (0.0%) |
| 25 to 34 Year Olds | 0 (0.0%) | 0 (0.0%) |
| 35 Years and over | 0 (0.0%) | 0 (0.0%) |
| Total | 422 (91.3%) | 40 (8.7%) |
Educational Attainment by Field of Study in Chenoweth
Education (84 | 40.4%), bio, nature & agricultural (48 | 23.1%), science & technology (29 | 13.9%), social sciences (19 | 9.1%), and literature & languages (16 | 7.7%) are the most common fields of study among 208 individuals in Chenoweth who have obtained a bachelor's degree or higher.
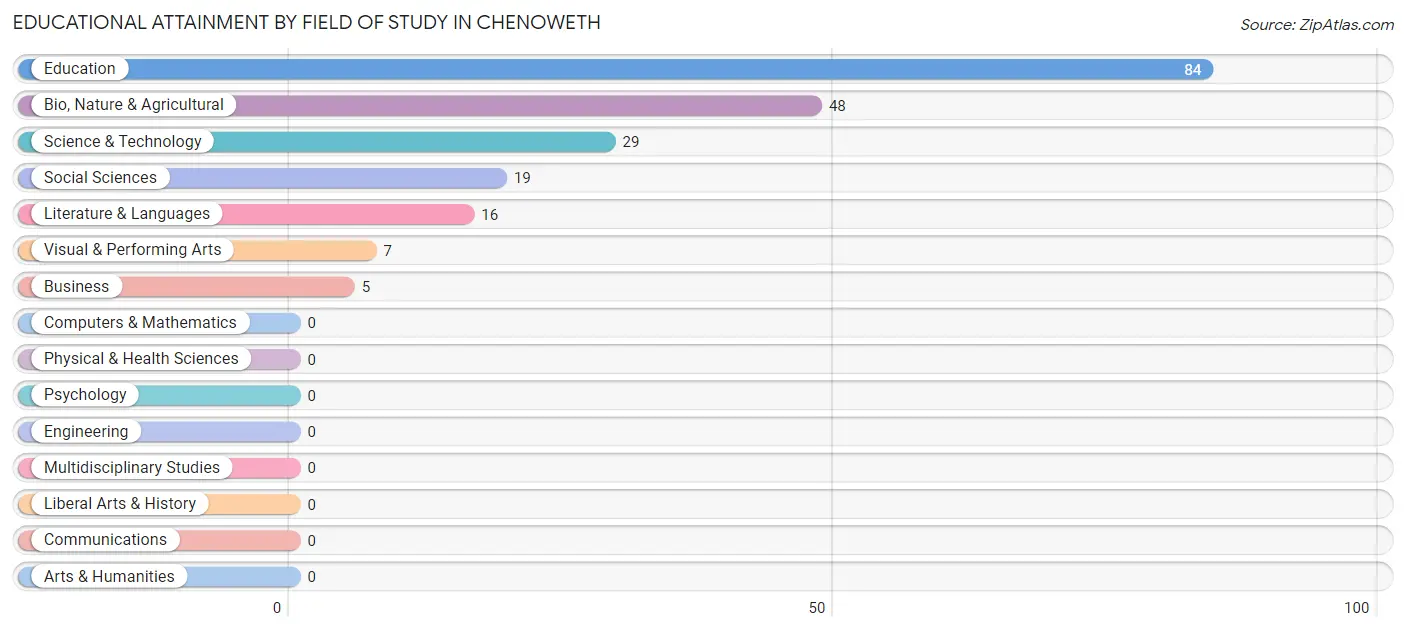
| Field of Study | # Graduates | % Graduates |
| Computers & Mathematics | 0 | 0.0% |
| Bio, Nature & Agricultural | 48 | 23.1% |
| Physical & Health Sciences | 0 | 0.0% |
| Psychology | 0 | 0.0% |
| Social Sciences | 19 | 9.1% |
| Engineering | 0 | 0.0% |
| Multidisciplinary Studies | 0 | 0.0% |
| Science & Technology | 29 | 13.9% |
| Business | 5 | 2.4% |
| Education | 84 | 40.4% |
| Literature & Languages | 16 | 7.7% |
| Liberal Arts & History | 0 | 0.0% |
| Visual & Performing Arts | 7 | 3.4% |
| Communications | 0 | 0.0% |
| Arts & Humanities | 0 | 0.0% |
| Total | 208 | 100.0% |
Transportation & Commute in Chenoweth
Vehicle Availability by Sex in Chenoweth
The most prevalent vehicle ownership categories in Chenoweth are males with 2 vehicles (197, accounting for 45.4%) and females with 2 vehicles (139, making up 62.7%).
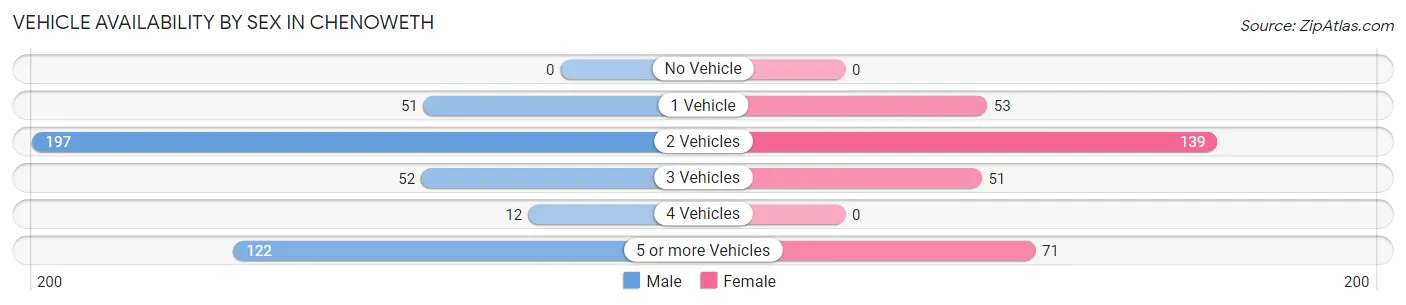
| Vehicles Available | Male | Female |
| No Vehicle | 0 (0.0%) | 0 (0.0%) |
| 1 Vehicle | 51 (11.7%) | 53 (16.9%) |
| 2 Vehicles | 197 (45.4%) | 139 (44.3%) |
| 3 Vehicles | 52 (12.0%) | 51 (16.2%) |
| 4 Vehicles | 12 (2.8%) | 0 (0.0%) |
| 5 or more Vehicles | 122 (28.1%) | 71 (22.6%) |
| Total | 434 (100.0%) | 314 (100.0%) |
Commute Time in Chenoweth
The most frequently occuring commute durations in Chenoweth are 5 to 9 minutes (169 commuters, 22.9%), 10 to 14 minutes (140 commuters, 18.9%), and 15 to 19 minutes (113 commuters, 15.3%).
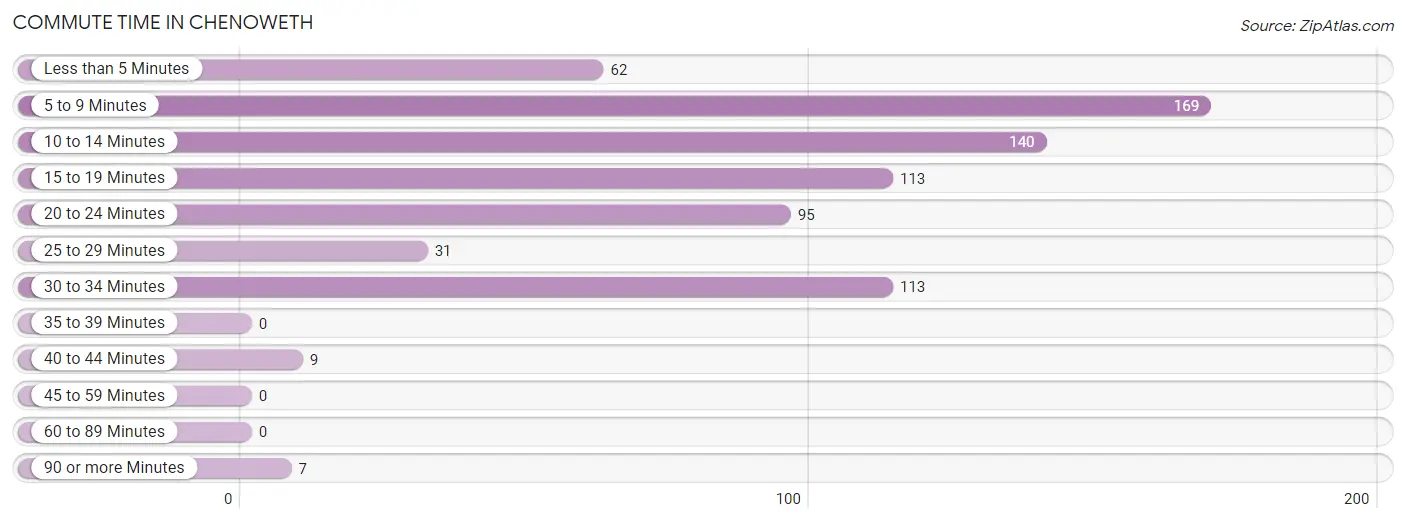
| Commute Time | # Commuters | % Commuters |
| Less than 5 Minutes | 62 | 8.4% |
| 5 to 9 Minutes | 169 | 22.9% |
| 10 to 14 Minutes | 140 | 18.9% |
| 15 to 19 Minutes | 113 | 15.3% |
| 20 to 24 Minutes | 95 | 12.9% |
| 25 to 29 Minutes | 31 | 4.2% |
| 30 to 34 Minutes | 113 | 15.3% |
| 35 to 39 Minutes | 0 | 0.0% |
| 40 to 44 Minutes | 9 | 1.2% |
| 45 to 59 Minutes | 0 | 0.0% |
| 60 to 89 Minutes | 0 | 0.0% |
| 90 or more Minutes | 7 | 0.9% |
Commute Time by Sex in Chenoweth
The most common commute times in Chenoweth are 5 to 9 minutes (115 commuters, 26.3%) for males and 10 to 14 minutes (115 commuters, 38.1%) for females.
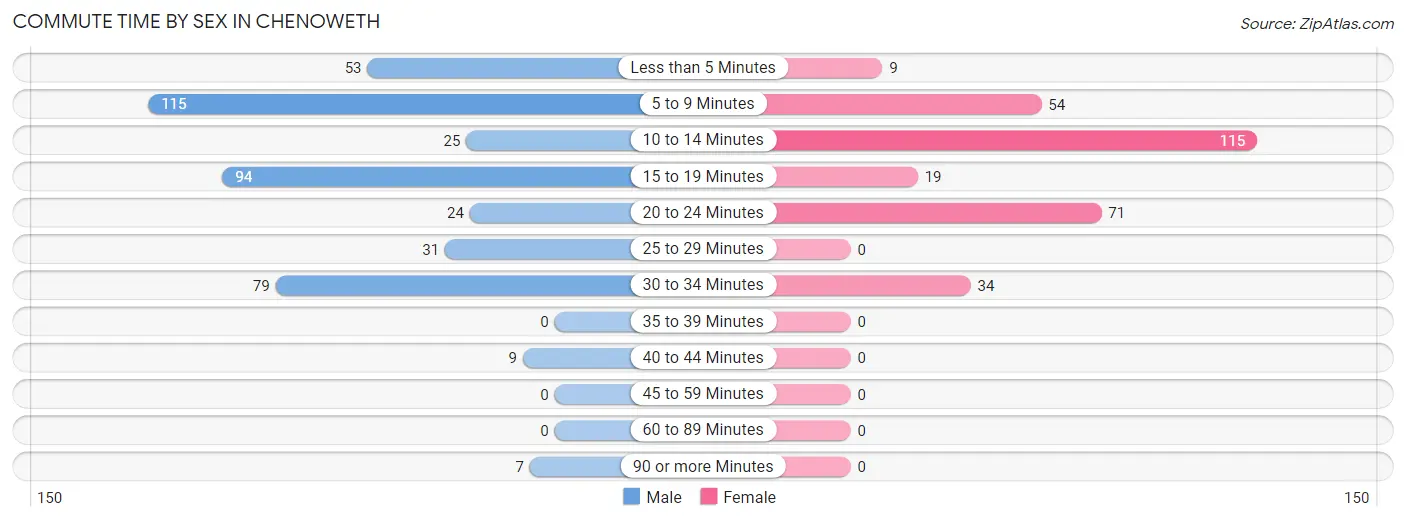
| Commute Time | Male | Female |
| Less than 5 Minutes | 53 (12.1%) | 9 (3.0%) |
| 5 to 9 Minutes | 115 (26.3%) | 54 (17.9%) |
| 10 to 14 Minutes | 25 (5.7%) | 115 (38.1%) |
| 15 to 19 Minutes | 94 (21.5%) | 19 (6.3%) |
| 20 to 24 Minutes | 24 (5.5%) | 71 (23.5%) |
| 25 to 29 Minutes | 31 (7.1%) | 0 (0.0%) |
| 30 to 34 Minutes | 79 (18.1%) | 34 (11.3%) |
| 35 to 39 Minutes | 0 (0.0%) | 0 (0.0%) |
| 40 to 44 Minutes | 9 (2.1%) | 0 (0.0%) |
| 45 to 59 Minutes | 0 (0.0%) | 0 (0.0%) |
| 60 to 89 Minutes | 0 (0.0%) | 0 (0.0%) |
| 90 or more Minutes | 7 (1.6%) | 0 (0.0%) |
Time of Departure to Work by Sex in Chenoweth
The most frequent times of departure to work in Chenoweth are 12:00 AM to 4:59 AM (134, 30.7%) for males and 7:30 AM to 7:59 AM (57, 18.9%) for females.
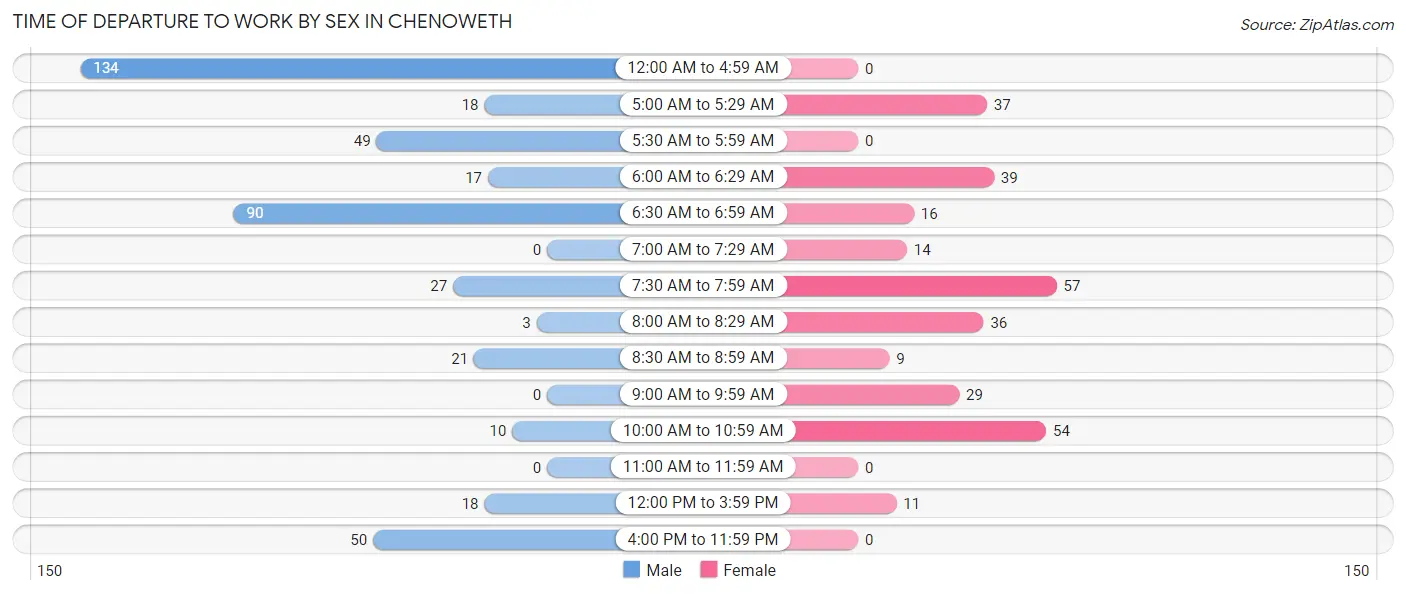
| Time of Departure | Male | Female |
| 12:00 AM to 4:59 AM | 134 (30.7%) | 0 (0.0%) |
| 5:00 AM to 5:29 AM | 18 (4.1%) | 37 (12.2%) |
| 5:30 AM to 5:59 AM | 49 (11.2%) | 0 (0.0%) |
| 6:00 AM to 6:29 AM | 17 (3.9%) | 39 (12.9%) |
| 6:30 AM to 6:59 AM | 90 (20.6%) | 16 (5.3%) |
| 7:00 AM to 7:29 AM | 0 (0.0%) | 14 (4.6%) |
| 7:30 AM to 7:59 AM | 27 (6.2%) | 57 (18.9%) |
| 8:00 AM to 8:29 AM | 3 (0.7%) | 36 (11.9%) |
| 8:30 AM to 8:59 AM | 21 (4.8%) | 9 (3.0%) |
| 9:00 AM to 9:59 AM | 0 (0.0%) | 29 (9.6%) |
| 10:00 AM to 10:59 AM | 10 (2.3%) | 54 (17.9%) |
| 11:00 AM to 11:59 AM | 0 (0.0%) | 0 (0.0%) |
| 12:00 PM to 3:59 PM | 18 (4.1%) | 11 (3.6%) |
| 4:00 PM to 11:59 PM | 50 (11.4%) | 0 (0.0%) |
| Total | 437 (100.0%) | 302 (100.0%) |
Housing Occupancy in Chenoweth
Occupancy by Ownership in Chenoweth
Of the total 696 dwellings in Chenoweth, owner-occupied units account for 468 (67.2%), while renter-occupied units make up 228 (32.8%).
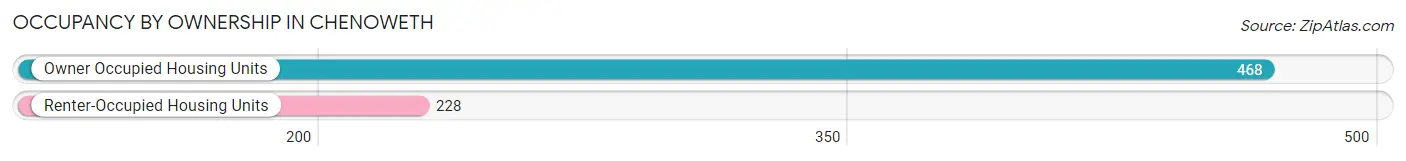
| Occupancy | # Housing Units | % Housing Units |
| Owner Occupied Housing Units | 468 | 67.2% |
| Renter-Occupied Housing Units | 228 | 32.8% |
| Total Occupied Housing Units | 696 | 100.0% |
Occupancy by Household Size in Chenoweth
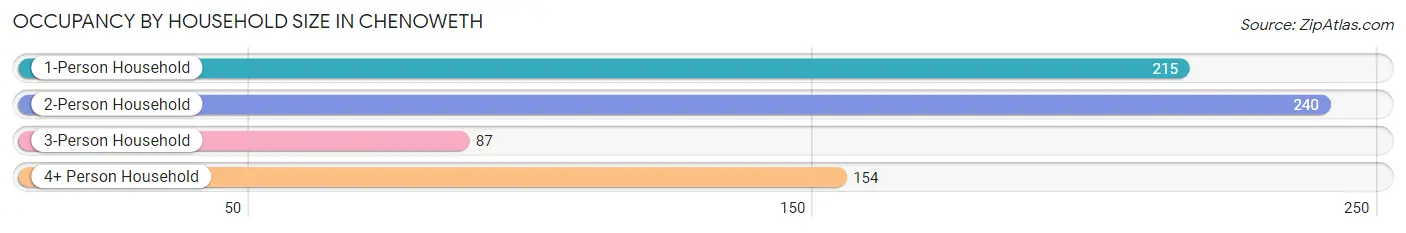
| Household Size | # Housing Units | % Housing Units |
| 1-Person Household | 215 | 30.9% |
| 2-Person Household | 240 | 34.5% |
| 3-Person Household | 87 | 12.5% |
| 4+ Person Household | 154 | 22.1% |
| Total Housing Units | 696 | 100.0% |
Occupancy by Ownership by Household Size in Chenoweth
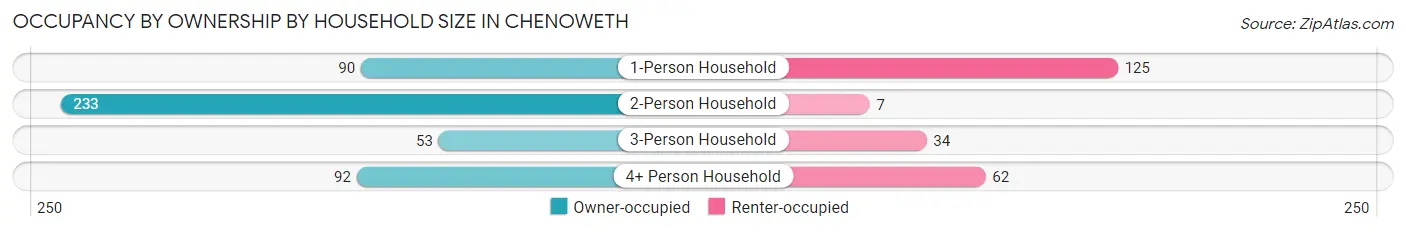
| Household Size | Owner-occupied | Renter-occupied |
| 1-Person Household | 90 (41.9%) | 125 (58.1%) |
| 2-Person Household | 233 (97.1%) | 7 (2.9%) |
| 3-Person Household | 53 (60.9%) | 34 (39.1%) |
| 4+ Person Household | 92 (59.7%) | 62 (40.3%) |
| Total Housing Units | 468 (67.2%) | 228 (32.8%) |
Occupancy by Educational Attainment in Chenoweth
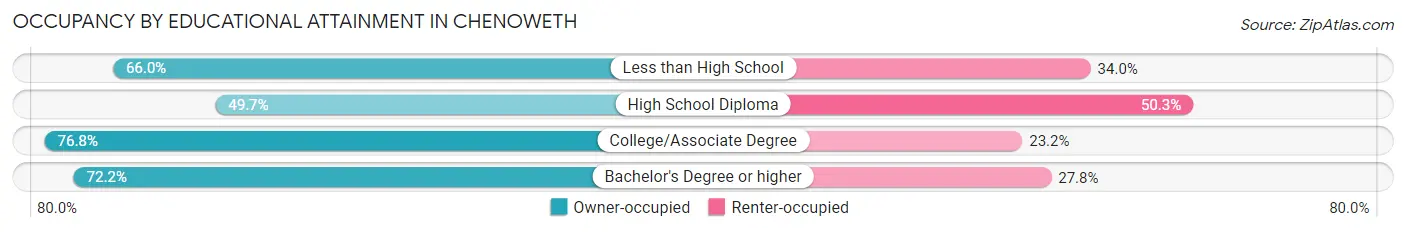
| Household Size | Owner-occupied | Renter-occupied |
| Less than High School | 64 (66.0%) | 33 (34.0%) |
| High School Diploma | 94 (49.7%) | 95 (50.3%) |
| College/Associate Degree | 232 (76.8%) | 70 (23.2%) |
| Bachelor's Degree or higher | 78 (72.2%) | 30 (27.8%) |
Occupancy by Age of Householder in Chenoweth
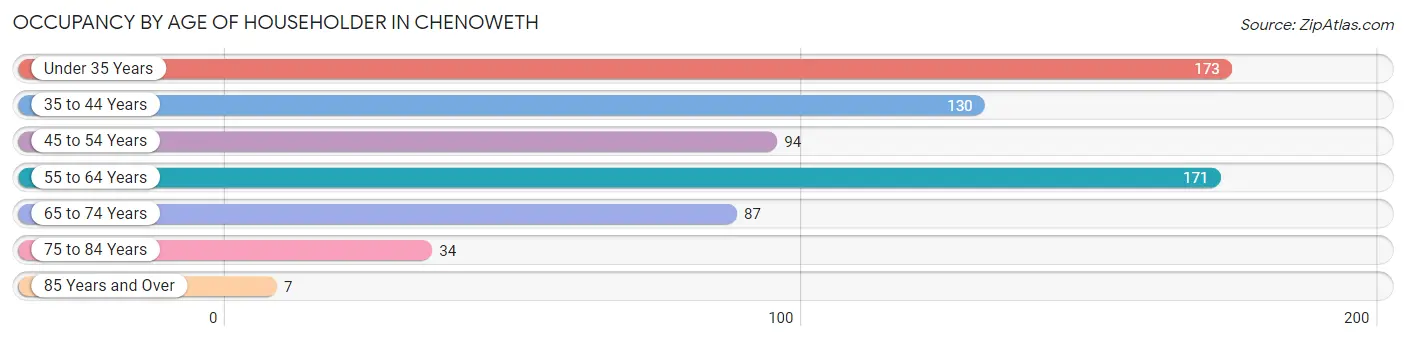
| Age Bracket | # Households | % Households |
| Under 35 Years | 173 | 24.9% |
| 35 to 44 Years | 130 | 18.7% |
| 45 to 54 Years | 94 | 13.5% |
| 55 to 64 Years | 171 | 24.6% |
| 65 to 74 Years | 87 | 12.5% |
| 75 to 84 Years | 34 | 4.9% |
| 85 Years and Over | 7 | 1.0% |
| Total | 696 | 100.0% |
Housing Finances in Chenoweth
Median Income by Occupancy in Chenoweth
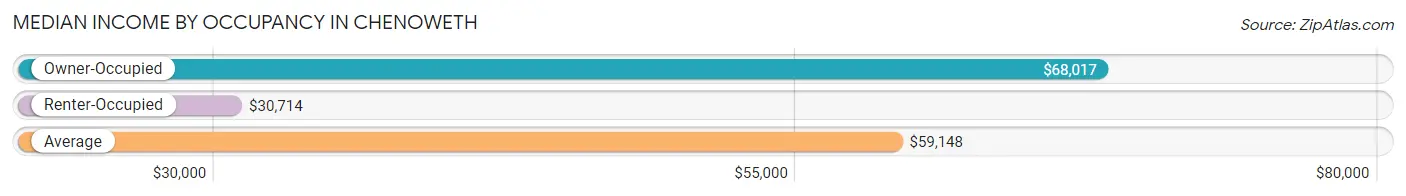
| Occupancy Type | # Households | Median Income |
| Owner-Occupied | 468 (67.2%) | $68,017 |
| Renter-Occupied | 228 (32.8%) | $30,714 |
| Average | 696 (100.0%) | $59,148 |
Occupancy by Householder Income Bracket in Chenoweth
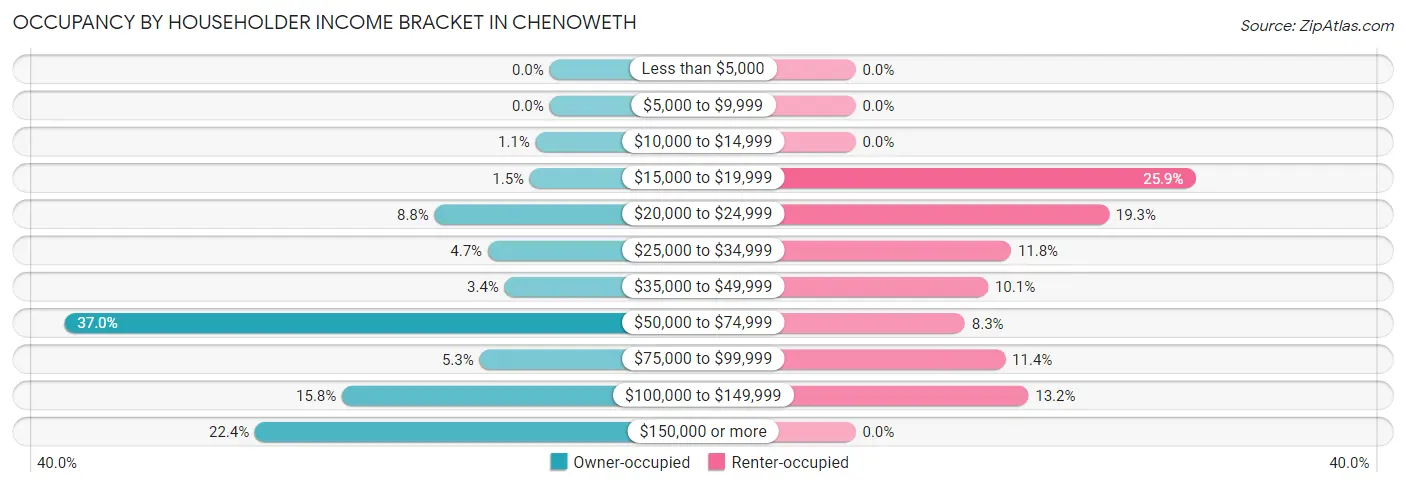
| Income Bracket | Owner-occupied | Renter-occupied |
| Less than $5,000 | 0 (0.0%) | 0 (0.0%) |
| $5,000 to $9,999 | 0 (0.0%) | 0 (0.0%) |
| $10,000 to $14,999 | 5 (1.1%) | 0 (0.0%) |
| $15,000 to $19,999 | 7 (1.5%) | 59 (25.9%) |
| $20,000 to $24,999 | 41 (8.8%) | 44 (19.3%) |
| $25,000 to $34,999 | 22 (4.7%) | 27 (11.8%) |
| $35,000 to $49,999 | 16 (3.4%) | 23 (10.1%) |
| $50,000 to $74,999 | 173 (37.0%) | 19 (8.3%) |
| $75,000 to $99,999 | 25 (5.3%) | 26 (11.4%) |
| $100,000 to $149,999 | 74 (15.8%) | 30 (13.2%) |
| $150,000 or more | 105 (22.4%) | 0 (0.0%) |
| Total | 468 (100.0%) | 228 (100.0%) |
Monthly Housing Cost Tiers in Chenoweth
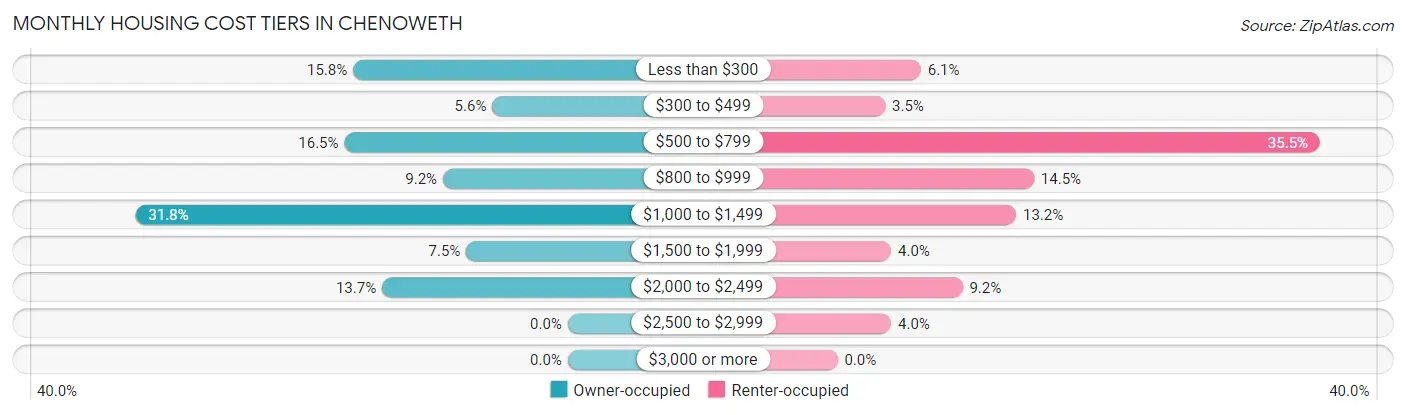
| Monthly Cost | Owner-occupied | Renter-occupied |
| Less than $300 | 74 (15.8%) | 14 (6.1%) |
| $300 to $499 | 26 (5.6%) | 8 (3.5%) |
| $500 to $799 | 77 (16.5%) | 81 (35.5%) |
| $800 to $999 | 43 (9.2%) | 33 (14.5%) |
| $1,000 to $1,499 | 149 (31.8%) | 30 (13.2%) |
| $1,500 to $1,999 | 35 (7.5%) | 9 (4.0%) |
| $2,000 to $2,499 | 64 (13.7%) | 21 (9.2%) |
| $2,500 to $2,999 | 0 (0.0%) | 9 (4.0%) |
| $3,000 or more | 0 (0.0%) | 0 (0.0%) |
| Total | 468 (100.0%) | 228 (100.0%) |
Physical Housing Characteristics in Chenoweth
Housing Structures in Chenoweth
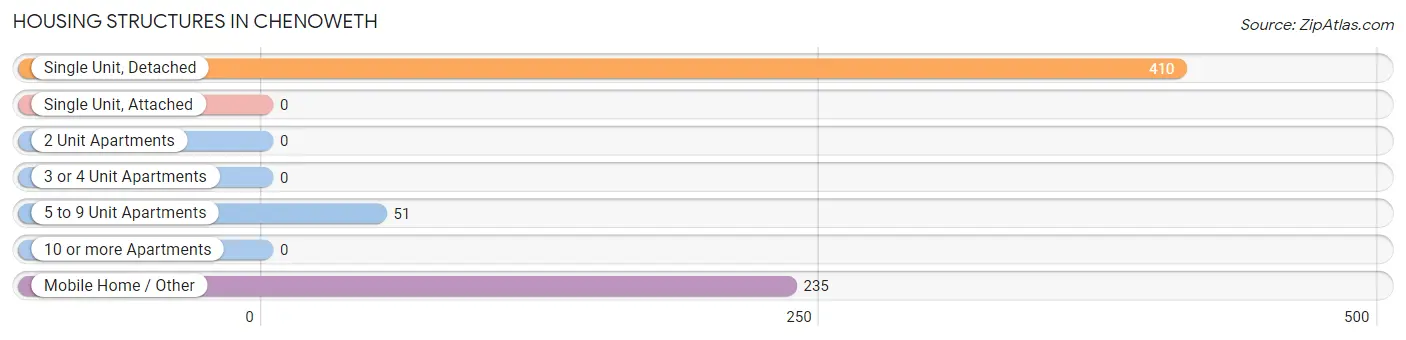
| Structure Type | # Housing Units | % Housing Units |
| Single Unit, Detached | 410 | 58.9% |
| Single Unit, Attached | 0 | 0.0% |
| 2 Unit Apartments | 0 | 0.0% |
| 3 or 4 Unit Apartments | 0 | 0.0% |
| 5 to 9 Unit Apartments | 51 | 7.3% |
| 10 or more Apartments | 0 | 0.0% |
| Mobile Home / Other | 235 | 33.8% |
| Total | 696 | 100.0% |
Housing Structures by Occupancy in Chenoweth
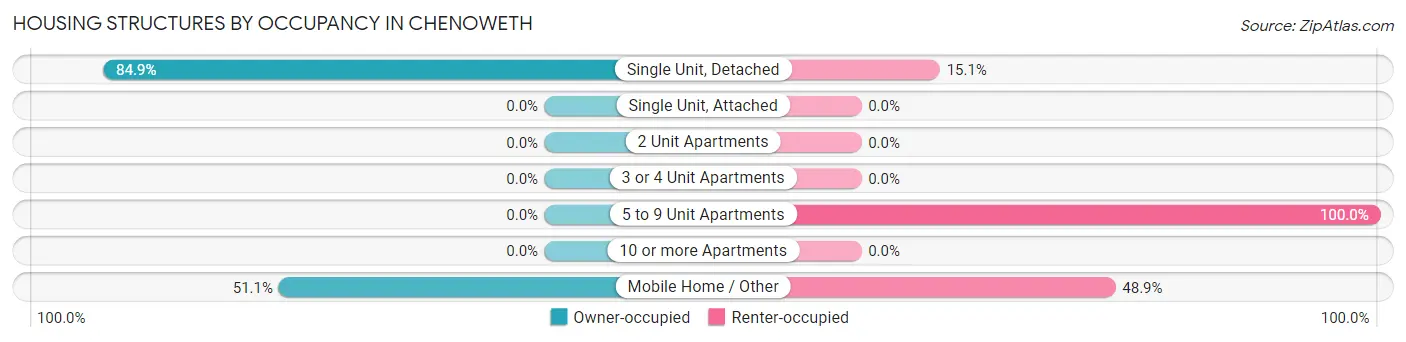
| Structure Type | Owner-occupied | Renter-occupied |
| Single Unit, Detached | 348 (84.9%) | 62 (15.1%) |
| Single Unit, Attached | 0 (0.0%) | 0 (0.0%) |
| 2 Unit Apartments | 0 (0.0%) | 0 (0.0%) |
| 3 or 4 Unit Apartments | 0 (0.0%) | 0 (0.0%) |
| 5 to 9 Unit Apartments | 0 (0.0%) | 51 (100.0%) |
| 10 or more Apartments | 0 (0.0%) | 0 (0.0%) |
| Mobile Home / Other | 120 (51.1%) | 115 (48.9%) |
| Total | 468 (67.2%) | 228 (32.8%) |
Housing Structures by Number of Rooms in Chenoweth
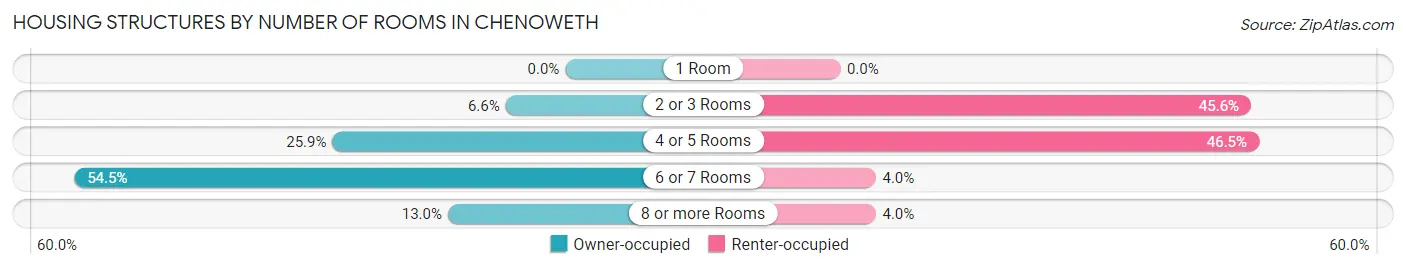
| Number of Rooms | Owner-occupied | Renter-occupied |
| 1 Room | 0 (0.0%) | 0 (0.0%) |
| 2 or 3 Rooms | 31 (6.6%) | 104 (45.6%) |
| 4 or 5 Rooms | 121 (25.9%) | 106 (46.5%) |
| 6 or 7 Rooms | 255 (54.5%) | 9 (4.0%) |
| 8 or more Rooms | 61 (13.0%) | 9 (4.0%) |
| Total | 468 (100.0%) | 228 (100.0%) |
Housing Structure by Heating Type in Chenoweth
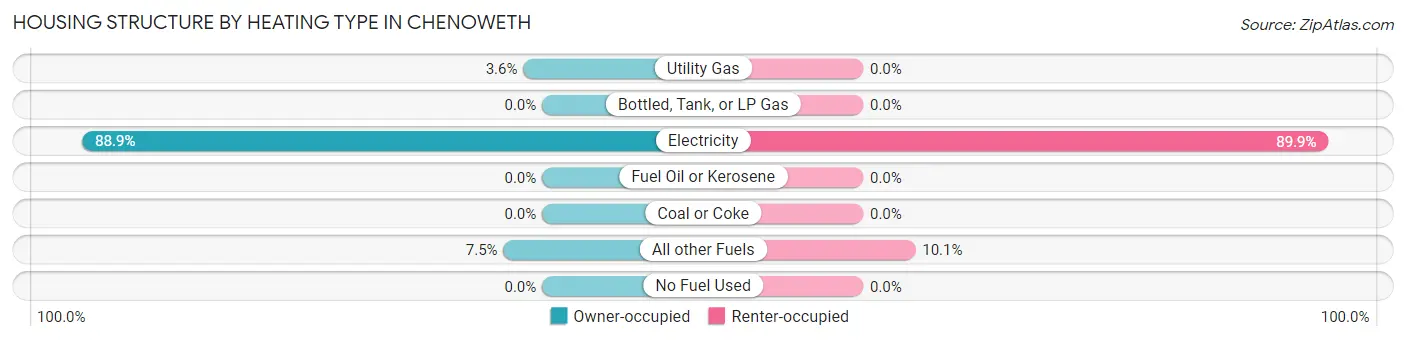
| Heating Type | Owner-occupied | Renter-occupied |
| Utility Gas | 17 (3.6%) | 0 (0.0%) |
| Bottled, Tank, or LP Gas | 0 (0.0%) | 0 (0.0%) |
| Electricity | 416 (88.9%) | 205 (89.9%) |
| Fuel Oil or Kerosene | 0 (0.0%) | 0 (0.0%) |
| Coal or Coke | 0 (0.0%) | 0 (0.0%) |
| All other Fuels | 35 (7.5%) | 23 (10.1%) |
| No Fuel Used | 0 (0.0%) | 0 (0.0%) |
| Total | 468 (100.0%) | 228 (100.0%) |
Household Vehicle Usage in Chenoweth
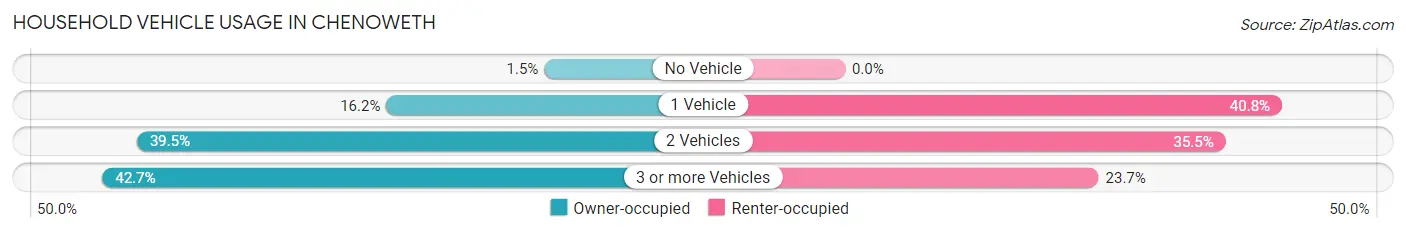
| Vehicles per Household | Owner-occupied | Renter-occupied |
| No Vehicle | 7 (1.5%) | 0 (0.0%) |
| 1 Vehicle | 76 (16.2%) | 93 (40.8%) |
| 2 Vehicles | 185 (39.5%) | 81 (35.5%) |
| 3 or more Vehicles | 200 (42.7%) | 54 (23.7%) |
| Total | 468 (100.0%) | 228 (100.0%) |
Real Estate & Mortgages in Chenoweth
Real Estate and Mortgage Overview in Chenoweth
| Characteristic | Without Mortgage | With Mortgage |
| Housing Units | 196 | 272 |
| Median Property Value | - | - |
| Median Household Income | $68,190 | $75 |
| Monthly Housing Costs | $471 | $0 |
| Real Estate Taxes | - | - |
Property Value by Mortgage Status in Chenoweth
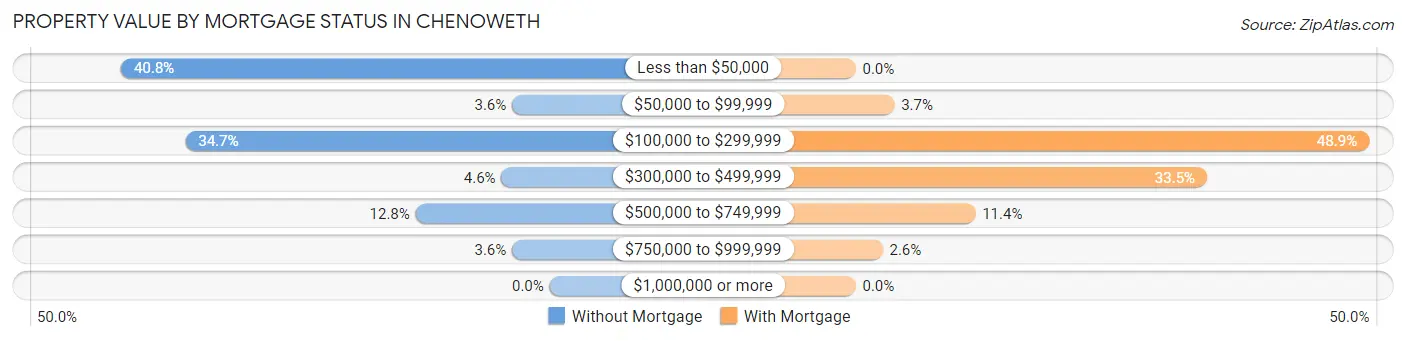
| Property Value | Without Mortgage | With Mortgage |
| Less than $50,000 | 80 (40.8%) | 0 (0.0%) |
| $50,000 to $99,999 | 7 (3.6%) | 10 (3.7%) |
| $100,000 to $299,999 | 68 (34.7%) | 133 (48.9%) |
| $300,000 to $499,999 | 9 (4.6%) | 91 (33.5%) |
| $500,000 to $749,999 | 25 (12.8%) | 31 (11.4%) |
| $750,000 to $999,999 | 7 (3.6%) | 7 (2.6%) |
| $1,000,000 or more | 0 (0.0%) | 0 (0.0%) |
| Total | 196 (100.0%) | 272 (100.0%) |
Household Income by Mortgage Status in Chenoweth
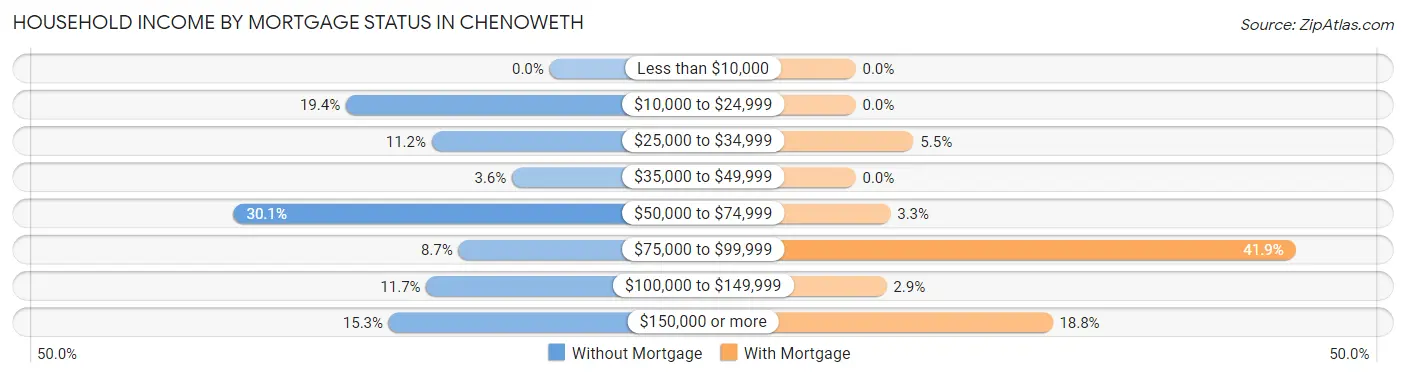
| Household Income | Without Mortgage | With Mortgage |
| Less than $10,000 | 0 (0.0%) | 0 (0.0%) |
| $10,000 to $24,999 | 38 (19.4%) | 0 (0.0%) |
| $25,000 to $34,999 | 22 (11.2%) | 15 (5.5%) |
| $35,000 to $49,999 | 7 (3.6%) | 0 (0.0%) |
| $50,000 to $74,999 | 59 (30.1%) | 9 (3.3%) |
| $75,000 to $99,999 | 17 (8.7%) | 114 (41.9%) |
| $100,000 to $149,999 | 23 (11.7%) | 8 (2.9%) |
| $150,000 or more | 30 (15.3%) | 51 (18.8%) |
| Total | 196 (100.0%) | 272 (100.0%) |
Property Value to Household Income Ratio in Chenoweth
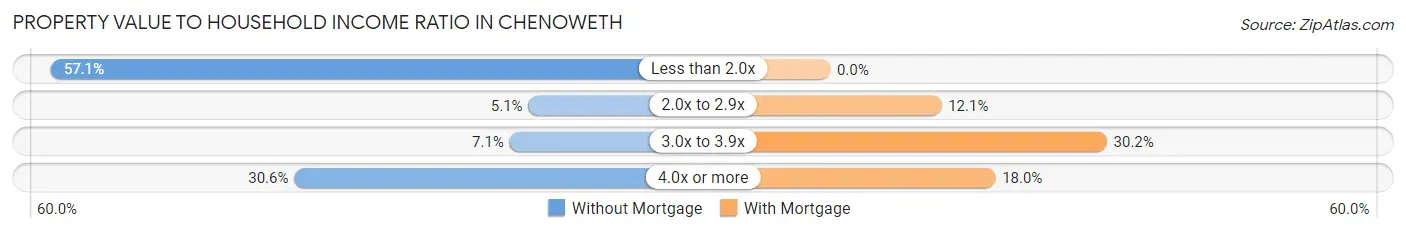
| Value-to-Income Ratio | Without Mortgage | With Mortgage |
| Less than 2.0x | 112 (57.1%) | 0 (0.0%) |
| 2.0x to 2.9x | 10 (5.1%) | 33 (12.1%) |
| 3.0x to 3.9x | 14 (7.1%) | 82 (30.1%) |
| 4.0x or more | 60 (30.6%) | 49 (18.0%) |
| Total | 196 (100.0%) | 272 (100.0%) |
Real Estate Taxes by Mortgage Status in Chenoweth
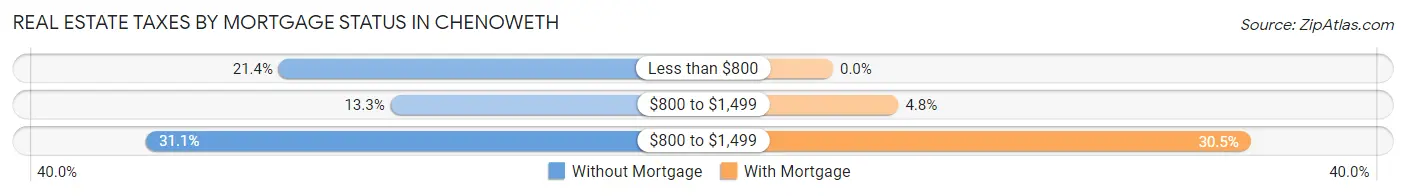
| Property Taxes | Without Mortgage | With Mortgage |
| Less than $800 | 42 (21.4%) | 0 (0.0%) |
| $800 to $1,499 | 26 (13.3%) | 13 (4.8%) |
| $800 to $1,499 | 61 (31.1%) | 83 (30.5%) |
| Total | 196 (100.0%) | 272 (100.0%) |
Health & Disability in Chenoweth
Health Insurance Coverage by Age in Chenoweth
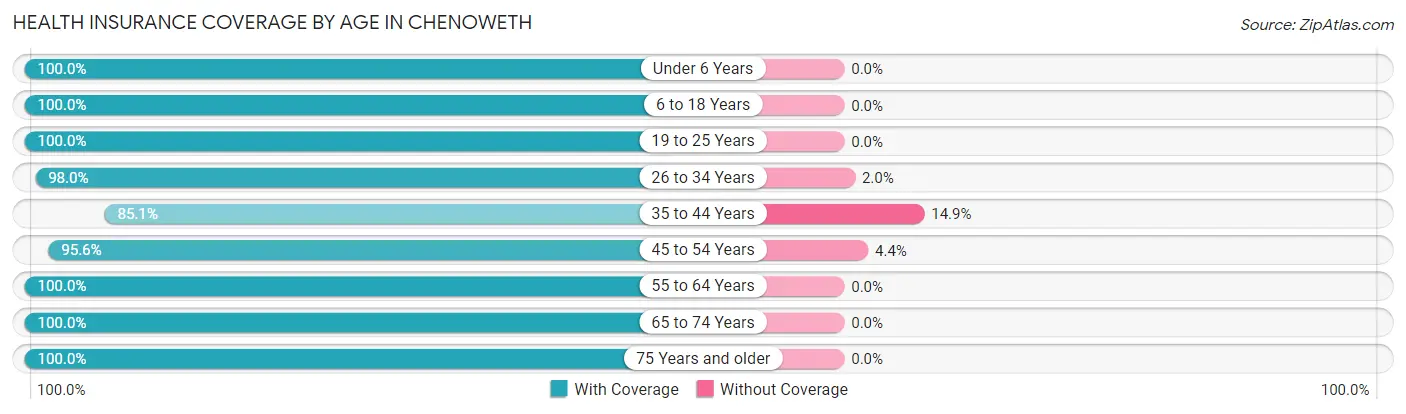
| Age Bracket | With Coverage | Without Coverage |
| Under 6 Years | 58 (100.0%) | 0 (0.0%) |
| 6 to 18 Years | 426 (100.0%) | 0 (0.0%) |
| 19 to 25 Years | 47 (100.0%) | 0 (0.0%) |
| 26 to 34 Years | 296 (98.0%) | 6 (2.0%) |
| 35 to 44 Years | 211 (85.1%) | 37 (14.9%) |
| 45 to 54 Years | 172 (95.6%) | 8 (4.4%) |
| 55 to 64 Years | 250 (100.0%) | 0 (0.0%) |
| 65 to 74 Years | 137 (100.0%) | 0 (0.0%) |
| 75 Years and older | 69 (100.0%) | 0 (0.0%) |
| Total | 1,666 (97.0%) | 51 (3.0%) |
Health Insurance Coverage by Citizenship Status in Chenoweth
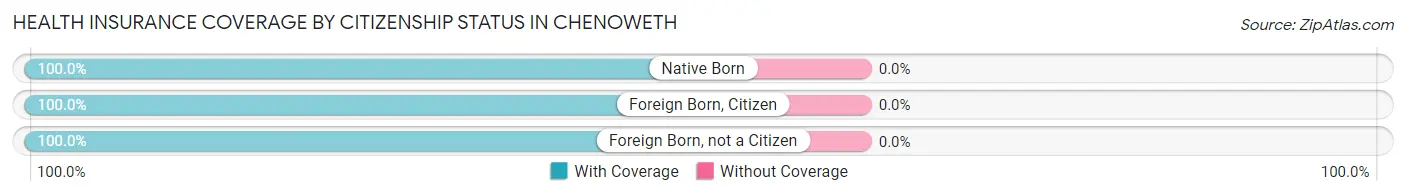
| Citizenship Status | With Coverage | Without Coverage |
| Native Born | 58 (100.0%) | 0 (0.0%) |
| Foreign Born, Citizen | 426 (100.0%) | 0 (0.0%) |
| Foreign Born, not a Citizen | 47 (100.0%) | 0 (0.0%) |
Health Insurance Coverage by Household Income in Chenoweth
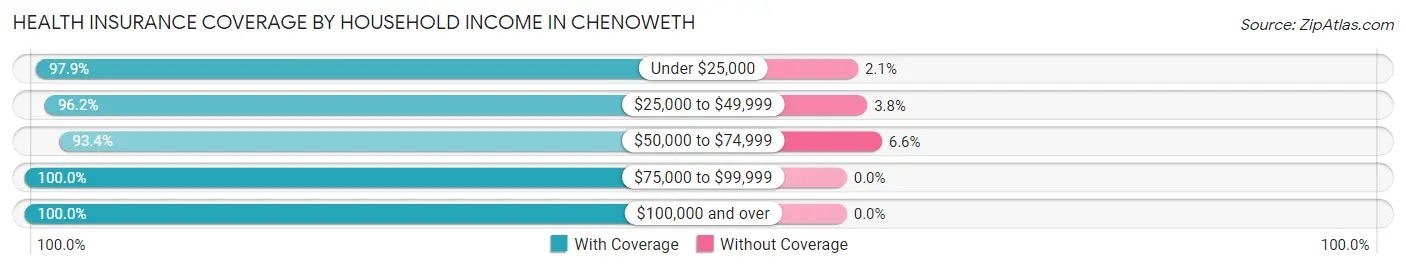
| Household Income | With Coverage | Without Coverage |
| Under $25,000 | 276 (97.9%) | 6 (2.1%) |
| $25,000 to $49,999 | 201 (96.2%) | 8 (3.8%) |
| $50,000 to $74,999 | 527 (93.4%) | 37 (6.6%) |
| $75,000 to $99,999 | 131 (100.0%) | 0 (0.0%) |
| $100,000 and over | 527 (100.0%) | 0 (0.0%) |
Public vs Private Health Insurance Coverage by Age in Chenoweth
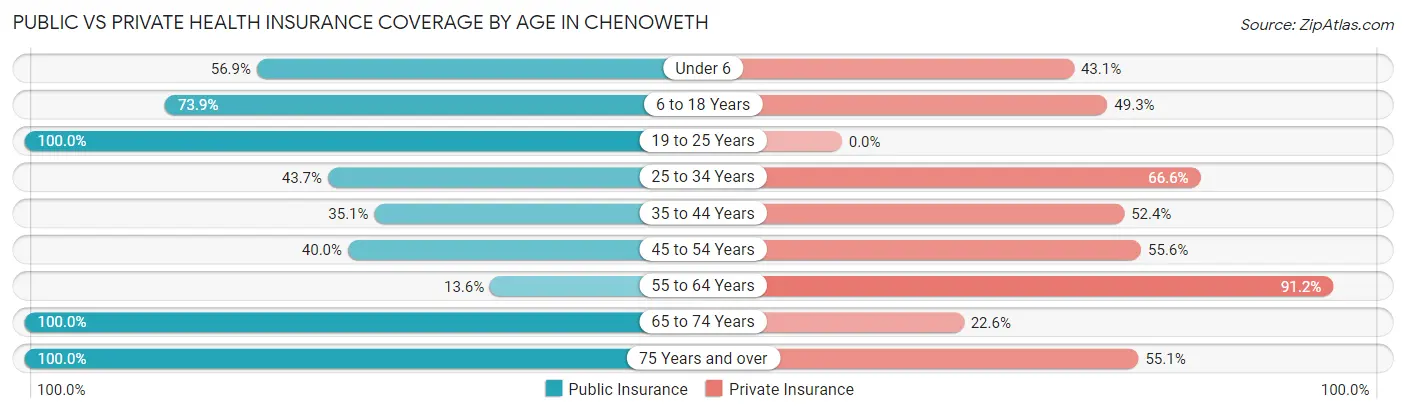
| Age Bracket | Public Insurance | Private Insurance |
| Under 6 | 33 (56.9%) | 25 (43.1%) |
| 6 to 18 Years | 315 (73.9%) | 210 (49.3%) |
| 19 to 25 Years | 47 (100.0%) | 0 (0.0%) |
| 25 to 34 Years | 132 (43.7%) | 201 (66.6%) |
| 35 to 44 Years | 87 (35.1%) | 130 (52.4%) |
| 45 to 54 Years | 72 (40.0%) | 100 (55.6%) |
| 55 to 64 Years | 34 (13.6%) | 228 (91.2%) |
| 65 to 74 Years | 137 (100.0%) | 31 (22.6%) |
| 75 Years and over | 69 (100.0%) | 38 (55.1%) |
| Total | 926 (53.9%) | 963 (56.1%) |
Disability Status by Sex by Age in Chenoweth
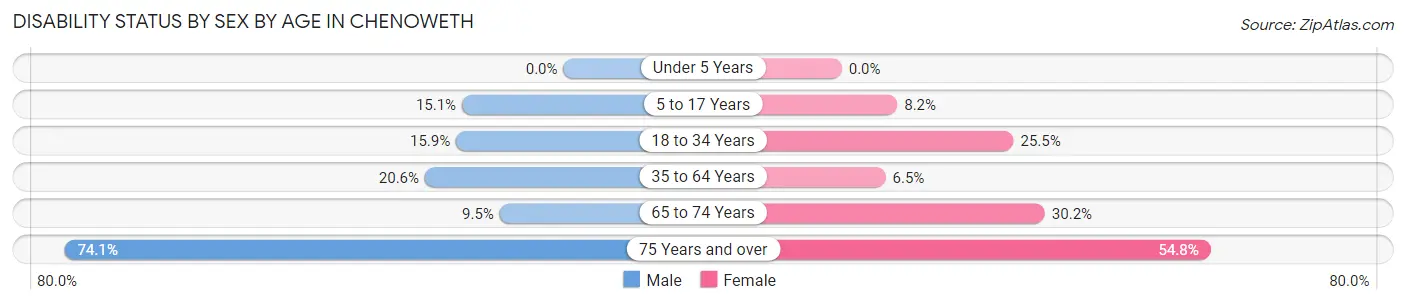
| Age Bracket | Male | Female |
| Under 5 Years | 0 (0.0%) | 0 (0.0%) |
| 5 to 17 Years | 47 (15.1%) | 7 (8.2%) |
| 18 to 34 Years | 29 (15.9%) | 50 (25.5%) |
| 35 to 64 Years | 73 (20.6%) | 21 (6.5%) |
| 65 to 74 Years | 7 (9.5%) | 19 (30.2%) |
| 75 Years and over | 20 (74.1%) | 23 (54.8%) |
Disability Class by Sex by Age in Chenoweth
Disability Class: Hearing Difficulty
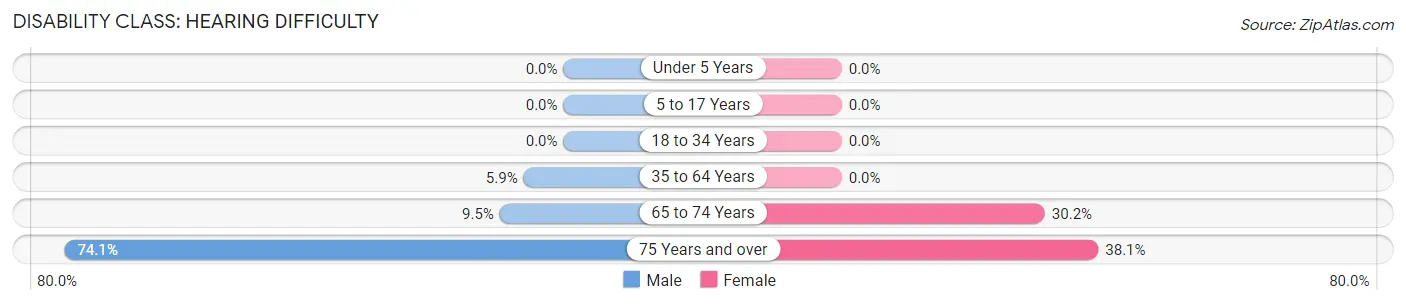
| Age Bracket | Male | Female |
| Under 5 Years | 0 (0.0%) | 0 (0.0%) |
| 5 to 17 Years | 0 (0.0%) | 0 (0.0%) |
| 18 to 34 Years | 0 (0.0%) | 0 (0.0%) |
| 35 to 64 Years | 21 (5.9%) | 0 (0.0%) |
| 65 to 74 Years | 7 (9.5%) | 19 (30.2%) |
| 75 Years and over | 20 (74.1%) | 16 (38.1%) |
Disability Class: Vision Difficulty
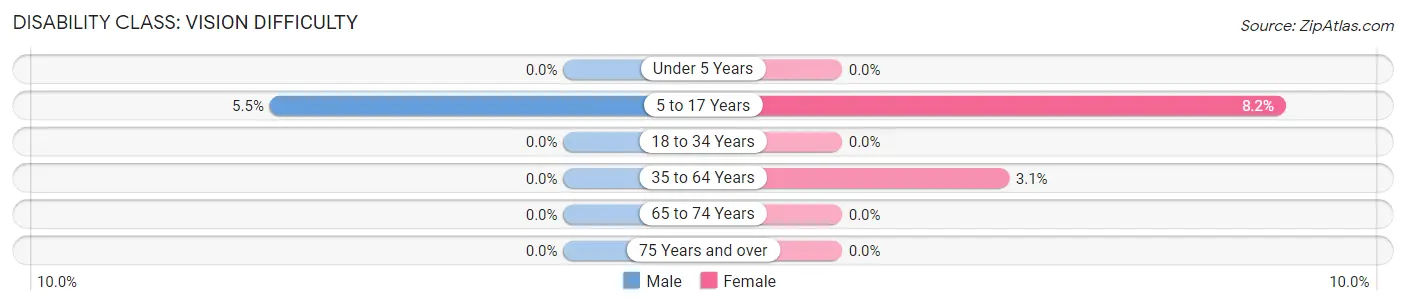
| Age Bracket | Male | Female |
| Under 5 Years | 0 (0.0%) | 0 (0.0%) |
| 5 to 17 Years | 17 (5.4%) | 7 (8.2%) |
| 18 to 34 Years | 0 (0.0%) | 0 (0.0%) |
| 35 to 64 Years | 0 (0.0%) | 10 (3.1%) |
| 65 to 74 Years | 0 (0.0%) | 0 (0.0%) |
| 75 Years and over | 0 (0.0%) | 0 (0.0%) |
Disability Class: Cognitive Difficulty
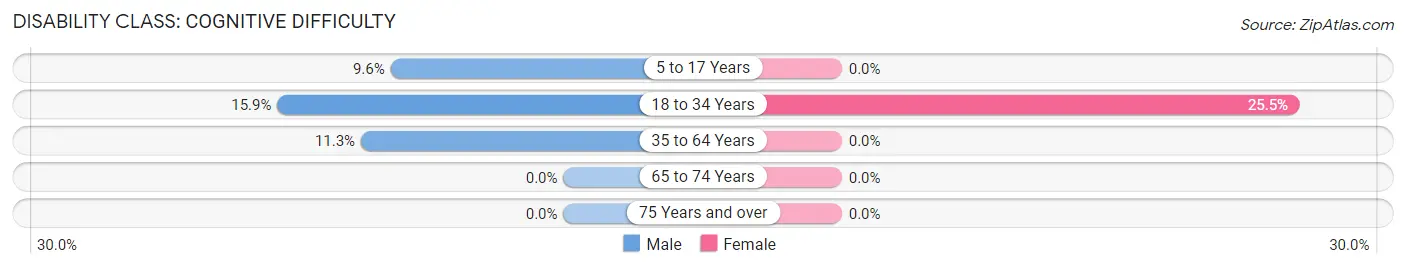
| Age Bracket | Male | Female |
| 5 to 17 Years | 30 (9.6%) | 0 (0.0%) |
| 18 to 34 Years | 29 (15.9%) | 50 (25.5%) |
| 35 to 64 Years | 40 (11.3%) | 0 (0.0%) |
| 65 to 74 Years | 0 (0.0%) | 0 (0.0%) |
| 75 Years and over | 0 (0.0%) | 0 (0.0%) |
Disability Class: Ambulatory Difficulty
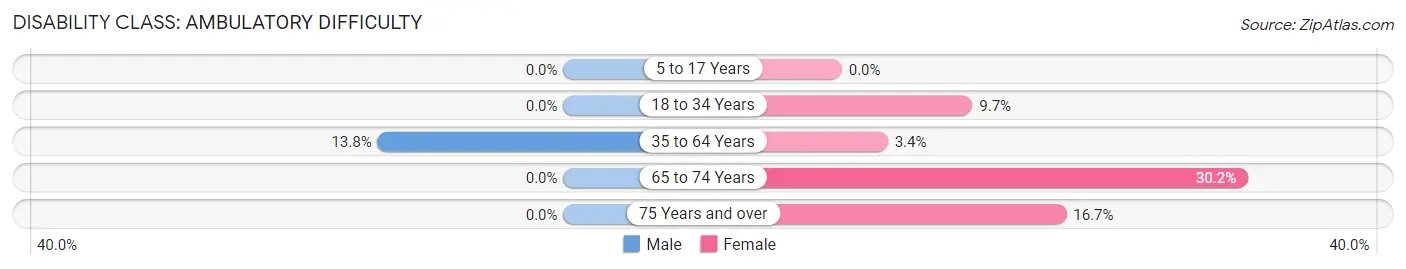
| Age Bracket | Male | Female |
| 5 to 17 Years | 0 (0.0%) | 0 (0.0%) |
| 18 to 34 Years | 0 (0.0%) | 19 (9.7%) |
| 35 to 64 Years | 49 (13.8%) | 11 (3.4%) |
| 65 to 74 Years | 0 (0.0%) | 19 (30.2%) |
| 75 Years and over | 0 (0.0%) | 7 (16.7%) |
Disability Class: Self-Care Difficulty
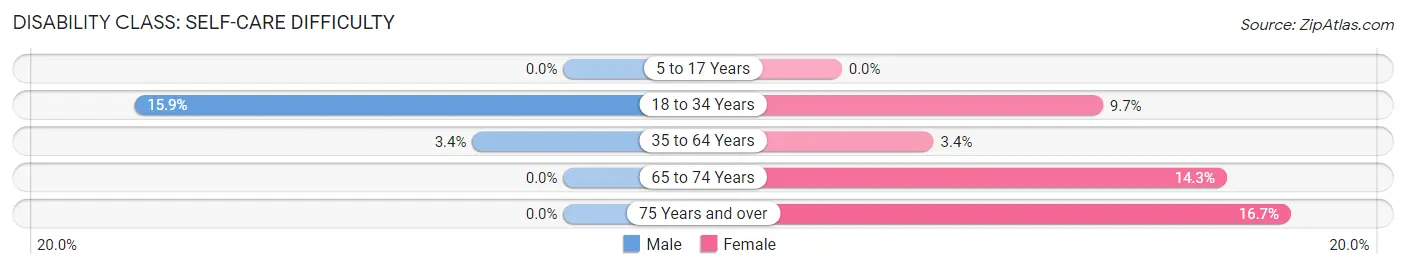
| Age Bracket | Male | Female |
| 5 to 17 Years | 0 (0.0%) | 0 (0.0%) |
| 18 to 34 Years | 29 (15.9%) | 19 (9.7%) |
| 35 to 64 Years | 12 (3.4%) | 11 (3.4%) |
| 65 to 74 Years | 0 (0.0%) | 9 (14.3%) |
| 75 Years and over | 0 (0.0%) | 7 (16.7%) |
Technology Access in Chenoweth
Computing Device Access in Chenoweth
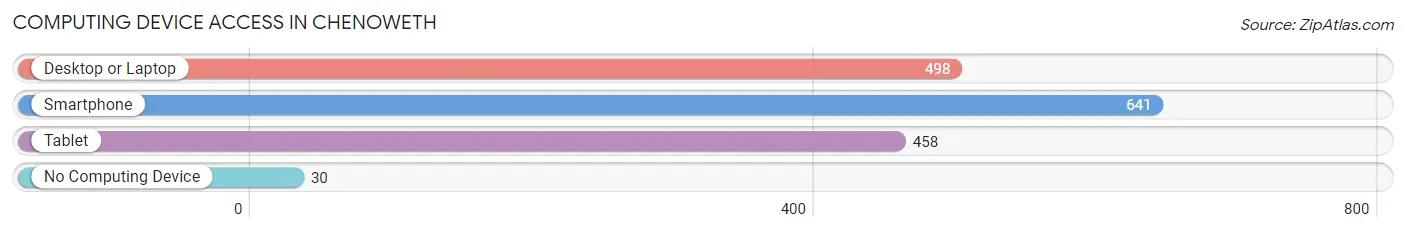
| Device Type | # Households | % Households |
| Desktop or Laptop | 498 | 71.6% |
| Smartphone | 641 | 92.1% |
| Tablet | 458 | 65.8% |
| No Computing Device | 30 | 4.3% |
| Total | 696 | 100.0% |
Internet Access in Chenoweth
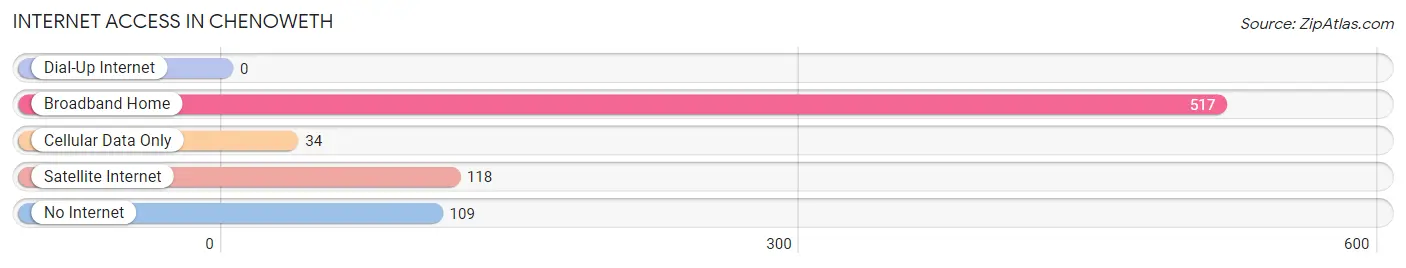
| Internet Type | # Households | % Households |
| Dial-Up Internet | 0 | 0.0% |
| Broadband Home | 517 | 74.3% |
| Cellular Data Only | 34 | 4.9% |
| Satellite Internet | 118 | 17.0% |
| No Internet | 109 | 15.7% |
| Total | 696 | 100.0% |
Chenoweth Summary
Chenoweth is a small unincorporated community located in Clackamas County, Oregon. It is situated in the foothills of the Cascade Mountains, approximately 20 miles southeast of Portland. The community is home to a population of approximately 1,000 people, and is known for its rural atmosphere and small-town charm.
History
The area that is now Chenoweth was first settled in the late 1800s by homesteaders. The community was originally known as “Chenoweth’s Corner”, named after the first settler, John Chenoweth. The area was primarily used for farming and logging, and the community grew slowly over the years. In the early 1900s, the area was home to a post office, a general store, and a school.
In the 1950s, the area began to experience rapid growth as the population of Portland increased. This growth was fueled by the construction of the nearby Mount Hood Freeway, which made the area more accessible to commuters. As a result, the population of Chenoweth increased significantly, and the community began to develop into a small suburb of Portland.
Geography
Chenoweth is located in the foothills of the Cascade Mountains, approximately 20 miles southeast of Portland. The community is situated in a valley, surrounded by rolling hills and forests. The area is known for its scenic beauty, and is home to a variety of wildlife, including deer, elk, and black bears.
The climate in Chenoweth is mild and temperate, with warm summers and cool winters. The average annual temperature is around 50 degrees Fahrenheit, and the average annual precipitation is around 40 inches.
Economy
The economy of Chenoweth is primarily based on agriculture and tourism. The area is home to several farms, which produce a variety of crops, including apples, pears, and cherries. The area is also popular with tourists, who come to enjoy the scenic beauty and outdoor activities.
In addition to agriculture and tourism, Chenoweth is home to a variety of small businesses, including restaurants, shops, and services. The community is also home to a number of light industrial businesses, which provide employment opportunities for local residents.
Demographics
As of the 2010 census, the population of Chenoweth was 1,000. The population is primarily white (94.2%), with a small minority population (5.8%). The median household income is $50,000, and the median age is 44.
Chenoweth is a small, rural community with a strong sense of community and a unique atmosphere. The area is known for its scenic beauty and outdoor activities, and is a popular destination for tourists and locals alike. The community is home to a variety of businesses, and provides employment opportunities for local residents.
Common Questions
What is Per Capita Income in Chenoweth?
Per Capita income in Chenoweth is $33,971.
What is the Median Family Income in Chenoweth?
Median Family Income in Chenoweth is $69,828.
What is the Median Household income in Chenoweth?
Median Household Income in Chenoweth is $59,148.
What is Income or Wage Gap in Chenoweth?
Income or Wage Gap in Chenoweth is 44.8%.
Women in Chenoweth earn 55.2 cents for every dollar earned by a man.
What is Inequality or Gini Index in Chenoweth?
Inequality or Gini Index in Chenoweth is 0.43.
What is the Total Population of Chenoweth?
Total Population of Chenoweth is 1,717.
What is the Total Male Population of Chenoweth?
Total Male Population of Chenoweth is 970.
What is the Total Female Population of Chenoweth?
Total Female Population of Chenoweth is 747.
What is the Ratio of Males per 100 Females in Chenoweth?
There are 129.85 Males per 100 Females in Chenoweth.
What is the Ratio of Females per 100 Males in Chenoweth?
There are 77.01 Females per 100 Males in Chenoweth.
What is the Median Population Age in Chenoweth?
Median Population Age in Chenoweth is 35.9 Years.
What is the Average Family Size in Chenoweth
Average Family Size in Chenoweth is 3.0 People.
What is the Average Household Size in Chenoweth
Average Household Size in Chenoweth is 2.5 People.
How Large is the Labor Force in Chenoweth?
There are 863 People in the Labor Forcein in Chenoweth.
What is the Percentage of People in the Labor Force in Chenoweth?
66.0% of People are in the Labor Force in Chenoweth.
What is the Unemployment Rate in Chenoweth?
Unemployment Rate in Chenoweth is 12.9%.