Bull Mountain, OR Map & Demographics
Bull Mountain Map
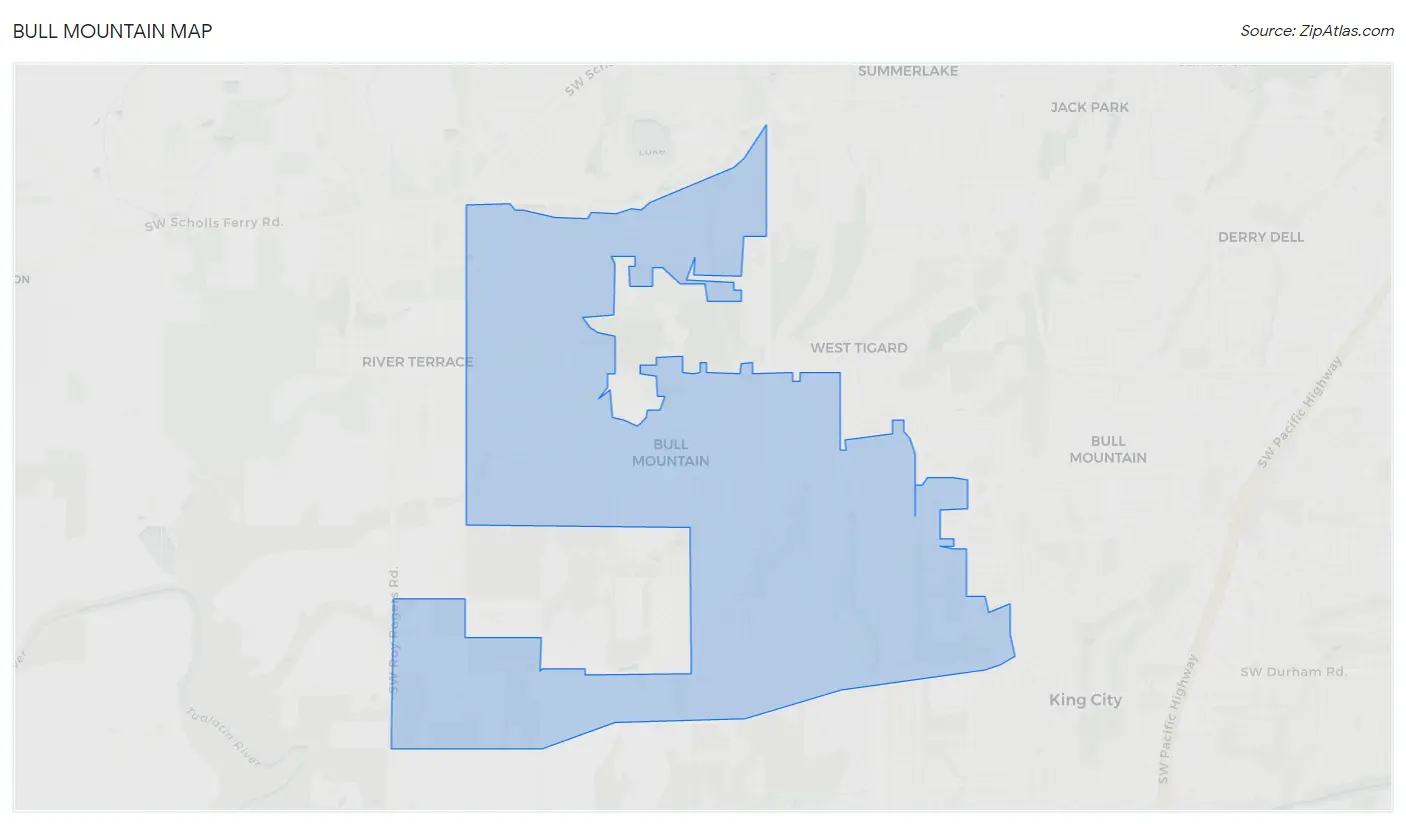
Bull Mountain Overview
$59,121
PER CAPITA INCOME
$162,802
AVG FAMILY INCOME
$150,739
AVG HOUSEHOLD INCOME
33.2%
WAGE / INCOME GAP [ % ]
66.8¢/ $1
WAGE / INCOME GAP [ $ ]
0.37
INEQUALITY / GINI INDEX
9,319
TOTAL POPULATION
4,548
MALE POPULATION
4,771
FEMALE POPULATION
95.33
MALES / 100 FEMALES
104.90
FEMALES / 100 MALES
41.3
MEDIAN AGE
3.2
AVG FAMILY SIZE
2.9
AVG HOUSEHOLD SIZE
5,356
LABOR FORCE [ PEOPLE ]
73.9%
PERCENT IN LABOR FORCE
2.1%
UNEMPLOYMENT RATE
Income in Bull Mountain
Income Overview in Bull Mountain
Per Capita Income in Bull Mountain is $59,121, while median incomes of families and households are $162,802 and $150,739 respectively.
| Characteristic | Number | Measure |
| Per Capita Income | 9,319 | $59,121 |
| Median Family Income | 2,590 | $162,802 |
| Mean Family Income | 2,590 | $185,257 |
| Median Household Income | 3,215 | $150,739 |
| Mean Household Income | 3,215 | $166,703 |
| Income Deficit | 2,590 | $0 |
| Wage / Income Gap (%) | 9,319 | 33.21% |
| Wage / Income Gap ($) | 9,319 | 66.79¢ per $1 |
| Gini / Inequality Index | 9,319 | 0.37 |
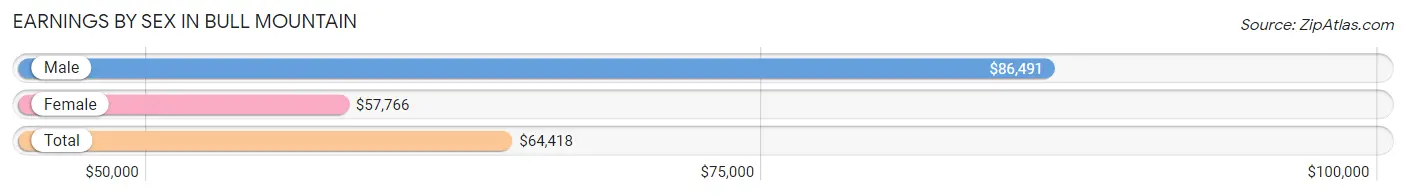
Earnings by Sex in Bull Mountain
Average Earnings in Bull Mountain are $64,418, $86,491 for men and $57,766 for women, a difference of 33.2%.
| Sex | Number | Average Earnings |
| Male | 2,890 (52.2%) | $86,491 |
| Female | 2,642 (47.8%) | $57,766 |
| Total | 5,532 (100.0%) | $64,418 |
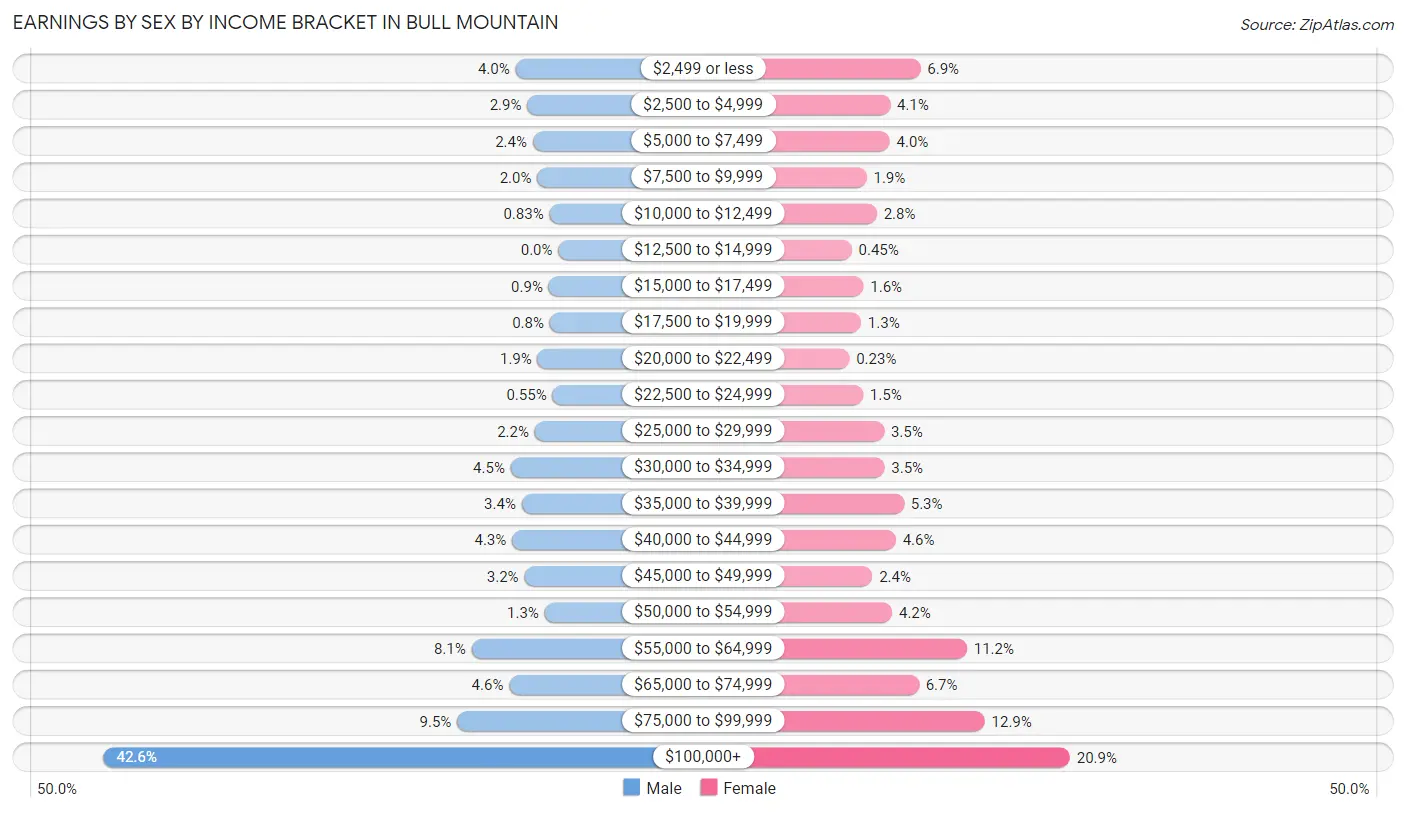
Earnings by Sex by Income Bracket in Bull Mountain
The most common earnings brackets in Bull Mountain are $100,000+ for men (1,231 | 42.6%) and $100,000+ for women (552 | 20.9%).
| Income | Male | Female |
| $2,499 or less | 116 (4.0%) | 182 (6.9%) |
| $2,500 to $4,999 | 84 (2.9%) | 107 (4.1%) |
| $5,000 to $7,499 | 69 (2.4%) | 106 (4.0%) |
| $7,500 to $9,999 | 57 (2.0%) | 49 (1.8%) |
| $10,000 to $12,499 | 24 (0.8%) | 74 (2.8%) |
| $12,500 to $14,999 | 0 (0.0%) | 12 (0.4%) |
| $15,000 to $17,499 | 26 (0.9%) | 41 (1.5%) |
| $17,500 to $19,999 | 23 (0.8%) | 35 (1.3%) |
| $20,000 to $22,499 | 56 (1.9%) | 6 (0.2%) |
| $22,500 to $24,999 | 16 (0.5%) | 40 (1.5%) |
| $25,000 to $29,999 | 64 (2.2%) | 92 (3.5%) |
| $30,000 to $34,999 | 129 (4.5%) | 93 (3.5%) |
| $35,000 to $39,999 | 99 (3.4%) | 141 (5.3%) |
| $40,000 to $44,999 | 125 (4.3%) | 121 (4.6%) |
| $45,000 to $49,999 | 92 (3.2%) | 63 (2.4%) |
| $50,000 to $54,999 | 37 (1.3%) | 112 (4.2%) |
| $55,000 to $64,999 | 235 (8.1%) | 297 (11.2%) |
| $65,000 to $74,999 | 133 (4.6%) | 178 (6.7%) |
| $75,000 to $99,999 | 274 (9.5%) | 341 (12.9%) |
| $100,000+ | 1,231 (42.6%) | 552 (20.9%) |
| Total | 2,890 (100.0%) | 2,642 (100.0%) |
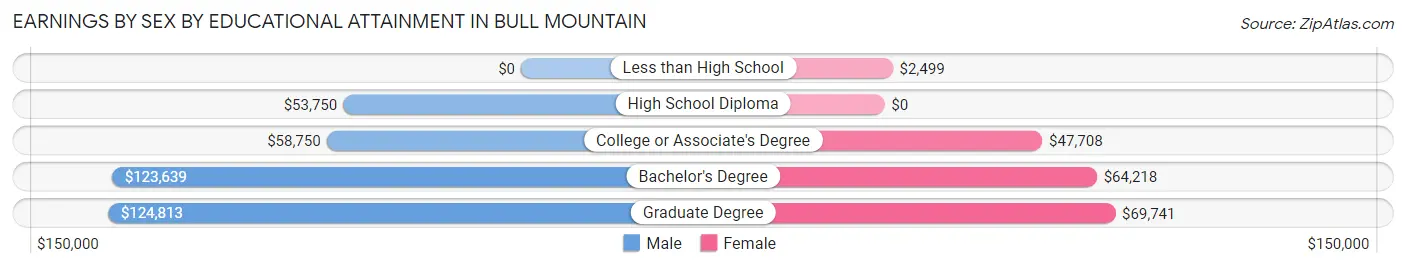
Earnings by Sex by Educational Attainment in Bull Mountain
Average earnings in Bull Mountain are $103,004 for men and $62,939 for women, a difference of 38.9%. Men with an educational attainment of graduate degree enjoy the highest average annual earnings of $124,813, while those with high school diploma education earn the least with $53,750. Women with an educational attainment of graduate degree earn the most with the average annual earnings of $69,741, while those with less than high school education have the smallest earnings of $2,499.
| Educational Attainment | Male Income | Female Income |
| Less than High School | - | - |
| High School Diploma | $53,750 | $0 |
| College or Associate's Degree | $58,750 | $47,708 |
| Bachelor's Degree | $123,639 | $64,218 |
| Graduate Degree | $124,813 | $69,741 |
| Total | $103,004 | $62,939 |
Family Income in Bull Mountain
Family Income Brackets in Bull Mountain
According to the Bull Mountain family income data, there are 834 families falling into the $200,000+ income range, which is the most common income bracket and makes up 32.2% of all families.
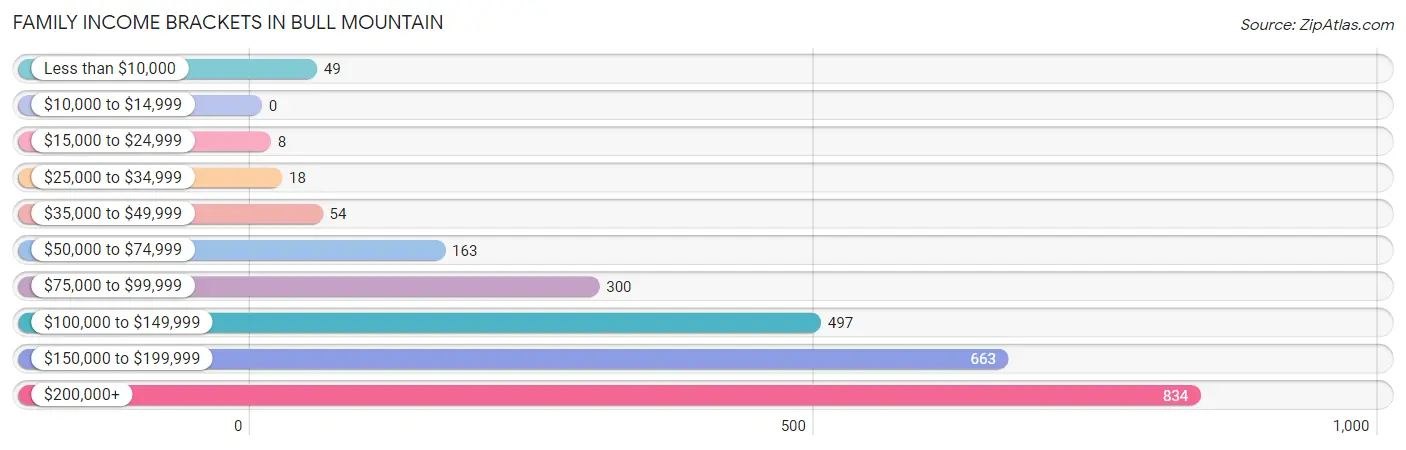
| Income Bracket | # Families | % Families |
| Less than $10,000 | 49 | 1.9% |
| $10,000 to $14,999 | 0 | 0.0% |
| $15,000 to $24,999 | 8 | 0.3% |
| $25,000 to $34,999 | 18 | 0.7% |
| $35,000 to $49,999 | 54 | 2.1% |
| $50,000 to $74,999 | 163 | 6.3% |
| $75,000 to $99,999 | 300 | 11.6% |
| $100,000 to $149,999 | 497 | 19.2% |
| $150,000 to $199,999 | 663 | 25.6% |
| $200,000+ | 834 | 32.2% |
Family Income by Famaliy Size in Bull Mountain
4-person families (532 | 20.5%) account for the highest median family income in Bull Mountain with $184,737 per family, while 2-person families (1,072 | 41.4%) have the highest median income of $68,125 per family member.
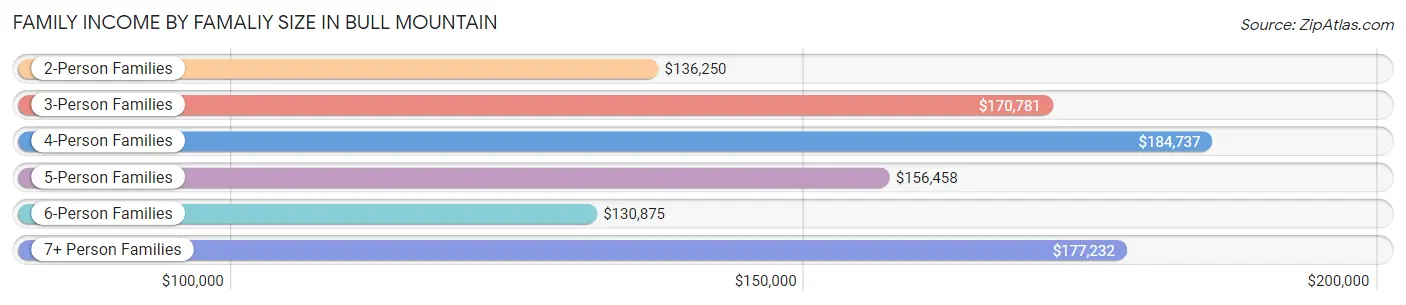
| Income Bracket | # Families | Median Income |
| 2-Person Families | 1,072 (41.4%) | $136,250 |
| 3-Person Families | 636 (24.6%) | $170,781 |
| 4-Person Families | 532 (20.5%) | $184,737 |
| 5-Person Families | 286 (11.0%) | $156,458 |
| 6-Person Families | 39 (1.5%) | $130,875 |
| 7+ Person Families | 25 (1.0%) | $177,232 |
| Total | 2,590 (100.0%) | $162,802 |
Family Income by Number of Earners in Bull Mountain
The median family income in Bull Mountain is $162,802, with families comprising 2 earners (1,417) having the highest median family income of $174,613, while families with no earners (247) have the lowest median family income of $98,050, accounting for 54.7% and 9.5% of families, respectively.
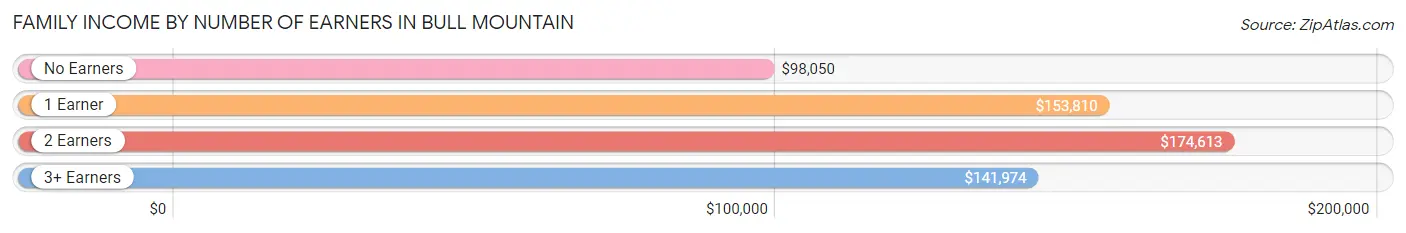
| Number of Earners | # Families | Median Income |
| No Earners | 247 (9.5%) | $98,050 |
| 1 Earner | 562 (21.7%) | $153,810 |
| 2 Earners | 1,417 (54.7%) | $174,613 |
| 3+ Earners | 364 (14.1%) | $141,974 |
| Total | 2,590 (100.0%) | $162,802 |
Household Income in Bull Mountain
Household Income Brackets in Bull Mountain
With 891 households falling in the category, the $200,000+ income range is the most frequent in Bull Mountain, accounting for 27.7% of all households. In contrast, only 6 households (0.2%) fall into the $10,000 to $14,999 income bracket, making it the least populous group.
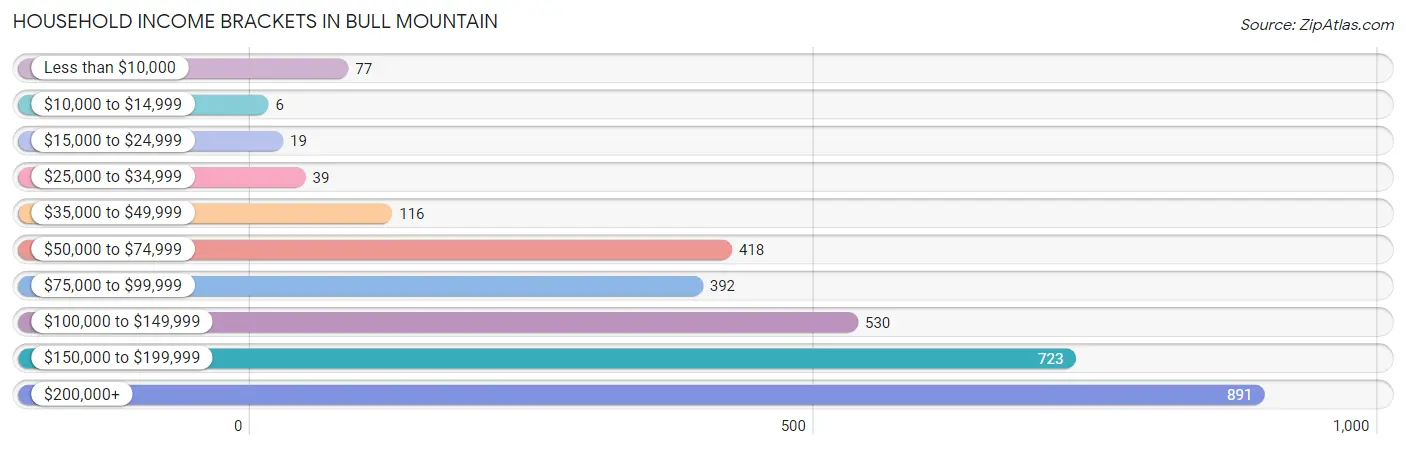
| Income Bracket | # Households | % Households |
| Less than $10,000 | 77 | 2.4% |
| $10,000 to $14,999 | 6 | 0.2% |
| $15,000 to $24,999 | 19 | 0.6% |
| $25,000 to $34,999 | 39 | 1.2% |
| $35,000 to $49,999 | 116 | 3.6% |
| $50,000 to $74,999 | 418 | 13.0% |
| $75,000 to $99,999 | 392 | 12.2% |
| $100,000 to $149,999 | 530 | 16.5% |
| $150,000 to $199,999 | 723 | 22.5% |
| $200,000+ | 891 | 27.7% |
Household Income by Householder Age in Bull Mountain
The median household income in Bull Mountain is $150,739, with the highest median household income of $169,375 found in the 25 to 44 years age bracket for the primary householder. A total of 1,039 households (32.3%) fall into this category. Meanwhile, the 15 to 24 years age bracket for the primary householder has the lowest median household income of $60,104, with 63 households (2.0%) in this group.
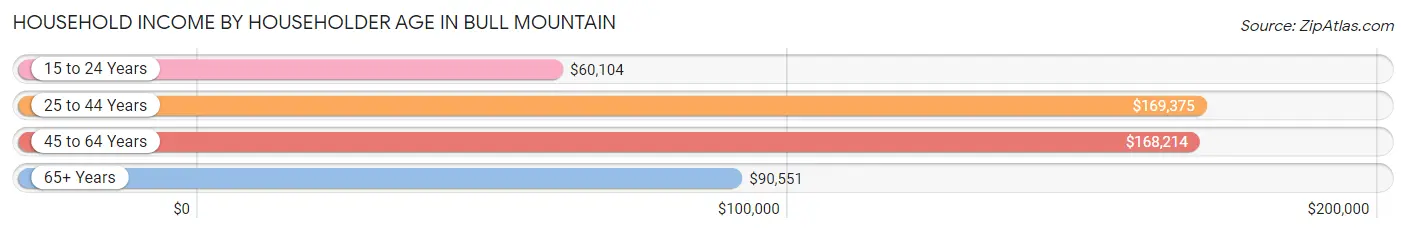
| Income Bracket | # Households | Median Income |
| 15 to 24 Years | 63 (2.0%) | $60,104 |
| 25 to 44 Years | 1,039 (32.3%) | $169,375 |
| 45 to 64 Years | 1,344 (41.8%) | $168,214 |
| 65+ Years | 769 (23.9%) | $90,551 |
| Total | 3,215 (100.0%) | $150,739 |
Poverty in Bull Mountain
Income Below Poverty by Sex and Age in Bull Mountain
With 4.8% poverty level for males and 5.1% for females among the residents of Bull Mountain, 12 to 14 year old males and 18 to 24 year old females are the most vulnerable to poverty, with 38 males (11.2%) and 88 females (40.2%) in their respective age groups living below the poverty level.
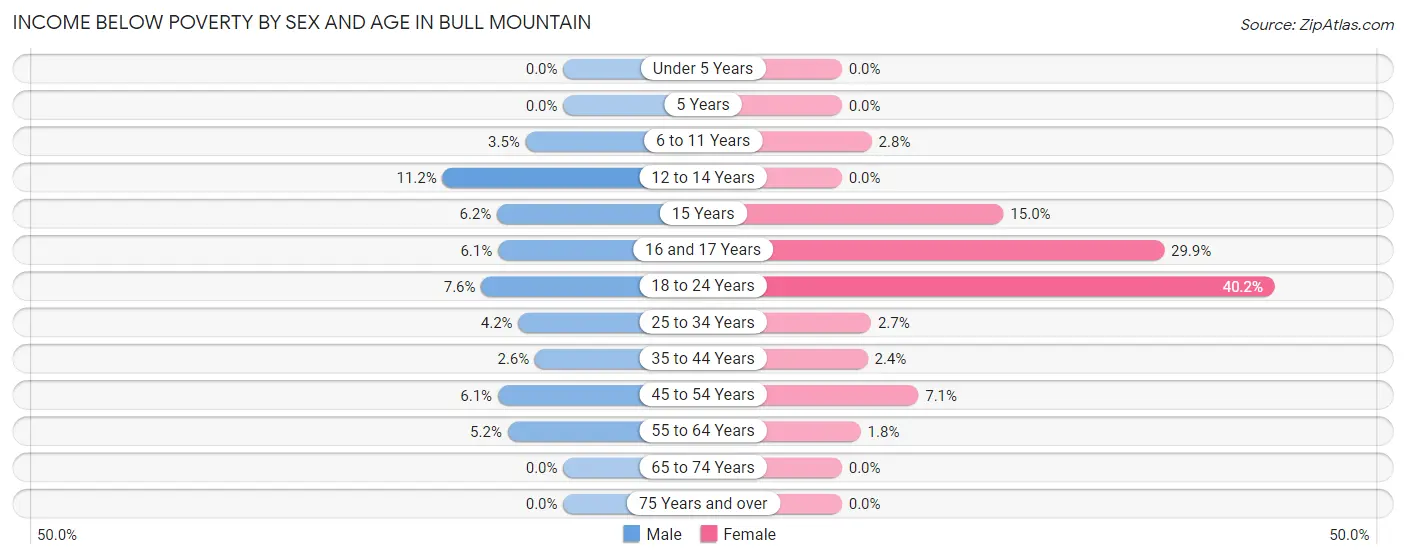
| Age Bracket | Male | Female |
| Under 5 Years | 0 (0.0%) | 0 (0.0%) |
| 5 Years | 0 (0.0%) | 0 (0.0%) |
| 6 to 11 Years | 12 (3.5%) | 11 (2.8%) |
| 12 to 14 Years | 38 (11.2%) | 0 (0.0%) |
| 15 Years | 12 (6.1%) | 18 (15.0%) |
| 16 and 17 Years | 10 (6.1%) | 35 (29.9%) |
| 18 to 24 Years | 36 (7.6%) | 88 (40.2%) |
| 25 to 34 Years | 16 (4.2%) | 13 (2.7%) |
| 35 to 44 Years | 17 (2.6%) | 19 (2.4%) |
| 45 to 54 Years | 41 (6.1%) | 48 (7.1%) |
| 55 to 64 Years | 38 (5.2%) | 12 (1.8%) |
| 65 to 74 Years | 0 (0.0%) | 0 (0.0%) |
| 75 Years and over | 0 (0.0%) | 0 (0.0%) |
| Total | 220 (4.8%) | 244 (5.1%) |
Income Above Poverty by Sex and Age in Bull Mountain
According to the poverty statistics in Bull Mountain, males aged under 5 years and females aged under 5 years are the age groups that are most secure financially, with 100.0% of males and 100.0% of females in these age groups living above the poverty line.
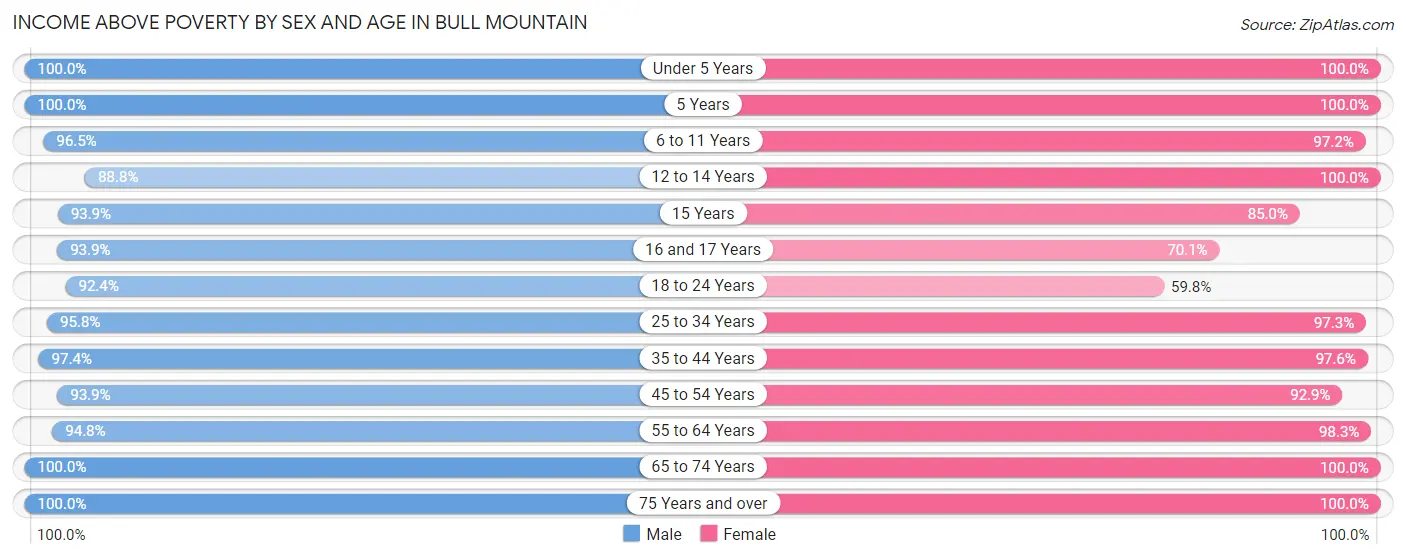
| Age Bracket | Male | Female |
| Under 5 Years | 100 (100.0%) | 257 (100.0%) |
| 5 Years | 34 (100.0%) | 83 (100.0%) |
| 6 to 11 Years | 331 (96.5%) | 386 (97.2%) |
| 12 to 14 Years | 301 (88.8%) | 187 (100.0%) |
| 15 Years | 183 (93.9%) | 102 (85.0%) |
| 16 and 17 Years | 155 (93.9%) | 82 (70.1%) |
| 18 to 24 Years | 437 (92.4%) | 131 (59.8%) |
| 25 to 34 Years | 368 (95.8%) | 467 (97.3%) |
| 35 to 44 Years | 632 (97.4%) | 776 (97.6%) |
| 45 to 54 Years | 635 (93.9%) | 628 (92.9%) |
| 55 to 64 Years | 699 (94.8%) | 675 (98.3%) |
| 65 to 74 Years | 360 (100.0%) | 629 (100.0%) |
| 75 Years and over | 93 (100.0%) | 108 (100.0%) |
| Total | 4,328 (95.2%) | 4,511 (94.9%) |
Income Below Poverty Among Married-Couple Families in Bull Mountain
The poverty statistics for married-couple families in Bull Mountain show that 1.4% or 32 of the total 2,287 families live below the poverty line. Families with 1 or 2 children have the highest poverty rate of 3.7%, comprising of 32 families. On the other hand, families with no children have the lowest poverty rate of 0.0%, which includes 0 families.
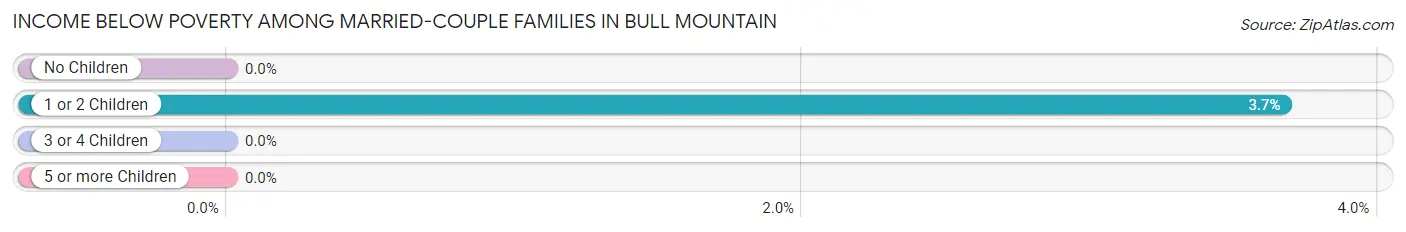
| Children | Above Poverty | Below Poverty |
| No Children | 1,198 (100.0%) | 0 (0.0%) |
| 1 or 2 Children | 839 (96.3%) | 32 (3.7%) |
| 3 or 4 Children | 204 (100.0%) | 0 (0.0%) |
| 5 or more Children | 14 (100.0%) | 0 (0.0%) |
| Total | 2,255 (98.6%) | 32 (1.4%) |
Income Below Poverty Among Single-Parent Households in Bull Mountain
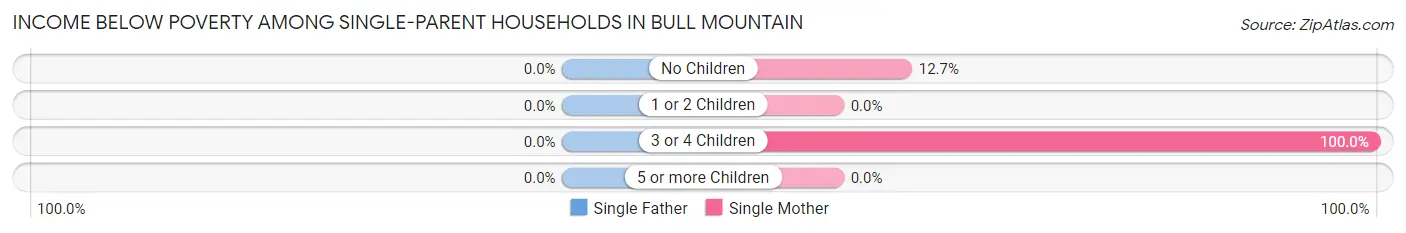
| Children | Single Father | Single Mother |
| No Children | 0 (0.0%) | 17 (12.7%) |
| 1 or 2 Children | 0 (0.0%) | 0 (0.0%) |
| 3 or 4 Children | 0 (0.0%) | 11 (100.0%) |
| 5 or more Children | 0 (0.0%) | 0 (0.0%) |
| Total | 0 (0.0%) | 28 (10.6%) |
Income Below Poverty Among Married-Couple vs Single-Parent Households in Bull Mountain
The poverty data for Bull Mountain shows that 32 of the married-couple family households (1.4%) and 28 of the single-parent households (9.2%) are living below the poverty level. Within the married-couple family households, those with 1 or 2 children have the highest poverty rate, with 32 households (3.7%) falling below the poverty line. Among the single-parent households, those with 3 or 4 children have the highest poverty rate, with 11 household (100.0%) living below poverty.
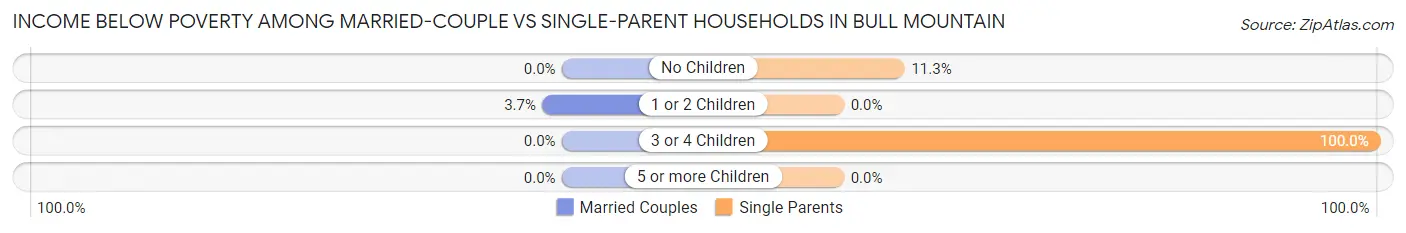
| Children | Married-Couple Families | Single-Parent Households |
| No Children | 0 (0.0%) | 17 (11.3%) |
| 1 or 2 Children | 32 (3.7%) | 0 (0.0%) |
| 3 or 4 Children | 0 (0.0%) | 11 (100.0%) |
| 5 or more Children | 0 (0.0%) | 0 (0.0%) |
| Total | 32 (1.4%) | 28 (9.2%) |
Race in Bull Mountain
The most populous races in Bull Mountain are White / Caucasian (7,447 | 79.9%), Asian (795 | 8.5%), and Two or more Races (446 | 4.8%).
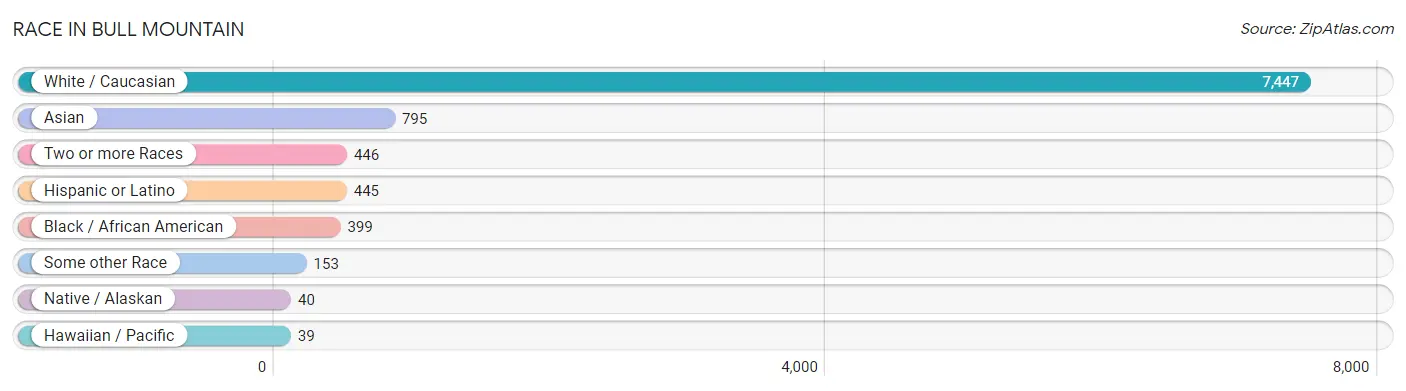
| Race | # Population | % Population |
| Asian | 795 | 8.5% |
| Black / African American | 399 | 4.3% |
| Hawaiian / Pacific | 39 | 0.4% |
| Hispanic or Latino | 445 | 4.8% |
| Native / Alaskan | 40 | 0.4% |
| White / Caucasian | 7,447 | 79.9% |
| Two or more Races | 446 | 4.8% |
| Some other Race | 153 | 1.6% |
| Total | 9,319 | 100.0% |
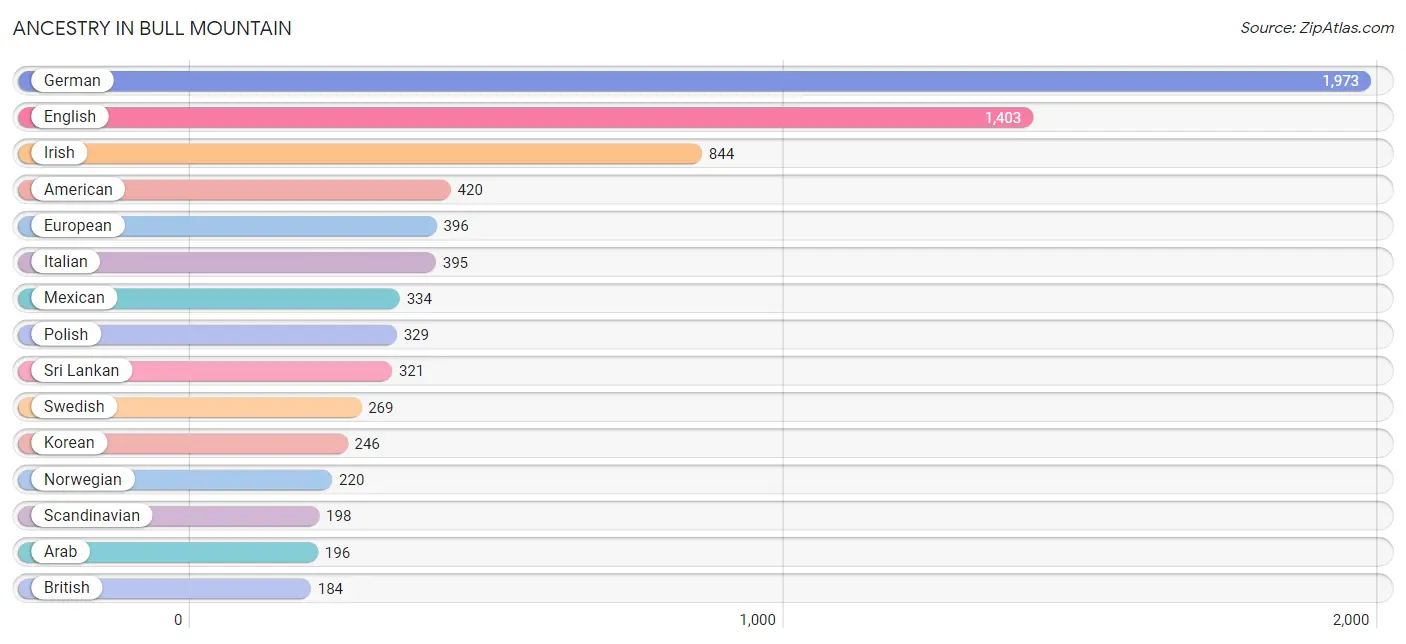
Ancestry in Bull Mountain
The most populous ancestries reported in Bull Mountain are German (1,973 | 21.2%), English (1,403 | 15.1%), Irish (844 | 9.1%), American (420 | 4.5%), and European (396 | 4.3%), together accounting for 54.0% of all Bull Mountain residents.
| Ancestry | # Population | % Population |
| African | 130 | 1.4% |
| American | 420 | 4.5% |
| Arab | 196 | 2.1% |
| Austrian | 10 | 0.1% |
| Basque | 12 | 0.1% |
| Bhutanese | 52 | 0.6% |
| Brazilian | 10 | 0.1% |
| British | 184 | 2.0% |
| Burmese | 45 | 0.5% |
| Canadian | 107 | 1.1% |
| Cherokee | 24 | 0.3% |
| Choctaw | 38 | 0.4% |
| Czech | 16 | 0.2% |
| Czechoslovakian | 46 | 0.5% |
| Danish | 148 | 1.6% |
| Dutch | 100 | 1.1% |
| Eastern European | 46 | 0.5% |
| Ecuadorian | 13 | 0.1% |
| English | 1,403 | 15.1% |
| European | 396 | 4.3% |
| Finnish | 75 | 0.8% |
| French | 160 | 1.7% |
| French Canadian | 19 | 0.2% |
| German | 1,973 | 21.2% |
| Greek | 20 | 0.2% |
| Haitian | 42 | 0.4% |
| Hungarian | 32 | 0.3% |
| Indian (Asian) | 113 | 1.2% |
| Iranian | 108 | 1.2% |
| Iraqi | 37 | 0.4% |
| Irish | 844 | 9.1% |
| Israeli | 77 | 0.8% |
| Italian | 395 | 4.2% |
| Jordanian | 102 | 1.1% |
| Korean | 246 | 2.6% |
| Lumbee | 24 | 0.3% |
| Malaysian | 12 | 0.1% |
| Mexican | 334 | 3.6% |
| Moroccan | 26 | 0.3% |
| Native Hawaiian | 26 | 0.3% |
| Northern European | 85 | 0.9% |
| Norwegian | 220 | 2.4% |
| Pakistani | 82 | 0.9% |
| Palestinian | 24 | 0.3% |
| Polish | 329 | 3.5% |
| Portuguese | 78 | 0.8% |
| Puerto Rican | 23 | 0.3% |
| Romanian | 50 | 0.5% |
| Russian | 35 | 0.4% |
| Scandinavian | 198 | 2.1% |
| Scottish | 110 | 1.2% |
| Slovak | 13 | 0.1% |
| Slovene | 9 | 0.1% |
| South African | 15 | 0.2% |
| South American | 40 | 0.4% |
| Spaniard | 48 | 0.5% |
| Sri Lankan | 321 | 3.4% |
| Subsaharan African | 145 | 1.6% |
| Swedish | 269 | 2.9% |
| Swiss | 85 | 0.9% |
| Thai | 84 | 0.9% |
| Ukrainian | 59 | 0.6% |
| Uruguayan | 15 | 0.2% |
| Venezuelan | 12 | 0.1% |
| Welsh | 107 | 1.1% | View All 65 Rows |
Immigrants in Bull Mountain
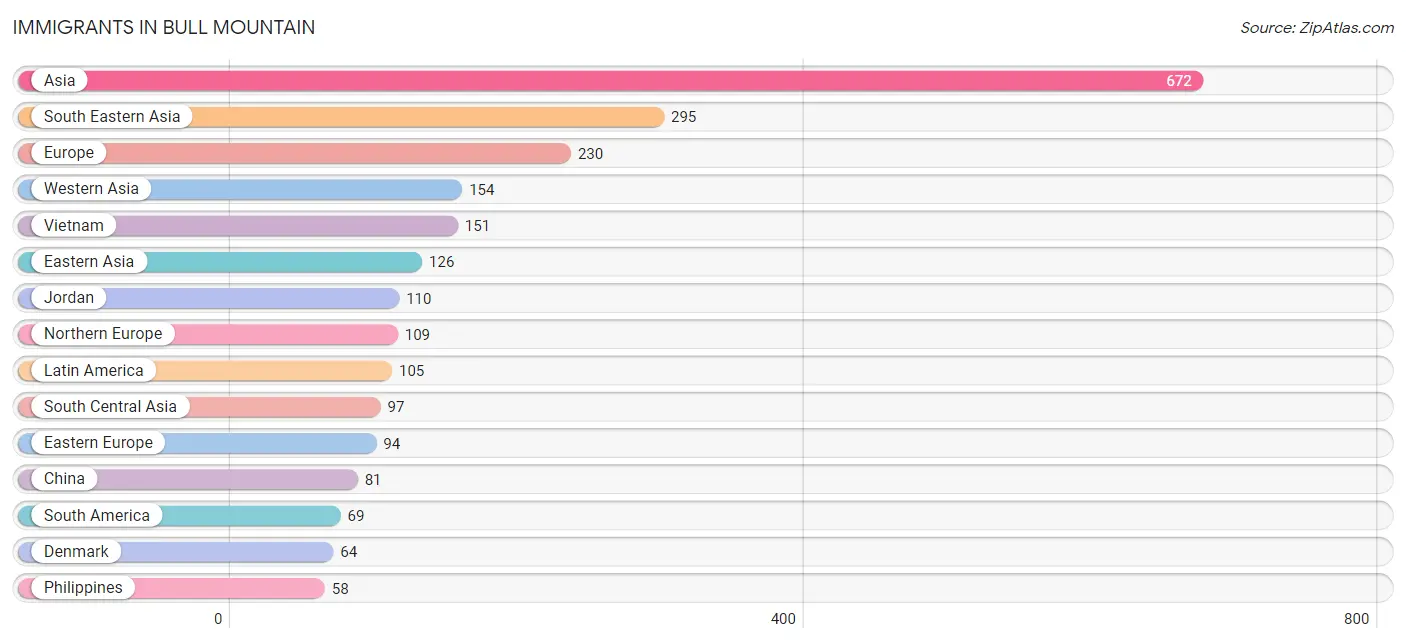
The most numerous immigrant groups reported in Bull Mountain came from Asia (672 | 7.2%), South Eastern Asia (295 | 3.2%), Europe (230 | 2.5%), Western Asia (154 | 1.7%), and Vietnam (151 | 1.6%), together accounting for 16.1% of all Bull Mountain residents.
| Immigration Origin | # Population | % Population |
| Africa | 42 | 0.4% |
| Asia | 672 | 7.2% |
| Brazil | 21 | 0.2% |
| Cambodia | 21 | 0.2% |
| Canada | 51 | 0.5% |
| Central America | 36 | 0.4% |
| Chile | 20 | 0.2% |
| China | 81 | 0.9% |
| Denmark | 64 | 0.7% |
| Eastern Asia | 126 | 1.3% |
| Eastern Europe | 94 | 1.0% |
| Ecuador | 13 | 0.1% |
| England | 23 | 0.3% |
| Europe | 230 | 2.5% |
| France | 18 | 0.2% |
| Germany | 9 | 0.1% |
| Hong Kong | 22 | 0.2% |
| India | 43 | 0.5% |
| Indonesia | 39 | 0.4% |
| Iran | 31 | 0.3% |
| Iraq | 17 | 0.2% |
| Israel | 27 | 0.3% |
| Jordan | 110 | 1.2% |
| Korea | 45 | 0.5% |
| Latin America | 105 | 1.1% |
| Mexico | 36 | 0.4% |
| Morocco | 6 | 0.1% |
| Nigeria | 29 | 0.3% |
| Northern Africa | 13 | 0.1% |
| Northern Europe | 109 | 1.2% |
| Norway | 9 | 0.1% |
| Pakistan | 15 | 0.2% |
| Philippines | 58 | 0.6% |
| Poland | 26 | 0.3% |
| Romania | 50 | 0.5% |
| South America | 69 | 0.7% |
| South Central Asia | 97 | 1.0% |
| South Eastern Asia | 295 | 3.2% |
| Sri Lanka | 8 | 0.1% |
| Thailand | 26 | 0.3% |
| Ukraine | 18 | 0.2% |
| Uruguay | 15 | 0.2% |
| Vietnam | 151 | 1.6% |
| Western Africa | 29 | 0.3% |
| Western Asia | 154 | 1.7% |
| Western Europe | 27 | 0.3% | View All 46 Rows |
Sex and Age in Bull Mountain
Sex and Age in Bull Mountain
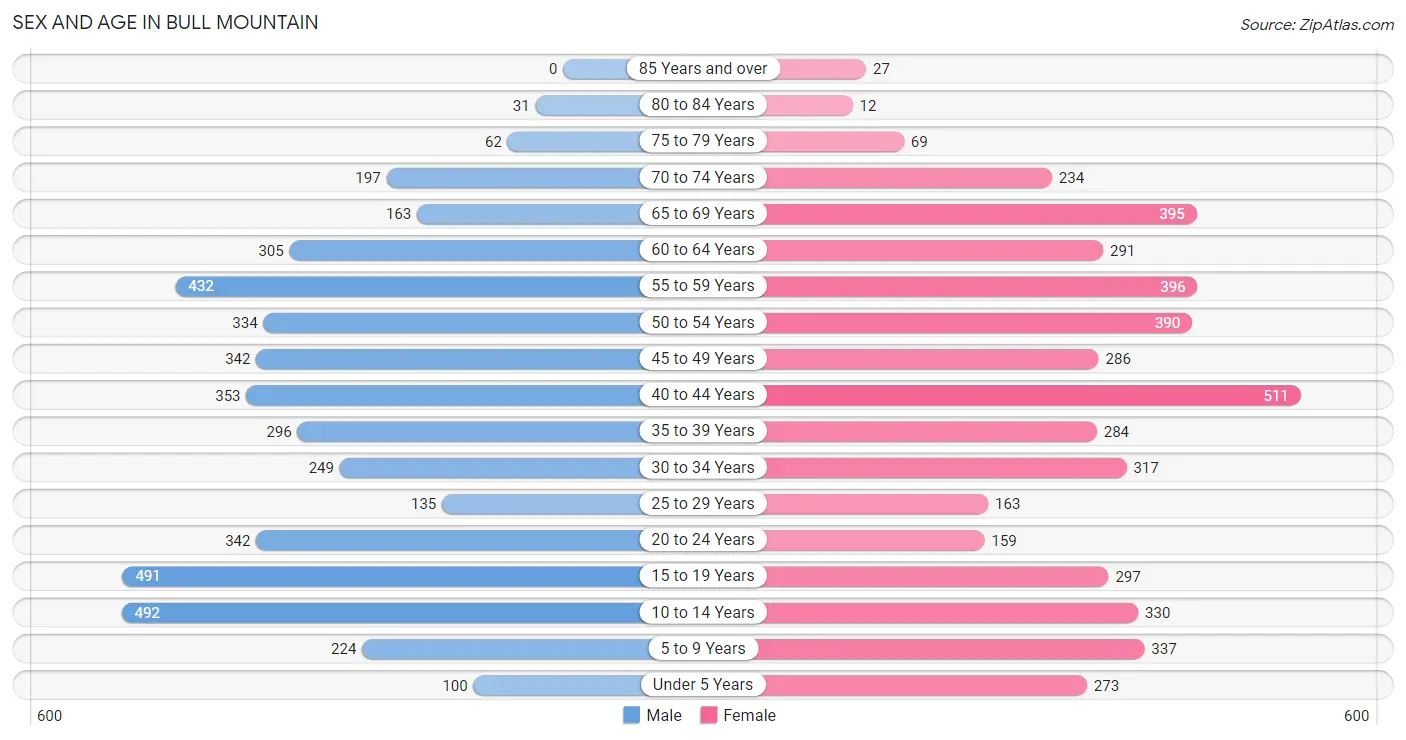
The most populous age groups in Bull Mountain are 10 to 14 Years (492 | 10.8%) for men and 40 to 44 Years (511 | 10.7%) for women.
| Age Bracket | Male | Female |
| Under 5 Years | 100 (2.2%) | 273 (5.7%) |
| 5 to 9 Years | 224 (4.9%) | 337 (7.1%) |
| 10 to 14 Years | 492 (10.8%) | 330 (6.9%) |
| 15 to 19 Years | 491 (10.8%) | 297 (6.2%) |
| 20 to 24 Years | 342 (7.5%) | 159 (3.3%) |
| 25 to 29 Years | 135 (3.0%) | 163 (3.4%) |
| 30 to 34 Years | 249 (5.5%) | 317 (6.6%) |
| 35 to 39 Years | 296 (6.5%) | 284 (5.9%) |
| 40 to 44 Years | 353 (7.8%) | 511 (10.7%) |
| 45 to 49 Years | 342 (7.5%) | 286 (6.0%) |
| 50 to 54 Years | 334 (7.3%) | 390 (8.2%) |
| 55 to 59 Years | 432 (9.5%) | 396 (8.3%) |
| 60 to 64 Years | 305 (6.7%) | 291 (6.1%) |
| 65 to 69 Years | 163 (3.6%) | 395 (8.3%) |
| 70 to 74 Years | 197 (4.3%) | 234 (4.9%) |
| 75 to 79 Years | 62 (1.4%) | 69 (1.5%) |
| 80 to 84 Years | 31 (0.7%) | 12 (0.3%) |
| 85 Years and over | 0 (0.0%) | 27 (0.6%) |
| Total | 4,548 (100.0%) | 4,771 (100.0%) |
Families and Households in Bull Mountain
Median Family Size in Bull Mountain
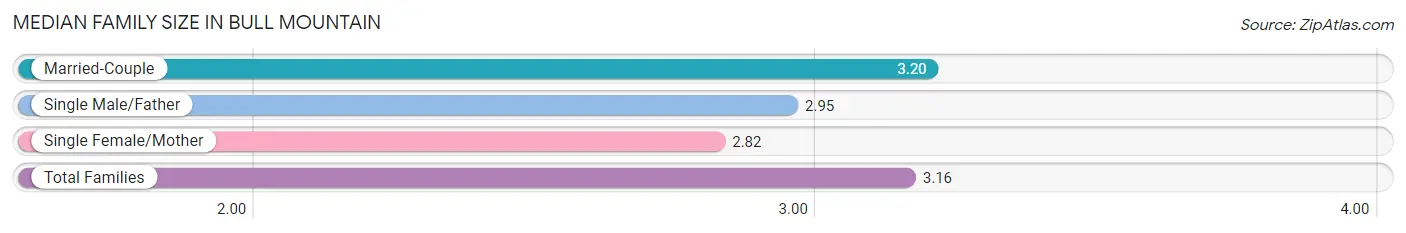
The median family size in Bull Mountain is 3.16 persons per family, with married-couple families (2,287 | 88.3%) accounting for the largest median family size of 3.2 persons per family. On the other hand, single female/mother families (263 | 10.2%) represent the smallest median family size with 2.82 persons per family.
| Family Type | # Families | Family Size |
| Married-Couple | 2,287 (88.3%) | 3.20 |
| Single Male/Father | 40 (1.5%) | 2.95 |
| Single Female/Mother | 263 (10.2%) | 2.82 |
| Total Families | 2,590 (100.0%) | 3.16 |
Median Household Size in Bull Mountain
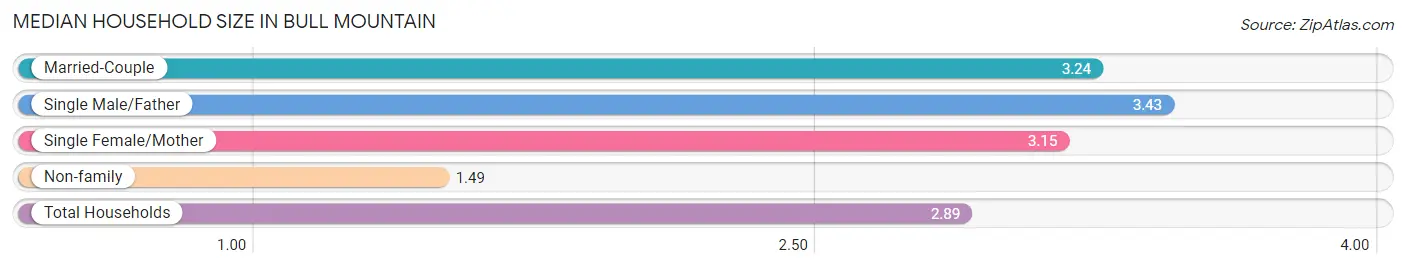
The median household size in Bull Mountain is 2.89 persons per household, with single male/father households (40 | 1.2%) accounting for the largest median household size of 3.43 persons per household. non-family households (625 | 19.4%) represent the smallest median household size with 1.49 persons per household.
| Household Type | # Households | Household Size |
| Married-Couple | 2,287 (71.1%) | 3.24 |
| Single Male/Father | 40 (1.2%) | 3.43 |
| Single Female/Mother | 263 (8.2%) | 3.15 |
| Non-family | 625 (19.4%) | 1.49 |
| Total Households | 3,215 (100.0%) | 2.89 |
Household Size by Marriage Status in Bull Mountain
Out of a total of 3,215 households in Bull Mountain, 2,590 (80.6%) are family households, while 625 (19.4%) are nonfamily households. The most numerous type of family households are 2-person households, comprising 1,032, and the most common type of nonfamily households are 1-person households, comprising 464.
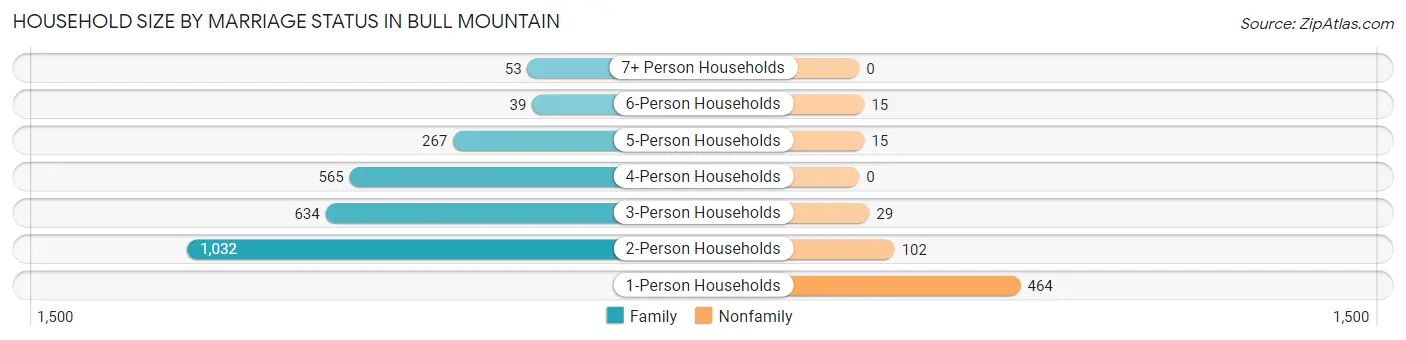
| Household Size | Family Households | Nonfamily Households |
| 1-Person Households | - | 464 (14.4%) |
| 2-Person Households | 1,032 (32.1%) | 102 (3.2%) |
| 3-Person Households | 634 (19.7%) | 29 (0.9%) |
| 4-Person Households | 565 (17.6%) | 0 (0.0%) |
| 5-Person Households | 267 (8.3%) | 15 (0.5%) |
| 6-Person Households | 39 (1.2%) | 15 (0.5%) |
| 7+ Person Households | 53 (1.7%) | 0 (0.0%) |
| Total | 2,590 (80.6%) | 625 (19.4%) |
Female Fertility in Bull Mountain
Fertility by Age in Bull Mountain
Average fertility rate in Bull Mountain is 36.0 births per 1,000 women. Women in the age bracket of 20 to 34 years have the highest fertility rate with 80.0 births per 1,000 women. Women in the age bracket of 20 to 34 years acount for 69.9% of all women with births.
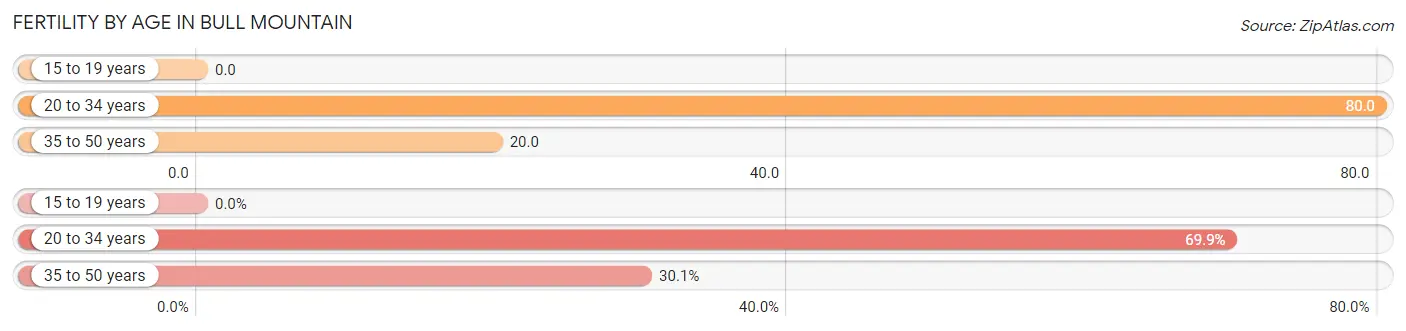
| Age Bracket | Women with Births | Births / 1,000 Women |
| 15 to 19 years | 0 (0.0%) | 0.0 |
| 20 to 34 years | 51 (69.9%) | 80.0 |
| 35 to 50 years | 22 (30.1%) | 20.0 |
| Total | 73 (100.0%) | 36.0 |
Fertility by Age by Marriage Status in Bull Mountain
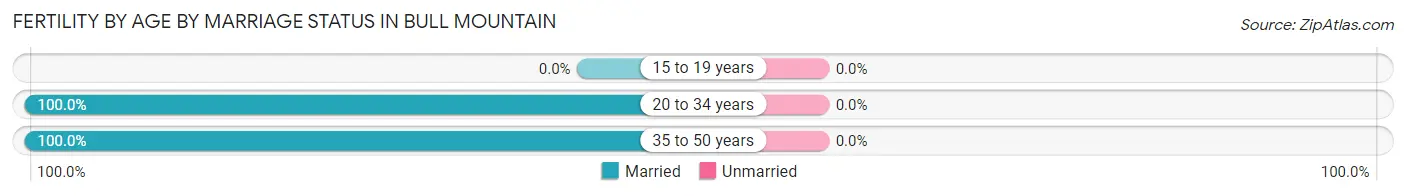
| Age Bracket | Married | Unmarried |
| 15 to 19 years | 0 (0.0%) | 0 (0.0%) |
| 20 to 34 years | 51 (100.0%) | 0 (0.0%) |
| 35 to 50 years | 22 (100.0%) | 0 (0.0%) |
| Total | 73 (100.0%) | 0 (0.0%) |
Fertility by Education in Bull Mountain
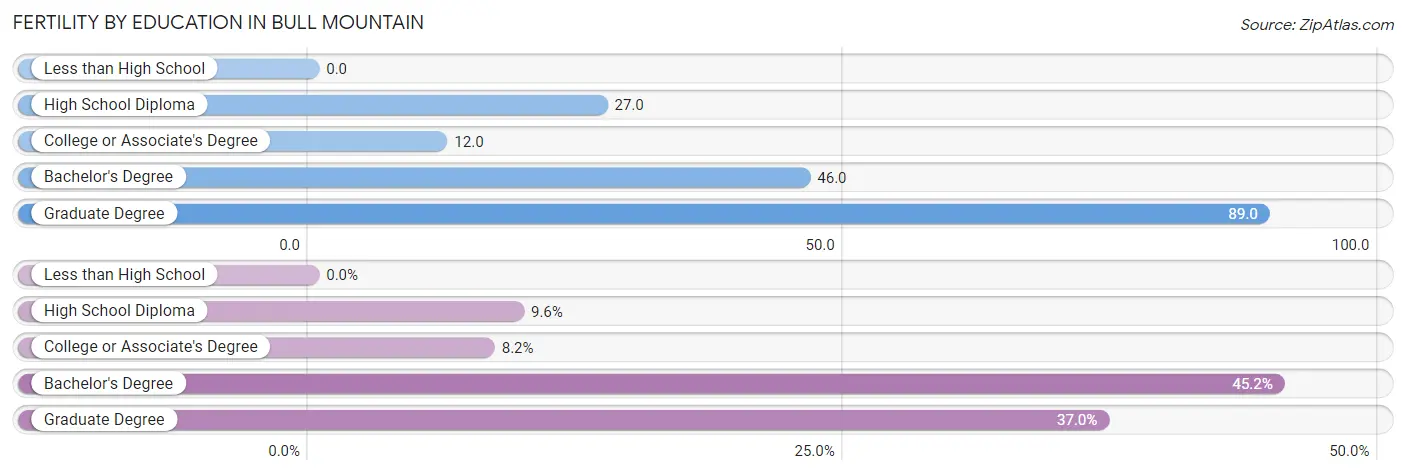
| Educational Attainment | Women with Births | Births / 1,000 Women |
| Less than High School | 0 (0.0%) | 0.0 |
| High School Diploma | 7 (9.6%) | 27.0 |
| College or Associate's Degree | 6 (8.2%) | 12.0 |
| Bachelor's Degree | 33 (45.2%) | 46.0 |
| Graduate Degree | 27 (37.0%) | 89.0 |
| Total | 73 (100.0%) | 36.0 |
Fertility by Education by Marriage Status in Bull Mountain
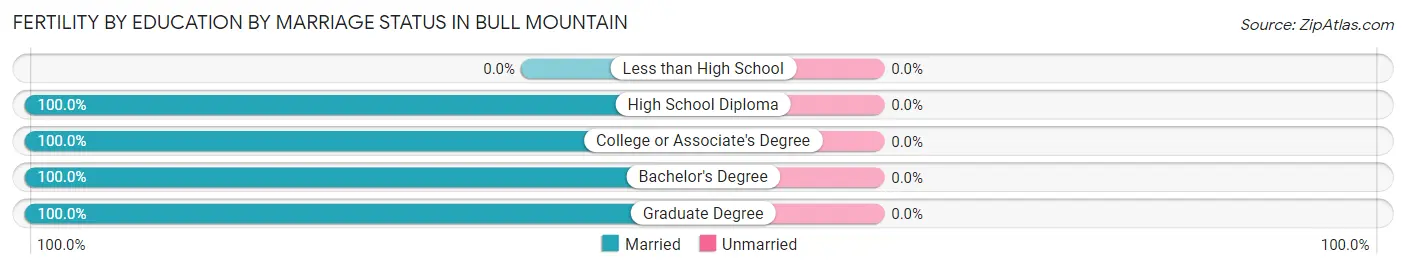
| Educational Attainment | Married | Unmarried |
| Less than High School | 0 (0.0%) | 0 (0.0%) |
| High School Diploma | 7 (100.0%) | 0 (0.0%) |
| College or Associate's Degree | 6 (100.0%) | 0 (0.0%) |
| Bachelor's Degree | 33 (100.0%) | 0 (0.0%) |
| Graduate Degree | 27 (100.0%) | 0 (0.0%) |
| Total | 73 (100.0%) | 0 (0.0%) |
Employment Characteristics in Bull Mountain
Employment by Class of Employer in Bull Mountain
Among the 5,196 employed individuals in Bull Mountain, private company employees (3,614 | 69.6%), not-for-profit organizations (386 | 7.4%), and self-employed (not incorporated) (348 | 6.7%) make up the most common classes of employment.
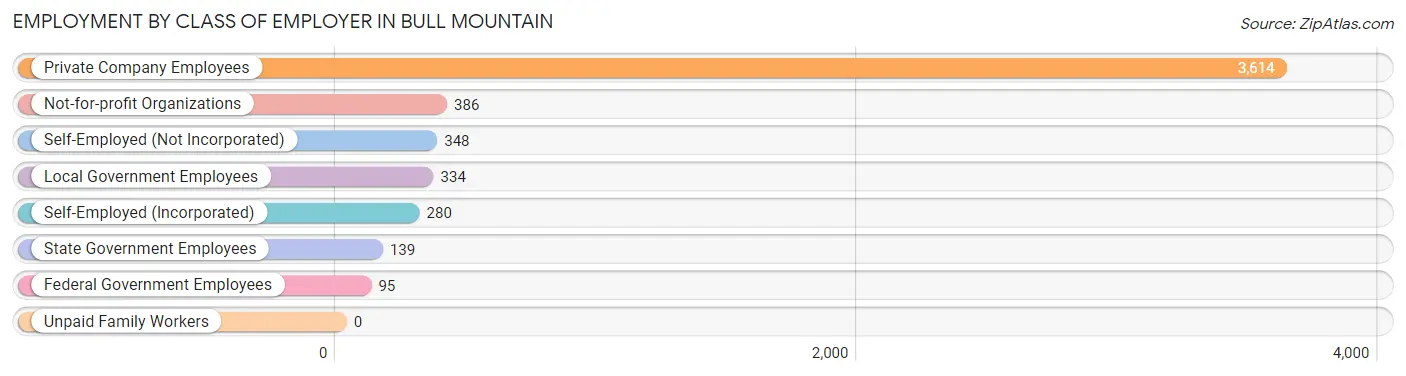
| Employer Class | # Employees | % Employees |
| Private Company Employees | 3,614 | 69.6% |
| Self-Employed (Incorporated) | 280 | 5.4% |
| Self-Employed (Not Incorporated) | 348 | 6.7% |
| Not-for-profit Organizations | 386 | 7.4% |
| Local Government Employees | 334 | 6.4% |
| State Government Employees | 139 | 2.7% |
| Federal Government Employees | 95 | 1.8% |
| Unpaid Family Workers | 0 | 0.0% |
| Total | 5,196 | 100.0% |
Employment Status by Age in Bull Mountain
According to the labor force statistics for Bull Mountain, out of the total population over 16 years of age (7,248), 73.9% or 5,356 individuals are in the labor force, with 2.1% or 112 of them unemployed. The age group with the highest labor force participation rate is 35 to 44 years, with 90.9% or 1,313 individuals in the labor force. Within the labor force, the 16 to 19 years age range has the highest percentage of unemployed individuals, with 31.1% or 50 of them being unemployed.
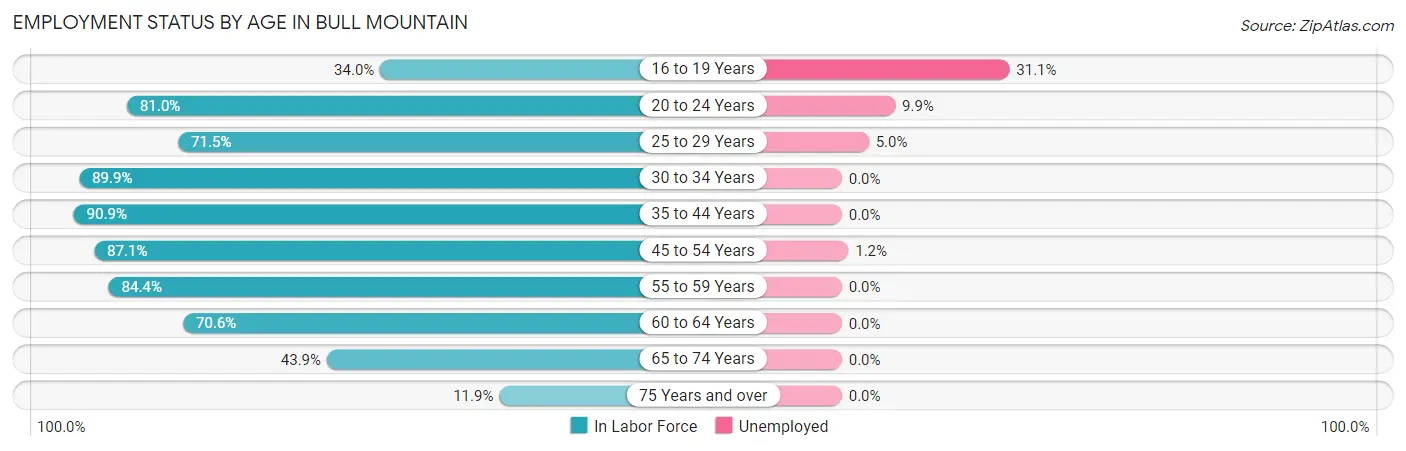
| Age Bracket | In Labor Force | Unemployed |
| 16 to 19 Years | 161 (34.0%) | 50 (31.1%) |
| 20 to 24 Years | 406 (81.0%) | 40 (9.9%) |
| 25 to 29 Years | 213 (71.5%) | 11 (5.0%) |
| 30 to 34 Years | 509 (89.9%) | 0 (0.0%) |
| 35 to 44 Years | 1,313 (90.9%) | 0 (0.0%) |
| 45 to 54 Years | 1,178 (87.1%) | 14 (1.2%) |
| 55 to 59 Years | 699 (84.4%) | 0 (0.0%) |
| 60 to 64 Years | 421 (70.6%) | 0 (0.0%) |
| 65 to 74 Years | 434 (43.9%) | 0 (0.0%) |
| 75 Years and over | 24 (11.9%) | 0 (0.0%) |
| Total | 5,356 (73.9%) | 112 (2.1%) |
Employment Status by Educational Attainment in Bull Mountain
According to labor force statistics for Bull Mountain, 85.2% of individuals (4,332) out of the total population between 25 and 64 years of age (5,084) are in the labor force, with 0.6% or 26 of them being unemployed. The group with the highest labor force participation rate are those with the educational attainment of college / associate degree, with 89.7% or 1,177 individuals in the labor force. Within the labor force, individuals with bachelor's degree or higher education have the highest percentage of unemployment, with 0.9% or 25 of them being unemployed.
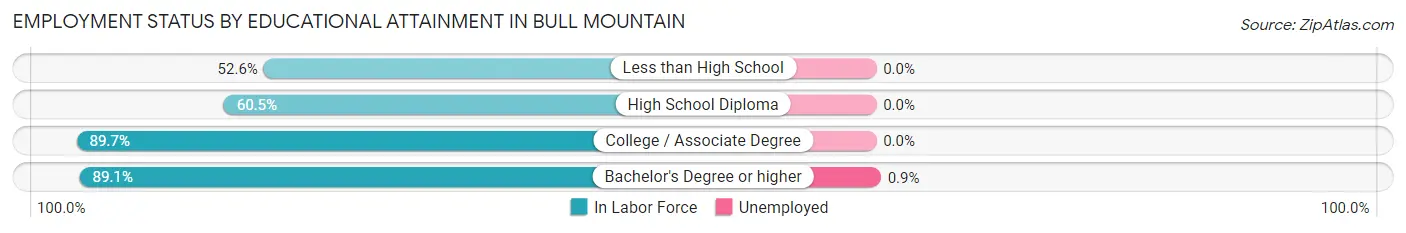
| Educational Attainment | In Labor Force | Unemployed |
| Less than High School | 91 (52.6%) | 0 (0.0%) |
| High School Diploma | 300 (60.5%) | 0 (0.0%) |
| College / Associate Degree | 1,177 (89.7%) | 0 (0.0%) |
| Bachelor's Degree or higher | 2,765 (89.1%) | 28 (0.9%) |
| Total | 4,332 (85.2%) | 31 (0.6%) |
Employment Occupations by Sex in Bull Mountain
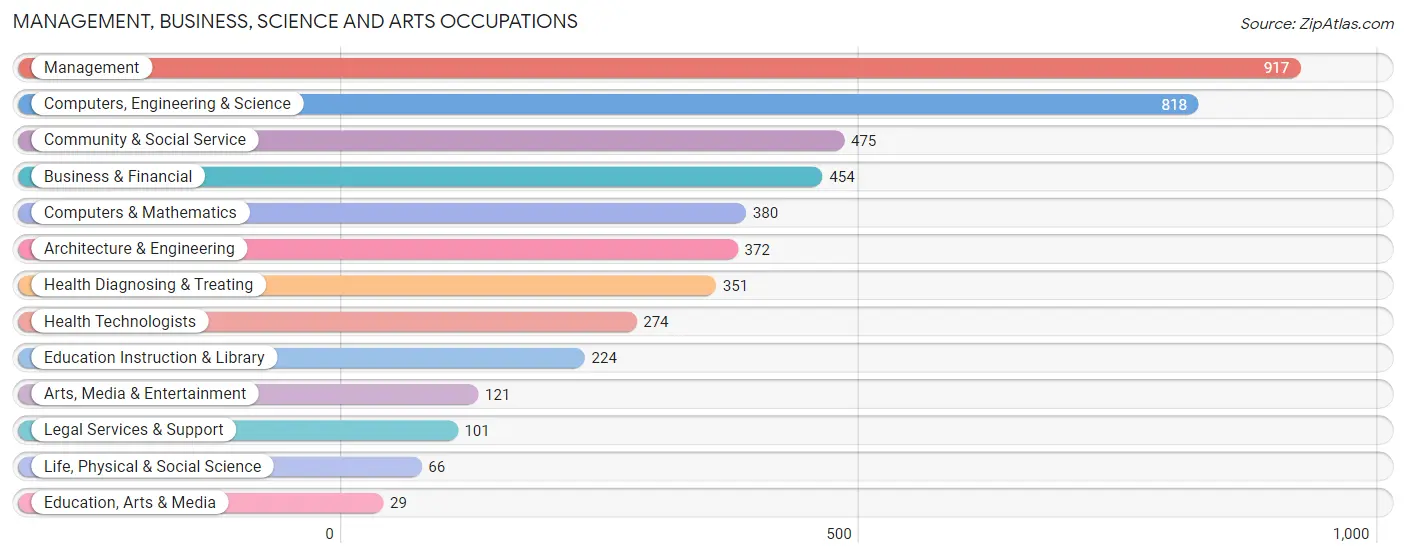
Management, Business, Science and Arts Occupations
The most common Management, Business, Science and Arts occupations in Bull Mountain are Management (917 | 17.6%), Computers, Engineering & Science (818 | 15.7%), Community & Social Service (475 | 9.1%), Business & Financial (454 | 8.7%), and Computers & Mathematics (380 | 7.3%).
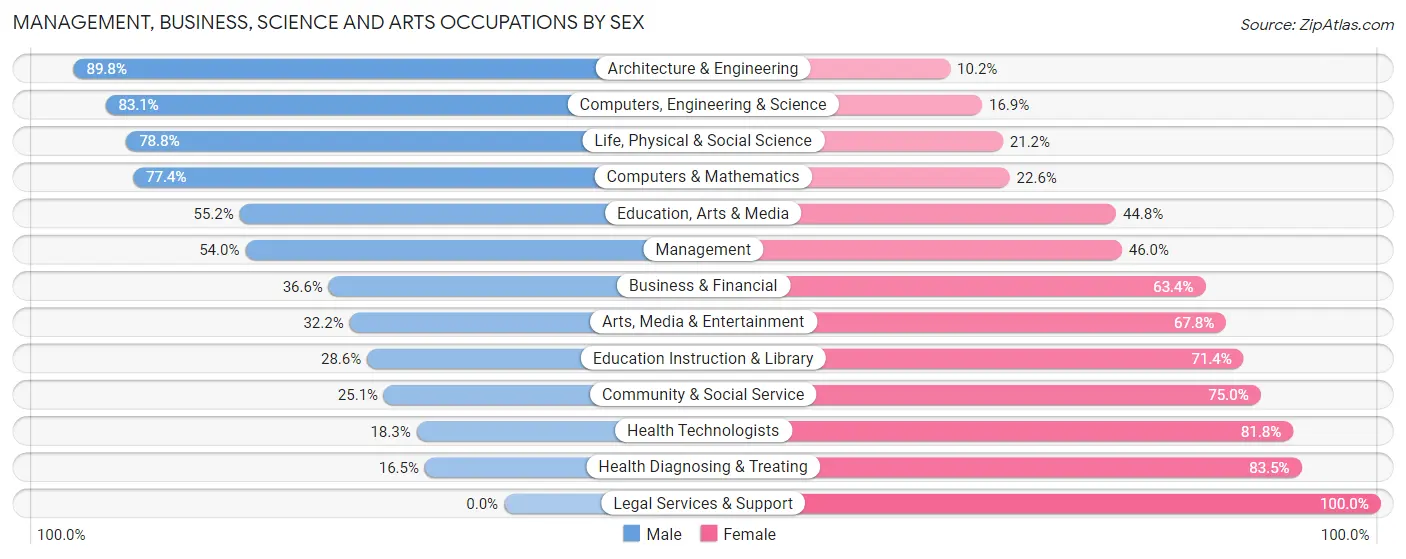
Management, Business, Science and Arts Occupations by Sex
Within the Management, Business, Science and Arts occupations in Bull Mountain, the most male-oriented occupations are Architecture & Engineering (89.8%), Computers, Engineering & Science (83.1%), and Life, Physical & Social Science (78.8%), while the most female-oriented occupations are Legal Services & Support (100.0%), Health Diagnosing & Treating (83.5%), and Health Technologists (81.8%).
| Occupation | Male | Female |
| Management | 495 (54.0%) | 422 (46.0%) |
| Business & Financial | 166 (36.6%) | 288 (63.4%) |
| Computers, Engineering & Science | 680 (83.1%) | 138 (16.9%) |
| Computers & Mathematics | 294 (77.4%) | 86 (22.6%) |
| Architecture & Engineering | 334 (89.8%) | 38 (10.2%) |
| Life, Physical & Social Science | 52 (78.8%) | 14 (21.2%) |
| Community & Social Service | 119 (25.1%) | 356 (75.0%) |
| Education, Arts & Media | 16 (55.2%) | 13 (44.8%) |
| Legal Services & Support | 0 (0.0%) | 101 (100.0%) |
| Education Instruction & Library | 64 (28.6%) | 160 (71.4%) |
| Arts, Media & Entertainment | 39 (32.2%) | 82 (67.8%) |
| Health Diagnosing & Treating | 58 (16.5%) | 293 (83.5%) |
| Health Technologists | 50 (18.2%) | 224 (81.8%) |
| Total (Category) | 1,518 (50.3%) | 1,497 (49.6%) |
| Total (Overall) | 2,656 (50.9%) | 2,561 (49.1%) |
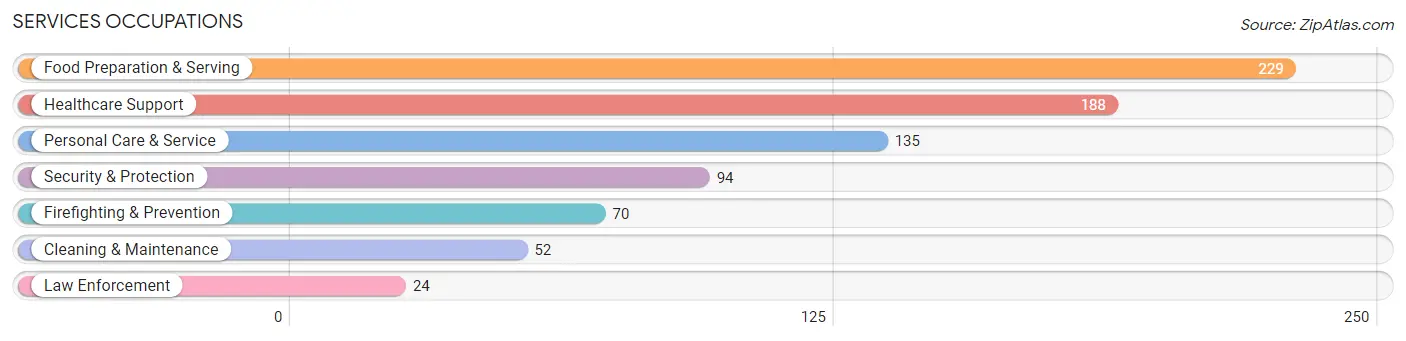
Services Occupations
The most common Services occupations in Bull Mountain are Food Preparation & Serving (229 | 4.4%), Healthcare Support (188 | 3.6%), Personal Care & Service (135 | 2.6%), Security & Protection (94 | 1.8%), and Firefighting & Prevention (70 | 1.3%).
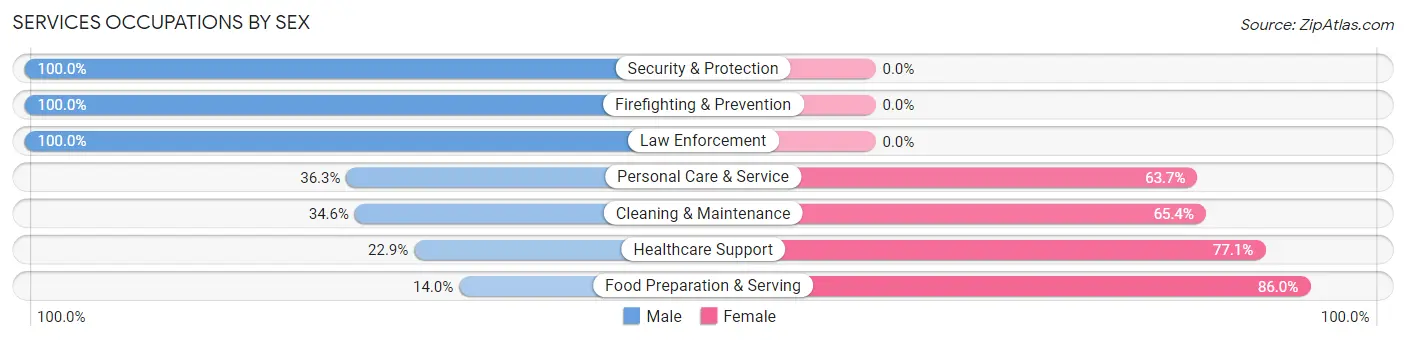
Services Occupations by Sex
Within the Services occupations in Bull Mountain, the most male-oriented occupations are Security & Protection (100.0%), Firefighting & Prevention (100.0%), and Law Enforcement (100.0%), while the most female-oriented occupations are Food Preparation & Serving (86.0%), Healthcare Support (77.1%), and Cleaning & Maintenance (65.4%).
| Occupation | Male | Female |
| Healthcare Support | 43 (22.9%) | 145 (77.1%) |
| Security & Protection | 94 (100.0%) | 0 (0.0%) |
| Firefighting & Prevention | 70 (100.0%) | 0 (0.0%) |
| Law Enforcement | 24 (100.0%) | 0 (0.0%) |
| Food Preparation & Serving | 32 (14.0%) | 197 (86.0%) |
| Cleaning & Maintenance | 18 (34.6%) | 34 (65.4%) |
| Personal Care & Service | 49 (36.3%) | 86 (63.7%) |
| Total (Category) | 236 (33.8%) | 462 (66.2%) |
| Total (Overall) | 2,656 (50.9%) | 2,561 (49.1%) |
Sales and Office Occupations
The most common Sales and Office occupations in Bull Mountain are Sales & Related (419 | 8.0%), and Office & Administration (356 | 6.8%).
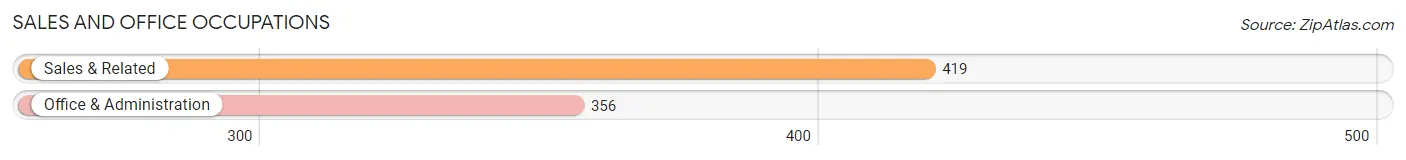
Sales and Office Occupations by Sex
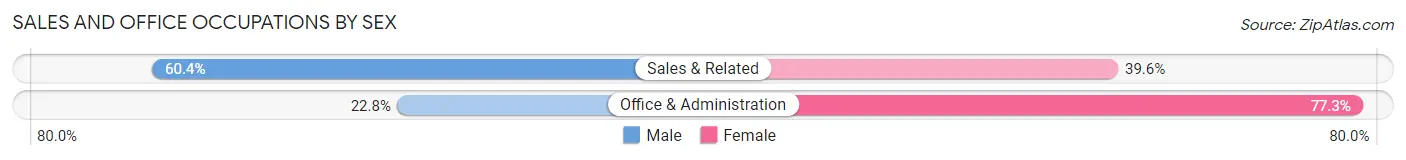
| Occupation | Male | Female |
| Sales & Related | 253 (60.4%) | 166 (39.6%) |
| Office & Administration | 81 (22.8%) | 275 (77.2%) |
| Total (Category) | 334 (43.1%) | 441 (56.9%) |
| Total (Overall) | 2,656 (50.9%) | 2,561 (49.1%) |
Natural Resources, Construction and Maintenance Occupations
The most common Natural Resources, Construction and Maintenance occupations in Bull Mountain are Construction & Extraction (79 | 1.5%), Installation, Maintenance & Repair (61 | 1.2%), and Farming, Fishing & Forestry (7 | 0.1%).
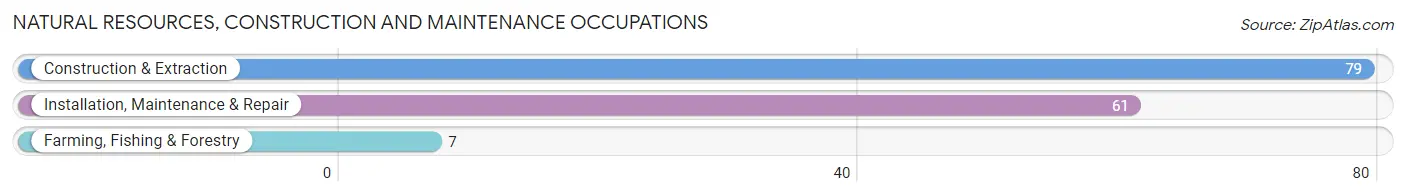
Natural Resources, Construction and Maintenance Occupations by Sex
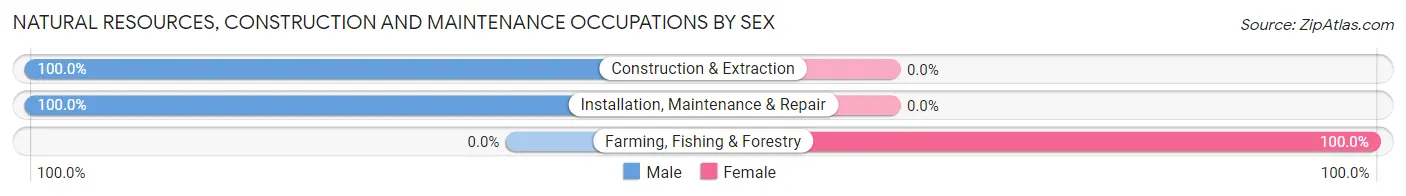
| Occupation | Male | Female |
| Farming, Fishing & Forestry | 0 (0.0%) | 7 (100.0%) |
| Construction & Extraction | 79 (100.0%) | 0 (0.0%) |
| Installation, Maintenance & Repair | 61 (100.0%) | 0 (0.0%) |
| Total (Category) | 140 (95.2%) | 7 (4.8%) |
| Total (Overall) | 2,656 (50.9%) | 2,561 (49.1%) |
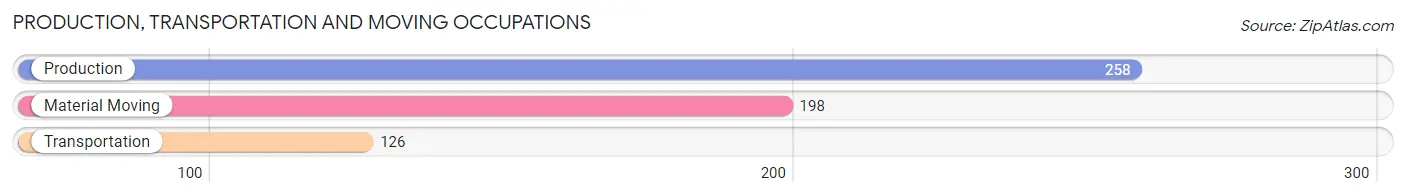
Production, Transportation and Moving Occupations
The most common Production, Transportation and Moving occupations in Bull Mountain are Production (258 | 5.0%), Material Moving (198 | 3.8%), and Transportation (126 | 2.4%).
Production, Transportation and Moving Occupations by Sex
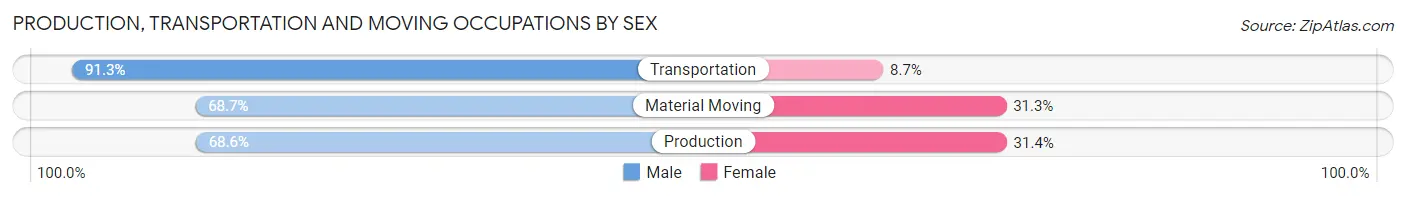
| Occupation | Male | Female |
| Production | 177 (68.6%) | 81 (31.4%) |
| Transportation | 115 (91.3%) | 11 (8.7%) |
| Material Moving | 136 (68.7%) | 62 (31.3%) |
| Total (Category) | 428 (73.5%) | 154 (26.5%) |
| Total (Overall) | 2,656 (50.9%) | 2,561 (49.1%) |
Employment Industries by Sex in Bull Mountain
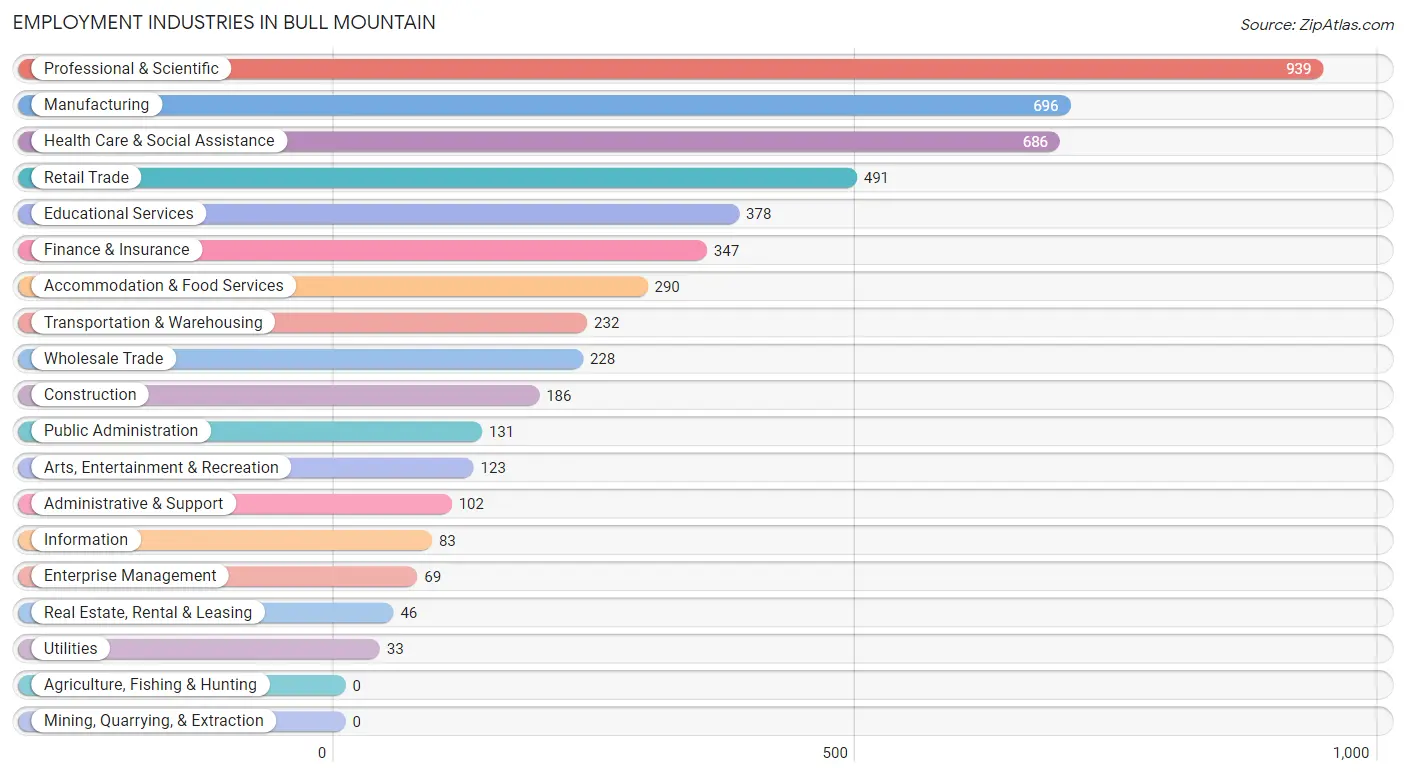
Employment Industries in Bull Mountain
The major employment industries in Bull Mountain include Professional & Scientific (939 | 18.0%), Manufacturing (696 | 13.3%), Health Care & Social Assistance (686 | 13.2%), Retail Trade (491 | 9.4%), and Educational Services (378 | 7.2%).
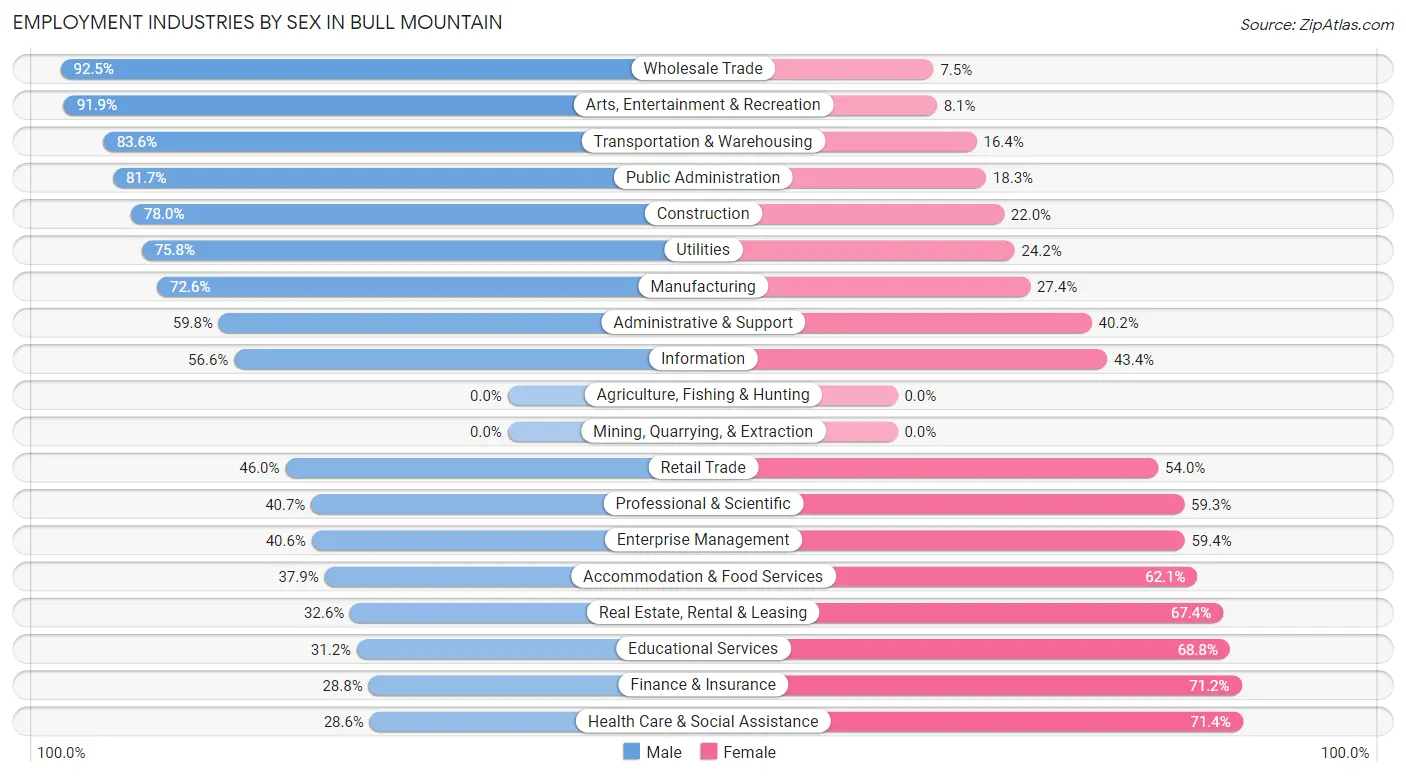
Employment Industries by Sex in Bull Mountain
The Bull Mountain industries that see more men than women are Wholesale Trade (92.5%), Arts, Entertainment & Recreation (91.9%), and Transportation & Warehousing (83.6%), whereas the industries that tend to have a higher number of women are Health Care & Social Assistance (71.4%), Finance & Insurance (71.2%), and Educational Services (68.8%).
| Industry | Male | Female |
| Agriculture, Fishing & Hunting | 0 (0.0%) | 0 (0.0%) |
| Mining, Quarrying, & Extraction | 0 (0.0%) | 0 (0.0%) |
| Construction | 145 (78.0%) | 41 (22.0%) |
| Manufacturing | 505 (72.6%) | 191 (27.4%) |
| Wholesale Trade | 211 (92.5%) | 17 (7.5%) |
| Retail Trade | 226 (46.0%) | 265 (54.0%) |
| Transportation & Warehousing | 194 (83.6%) | 38 (16.4%) |
| Utilities | 25 (75.8%) | 8 (24.2%) |
| Information | 47 (56.6%) | 36 (43.4%) |
| Finance & Insurance | 100 (28.8%) | 247 (71.2%) |
| Real Estate, Rental & Leasing | 15 (32.6%) | 31 (67.4%) |
| Professional & Scientific | 382 (40.7%) | 557 (59.3%) |
| Enterprise Management | 28 (40.6%) | 41 (59.4%) |
| Administrative & Support | 61 (59.8%) | 41 (40.2%) |
| Educational Services | 118 (31.2%) | 260 (68.8%) |
| Health Care & Social Assistance | 196 (28.6%) | 490 (71.4%) |
| Arts, Entertainment & Recreation | 113 (91.9%) | 10 (8.1%) |
| Accommodation & Food Services | 110 (37.9%) | 180 (62.1%) |
| Public Administration | 107 (81.7%) | 24 (18.3%) |
| Total | 2,656 (50.9%) | 2,561 (49.1%) |
Education in Bull Mountain
School Enrollment in Bull Mountain
The most common levels of schooling among the 2,558 students in Bull Mountain are middle school (762 | 29.8%), high school (625 | 24.4%), and elementary school (434 | 17.0%).
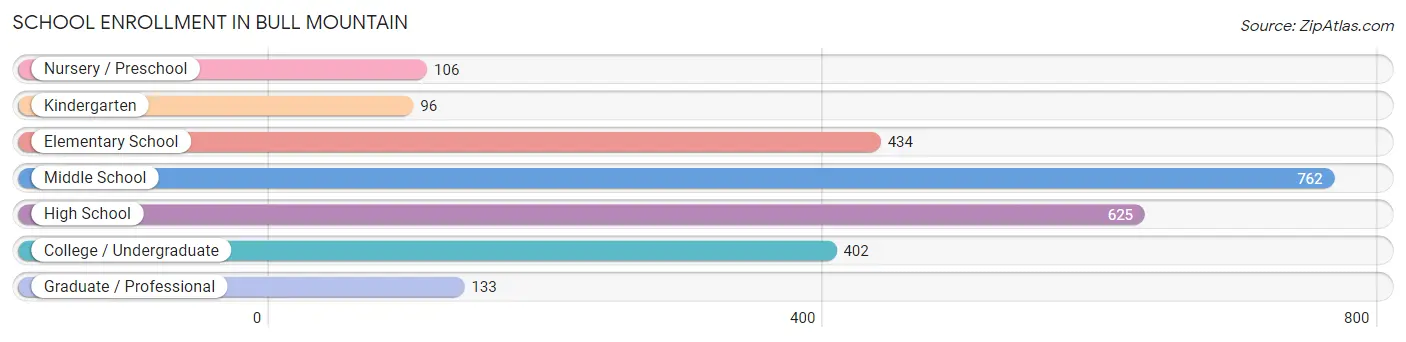
| School Level | # Students | % Students |
| Nursery / Preschool | 106 | 4.1% |
| Kindergarten | 96 | 3.7% |
| Elementary School | 434 | 17.0% |
| Middle School | 762 | 29.8% |
| High School | 625 | 24.4% |
| College / Undergraduate | 402 | 15.7% |
| Graduate / Professional | 133 | 5.2% |
| Total | 2,558 | 100.0% |
School Enrollment by Age by Funding Source in Bull Mountain
Out of a total of 2,558 students who are enrolled in schools in Bull Mountain, 540 (21.1%) attend a private institution, while the remaining 2,018 (78.9%) are enrolled in public schools. The age group of 3 to 4 year olds has the highest likelihood of being enrolled in private schools, with 68 (100.0% in the age bracket) enrolled. Conversely, the age group of 20 to 24 year olds has the lowest likelihood of being enrolled in a private school, with 218 (98.6% in the age bracket) attending a public institution.
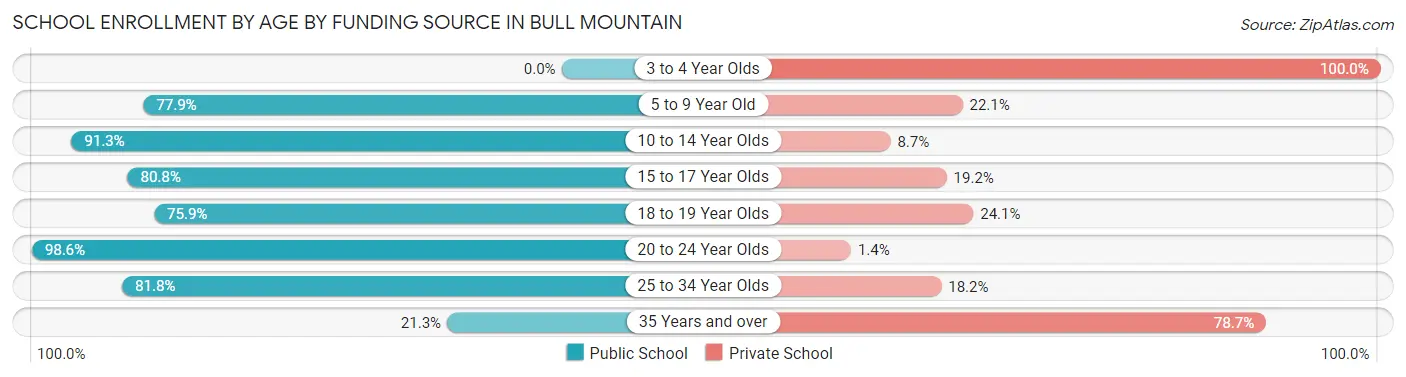
| Age Bracket | Public School | Private School |
| 3 to 4 Year Olds | 0 (0.0%) | 68 (100.0%) |
| 5 to 9 Year Old | 408 (77.9%) | 116 (22.1%) |
| 10 to 14 Year Olds | 743 (91.3%) | 71 (8.7%) |
| 15 to 17 Year Olds | 455 (80.8%) | 108 (19.2%) |
| 18 to 19 Year Olds | 88 (75.9%) | 28 (24.1%) |
| 20 to 24 Year Olds | 218 (98.6%) | 3 (1.4%) |
| 25 to 34 Year Olds | 72 (81.8%) | 16 (18.2%) |
| 35 Years and over | 35 (21.3%) | 129 (78.7%) |
| Total | 2,018 (78.9%) | 540 (21.1%) |
Educational Attainment by Field of Study in Bull Mountain
Business (931 | 22.7%), engineering (467 | 11.4%), liberal arts & history (385 | 9.4%), social sciences (318 | 7.7%), and science & technology (315 | 7.7%) are the most common fields of study among 4,109 individuals in Bull Mountain who have obtained a bachelor's degree or higher.
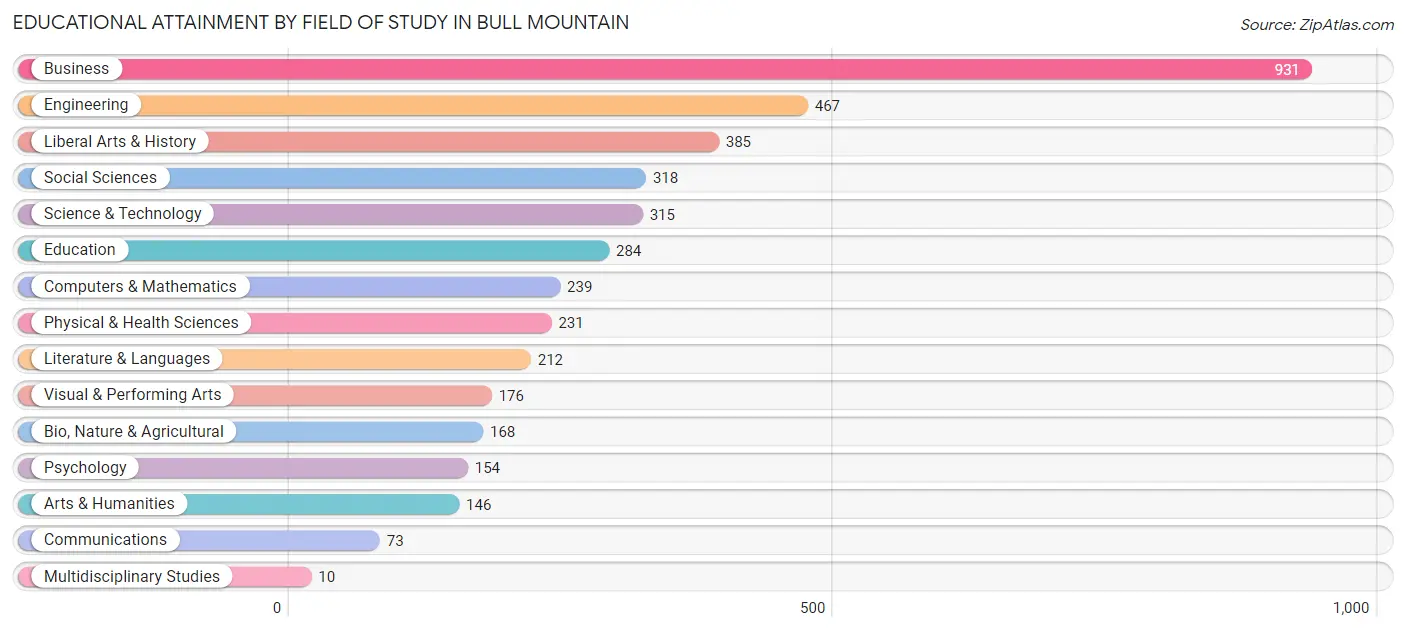
| Field of Study | # Graduates | % Graduates |
| Computers & Mathematics | 239 | 5.8% |
| Bio, Nature & Agricultural | 168 | 4.1% |
| Physical & Health Sciences | 231 | 5.6% |
| Psychology | 154 | 3.7% |
| Social Sciences | 318 | 7.7% |
| Engineering | 467 | 11.4% |
| Multidisciplinary Studies | 10 | 0.2% |
| Science & Technology | 315 | 7.7% |
| Business | 931 | 22.7% |
| Education | 284 | 6.9% |
| Literature & Languages | 212 | 5.2% |
| Liberal Arts & History | 385 | 9.4% |
| Visual & Performing Arts | 176 | 4.3% |
| Communications | 73 | 1.8% |
| Arts & Humanities | 146 | 3.5% |
| Total | 4,109 | 100.0% |
Transportation & Commute in Bull Mountain
Vehicle Availability by Sex in Bull Mountain
The most prevalent vehicle ownership categories in Bull Mountain are males with 2 vehicles (1,445, accounting for 54.0%) and females with 2 vehicles (1,192, making up 57.5%).
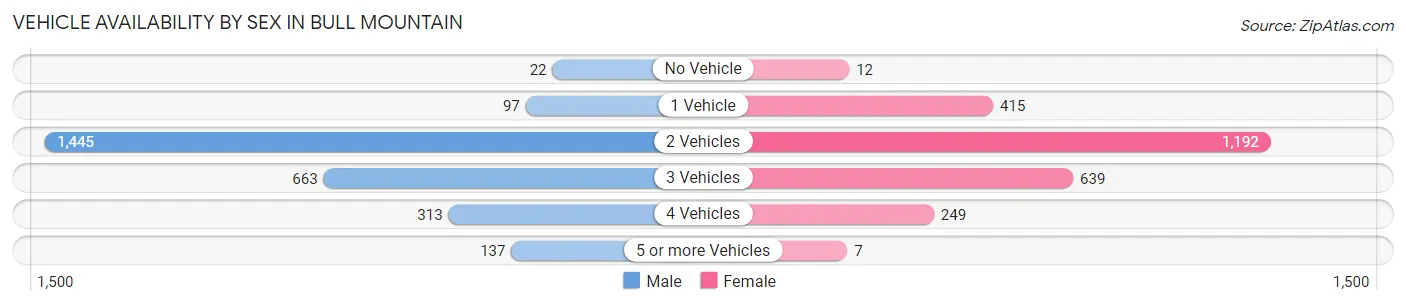
| Vehicles Available | Male | Female |
| No Vehicle | 22 (0.8%) | 12 (0.5%) |
| 1 Vehicle | 97 (3.6%) | 415 (16.5%) |
| 2 Vehicles | 1,445 (54.0%) | 1,192 (47.4%) |
| 3 Vehicles | 663 (24.8%) | 639 (25.4%) |
| 4 Vehicles | 313 (11.7%) | 249 (9.9%) |
| 5 or more Vehicles | 137 (5.1%) | 7 (0.3%) |
| Total | 2,677 (100.0%) | 2,514 (100.0%) |
Commute Time in Bull Mountain
The most frequently occuring commute durations in Bull Mountain are 30 to 34 minutes (741 commuters, 19.6%), 20 to 24 minutes (656 commuters, 17.3%), and 15 to 19 minutes (568 commuters, 15.0%).
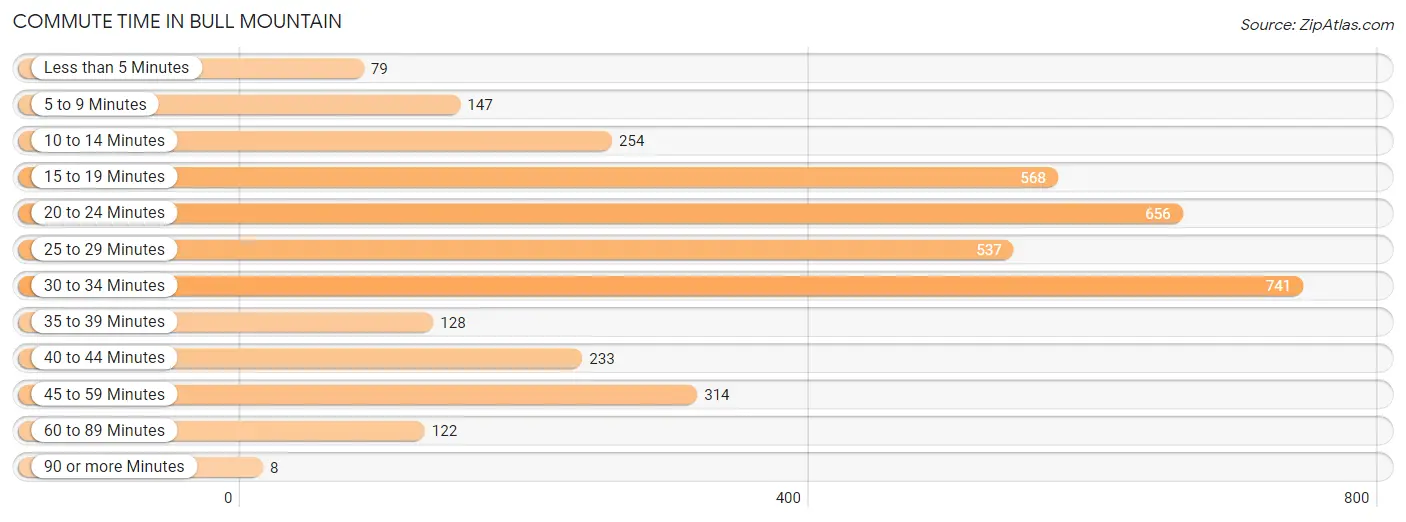
| Commute Time | # Commuters | % Commuters |
| Less than 5 Minutes | 79 | 2.1% |
| 5 to 9 Minutes | 147 | 3.9% |
| 10 to 14 Minutes | 254 | 6.7% |
| 15 to 19 Minutes | 568 | 15.0% |
| 20 to 24 Minutes | 656 | 17.3% |
| 25 to 29 Minutes | 537 | 14.2% |
| 30 to 34 Minutes | 741 | 19.6% |
| 35 to 39 Minutes | 128 | 3.4% |
| 40 to 44 Minutes | 233 | 6.1% |
| 45 to 59 Minutes | 314 | 8.3% |
| 60 to 89 Minutes | 122 | 3.2% |
| 90 or more Minutes | 8 | 0.2% |
Commute Time by Sex in Bull Mountain
The most common commute times in Bull Mountain are 30 to 34 minutes (470 commuters, 22.5%) for males and 15 to 19 minutes (303 commuters, 17.9%) for females.
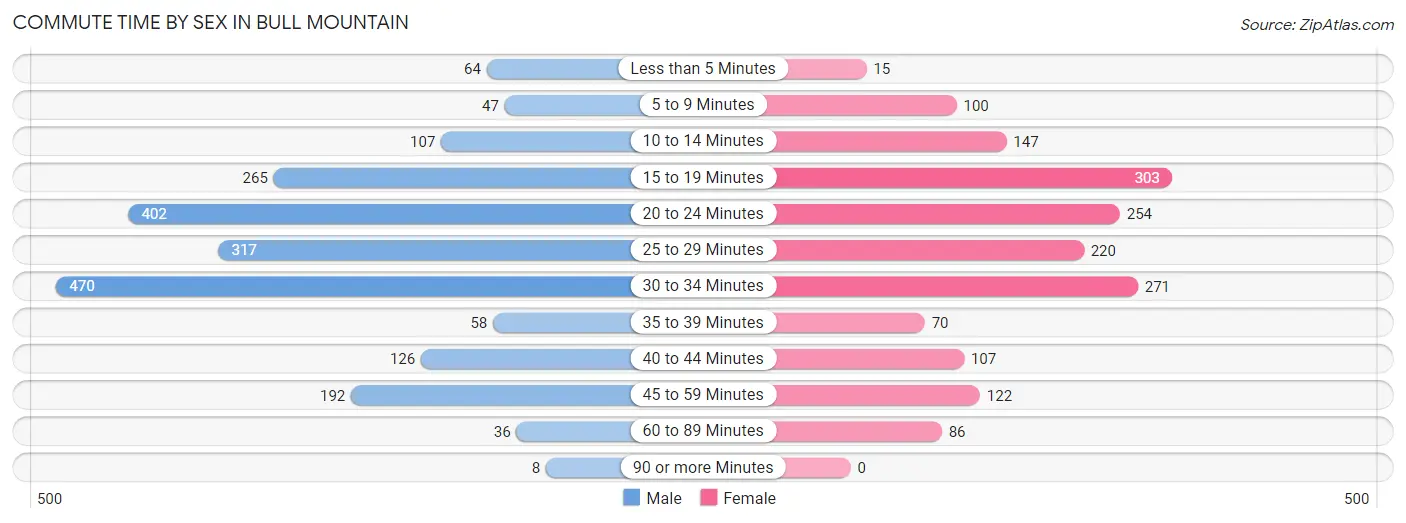
| Commute Time | Male | Female |
| Less than 5 Minutes | 64 (3.1%) | 15 (0.9%) |
| 5 to 9 Minutes | 47 (2.2%) | 100 (5.9%) |
| 10 to 14 Minutes | 107 (5.1%) | 147 (8.7%) |
| 15 to 19 Minutes | 265 (12.7%) | 303 (17.9%) |
| 20 to 24 Minutes | 402 (19.2%) | 254 (15.0%) |
| 25 to 29 Minutes | 317 (15.1%) | 220 (13.0%) |
| 30 to 34 Minutes | 470 (22.5%) | 271 (16.0%) |
| 35 to 39 Minutes | 58 (2.8%) | 70 (4.1%) |
| 40 to 44 Minutes | 126 (6.0%) | 107 (6.3%) |
| 45 to 59 Minutes | 192 (9.2%) | 122 (7.2%) |
| 60 to 89 Minutes | 36 (1.7%) | 86 (5.1%) |
| 90 or more Minutes | 8 (0.4%) | 0 (0.0%) |
Time of Departure to Work by Sex in Bull Mountain
The most frequent times of departure to work in Bull Mountain are 7:30 AM to 7:59 AM (302, 14.4%) for males and 8:00 AM to 8:29 AM (360, 21.2%) for females.
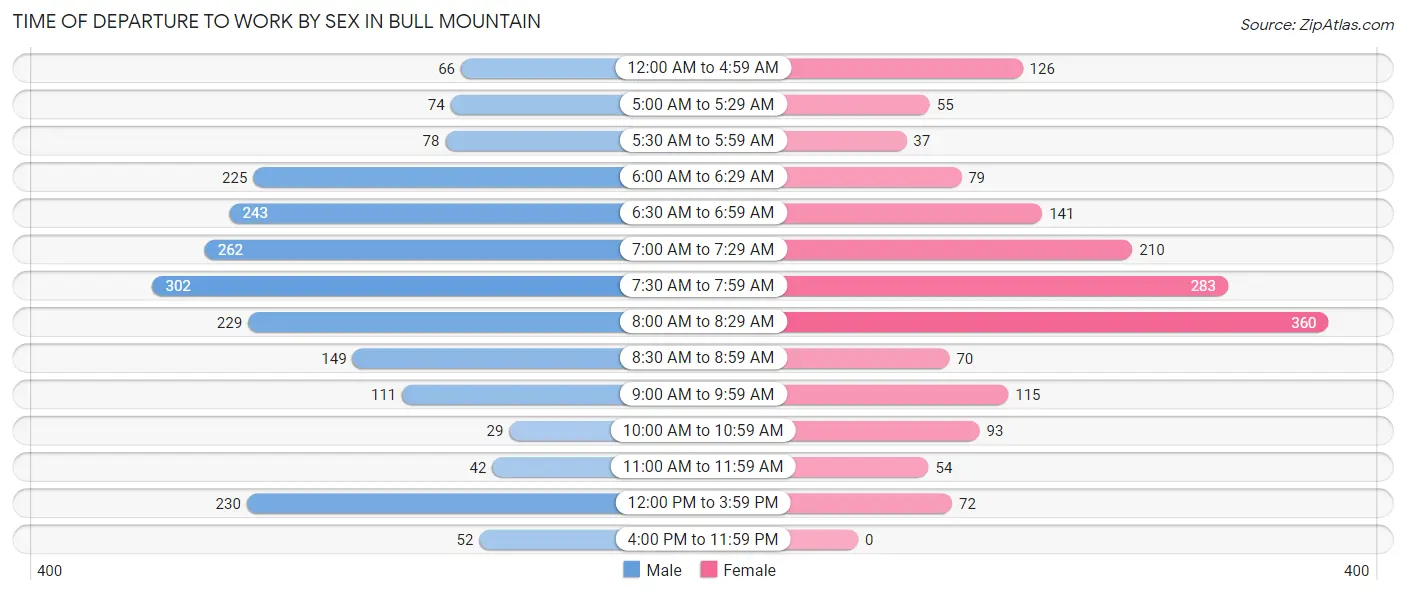
| Time of Departure | Male | Female |
| 12:00 AM to 4:59 AM | 66 (3.2%) | 126 (7.4%) |
| 5:00 AM to 5:29 AM | 74 (3.5%) | 55 (3.2%) |
| 5:30 AM to 5:59 AM | 78 (3.7%) | 37 (2.2%) |
| 6:00 AM to 6:29 AM | 225 (10.8%) | 79 (4.7%) |
| 6:30 AM to 6:59 AM | 243 (11.6%) | 141 (8.3%) |
| 7:00 AM to 7:29 AM | 262 (12.5%) | 210 (12.4%) |
| 7:30 AM to 7:59 AM | 302 (14.4%) | 283 (16.7%) |
| 8:00 AM to 8:29 AM | 229 (11.0%) | 360 (21.2%) |
| 8:30 AM to 8:59 AM | 149 (7.1%) | 70 (4.1%) |
| 9:00 AM to 9:59 AM | 111 (5.3%) | 115 (6.8%) |
| 10:00 AM to 10:59 AM | 29 (1.4%) | 93 (5.5%) |
| 11:00 AM to 11:59 AM | 42 (2.0%) | 54 (3.2%) |
| 12:00 PM to 3:59 PM | 230 (11.0%) | 72 (4.3%) |
| 4:00 PM to 11:59 PM | 52 (2.5%) | 0 (0.0%) |
| Total | 2,092 (100.0%) | 1,695 (100.0%) |
Housing Occupancy in Bull Mountain
Occupancy by Ownership in Bull Mountain
Of the total 3,215 dwellings in Bull Mountain, owner-occupied units account for 2,651 (82.5%), while renter-occupied units make up 564 (17.5%).
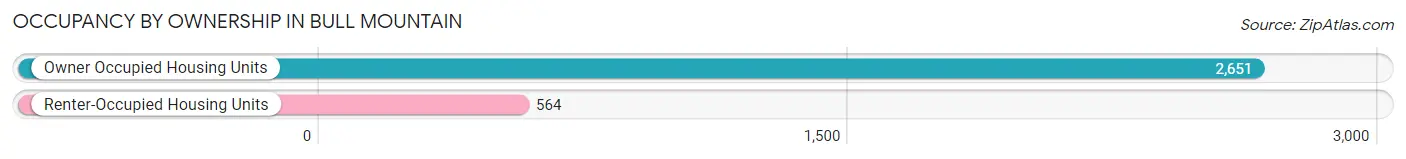
| Occupancy | # Housing Units | % Housing Units |
| Owner Occupied Housing Units | 2,651 | 82.5% |
| Renter-Occupied Housing Units | 564 | 17.5% |
| Total Occupied Housing Units | 3,215 | 100.0% |
Occupancy by Household Size in Bull Mountain
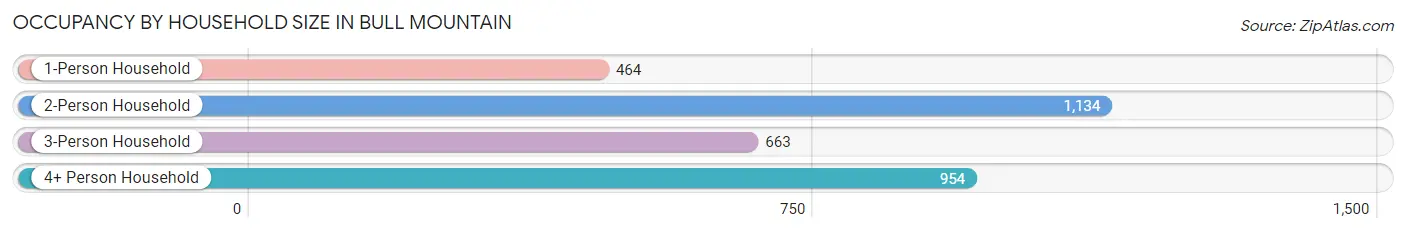
| Household Size | # Housing Units | % Housing Units |
| 1-Person Household | 464 | 14.4% |
| 2-Person Household | 1,134 | 35.3% |
| 3-Person Household | 663 | 20.6% |
| 4+ Person Household | 954 | 29.7% |
| Total Housing Units | 3,215 | 100.0% |
Occupancy by Ownership by Household Size in Bull Mountain
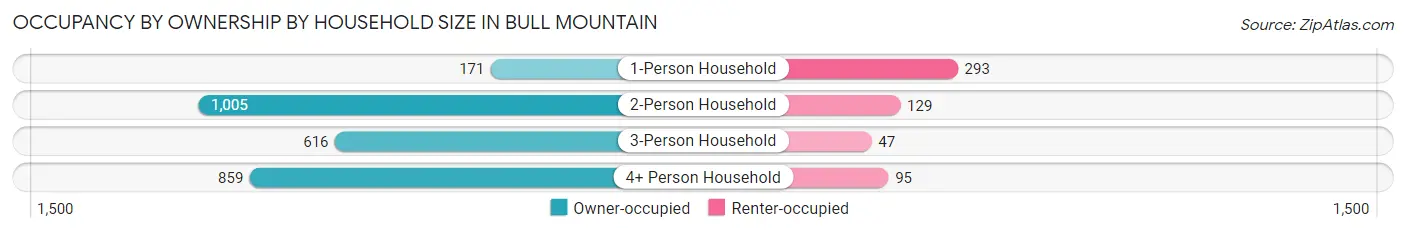
| Household Size | Owner-occupied | Renter-occupied |
| 1-Person Household | 171 (36.8%) | 293 (63.1%) |
| 2-Person Household | 1,005 (88.6%) | 129 (11.4%) |
| 3-Person Household | 616 (92.9%) | 47 (7.1%) |
| 4+ Person Household | 859 (90.0%) | 95 (10.0%) |
| Total Housing Units | 2,651 (82.5%) | 564 (17.5%) |
Occupancy by Educational Attainment in Bull Mountain
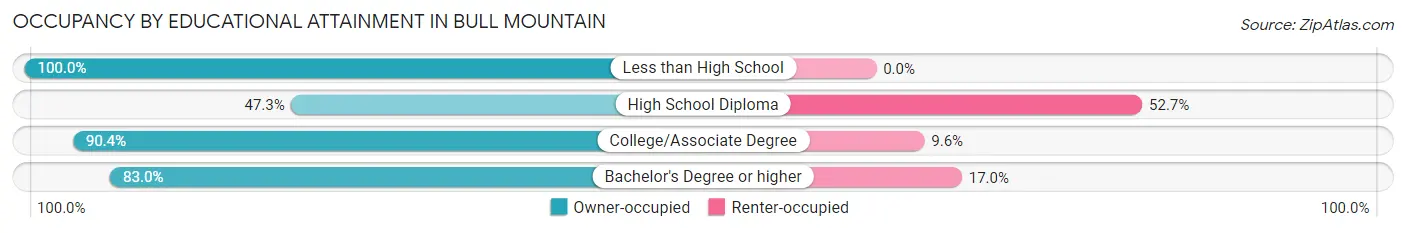
| Household Size | Owner-occupied | Renter-occupied |
| Less than High School | 20 (100.0%) | 0 (0.0%) |
| High School Diploma | 121 (47.3%) | 135 (52.7%) |
| College/Associate Degree | 851 (90.4%) | 90 (9.6%) |
| Bachelor's Degree or higher | 1,659 (83.0%) | 339 (17.0%) |
Occupancy by Age of Householder in Bull Mountain
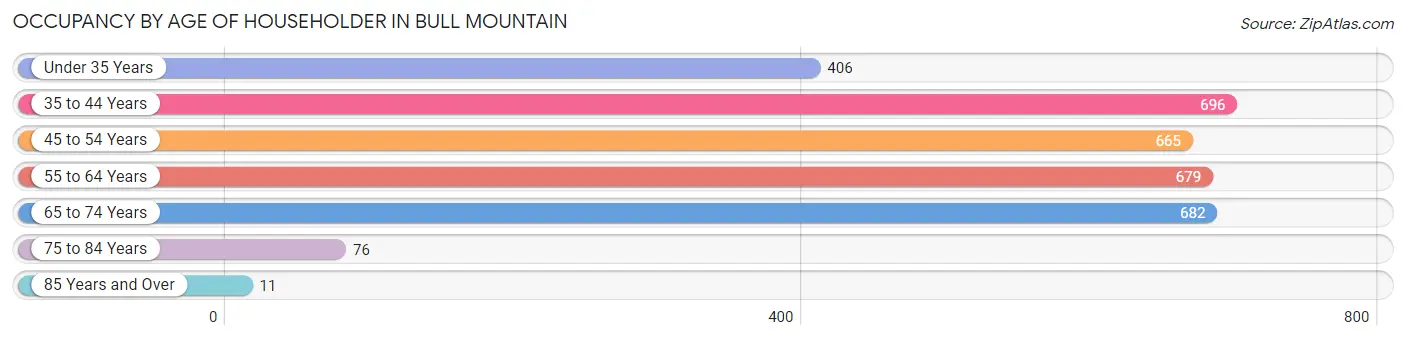
| Age Bracket | # Households | % Households |
| Under 35 Years | 406 | 12.6% |
| 35 to 44 Years | 696 | 21.6% |
| 45 to 54 Years | 665 | 20.7% |
| 55 to 64 Years | 679 | 21.1% |
| 65 to 74 Years | 682 | 21.2% |
| 75 to 84 Years | 76 | 2.4% |
| 85 Years and Over | 11 | 0.3% |
| Total | 3,215 | 100.0% |
Housing Finances in Bull Mountain
Median Income by Occupancy in Bull Mountain
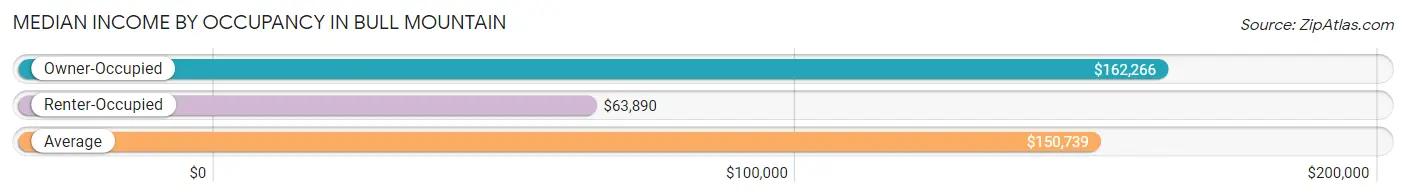
| Occupancy Type | # Households | Median Income |
| Owner-Occupied | 2,651 (82.5%) | $162,266 |
| Renter-Occupied | 564 (17.5%) | $63,890 |
| Average | 3,215 (100.0%) | $150,739 |
Occupancy by Householder Income Bracket in Bull Mountain
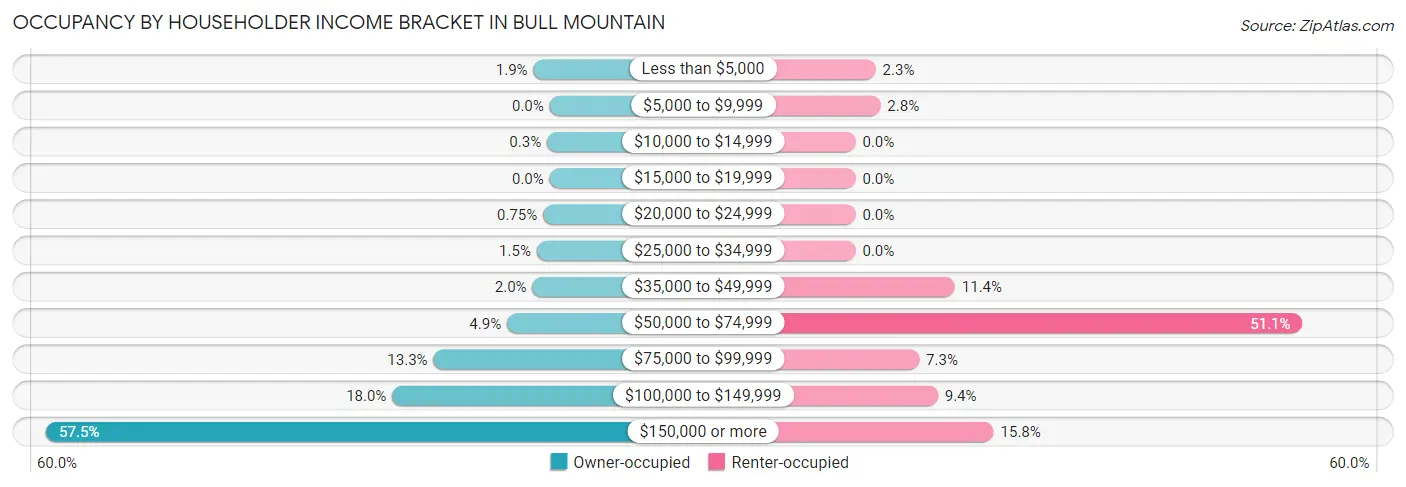
| Income Bracket | Owner-occupied | Renter-occupied |
| Less than $5,000 | 49 (1.8%) | 13 (2.3%) |
| $5,000 to $9,999 | 0 (0.0%) | 16 (2.8%) |
| $10,000 to $14,999 | 8 (0.3%) | 0 (0.0%) |
| $15,000 to $19,999 | 0 (0.0%) | 0 (0.0%) |
| $20,000 to $24,999 | 20 (0.7%) | 0 (0.0%) |
| $25,000 to $34,999 | 39 (1.5%) | 0 (0.0%) |
| $35,000 to $49,999 | 52 (2.0%) | 64 (11.4%) |
| $50,000 to $74,999 | 129 (4.9%) | 288 (51.1%) |
| $75,000 to $99,999 | 352 (13.3%) | 41 (7.3%) |
| $100,000 to $149,999 | 477 (18.0%) | 53 (9.4%) |
| $150,000 or more | 1,525 (57.5%) | 89 (15.8%) |
| Total | 2,651 (100.0%) | 564 (100.0%) |
Monthly Housing Cost Tiers in Bull Mountain
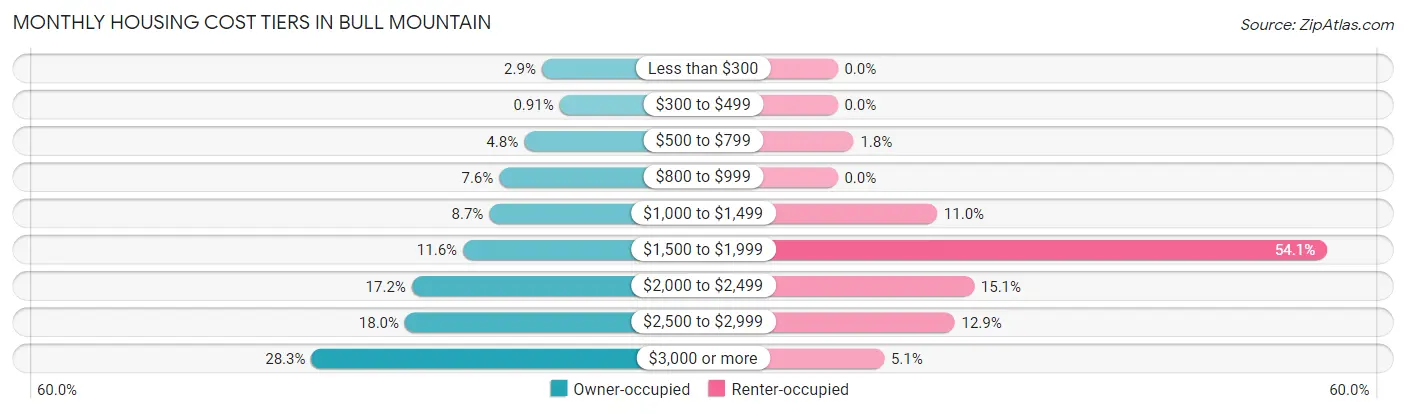
| Monthly Cost | Owner-occupied | Renter-occupied |
| Less than $300 | 76 (2.9%) | 0 (0.0%) |
| $300 to $499 | 24 (0.9%) | 0 (0.0%) |
| $500 to $799 | 128 (4.8%) | 10 (1.8%) |
| $800 to $999 | 201 (7.6%) | 0 (0.0%) |
| $1,000 to $1,499 | 230 (8.7%) | 62 (11.0%) |
| $1,500 to $1,999 | 307 (11.6%) | 305 (54.1%) |
| $2,000 to $2,499 | 457 (17.2%) | 85 (15.1%) |
| $2,500 to $2,999 | 477 (18.0%) | 73 (12.9%) |
| $3,000 or more | 751 (28.3%) | 29 (5.1%) |
| Total | 2,651 (100.0%) | 564 (100.0%) |
Physical Housing Characteristics in Bull Mountain
Housing Structures in Bull Mountain
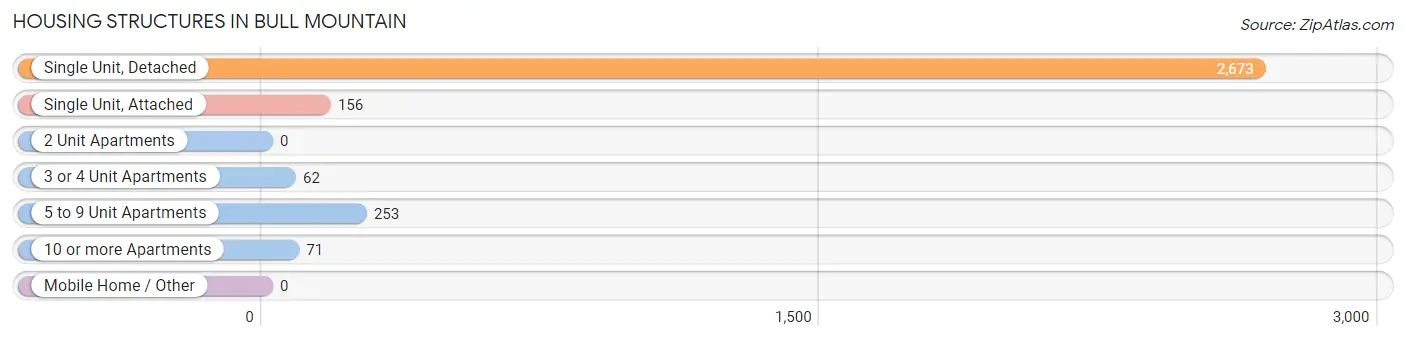
| Structure Type | # Housing Units | % Housing Units |
| Single Unit, Detached | 2,673 | 83.1% |
| Single Unit, Attached | 156 | 4.9% |
| 2 Unit Apartments | 0 | 0.0% |
| 3 or 4 Unit Apartments | 62 | 1.9% |
| 5 to 9 Unit Apartments | 253 | 7.9% |
| 10 or more Apartments | 71 | 2.2% |
| Mobile Home / Other | 0 | 0.0% |
| Total | 3,215 | 100.0% |
Housing Structures by Occupancy in Bull Mountain
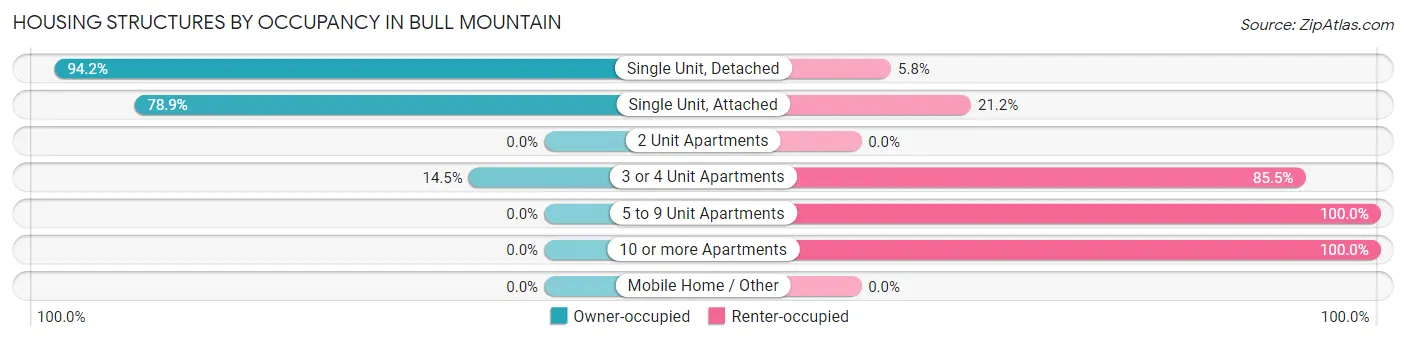
| Structure Type | Owner-occupied | Renter-occupied |
| Single Unit, Detached | 2,519 (94.2%) | 154 (5.8%) |
| Single Unit, Attached | 123 (78.8%) | 33 (21.1%) |
| 2 Unit Apartments | 0 (0.0%) | 0 (0.0%) |
| 3 or 4 Unit Apartments | 9 (14.5%) | 53 (85.5%) |
| 5 to 9 Unit Apartments | 0 (0.0%) | 253 (100.0%) |
| 10 or more Apartments | 0 (0.0%) | 71 (100.0%) |
| Mobile Home / Other | 0 (0.0%) | 0 (0.0%) |
| Total | 2,651 (82.5%) | 564 (17.5%) |
Housing Structures by Number of Rooms in Bull Mountain
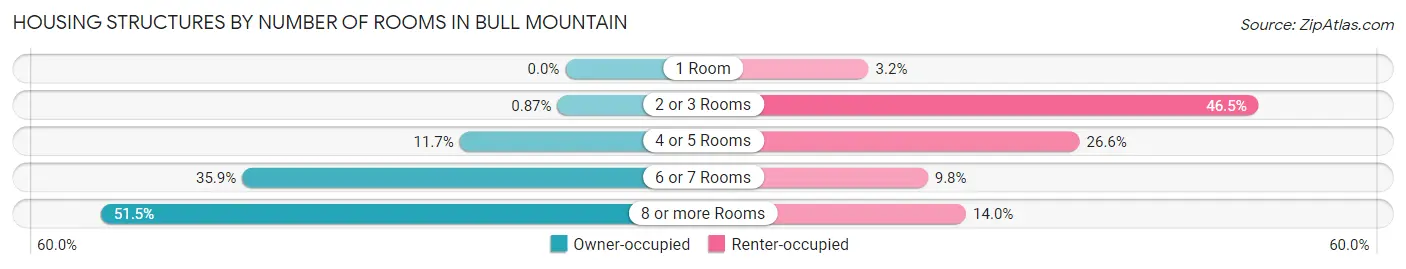
| Number of Rooms | Owner-occupied | Renter-occupied |
| 1 Room | 0 (0.0%) | 18 (3.2%) |
| 2 or 3 Rooms | 23 (0.9%) | 262 (46.5%) |
| 4 or 5 Rooms | 311 (11.7%) | 150 (26.6%) |
| 6 or 7 Rooms | 951 (35.9%) | 55 (9.8%) |
| 8 or more Rooms | 1,366 (51.5%) | 79 (14.0%) |
| Total | 2,651 (100.0%) | 564 (100.0%) |
Housing Structure by Heating Type in Bull Mountain
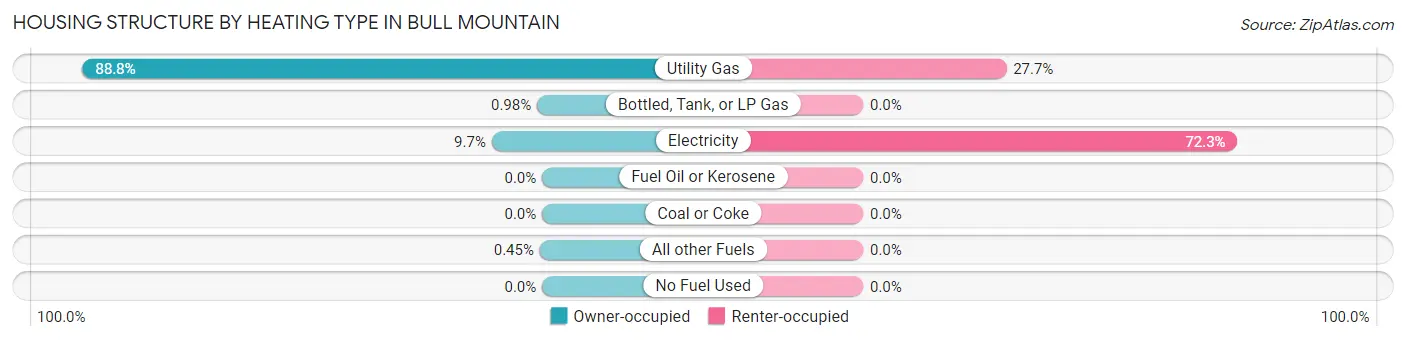
| Heating Type | Owner-occupied | Renter-occupied |
| Utility Gas | 2,355 (88.8%) | 156 (27.7%) |
| Bottled, Tank, or LP Gas | 26 (1.0%) | 0 (0.0%) |
| Electricity | 258 (9.7%) | 408 (72.3%) |
| Fuel Oil or Kerosene | 0 (0.0%) | 0 (0.0%) |
| Coal or Coke | 0 (0.0%) | 0 (0.0%) |
| All other Fuels | 12 (0.4%) | 0 (0.0%) |
| No Fuel Used | 0 (0.0%) | 0 (0.0%) |
| Total | 2,651 (100.0%) | 564 (100.0%) |
Household Vehicle Usage in Bull Mountain
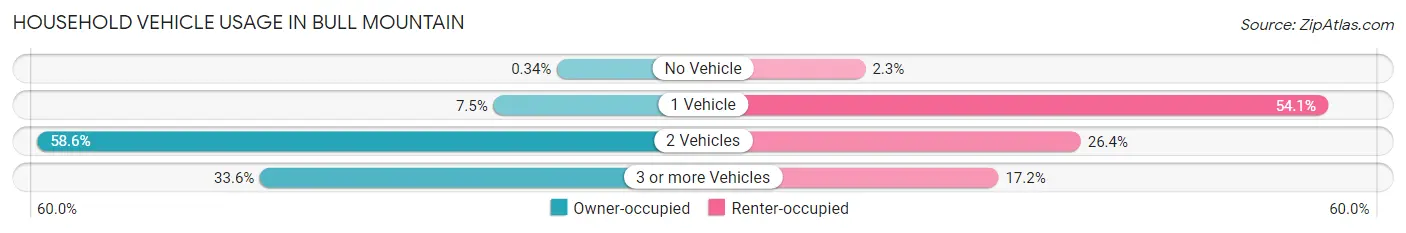
| Vehicles per Household | Owner-occupied | Renter-occupied |
| No Vehicle | 9 (0.3%) | 13 (2.3%) |
| 1 Vehicle | 198 (7.5%) | 305 (54.1%) |
| 2 Vehicles | 1,553 (58.6%) | 149 (26.4%) |
| 3 or more Vehicles | 891 (33.6%) | 97 (17.2%) |
| Total | 2,651 (100.0%) | 564 (100.0%) |
Real Estate & Mortgages in Bull Mountain
Real Estate and Mortgage Overview in Bull Mountain
| Characteristic | Without Mortgage | With Mortgage |
| Housing Units | 524 | 2,127 |
| Median Property Value | $632,600 | $629,600 |
| Median Household Income | $145,000 | $1,263 |
| Monthly Housing Costs | $891 | $751 |
| Real Estate Taxes | $6,520 | $32 |
Property Value by Mortgage Status in Bull Mountain
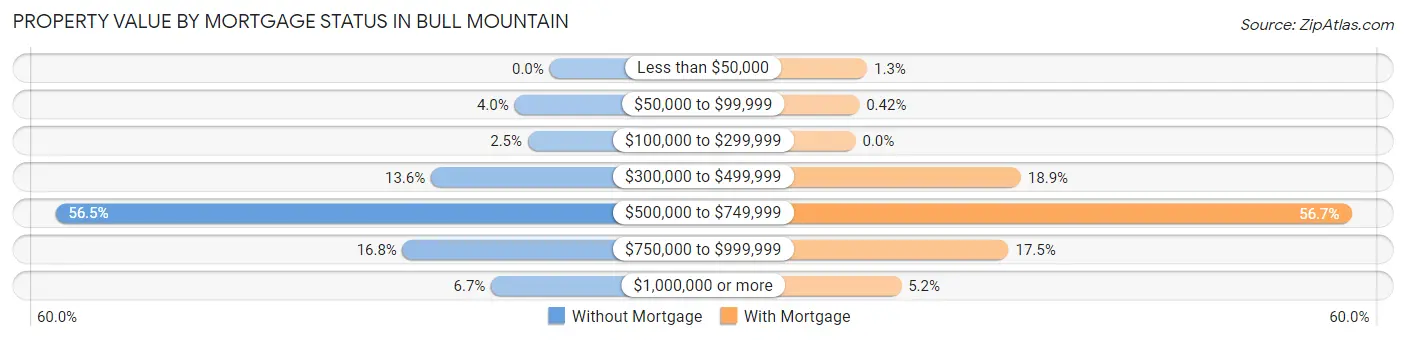
| Property Value | Without Mortgage | With Mortgage |
| Less than $50,000 | 0 (0.0%) | 28 (1.3%) |
| $50,000 to $99,999 | 21 (4.0%) | 9 (0.4%) |
| $100,000 to $299,999 | 13 (2.5%) | 0 (0.0%) |
| $300,000 to $499,999 | 71 (13.6%) | 402 (18.9%) |
| $500,000 to $749,999 | 296 (56.5%) | 1,205 (56.7%) |
| $750,000 to $999,999 | 88 (16.8%) | 372 (17.5%) |
| $1,000,000 or more | 35 (6.7%) | 111 (5.2%) |
| Total | 524 (100.0%) | 2,127 (100.0%) |
Household Income by Mortgage Status in Bull Mountain
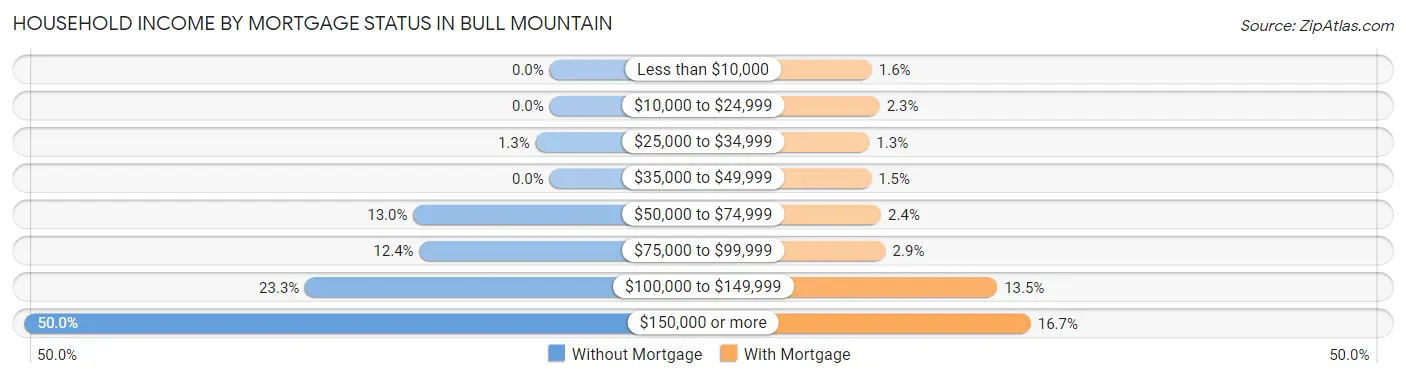
| Household Income | Without Mortgage | With Mortgage |
| Less than $10,000 | 0 (0.0%) | 33 (1.5%) |
| $10,000 to $24,999 | 0 (0.0%) | 49 (2.3%) |
| $25,000 to $34,999 | 7 (1.3%) | 28 (1.3%) |
| $35,000 to $49,999 | 0 (0.0%) | 32 (1.5%) |
| $50,000 to $74,999 | 68 (13.0%) | 52 (2.4%) |
| $75,000 to $99,999 | 65 (12.4%) | 61 (2.9%) |
| $100,000 to $149,999 | 122 (23.3%) | 287 (13.5%) |
| $150,000 or more | 262 (50.0%) | 355 (16.7%) |
| Total | 524 (100.0%) | 2,127 (100.0%) |
Property Value to Household Income Ratio in Bull Mountain
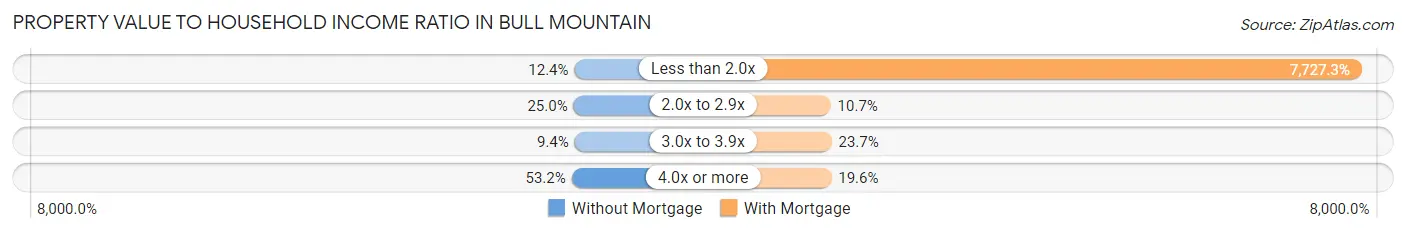
| Value-to-Income Ratio | Without Mortgage | With Mortgage |
| Less than 2.0x | 65 (12.4%) | 164,360 (7,727.3%) |
| 2.0x to 2.9x | 131 (25.0%) | 228 (10.7%) |
| 3.0x to 3.9x | 49 (9.3%) | 503 (23.6%) |
| 4.0x or more | 279 (53.2%) | 417 (19.6%) |
| Total | 524 (100.0%) | 2,127 (100.0%) |
Real Estate Taxes by Mortgage Status in Bull Mountain
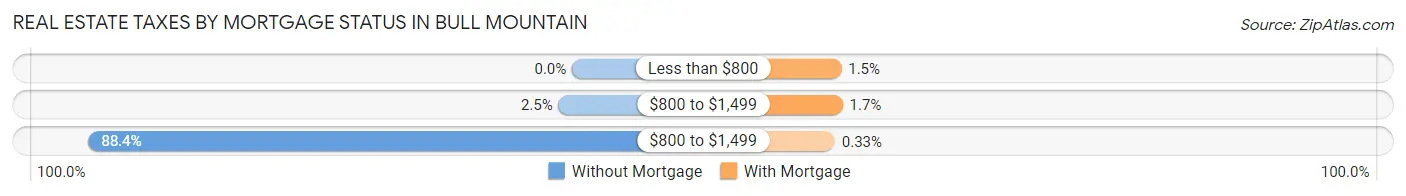
| Property Taxes | Without Mortgage | With Mortgage |
| Less than $800 | 0 (0.0%) | 32 (1.5%) |
| $800 to $1,499 | 13 (2.5%) | 37 (1.7%) |
| $800 to $1,499 | 463 (88.4%) | 7 (0.3%) |
| Total | 524 (100.0%) | 2,127 (100.0%) |
Health & Disability in Bull Mountain
Health Insurance Coverage by Age in Bull Mountain
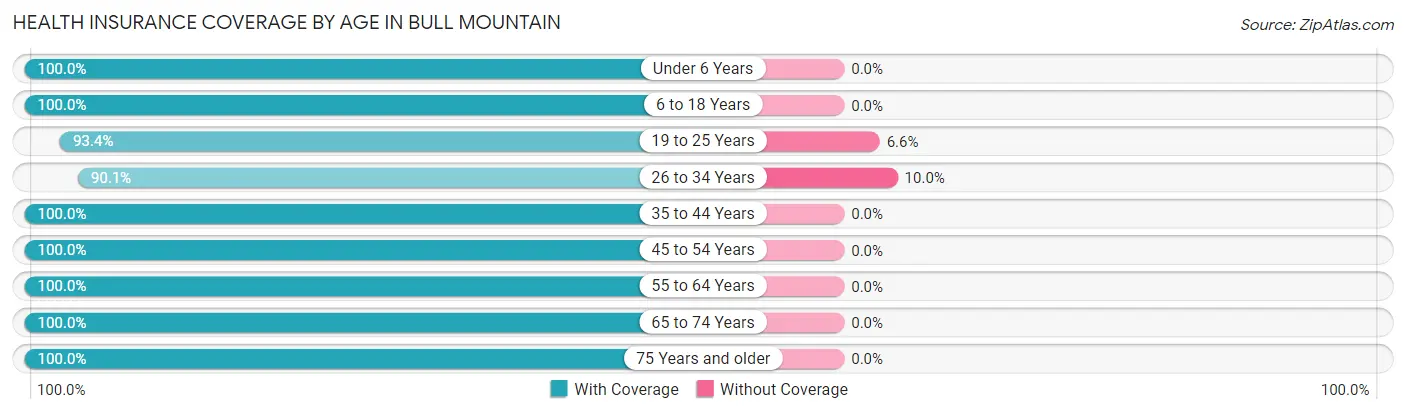
| Age Bracket | With Coverage | Without Coverage |
| Under 6 Years | 490 (100.0%) | 0 (0.0%) |
| 6 to 18 Years | 2,031 (100.0%) | 0 (0.0%) |
| 19 to 25 Years | 580 (93.4%) | 41 (6.6%) |
| 26 to 34 Years | 679 (90.0%) | 75 (10.0%) |
| 35 to 44 Years | 1,431 (100.0%) | 0 (0.0%) |
| 45 to 54 Years | 1,352 (100.0%) | 0 (0.0%) |
| 55 to 64 Years | 1,424 (100.0%) | 0 (0.0%) |
| 65 to 74 Years | 989 (100.0%) | 0 (0.0%) |
| 75 Years and older | 201 (100.0%) | 0 (0.0%) |
| Total | 9,177 (98.8%) | 116 (1.3%) |
Health Insurance Coverage by Citizenship Status in Bull Mountain
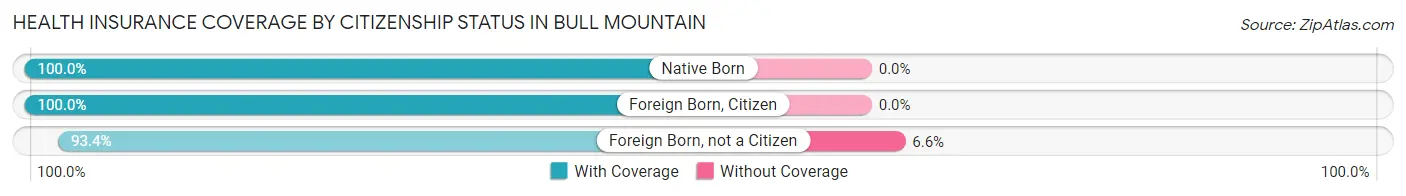
| Citizenship Status | With Coverage | Without Coverage |
| Native Born | 490 (100.0%) | 0 (0.0%) |
| Foreign Born, Citizen | 2,031 (100.0%) | 0 (0.0%) |
| Foreign Born, not a Citizen | 580 (93.4%) | 41 (6.6%) |
Health Insurance Coverage by Household Income in Bull Mountain
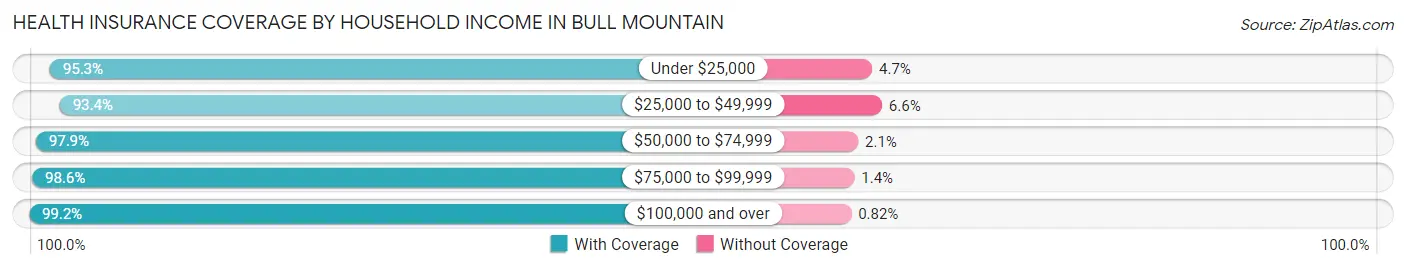
| Household Income | With Coverage | Without Coverage |
| Under $25,000 | 261 (95.3%) | 13 (4.7%) |
| $25,000 to $49,999 | 213 (93.4%) | 15 (6.6%) |
| $50,000 to $74,999 | 784 (97.9%) | 17 (2.1%) |
| $75,000 to $99,999 | 910 (98.6%) | 13 (1.4%) |
| $100,000 and over | 6,997 (99.2%) | 58 (0.8%) |
Public vs Private Health Insurance Coverage by Age in Bull Mountain
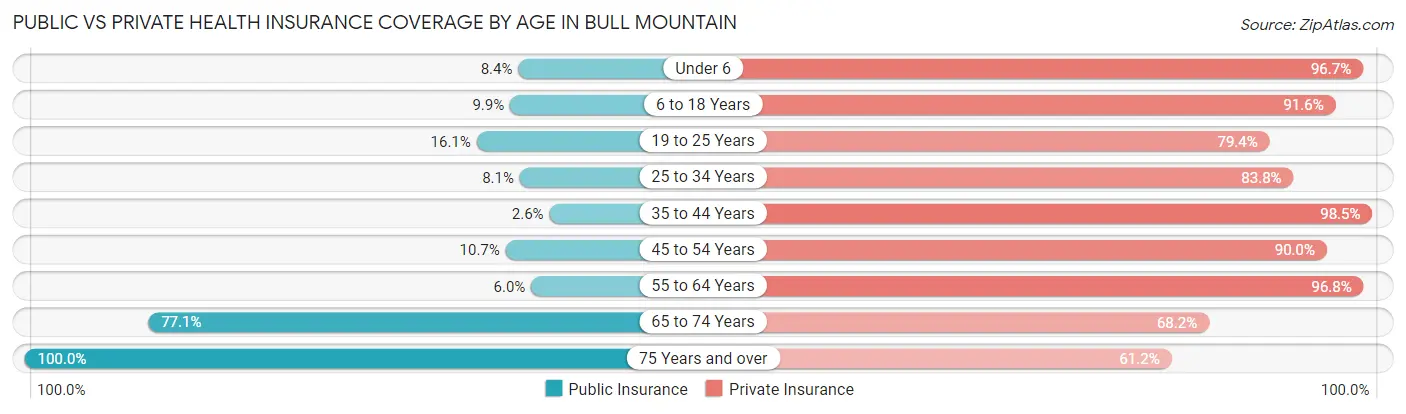
| Age Bracket | Public Insurance | Private Insurance |
| Under 6 | 41 (8.4%) | 474 (96.7%) |
| 6 to 18 Years | 201 (9.9%) | 1,861 (91.6%) |
| 19 to 25 Years | 100 (16.1%) | 493 (79.4%) |
| 25 to 34 Years | 61 (8.1%) | 632 (83.8%) |
| 35 to 44 Years | 37 (2.6%) | 1,409 (98.5%) |
| 45 to 54 Years | 145 (10.7%) | 1,217 (90.0%) |
| 55 to 64 Years | 85 (6.0%) | 1,379 (96.8%) |
| 65 to 74 Years | 762 (77.0%) | 674 (68.1%) |
| 75 Years and over | 201 (100.0%) | 123 (61.2%) |
| Total | 1,633 (17.6%) | 8,262 (88.9%) |
Disability Status by Sex by Age in Bull Mountain
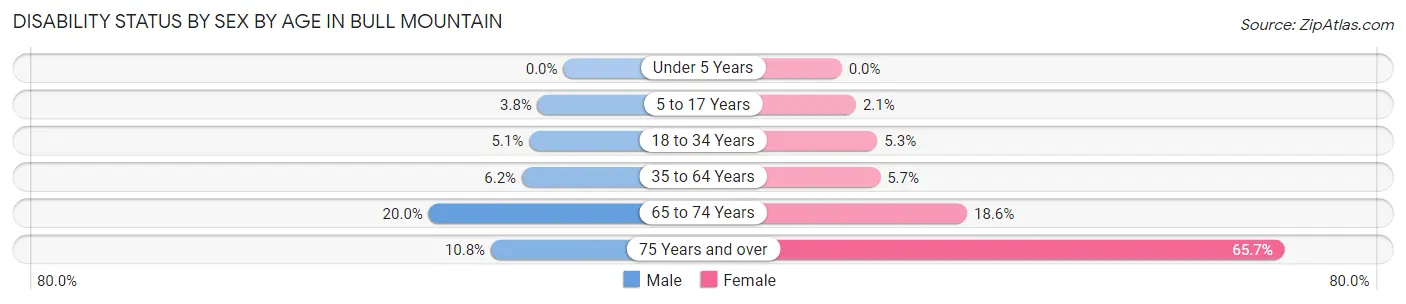
| Age Bracket | Male | Female |
| Under 5 Years | 0 (0.0%) | 0 (0.0%) |
| 5 to 17 Years | 41 (3.8%) | 19 (2.1%) |
| 18 to 34 Years | 43 (5.1%) | 37 (5.3%) |
| 35 to 64 Years | 126 (6.1%) | 123 (5.7%) |
| 65 to 74 Years | 72 (20.0%) | 117 (18.6%) |
| 75 Years and over | 10 (10.7%) | 71 (65.7%) |
Disability Class by Sex by Age in Bull Mountain
Disability Class: Hearing Difficulty
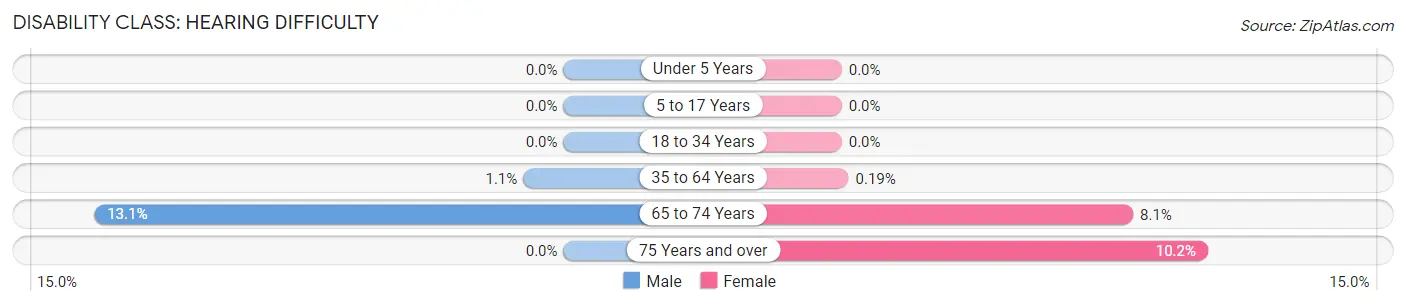
| Age Bracket | Male | Female |
| Under 5 Years | 0 (0.0%) | 0 (0.0%) |
| 5 to 17 Years | 0 (0.0%) | 0 (0.0%) |
| 18 to 34 Years | 0 (0.0%) | 0 (0.0%) |
| 35 to 64 Years | 23 (1.1%) | 4 (0.2%) |
| 65 to 74 Years | 47 (13.1%) | 51 (8.1%) |
| 75 Years and over | 0 (0.0%) | 11 (10.2%) |
Disability Class: Vision Difficulty
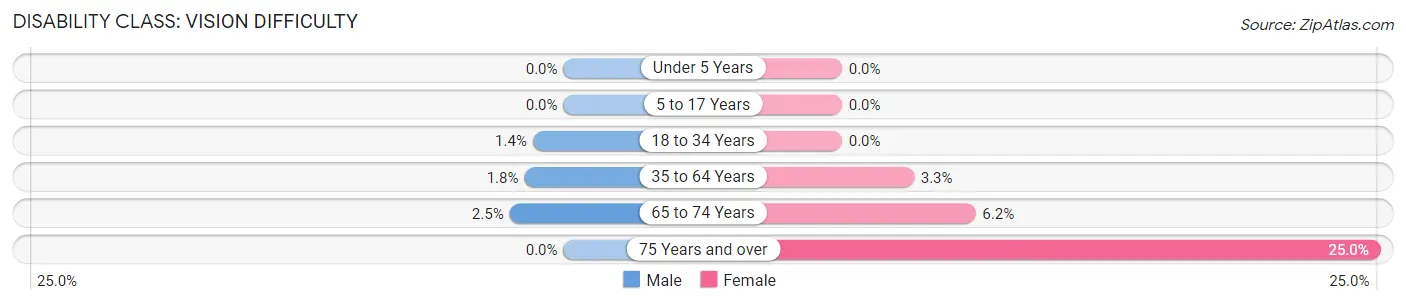
| Age Bracket | Male | Female |
| Under 5 Years | 0 (0.0%) | 0 (0.0%) |
| 5 to 17 Years | 0 (0.0%) | 0 (0.0%) |
| 18 to 34 Years | 12 (1.4%) | 0 (0.0%) |
| 35 to 64 Years | 37 (1.8%) | 72 (3.3%) |
| 65 to 74 Years | 9 (2.5%) | 39 (6.2%) |
| 75 Years and over | 0 (0.0%) | 27 (25.0%) |
Disability Class: Cognitive Difficulty
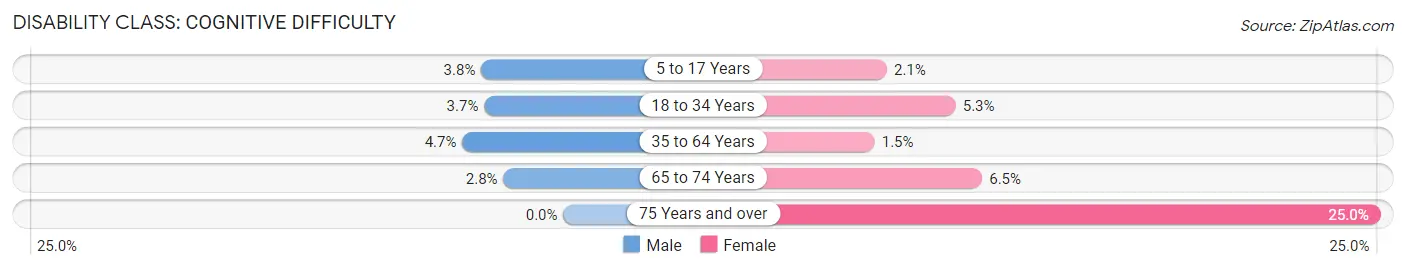
| Age Bracket | Male | Female |
| 5 to 17 Years | 41 (3.8%) | 19 (2.1%) |
| 18 to 34 Years | 31 (3.7%) | 37 (5.3%) |
| 35 to 64 Years | 96 (4.7%) | 33 (1.5%) |
| 65 to 74 Years | 10 (2.8%) | 41 (6.5%) |
| 75 Years and over | 0 (0.0%) | 27 (25.0%) |
Disability Class: Ambulatory Difficulty
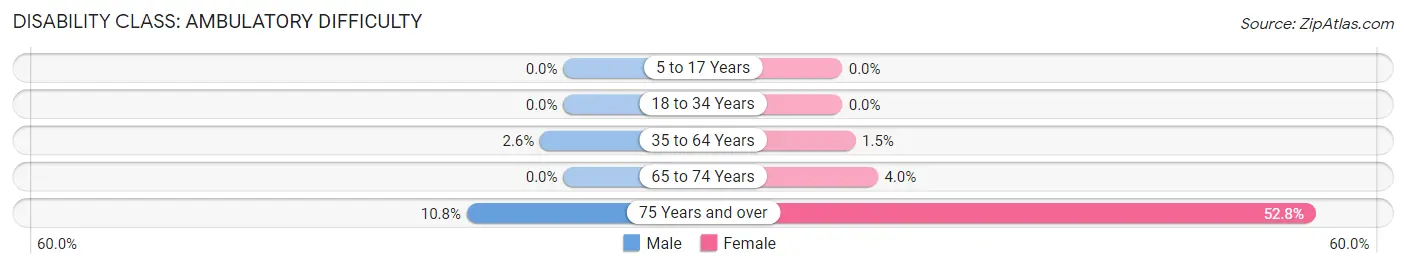
| Age Bracket | Male | Female |
| 5 to 17 Years | 0 (0.0%) | 0 (0.0%) |
| 18 to 34 Years | 0 (0.0%) | 0 (0.0%) |
| 35 to 64 Years | 53 (2.6%) | 32 (1.5%) |
| 65 to 74 Years | 0 (0.0%) | 25 (4.0%) |
| 75 Years and over | 10 (10.7%) | 57 (52.8%) |
Disability Class: Self-Care Difficulty
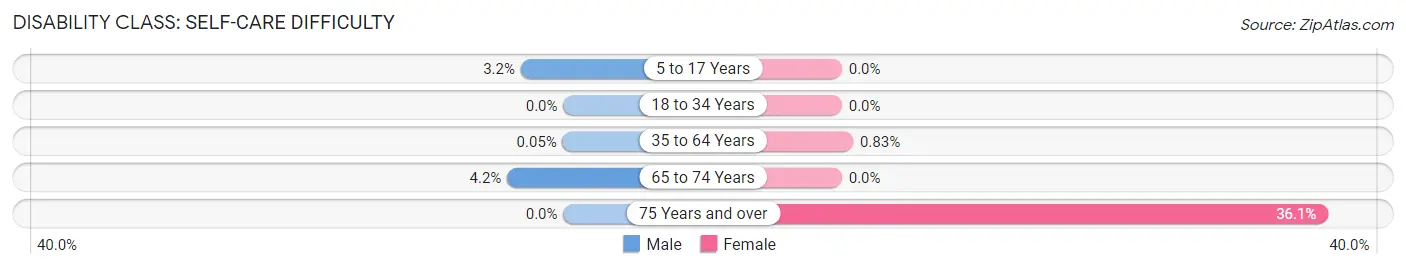
| Age Bracket | Male | Female |
| 5 to 17 Years | 34 (3.2%) | 0 (0.0%) |
| 18 to 34 Years | 0 (0.0%) | 0 (0.0%) |
| 35 to 64 Years | 1 (0.1%) | 18 (0.8%) |
| 65 to 74 Years | 15 (4.2%) | 0 (0.0%) |
| 75 Years and over | 0 (0.0%) | 39 (36.1%) |
Technology Access in Bull Mountain
Computing Device Access in Bull Mountain
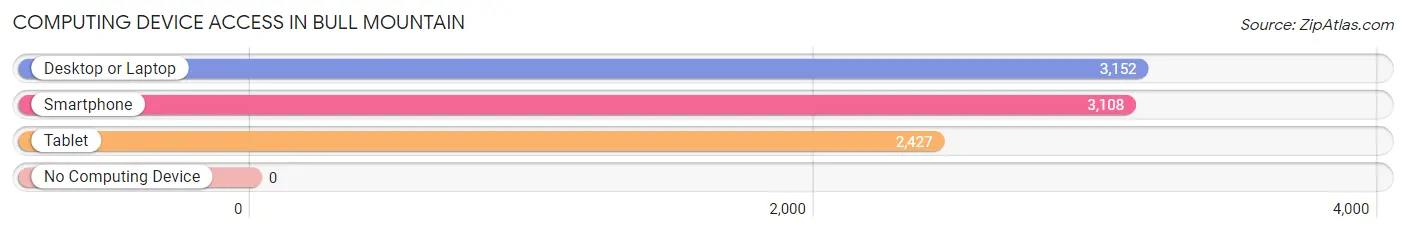
| Device Type | # Households | % Households |
| Desktop or Laptop | 3,152 | 98.0% |
| Smartphone | 3,108 | 96.7% |
| Tablet | 2,427 | 75.5% |
| No Computing Device | 0 | 0.0% |
| Total | 3,215 | 100.0% |
Internet Access in Bull Mountain
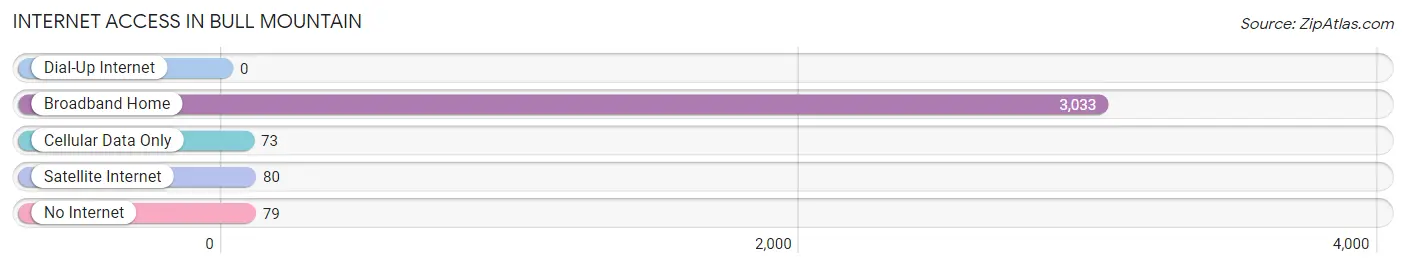
| Internet Type | # Households | % Households |
| Dial-Up Internet | 0 | 0.0% |
| Broadband Home | 3,033 | 94.3% |
| Cellular Data Only | 73 | 2.3% |
| Satellite Internet | 80 | 2.5% |
| No Internet | 79 | 2.5% |
| Total | 3,215 | 100.0% |
Bull Mountain Summary
Mountain, Oregon is a small unincorporated community located in the foothills of the Cascade Mountains in Washington County, Oregon. The community is situated on the eastern side of Bull Mountain, a prominent peak in the Tualatin Mountains. The area is known for its rural atmosphere and scenic views of the surrounding mountains and valleys.
History
The area now known as Bull Mountain was first settled in the late 1800s by homesteaders who were attracted to the area’s abundant natural resources. The first settlers were primarily farmers and loggers who established small farms and logging operations. The area was also home to a number of small sawmills and other businesses.
In the early 1900s, the area began to attract more settlers as the population of the nearby city of Portland grew. The area was also home to a number of small resorts and vacation homes. In the 1950s, the area began to experience rapid growth as the population of Portland continued to increase.
In the late 1970s, the area was annexed by the city of Beaverton and became part of the city’s urban growth boundary. This led to the development of a number of residential neighborhoods in the area.
Geography
Bull Mountain is located in the foothills of the Cascade Mountains in Washington County, Oregon. The area is situated on the eastern side of Bull Mountain, a prominent peak in the Tualatin Mountains. The area is known for its rural atmosphere and scenic views of the surrounding mountains and valleys.
The area is home to a number of small streams and creeks, including Bull Creek, which flows through the area. The area is also home to a number of small lakes, including Bull Lake, which is located near the summit of Bull Mountain.
Economy
The economy of Bull Mountain is largely based on the service industry. The area is home to a number of small businesses, including restaurants, retail stores, and other service-oriented businesses. The area is also home to a number of small farms and ranches.
The area is also home to a number of small manufacturing businesses, including a number of small woodworking shops. The area is also home to a number of small wineries and vineyards.
Demographics
As of the 2010 census, the population of Bull Mountain was 4,845. The population is primarily white (90.2%) and Hispanic (4.3%). The median household income in the area is $68,945.
The area is home to a number of small churches, including the Bull Mountain Community Church, which is located in the center of the community. The area is also home to a number of small schools, including the Bull Mountain Elementary School.
Conclusion
Bull Mountain, Oregon is a small unincorporated community located in the foothills of the Cascade Mountains in Washington County, Oregon. The area is known for its rural atmosphere and scenic views of the surrounding mountains and valleys. The economy of the area is largely based on the service industry, and the population is primarily white and Hispanic. The area is home to a number of small businesses, farms, and ranches, as well as a number of small churches and schools.
Common Questions
What is Per Capita Income in Bull Mountain?
Per Capita income in Bull Mountain is $59,121.
What is the Median Family Income in Bull Mountain?
Median Family Income in Bull Mountain is $162,802.
What is the Median Household income in Bull Mountain?
Median Household Income in Bull Mountain is $150,739.
What is Income or Wage Gap in Bull Mountain?
Income or Wage Gap in Bull Mountain is 33.2%.
Women in Bull Mountain earn 66.8 cents for every dollar earned by a man.
What is Inequality or Gini Index in Bull Mountain?
Inequality or Gini Index in Bull Mountain is 0.37.
What is the Total Population of Bull Mountain?
Total Population of Bull Mountain is 9,319.
What is the Total Male Population of Bull Mountain?
Total Male Population of Bull Mountain is 4,548.
What is the Total Female Population of Bull Mountain?
Total Female Population of Bull Mountain is 4,771.
What is the Ratio of Males per 100 Females in Bull Mountain?
There are 95.33 Males per 100 Females in Bull Mountain.
What is the Ratio of Females per 100 Males in Bull Mountain?
There are 104.90 Females per 100 Males in Bull Mountain.
What is the Median Population Age in Bull Mountain?
Median Population Age in Bull Mountain is 41.3 Years.
What is the Average Family Size in Bull Mountain
Average Family Size in Bull Mountain is 3.2 People.
What is the Average Household Size in Bull Mountain
Average Household Size in Bull Mountain is 2.9 People.
How Large is the Labor Force in Bull Mountain?
There are 5,356 People in the Labor Forcein in Bull Mountain.
What is the Percentage of People in the Labor Force in Bull Mountain?
73.9% of People are in the Labor Force in Bull Mountain.
What is the Unemployment Rate in Bull Mountain?
Unemployment Rate in Bull Mountain is 2.1%.