Brownsville, OR Map & Demographics
Brownsville Map
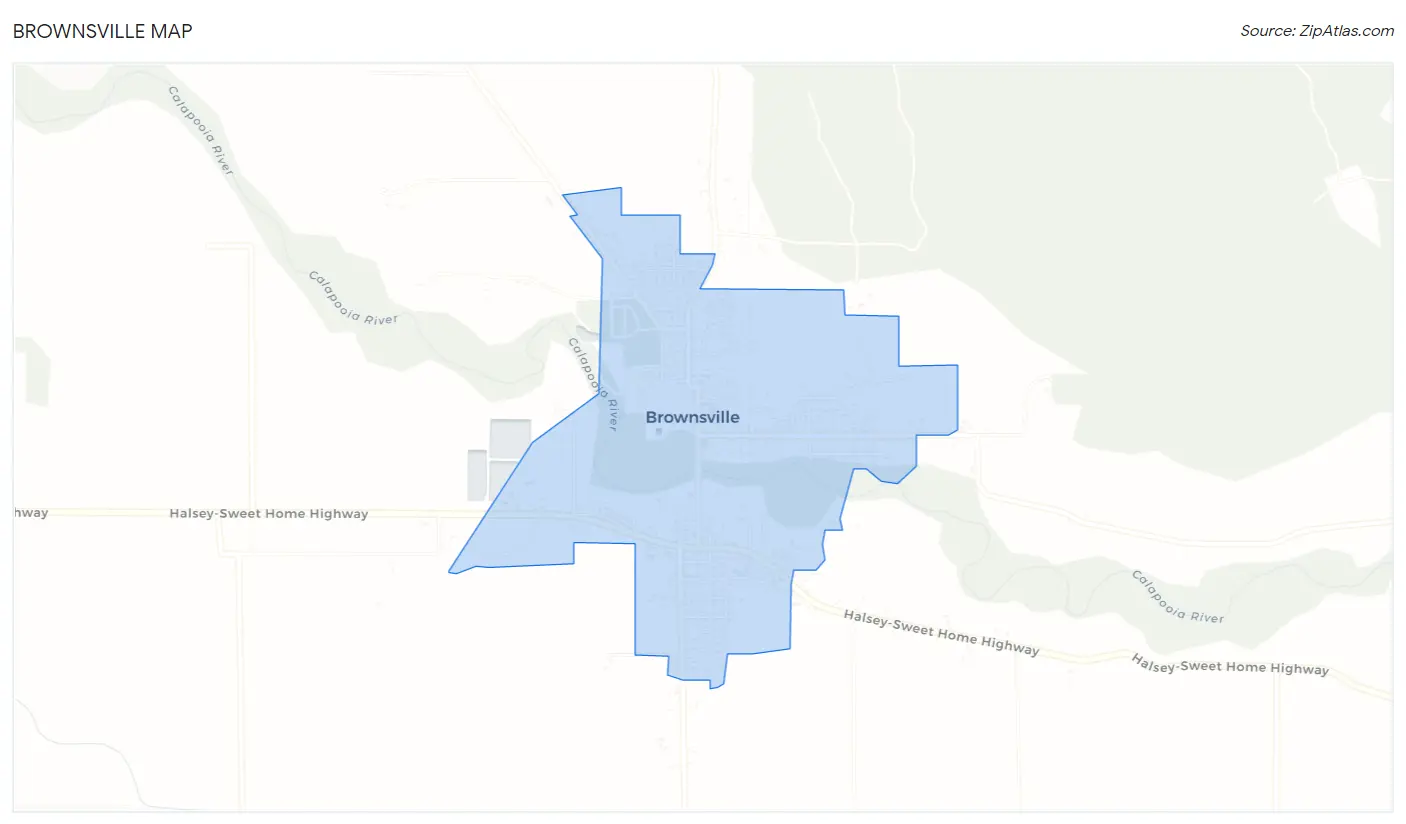
Brownsville Overview
$37,047
PER CAPITA INCOME
$91,563
AVG FAMILY INCOME
$78,348
AVG HOUSEHOLD INCOME
47.4%
WAGE / INCOME GAP [ % ]
52.6¢/ $1
WAGE / INCOME GAP [ $ ]
0.36
INEQUALITY / GINI INDEX
1,832
TOTAL POPULATION
883
MALE POPULATION
949
FEMALE POPULATION
93.05
MALES / 100 FEMALES
107.47
FEMALES / 100 MALES
44.0
MEDIAN AGE
2.9
AVG FAMILY SIZE
2.4
AVG HOUSEHOLD SIZE
904
LABOR FORCE [ PEOPLE ]
61.9%
PERCENT IN LABOR FORCE
2.0%
UNEMPLOYMENT RATE
Brownsville Zip Codes
Brownsville Area Codes
Income in Brownsville
Income Overview in Brownsville
Per Capita Income in Brownsville is $37,047, while median incomes of families and households are $91,563 and $78,348 respectively.
| Characteristic | Number | Measure |
| Per Capita Income | 1,832 | $37,047 |
| Median Family Income | 513 | $91,563 |
| Mean Family Income | 513 | $101,750 |
| Median Household Income | 774 | $78,348 |
| Mean Household Income | 774 | $88,145 |
| Income Deficit | 513 | $0 |
| Wage / Income Gap (%) | 1,832 | 47.43% |
| Wage / Income Gap ($) | 1,832 | 52.57¢ per $1 |
| Gini / Inequality Index | 1,832 | 0.36 |
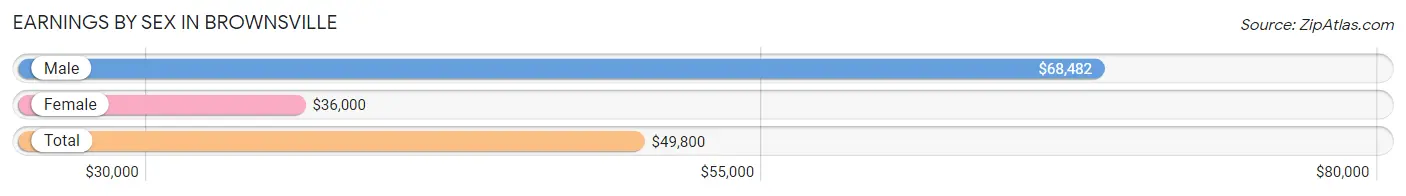
Earnings by Sex in Brownsville
Average Earnings in Brownsville are $49,800, $68,482 for men and $36,000 for women, a difference of 47.4%.
| Sex | Number | Average Earnings |
| Male | 486 (51.4%) | $68,482 |
| Female | 460 (48.6%) | $36,000 |
| Total | 946 (100.0%) | $49,800 |
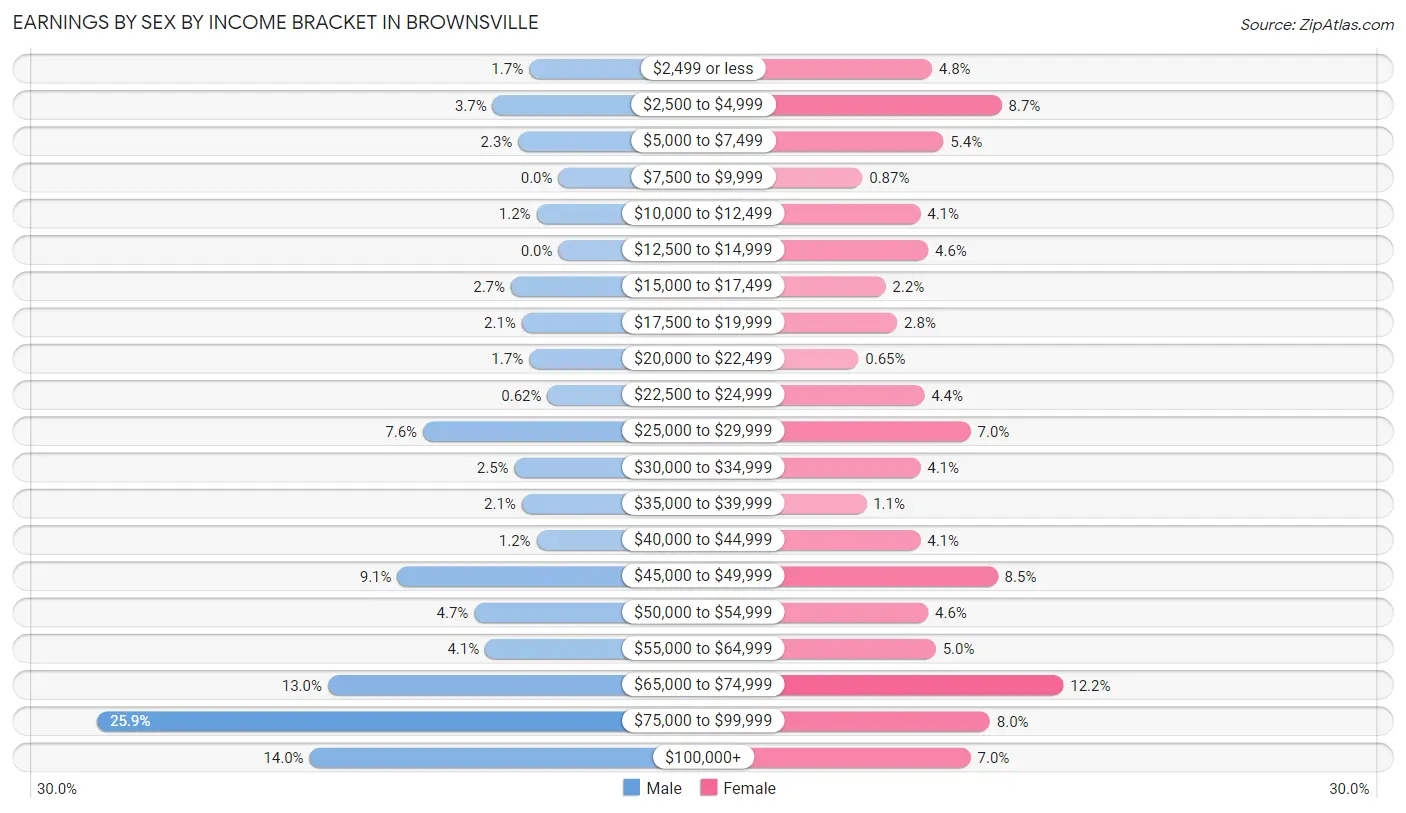
Earnings by Sex by Income Bracket in Brownsville
The most common earnings brackets in Brownsville are $75,000 to $99,999 for men (126 | 25.9%) and $65,000 to $74,999 for women (56 | 12.2%).
| Income | Male | Female |
| $2,499 or less | 8 (1.7%) | 22 (4.8%) |
| $2,500 to $4,999 | 18 (3.7%) | 40 (8.7%) |
| $5,000 to $7,499 | 11 (2.3%) | 25 (5.4%) |
| $7,500 to $9,999 | 0 (0.0%) | 4 (0.9%) |
| $10,000 to $12,499 | 6 (1.2%) | 19 (4.1%) |
| $12,500 to $14,999 | 0 (0.0%) | 21 (4.6%) |
| $15,000 to $17,499 | 13 (2.7%) | 10 (2.2%) |
| $17,500 to $19,999 | 10 (2.1%) | 13 (2.8%) |
| $20,000 to $22,499 | 8 (1.7%) | 3 (0.6%) |
| $22,500 to $24,999 | 3 (0.6%) | 20 (4.3%) |
| $25,000 to $29,999 | 37 (7.6%) | 32 (7.0%) |
| $30,000 to $34,999 | 12 (2.5%) | 19 (4.1%) |
| $35,000 to $39,999 | 10 (2.1%) | 5 (1.1%) |
| $40,000 to $44,999 | 6 (1.2%) | 19 (4.1%) |
| $45,000 to $49,999 | 44 (9.0%) | 39 (8.5%) |
| $50,000 to $54,999 | 23 (4.7%) | 21 (4.6%) |
| $55,000 to $64,999 | 20 (4.1%) | 23 (5.0%) |
| $65,000 to $74,999 | 63 (13.0%) | 56 (12.2%) |
| $75,000 to $99,999 | 126 (25.9%) | 37 (8.0%) |
| $100,000+ | 68 (14.0%) | 32 (7.0%) |
| Total | 486 (100.0%) | 460 (100.0%) |
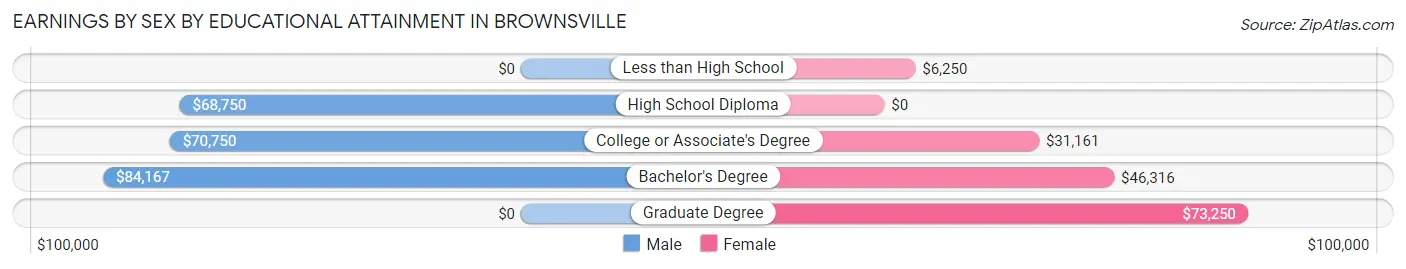
Earnings by Sex by Educational Attainment in Brownsville
Average earnings in Brownsville are $71,458 for men and $44,375 for women, a difference of 37.9%. Men with an educational attainment of bachelor's degree enjoy the highest average annual earnings of $84,167, while those with high school diploma education earn the least with $68,750. Women with an educational attainment of graduate degree earn the most with the average annual earnings of $73,250, while those with less than high school education have the smallest earnings of $6,250.
| Educational Attainment | Male Income | Female Income |
| Less than High School | - | - |
| High School Diploma | $68,750 | $0 |
| College or Associate's Degree | $70,750 | $31,161 |
| Bachelor's Degree | $84,167 | $46,316 |
| Graduate Degree | - | - |
| Total | $71,458 | $44,375 |
Family Income in Brownsville
Family Income Brackets in Brownsville
According to the Brownsville family income data, there are 151 families falling into the $100,000 to $149,999 income range, which is the most common income bracket and makes up 29.4% of all families.
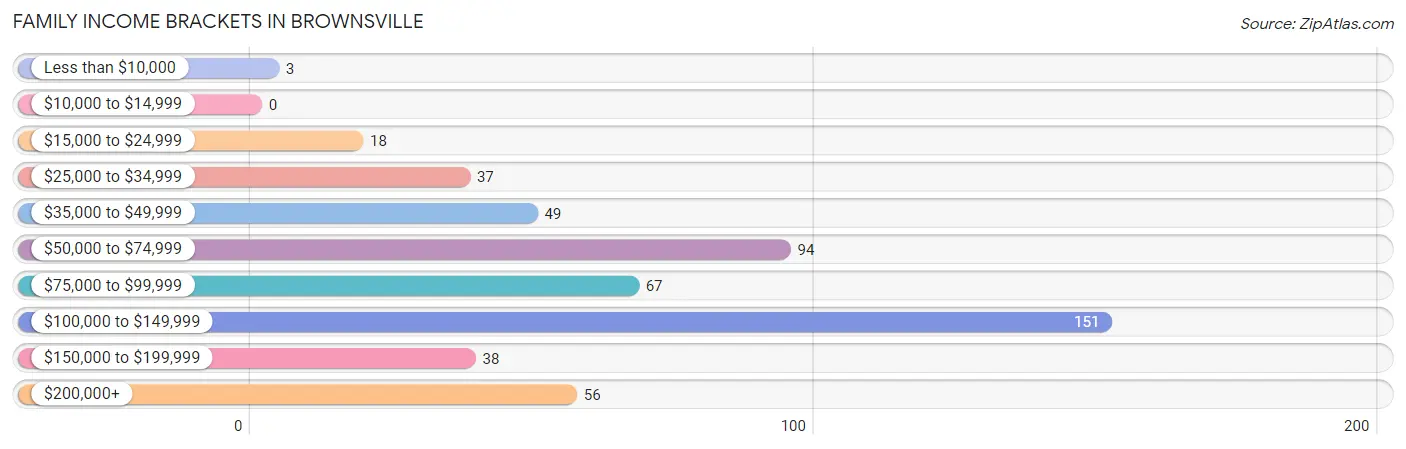
| Income Bracket | # Families | % Families |
| Less than $10,000 | 3 | 0.6% |
| $10,000 to $14,999 | 0 | 0.0% |
| $15,000 to $24,999 | 18 | 3.5% |
| $25,000 to $34,999 | 37 | 7.2% |
| $35,000 to $49,999 | 49 | 9.6% |
| $50,000 to $74,999 | 94 | 18.3% |
| $75,000 to $99,999 | 67 | 13.1% |
| $100,000 to $149,999 | 151 | 29.4% |
| $150,000 to $199,999 | 38 | 7.4% |
| $200,000+ | 56 | 10.9% |
Family Income by Famaliy Size in Brownsville
4-person families (118 | 23.0%) account for the highest median family income in Brownsville with $138,333 per family, while 2-person families (309 | 60.2%) have the highest median income of $45,156 per family member.
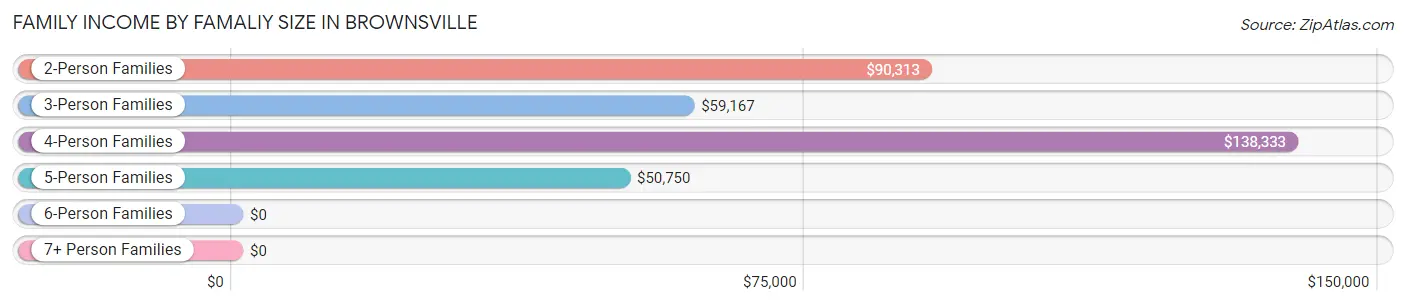
| Income Bracket | # Families | Median Income |
| 2-Person Families | 309 (60.2%) | $90,313 |
| 3-Person Families | 34 (6.6%) | $59,167 |
| 4-Person Families | 118 (23.0%) | $138,333 |
| 5-Person Families | 40 (7.8%) | $50,750 |
| 6-Person Families | 4 (0.8%) | $0 |
| 7+ Person Families | 8 (1.6%) | $0 |
| Total | 513 (100.0%) | $91,563 |
Family Income by Number of Earners in Brownsville
The median family income in Brownsville is $91,563, with families comprising 3+ earners (31) having the highest median family income of $145,114, while families with no earners (73) have the lowest median family income of $51,250, accounting for 6.0% and 14.2% of families, respectively.
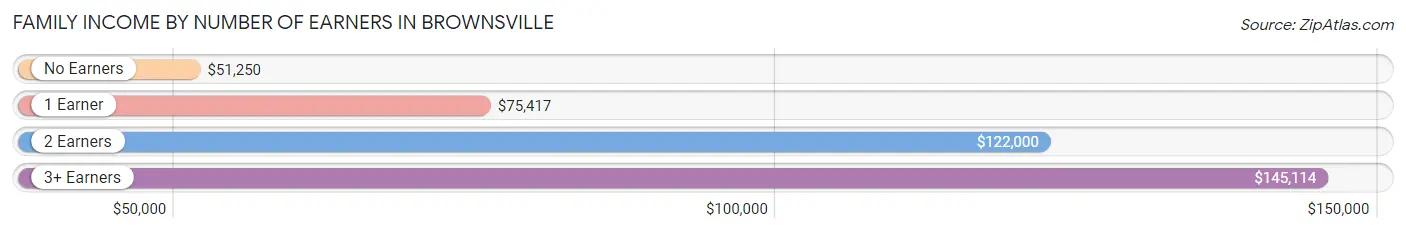
| Number of Earners | # Families | Median Income |
| No Earners | 73 (14.2%) | $51,250 |
| 1 Earner | 181 (35.3%) | $75,417 |
| 2 Earners | 228 (44.4%) | $122,000 |
| 3+ Earners | 31 (6.0%) | $145,114 |
| Total | 513 (100.0%) | $91,563 |
Household Income in Brownsville
Household Income Brackets in Brownsville
With 184 households falling in the category, the $100,000 to $149,999 income range is the most frequent in Brownsville, accounting for 23.8% of all households. In contrast, only 21 households (2.7%) fall into the less than $10,000 income bracket, making it the least populous group.
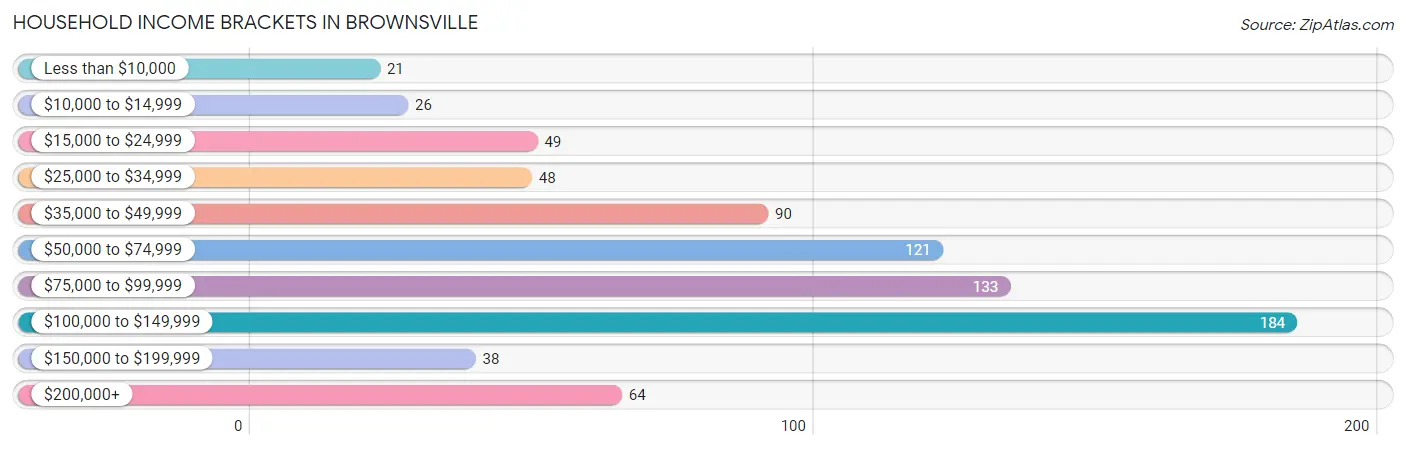
| Income Bracket | # Households | % Households |
| Less than $10,000 | 21 | 2.7% |
| $10,000 to $14,999 | 26 | 3.4% |
| $15,000 to $24,999 | 49 | 6.3% |
| $25,000 to $34,999 | 48 | 6.2% |
| $35,000 to $49,999 | 90 | 11.6% |
| $50,000 to $74,999 | 121 | 15.6% |
| $75,000 to $99,999 | 133 | 17.2% |
| $100,000 to $149,999 | 184 | 23.8% |
| $150,000 to $199,999 | 38 | 4.9% |
| $200,000+ | 64 | 8.3% |
Household Income by Householder Age in Brownsville
The median household income in Brownsville is $78,348, with the highest median household income of $102,813 found in the 45 to 64 years age bracket for the primary householder. A total of 253 households (32.7%) fall into this category. Meanwhile, the 15 to 24 years age bracket for the primary householder has the lowest median household income of $0, with 9 households (1.2%) in this group.
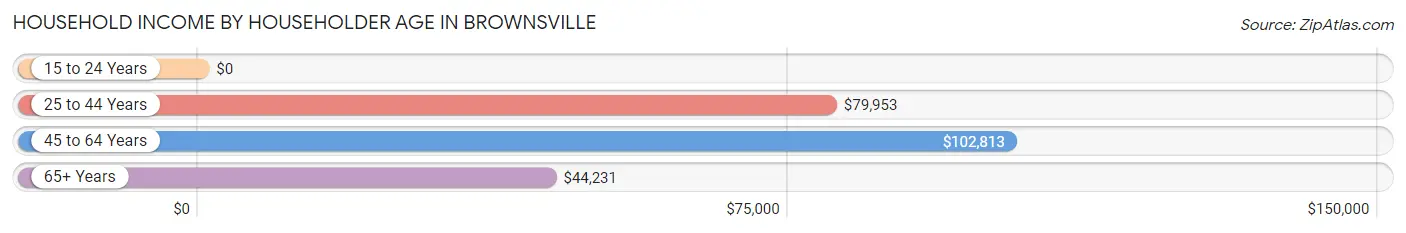
| Income Bracket | # Households | Median Income |
| 15 to 24 Years | 9 (1.2%) | $0 |
| 25 to 44 Years | 278 (35.9%) | $79,953 |
| 45 to 64 Years | 253 (32.7%) | $102,813 |
| 65+ Years | 234 (30.2%) | $44,231 |
| Total | 774 (100.0%) | $78,348 |
Poverty in Brownsville
Income Below Poverty by Sex and Age in Brownsville
With 3.5% poverty level for males and 9.1% for females among the residents of Brownsville, 75 year old and over males and 55 to 64 year old females are the most vulnerable to poverty, with 9 males (13.6%) and 32 females (21.9%) in their respective age groups living below the poverty level.
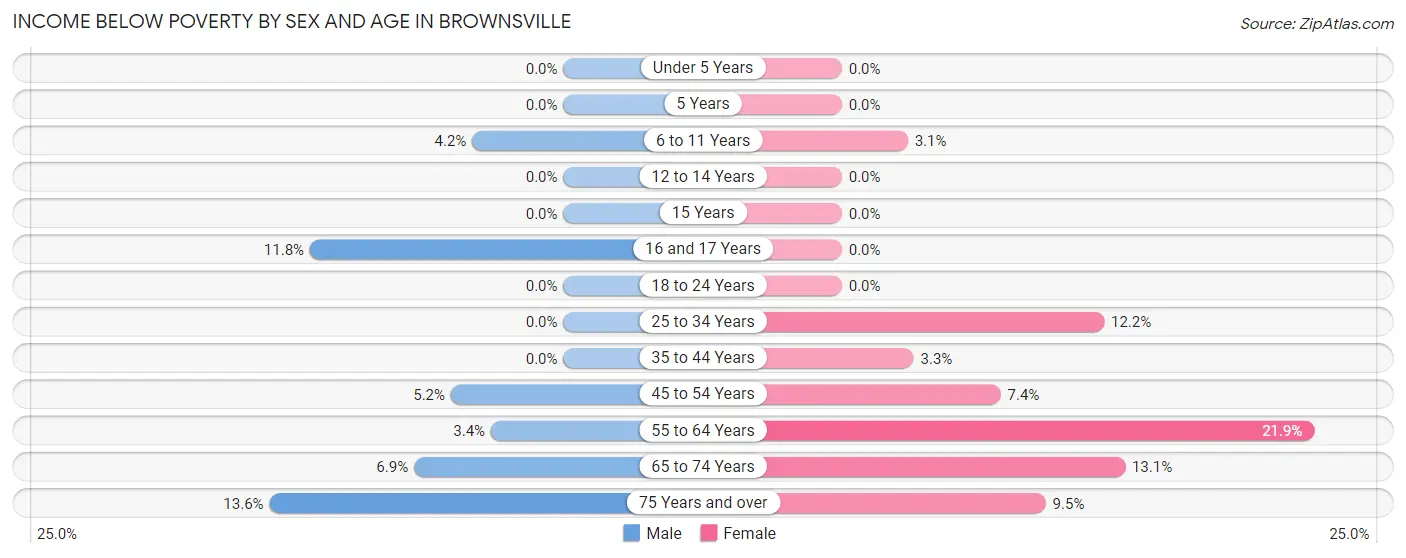
| Age Bracket | Male | Female |
| Under 5 Years | 0 (0.0%) | 0 (0.0%) |
| 5 Years | 0 (0.0%) | 0 (0.0%) |
| 6 to 11 Years | 3 (4.2%) | 3 (3.1%) |
| 12 to 14 Years | 0 (0.0%) | 0 (0.0%) |
| 15 Years | 0 (0.0%) | 0 (0.0%) |
| 16 and 17 Years | 2 (11.8%) | 0 (0.0%) |
| 18 to 24 Years | 0 (0.0%) | 0 (0.0%) |
| 25 to 34 Years | 0 (0.0%) | 14 (12.2%) |
| 35 to 44 Years | 0 (0.0%) | 5 (3.3%) |
| 45 to 54 Years | 6 (5.2%) | 7 (7.4%) |
| 55 to 64 Years | 4 (3.4%) | 32 (21.9%) |
| 65 to 74 Years | 7 (6.9%) | 18 (13.1%) |
| 75 Years and over | 9 (13.6%) | 7 (9.5%) |
| Total | 31 (3.5%) | 86 (9.1%) |
Income Above Poverty by Sex and Age in Brownsville
According to the poverty statistics in Brownsville, males aged under 5 years and females aged under 5 years are the age groups that are most secure financially, with 100.0% of males and 100.0% of females in these age groups living above the poverty line.
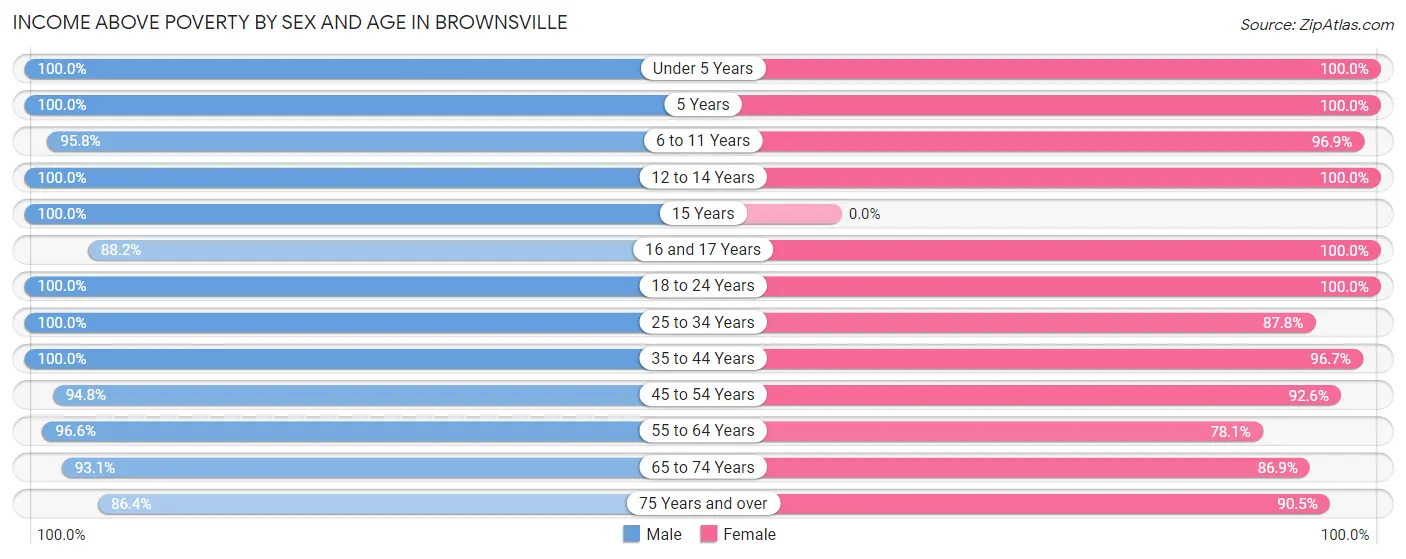
| Age Bracket | Male | Female |
| Under 5 Years | 38 (100.0%) | 34 (100.0%) |
| 5 Years | 5 (100.0%) | 3 (100.0%) |
| 6 to 11 Years | 68 (95.8%) | 95 (96.9%) |
| 12 to 14 Years | 57 (100.0%) | 51 (100.0%) |
| 15 Years | 14 (100.0%) | 0 (0.0%) |
| 16 and 17 Years | 15 (88.2%) | 5 (100.0%) |
| 18 to 24 Years | 55 (100.0%) | 41 (100.0%) |
| 25 to 34 Years | 117 (100.0%) | 101 (87.8%) |
| 35 to 44 Years | 108 (100.0%) | 145 (96.7%) |
| 45 to 54 Years | 109 (94.8%) | 88 (92.6%) |
| 55 to 64 Years | 115 (96.6%) | 114 (78.1%) |
| 65 to 74 Years | 94 (93.1%) | 119 (86.9%) |
| 75 Years and over | 57 (86.4%) | 67 (90.5%) |
| Total | 852 (96.5%) | 863 (90.9%) |
Income Below Poverty Among Married-Couple Families in Brownsville
The poverty statistics for married-couple families in Brownsville show that 1.6% or 7 of the total 429 families live below the poverty line. Families with no children have the highest poverty rate of 2.7%, comprising of 7 families. On the other hand, families with 1 or 2 children have the lowest poverty rate of 0.0%, which includes 0 families.
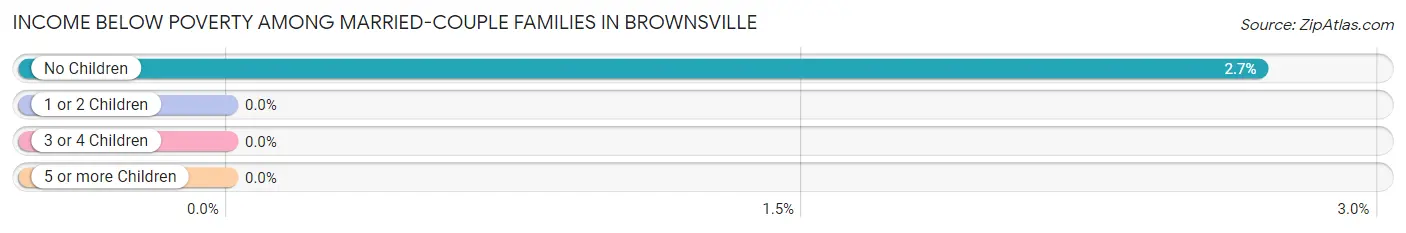
| Children | Above Poverty | Below Poverty |
| No Children | 253 (97.3%) | 7 (2.7%) |
| 1 or 2 Children | 138 (100.0%) | 0 (0.0%) |
| 3 or 4 Children | 31 (100.0%) | 0 (0.0%) |
| 5 or more Children | 0 (0.0%) | 0 (0.0%) |
| Total | 422 (98.4%) | 7 (1.6%) |
Income Below Poverty Among Single-Parent Households in Brownsville
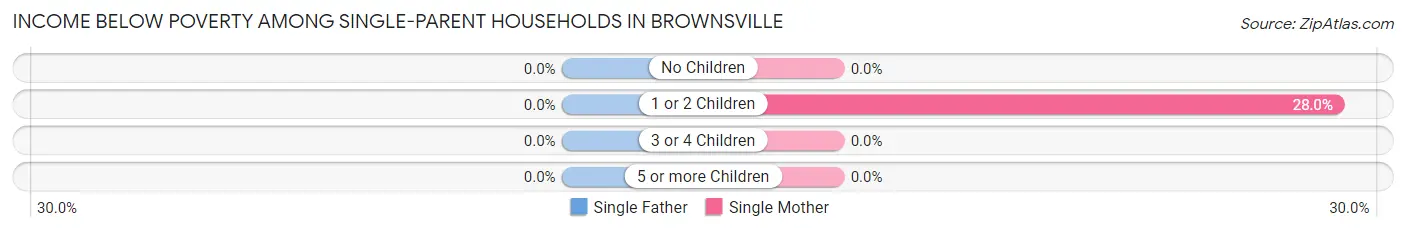
| Children | Single Father | Single Mother |
| No Children | 0 (0.0%) | 0 (0.0%) |
| 1 or 2 Children | 0 (0.0%) | 7 (28.0%) |
| 3 or 4 Children | 0 (0.0%) | 0 (0.0%) |
| 5 or more Children | 0 (0.0%) | 0 (0.0%) |
| Total | 0 (0.0%) | 7 (12.3%) |
Income Below Poverty Among Married-Couple vs Single-Parent Households in Brownsville
The poverty data for Brownsville shows that 7 of the married-couple family households (1.6%) and 7 of the single-parent households (8.3%) are living below the poverty level. Within the married-couple family households, those with no children have the highest poverty rate, with 7 households (2.7%) falling below the poverty line. Among the single-parent households, those with 1 or 2 children have the highest poverty rate, with 7 household (20.0%) living below poverty.
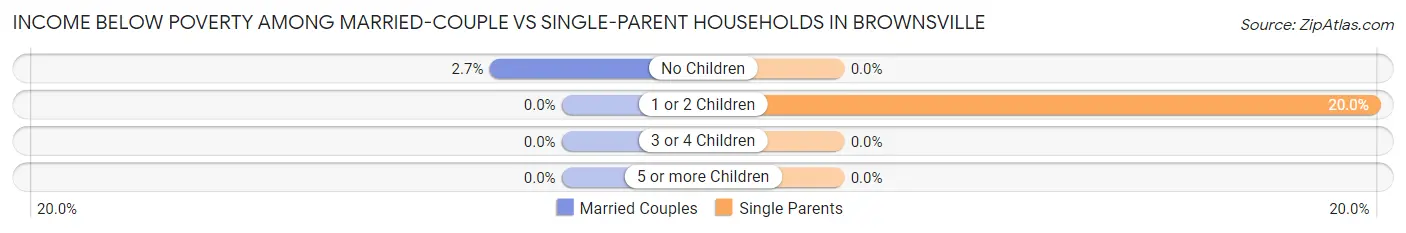
| Children | Married-Couple Families | Single-Parent Households |
| No Children | 7 (2.7%) | 0 (0.0%) |
| 1 or 2 Children | 0 (0.0%) | 7 (20.0%) |
| 3 or 4 Children | 0 (0.0%) | 0 (0.0%) |
| 5 or more Children | 0 (0.0%) | 0 (0.0%) |
| Total | 7 (1.6%) | 7 (8.3%) |
Race in Brownsville
The most populous races in Brownsville are White / Caucasian (1,691 | 92.3%), Two or more Races (89 | 4.9%), and Hispanic or Latino (62 | 3.4%).
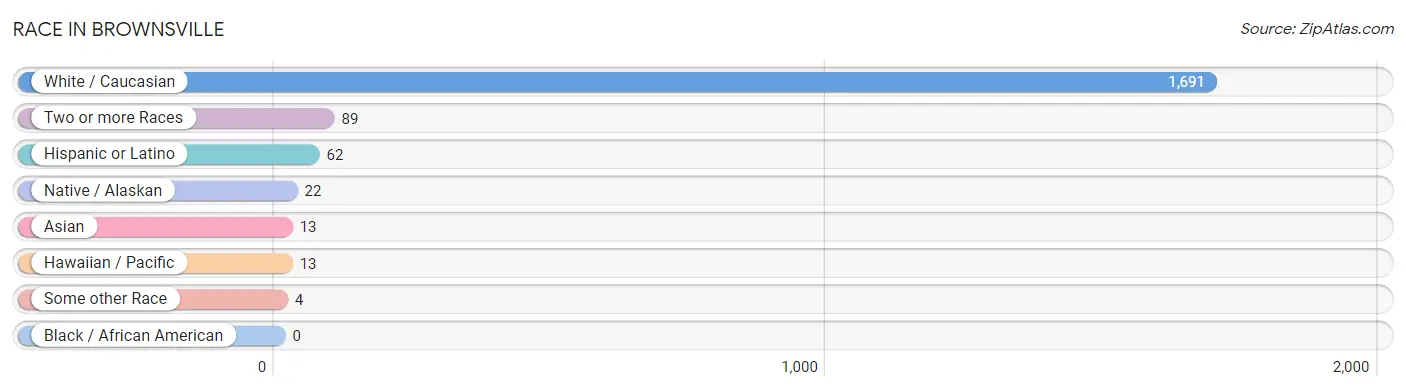
| Race | # Population | % Population |
| Asian | 13 | 0.7% |
| Black / African American | 0 | 0.0% |
| Hawaiian / Pacific | 13 | 0.7% |
| Hispanic or Latino | 62 | 3.4% |
| Native / Alaskan | 22 | 1.2% |
| White / Caucasian | 1,691 | 92.3% |
| Two or more Races | 89 | 4.9% |
| Some other Race | 4 | 0.2% |
| Total | 1,832 | 100.0% |
Ancestry in Brownsville
The most populous ancestries reported in Brownsville are German (530 | 28.9%), Irish (353 | 19.3%), English (201 | 11.0%), European (159 | 8.7%), and Italian (124 | 6.8%), together accounting for 74.6% of all Brownsville residents.
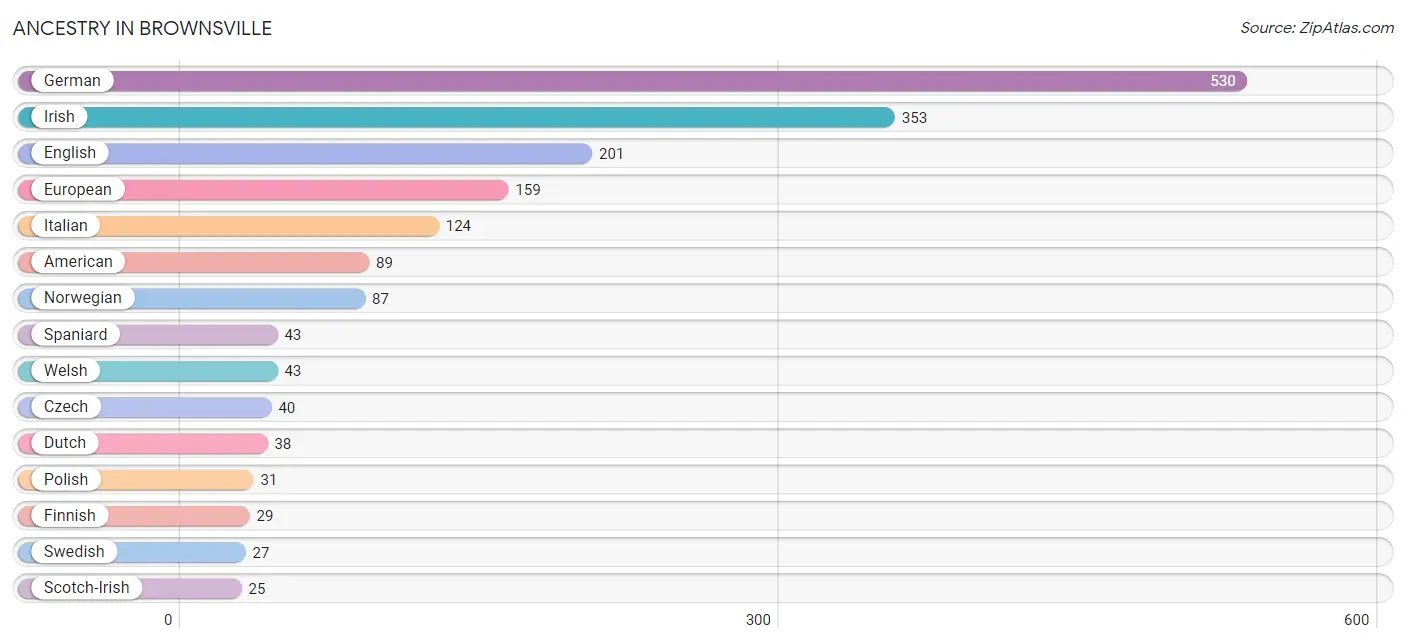
| Ancestry | # Population | % Population |
| American | 89 | 4.9% |
| Bhutanese | 4 | 0.2% |
| Blackfeet | 9 | 0.5% |
| British | 14 | 0.8% |
| Cherokee | 17 | 0.9% |
| Choctaw | 6 | 0.3% |
| Czech | 40 | 2.2% |
| Czechoslovakian | 5 | 0.3% |
| Danish | 22 | 1.2% |
| Dutch | 38 | 2.1% |
| English | 201 | 11.0% |
| European | 159 | 8.7% |
| Finnish | 29 | 1.6% |
| French | 14 | 0.8% |
| French Canadian | 4 | 0.2% |
| German | 530 | 28.9% |
| Irish | 353 | 19.3% |
| Iroquois | 10 | 0.5% |
| Italian | 124 | 6.8% |
| Korean | 13 | 0.7% |
| Laotian | 20 | 1.1% |
| Lithuanian | 3 | 0.2% |
| Mexican | 19 | 1.0% |
| Norwegian | 87 | 4.8% |
| Polish | 31 | 1.7% |
| Scandinavian | 3 | 0.2% |
| Scotch-Irish | 25 | 1.4% |
| Scottish | 19 | 1.0% |
| Spaniard | 43 | 2.4% |
| Swedish | 27 | 1.5% |
| Swiss | 15 | 0.8% |
| Welsh | 43 | 2.4% | View All 32 Rows |
Immigrants in Brownsville
The most numerous immigrant groups reported in Brownsville came from Canada (7 | 0.4%), England (7 | 0.4%), Europe (7 | 0.4%), and Northern Europe (7 | 0.4%), together accounting for 1.5% of all Brownsville residents.
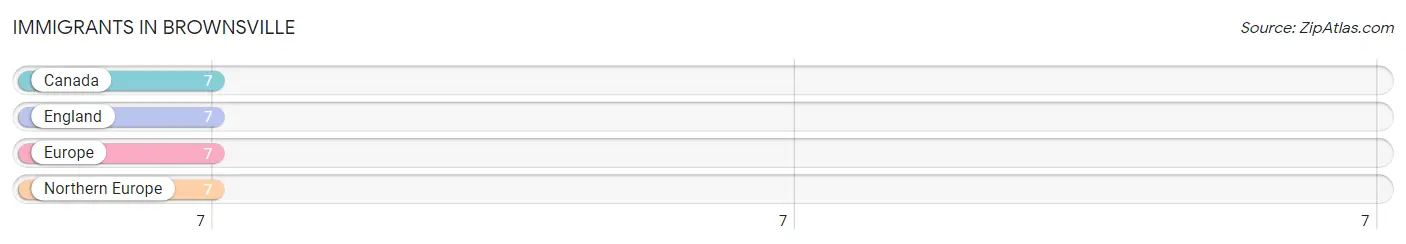
| Immigration Origin | # Population | % Population |
| Canada | 7 | 0.4% |
| England | 7 | 0.4% |
| Europe | 7 | 0.4% |
| Northern Europe | 7 | 0.4% | View All 4 Rows |
Sex and Age in Brownsville
Sex and Age in Brownsville
The most populous age groups in Brownsville are 30 to 34 Years (87 | 9.9%) for men and 10 to 14 Years (100 | 10.5%) for women.
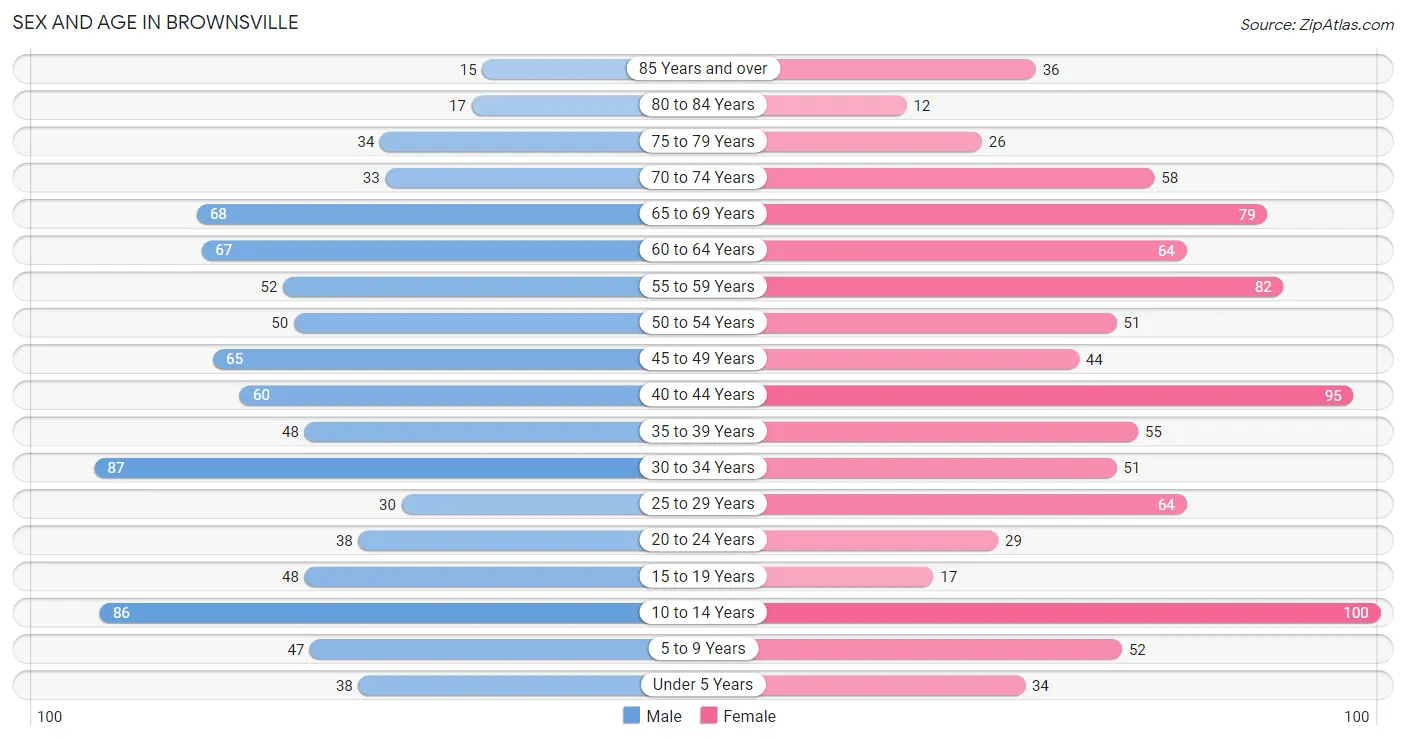
| Age Bracket | Male | Female |
| Under 5 Years | 38 (4.3%) | 34 (3.6%) |
| 5 to 9 Years | 47 (5.3%) | 52 (5.5%) |
| 10 to 14 Years | 86 (9.7%) | 100 (10.5%) |
| 15 to 19 Years | 48 (5.4%) | 17 (1.8%) |
| 20 to 24 Years | 38 (4.3%) | 29 (3.1%) |
| 25 to 29 Years | 30 (3.4%) | 64 (6.7%) |
| 30 to 34 Years | 87 (9.9%) | 51 (5.4%) |
| 35 to 39 Years | 48 (5.4%) | 55 (5.8%) |
| 40 to 44 Years | 60 (6.8%) | 95 (10.0%) |
| 45 to 49 Years | 65 (7.4%) | 44 (4.6%) |
| 50 to 54 Years | 50 (5.7%) | 51 (5.4%) |
| 55 to 59 Years | 52 (5.9%) | 82 (8.6%) |
| 60 to 64 Years | 67 (7.6%) | 64 (6.7%) |
| 65 to 69 Years | 68 (7.7%) | 79 (8.3%) |
| 70 to 74 Years | 33 (3.7%) | 58 (6.1%) |
| 75 to 79 Years | 34 (3.8%) | 26 (2.7%) |
| 80 to 84 Years | 17 (1.9%) | 12 (1.3%) |
| 85 Years and over | 15 (1.7%) | 36 (3.8%) |
| Total | 883 (100.0%) | 949 (100.0%) |
Families and Households in Brownsville
Median Family Size in Brownsville
The median family size in Brownsville is 2.89 persons per family, with married-couple families (429 | 83.6%) accounting for the largest median family size of 3 persons per family. On the other hand, single male/father families (27 | 5.3%) represent the smallest median family size with 2.15 persons per family.
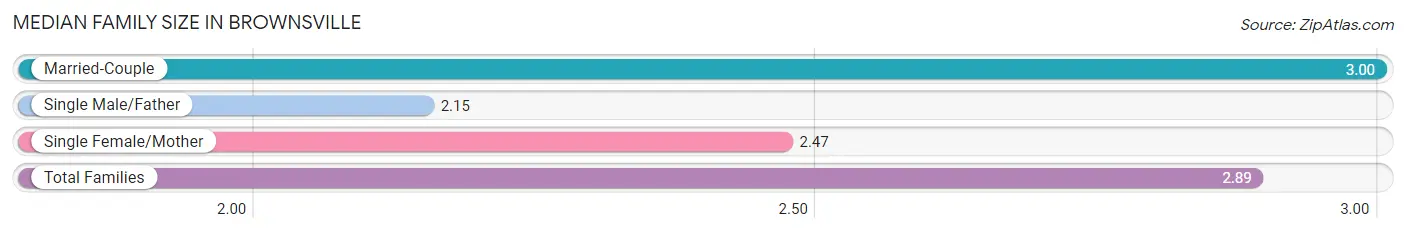
| Family Type | # Families | Family Size |
| Married-Couple | 429 (83.6%) | 3.00 |
| Single Male/Father | 27 (5.3%) | 2.15 |
| Single Female/Mother | 57 (11.1%) | 2.47 |
| Total Families | 513 (100.0%) | 2.89 |
Median Household Size in Brownsville
The median household size in Brownsville is 2.37 persons per household, with married-couple households (429 | 55.4%) accounting for the largest median household size of 3 persons per household. non-family households (261 | 33.7%) represent the smallest median household size with 1.29 persons per household.
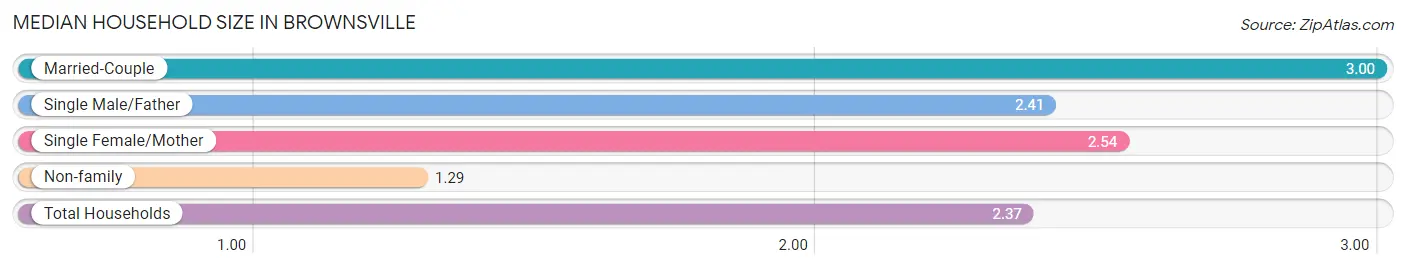
| Household Type | # Households | Household Size |
| Married-Couple | 429 (55.4%) | 3.00 |
| Single Male/Father | 27 (3.5%) | 2.41 |
| Single Female/Mother | 57 (7.4%) | 2.54 |
| Non-family | 261 (33.7%) | 1.29 |
| Total Households | 774 (100.0%) | 2.37 |
Household Size by Marriage Status in Brownsville
Out of a total of 774 households in Brownsville, 513 (66.3%) are family households, while 261 (33.7%) are nonfamily households. The most numerous type of family households are 2-person households, comprising 304, and the most common type of nonfamily households are 1-person households, comprising 205.
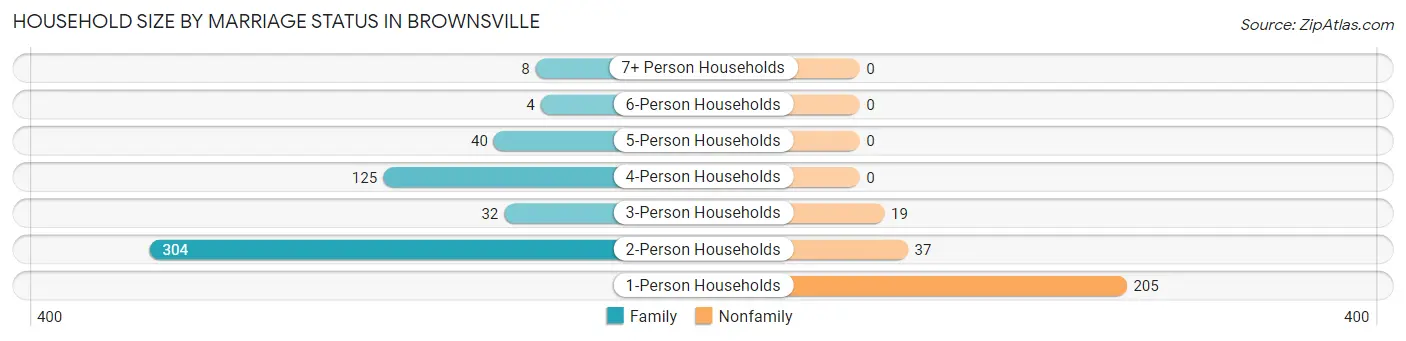
| Household Size | Family Households | Nonfamily Households |
| 1-Person Households | - | 205 (26.5%) |
| 2-Person Households | 304 (39.3%) | 37 (4.8%) |
| 3-Person Households | 32 (4.1%) | 19 (2.5%) |
| 4-Person Households | 125 (16.2%) | 0 (0.0%) |
| 5-Person Households | 40 (5.2%) | 0 (0.0%) |
| 6-Person Households | 4 (0.5%) | 0 (0.0%) |
| 7+ Person Households | 8 (1.0%) | 0 (0.0%) |
| Total | 513 (66.3%) | 261 (33.7%) |
Female Fertility in Brownsville
Fertility by Age in Brownsville
Average fertility rate in Brownsville is 61.0 births per 1,000 women. Women in the age bracket of 20 to 34 years have the highest fertility rate with 153.0 births per 1,000 women. Women in the age bracket of 20 to 34 years acount for 100.0% of all women with births.
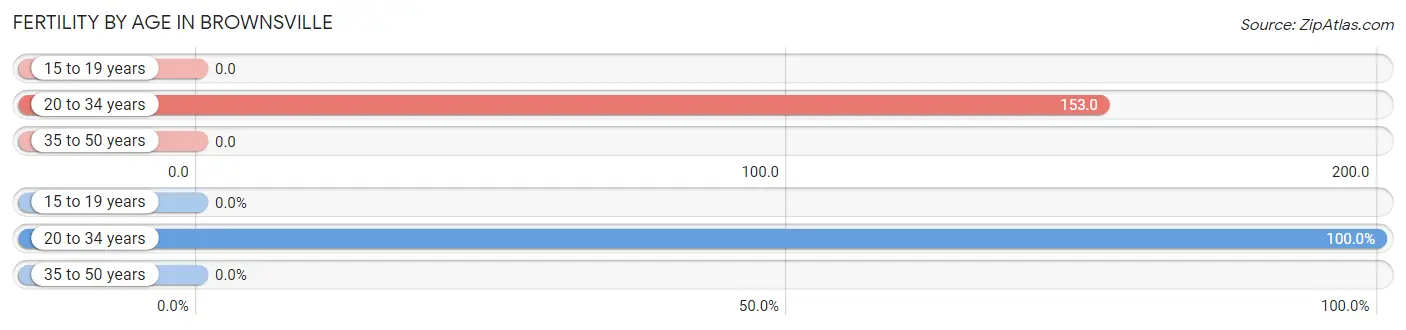
| Age Bracket | Women with Births | Births / 1,000 Women |
| 15 to 19 years | 0 (0.0%) | 0.0 |
| 20 to 34 years | 22 (100.0%) | 153.0 |
| 35 to 50 years | 0 (0.0%) | 0.0 |
| Total | 22 (100.0%) | 61.0 |
Fertility by Age by Marriage Status in Brownsville
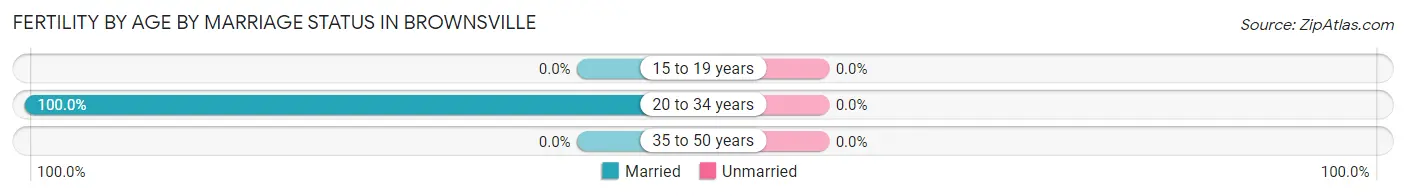
| Age Bracket | Married | Unmarried |
| 15 to 19 years | 0 (0.0%) | 0 (0.0%) |
| 20 to 34 years | 22 (100.0%) | 0 (0.0%) |
| 35 to 50 years | 0 (0.0%) | 0 (0.0%) |
| Total | 22 (100.0%) | 0 (0.0%) |
Fertility by Education in Brownsville
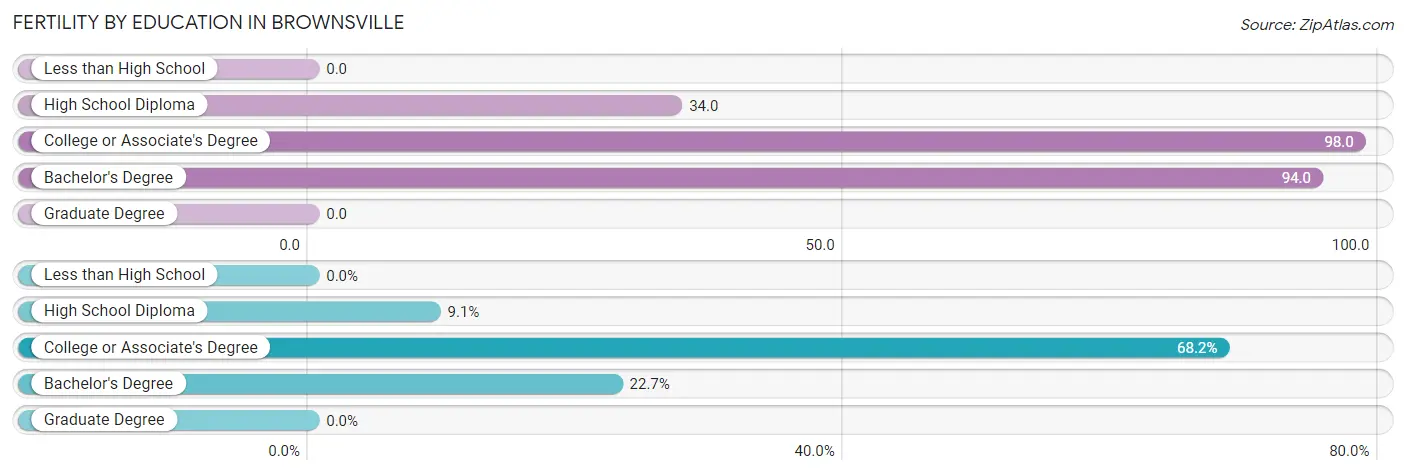
| Educational Attainment | Women with Births | Births / 1,000 Women |
| Less than High School | 0 (0.0%) | 0.0 |
| High School Diploma | 2 (9.1%) | 34.0 |
| College or Associate's Degree | 15 (68.2%) | 98.0 |
| Bachelor's Degree | 5 (22.7%) | 94.0 |
| Graduate Degree | 0 (0.0%) | 0.0 |
| Total | 22 (100.0%) | 61.0 |
Fertility by Education by Marriage Status in Brownsville
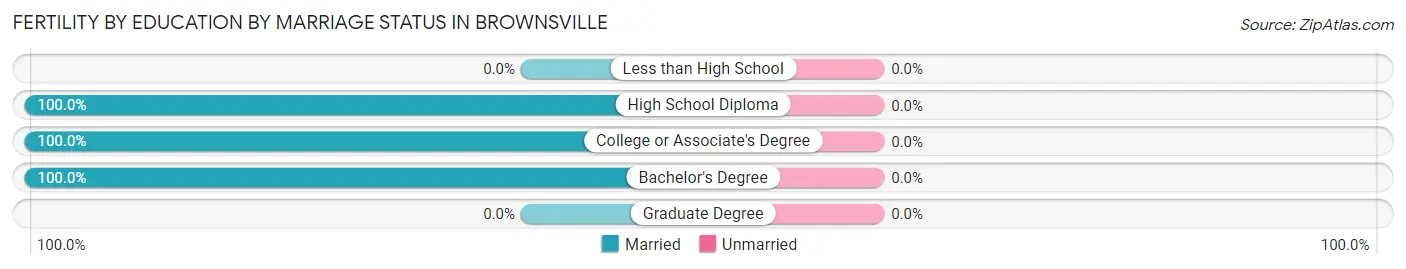
| Educational Attainment | Married | Unmarried |
| Less than High School | 0 (0.0%) | 0 (0.0%) |
| High School Diploma | 2 (100.0%) | 0 (0.0%) |
| College or Associate's Degree | 15 (100.0%) | 0 (0.0%) |
| Bachelor's Degree | 5 (100.0%) | 0 (0.0%) |
| Graduate Degree | 0 (0.0%) | 0 (0.0%) |
| Total | 22 (100.0%) | 0 (0.0%) |
Employment Characteristics in Brownsville
Employment by Class of Employer in Brownsville
Among the 883 employed individuals in Brownsville, private company employees (489 | 55.4%), local government employees (123 | 13.9%), and self-employed (not incorporated) (89 | 10.1%) make up the most common classes of employment.
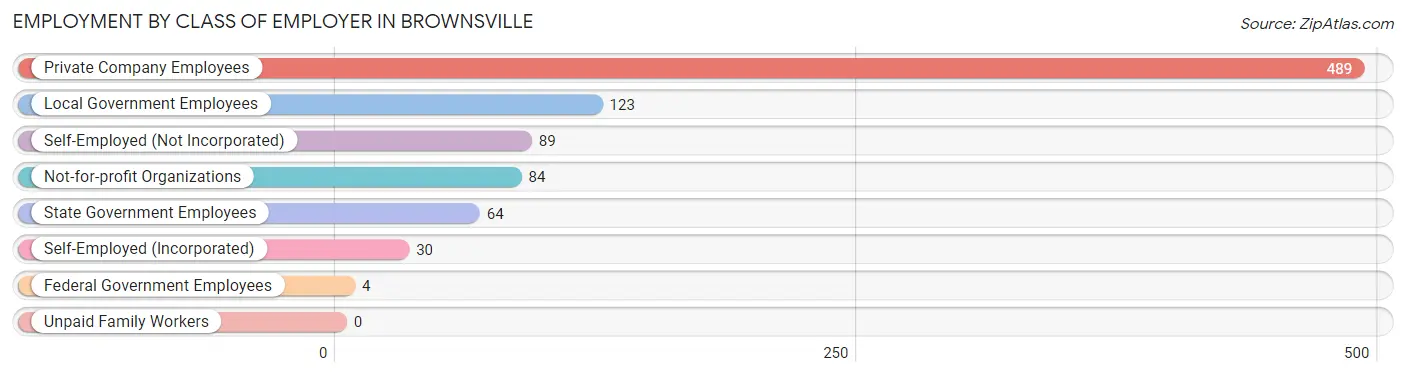
| Employer Class | # Employees | % Employees |
| Private Company Employees | 489 | 55.4% |
| Self-Employed (Incorporated) | 30 | 3.4% |
| Self-Employed (Not Incorporated) | 89 | 10.1% |
| Not-for-profit Organizations | 84 | 9.5% |
| Local Government Employees | 123 | 13.9% |
| State Government Employees | 64 | 7.2% |
| Federal Government Employees | 4 | 0.4% |
| Unpaid Family Workers | 0 | 0.0% |
| Total | 883 | 100.0% |
Employment Status by Age in Brownsville
According to the labor force statistics for Brownsville, out of the total population over 16 years of age (1,461), 61.9% or 904 individuals are in the labor force, with 2.0% or 18 of them unemployed. The age group with the highest labor force participation rate is 35 to 44 years, with 92.2% or 238 individuals in the labor force. Within the labor force, the 65 to 74 years age range has the highest percentage of unemployed individuals, with 10.6% or 5 of them being unemployed.
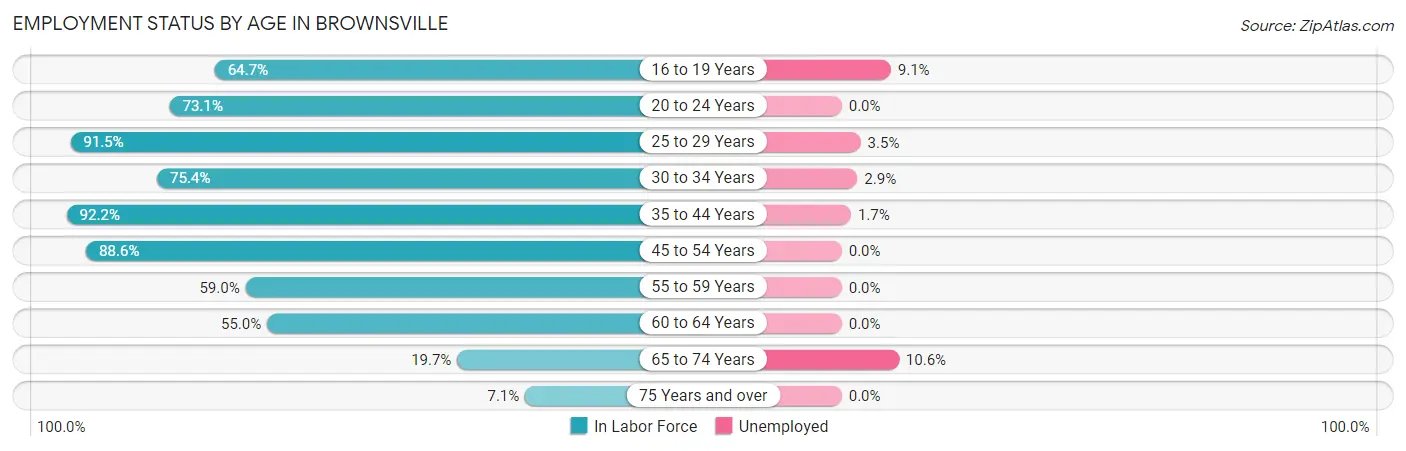
| Age Bracket | In Labor Force | Unemployed |
| 16 to 19 Years | 33 (64.7%) | 3 (9.1%) |
| 20 to 24 Years | 49 (73.1%) | 0 (0.0%) |
| 25 to 29 Years | 86 (91.5%) | 3 (3.5%) |
| 30 to 34 Years | 104 (75.4%) | 3 (2.9%) |
| 35 to 44 Years | 238 (92.2%) | 4 (1.7%) |
| 45 to 54 Years | 186 (88.6%) | 0 (0.0%) |
| 55 to 59 Years | 79 (59.0%) | 0 (0.0%) |
| 60 to 64 Years | 72 (55.0%) | 0 (0.0%) |
| 65 to 74 Years | 47 (19.7%) | 5 (10.6%) |
| 75 Years and over | 10 (7.1%) | 0 (0.0%) |
| Total | 904 (61.9%) | 18 (2.0%) |
Employment Status by Educational Attainment in Brownsville
According to labor force statistics for Brownsville, 79.3% of individuals (765) out of the total population between 25 and 64 years of age (965) are in the labor force, with 1.3% or 10 of them being unemployed. The group with the highest labor force participation rate are those with the educational attainment of bachelor's degree or higher, with 91.5% or 249 individuals in the labor force. Within the labor force, individuals with high school diploma education have the highest percentage of unemployment, with 1.5% or 3 of them being unemployed.
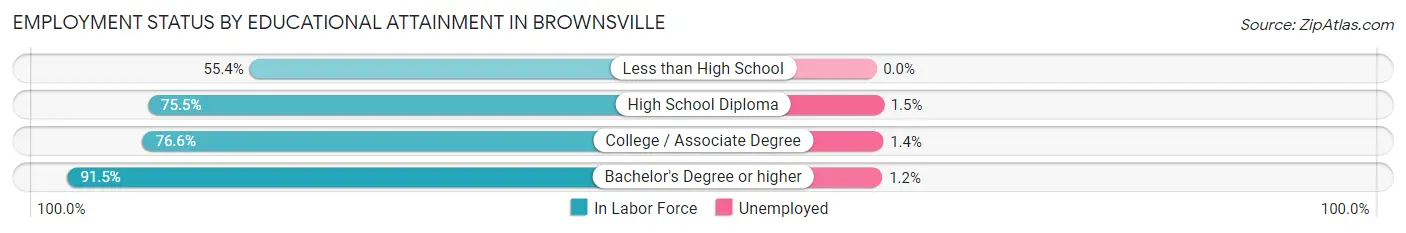
| Educational Attainment | In Labor Force | Unemployed |
| Less than High School | 31 (55.4%) | 0 (0.0%) |
| High School Diploma | 197 (75.5%) | 4 (1.5%) |
| College / Associate Degree | 288 (76.6%) | 5 (1.4%) |
| Bachelor's Degree or higher | 249 (91.5%) | 3 (1.2%) |
| Total | 765 (79.3%) | 13 (1.3%) |
Employment Occupations by Sex in Brownsville
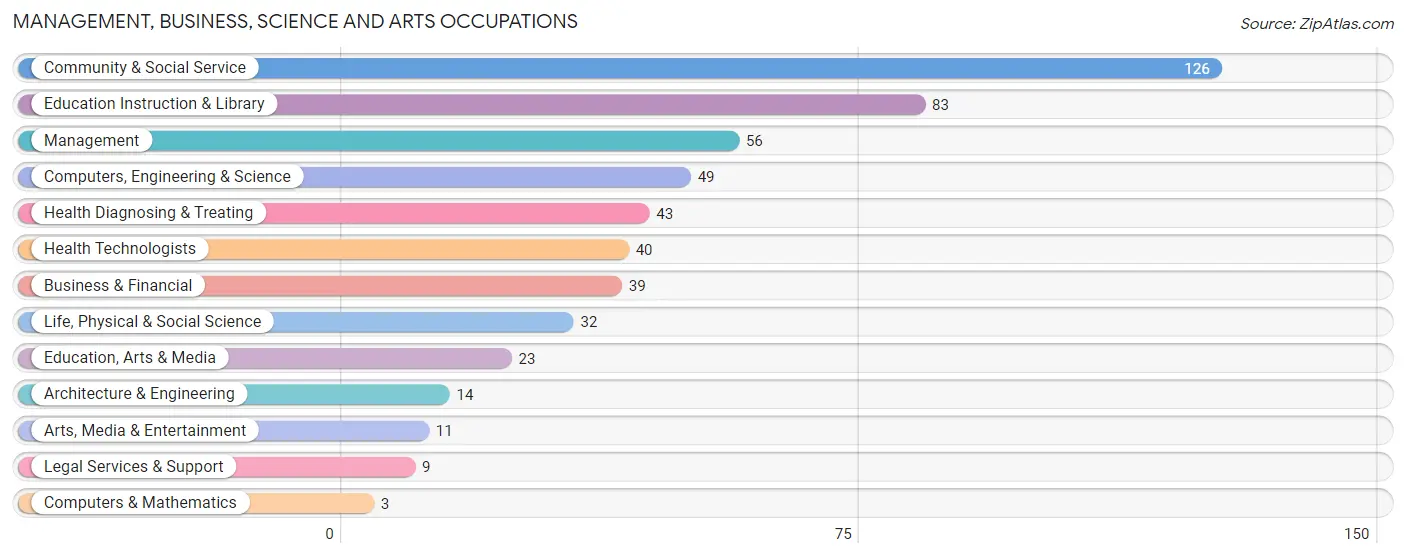
Management, Business, Science and Arts Occupations
The most common Management, Business, Science and Arts occupations in Brownsville are Community & Social Service (126 | 14.2%), Education Instruction & Library (83 | 9.4%), Management (56 | 6.3%), Computers, Engineering & Science (49 | 5.5%), and Health Diagnosing & Treating (43 | 4.9%).
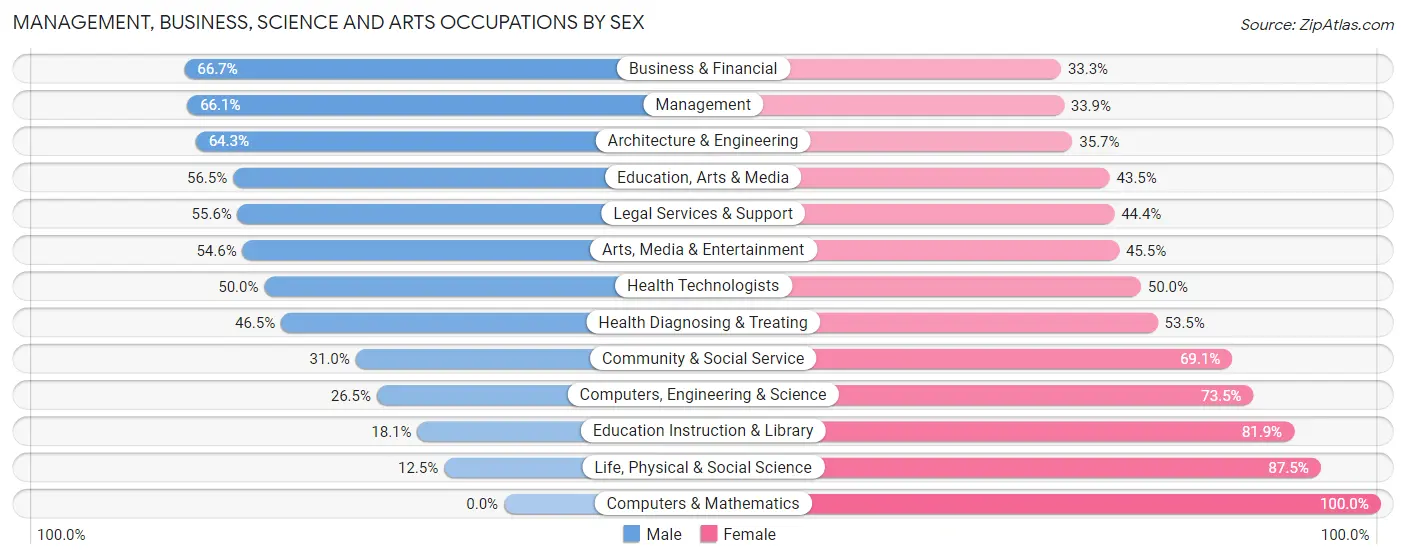
Management, Business, Science and Arts Occupations by Sex
Within the Management, Business, Science and Arts occupations in Brownsville, the most male-oriented occupations are Business & Financial (66.7%), Management (66.1%), and Architecture & Engineering (64.3%), while the most female-oriented occupations are Computers & Mathematics (100.0%), Life, Physical & Social Science (87.5%), and Education Instruction & Library (81.9%).
| Occupation | Male | Female |
| Management | 37 (66.1%) | 19 (33.9%) |
| Business & Financial | 26 (66.7%) | 13 (33.3%) |
| Computers, Engineering & Science | 13 (26.5%) | 36 (73.5%) |
| Computers & Mathematics | 0 (0.0%) | 3 (100.0%) |
| Architecture & Engineering | 9 (64.3%) | 5 (35.7%) |
| Life, Physical & Social Science | 4 (12.5%) | 28 (87.5%) |
| Community & Social Service | 39 (30.9%) | 87 (69.1%) |
| Education, Arts & Media | 13 (56.5%) | 10 (43.5%) |
| Legal Services & Support | 5 (55.6%) | 4 (44.4%) |
| Education Instruction & Library | 15 (18.1%) | 68 (81.9%) |
| Arts, Media & Entertainment | 6 (54.5%) | 5 (45.5%) |
| Health Diagnosing & Treating | 20 (46.5%) | 23 (53.5%) |
| Health Technologists | 20 (50.0%) | 20 (50.0%) |
| Total (Category) | 135 (43.1%) | 178 (56.9%) |
| Total (Overall) | 464 (52.4%) | 422 (47.6%) |
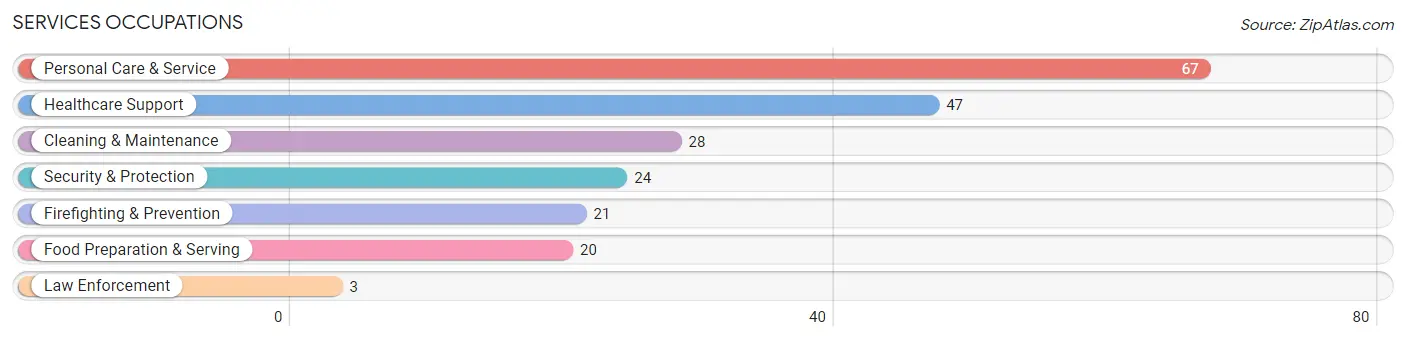
Services Occupations
The most common Services occupations in Brownsville are Personal Care & Service (67 | 7.6%), Healthcare Support (47 | 5.3%), Cleaning & Maintenance (28 | 3.2%), Security & Protection (24 | 2.7%), and Firefighting & Prevention (21 | 2.4%).
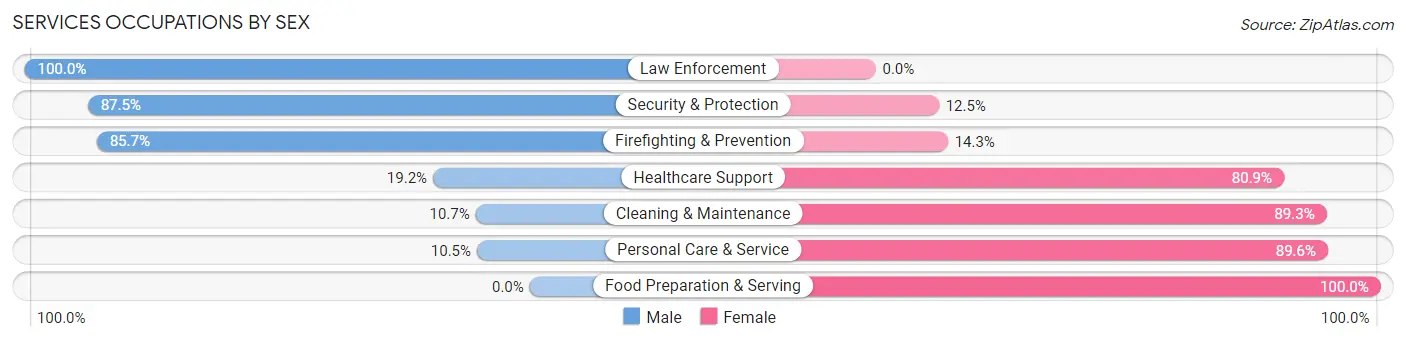
Services Occupations by Sex
Within the Services occupations in Brownsville, the most male-oriented occupations are Law Enforcement (100.0%), Security & Protection (87.5%), and Firefighting & Prevention (85.7%), while the most female-oriented occupations are Food Preparation & Serving (100.0%), Personal Care & Service (89.5%), and Cleaning & Maintenance (89.3%).
| Occupation | Male | Female |
| Healthcare Support | 9 (19.2%) | 38 (80.8%) |
| Security & Protection | 21 (87.5%) | 3 (12.5%) |
| Firefighting & Prevention | 18 (85.7%) | 3 (14.3%) |
| Law Enforcement | 3 (100.0%) | 0 (0.0%) |
| Food Preparation & Serving | 0 (0.0%) | 20 (100.0%) |
| Cleaning & Maintenance | 3 (10.7%) | 25 (89.3%) |
| Personal Care & Service | 7 (10.4%) | 60 (89.5%) |
| Total (Category) | 40 (21.5%) | 146 (78.5%) |
| Total (Overall) | 464 (52.4%) | 422 (47.6%) |
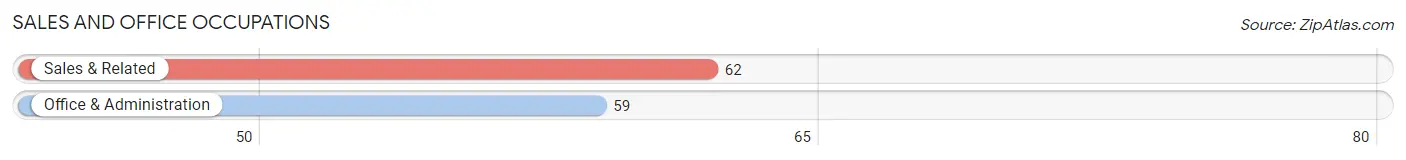
Sales and Office Occupations
The most common Sales and Office occupations in Brownsville are Sales & Related (62 | 7.0%), and Office & Administration (59 | 6.7%).
Sales and Office Occupations by Sex
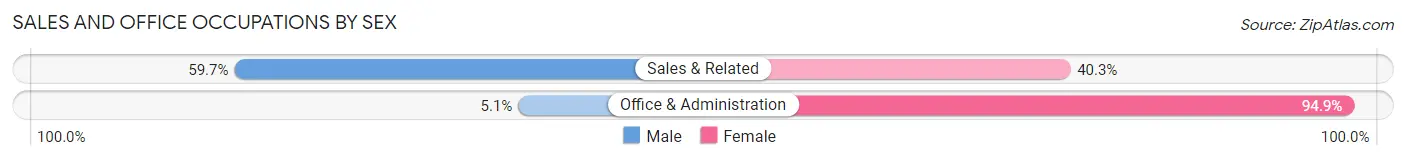
| Occupation | Male | Female |
| Sales & Related | 37 (59.7%) | 25 (40.3%) |
| Office & Administration | 3 (5.1%) | 56 (94.9%) |
| Total (Category) | 40 (33.1%) | 81 (66.9%) |
| Total (Overall) | 464 (52.4%) | 422 (47.6%) |
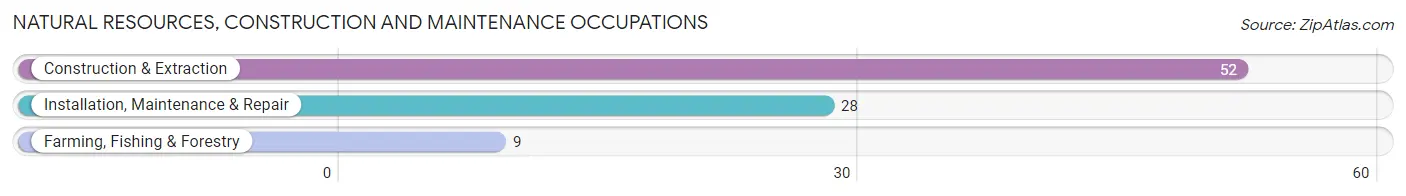
Natural Resources, Construction and Maintenance Occupations
The most common Natural Resources, Construction and Maintenance occupations in Brownsville are Construction & Extraction (52 | 5.9%), Installation, Maintenance & Repair (28 | 3.2%), and Farming, Fishing & Forestry (9 | 1.0%).
Natural Resources, Construction and Maintenance Occupations by Sex
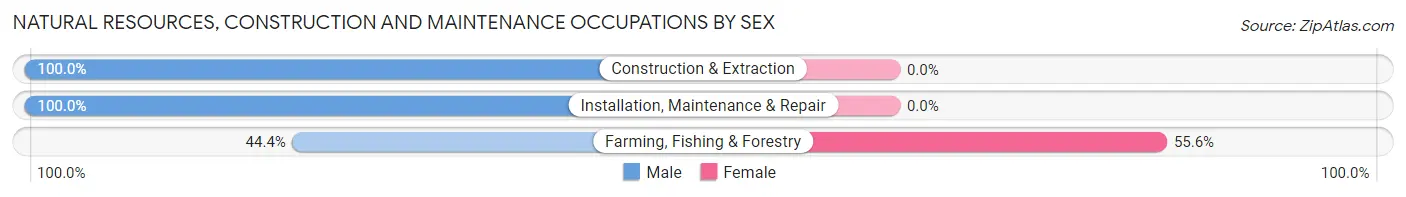
| Occupation | Male | Female |
| Farming, Fishing & Forestry | 4 (44.4%) | 5 (55.6%) |
| Construction & Extraction | 52 (100.0%) | 0 (0.0%) |
| Installation, Maintenance & Repair | 28 (100.0%) | 0 (0.0%) |
| Total (Category) | 84 (94.4%) | 5 (5.6%) |
| Total (Overall) | 464 (52.4%) | 422 (47.6%) |
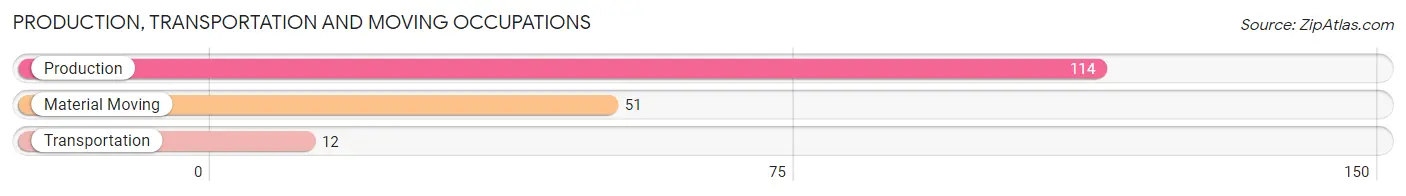
Production, Transportation and Moving Occupations
The most common Production, Transportation and Moving occupations in Brownsville are Production (114 | 12.9%), Material Moving (51 | 5.8%), and Transportation (12 | 1.3%).
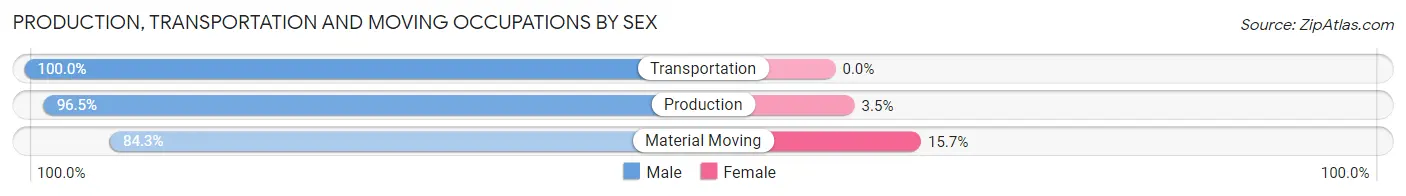
Production, Transportation and Moving Occupations by Sex
| Occupation | Male | Female |
| Production | 110 (96.5%) | 4 (3.5%) |
| Transportation | 12 (100.0%) | 0 (0.0%) |
| Material Moving | 43 (84.3%) | 8 (15.7%) |
| Total (Category) | 165 (93.2%) | 12 (6.8%) |
| Total (Overall) | 464 (52.4%) | 422 (47.6%) |
Employment Industries by Sex in Brownsville
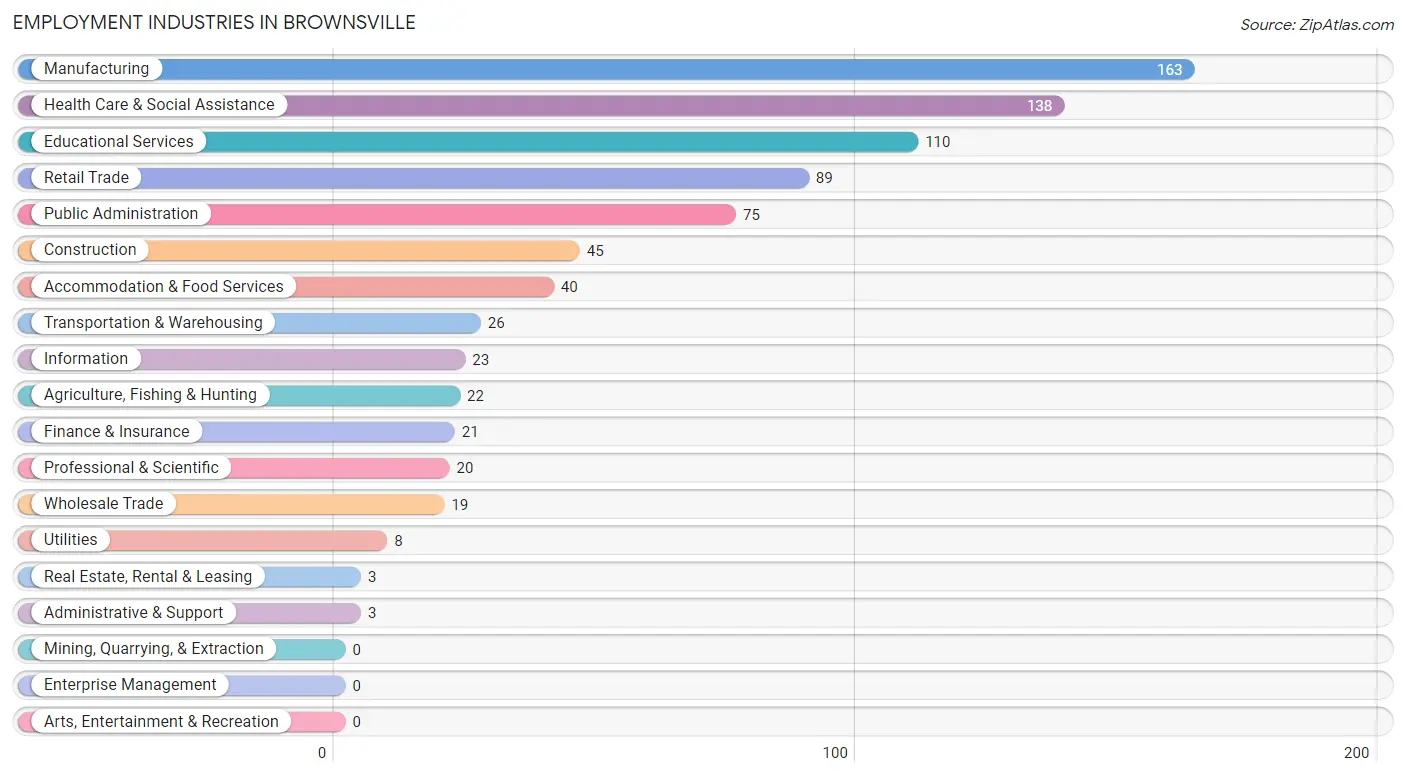
Employment Industries in Brownsville
The major employment industries in Brownsville include Manufacturing (163 | 18.4%), Health Care & Social Assistance (138 | 15.6%), Educational Services (110 | 12.4%), Retail Trade (89 | 10.1%), and Public Administration (75 | 8.5%).
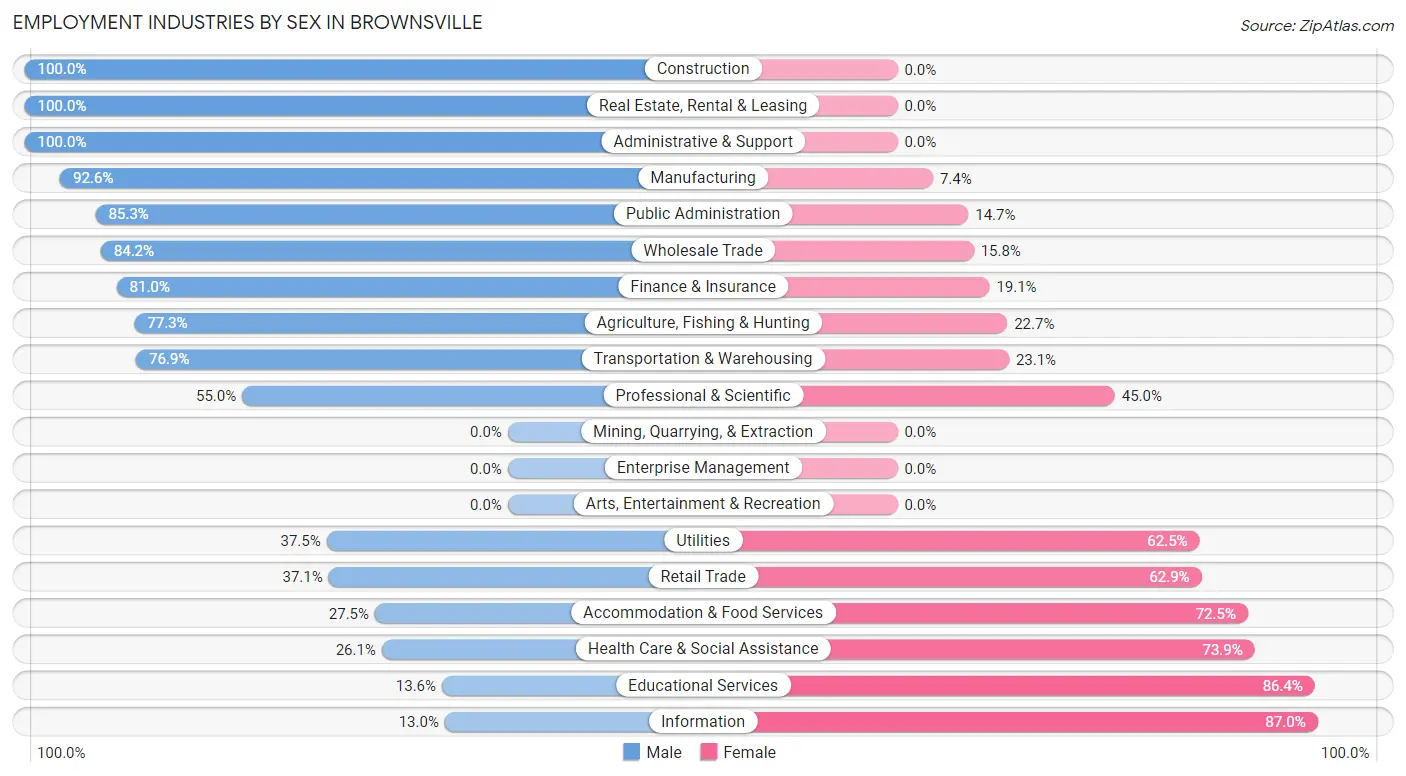
Employment Industries by Sex in Brownsville
The Brownsville industries that see more men than women are Construction (100.0%), Real Estate, Rental & Leasing (100.0%), and Administrative & Support (100.0%), whereas the industries that tend to have a higher number of women are Information (87.0%), Educational Services (86.4%), and Health Care & Social Assistance (73.9%).
| Industry | Male | Female |
| Agriculture, Fishing & Hunting | 17 (77.3%) | 5 (22.7%) |
| Mining, Quarrying, & Extraction | 0 (0.0%) | 0 (0.0%) |
| Construction | 45 (100.0%) | 0 (0.0%) |
| Manufacturing | 151 (92.6%) | 12 (7.4%) |
| Wholesale Trade | 16 (84.2%) | 3 (15.8%) |
| Retail Trade | 33 (37.1%) | 56 (62.9%) |
| Transportation & Warehousing | 20 (76.9%) | 6 (23.1%) |
| Utilities | 3 (37.5%) | 5 (62.5%) |
| Information | 3 (13.0%) | 20 (87.0%) |
| Finance & Insurance | 17 (80.9%) | 4 (19.1%) |
| Real Estate, Rental & Leasing | 3 (100.0%) | 0 (0.0%) |
| Professional & Scientific | 11 (55.0%) | 9 (45.0%) |
| Enterprise Management | 0 (0.0%) | 0 (0.0%) |
| Administrative & Support | 3 (100.0%) | 0 (0.0%) |
| Educational Services | 15 (13.6%) | 95 (86.4%) |
| Health Care & Social Assistance | 36 (26.1%) | 102 (73.9%) |
| Arts, Entertainment & Recreation | 0 (0.0%) | 0 (0.0%) |
| Accommodation & Food Services | 11 (27.5%) | 29 (72.5%) |
| Public Administration | 64 (85.3%) | 11 (14.7%) |
| Total | 464 (52.4%) | 422 (47.6%) |
Education in Brownsville
School Enrollment in Brownsville
The most common levels of schooling among the 379 students in Brownsville are elementary school (123 | 32.5%), middle school (112 | 29.5%), and college / undergraduate (60 | 15.8%).
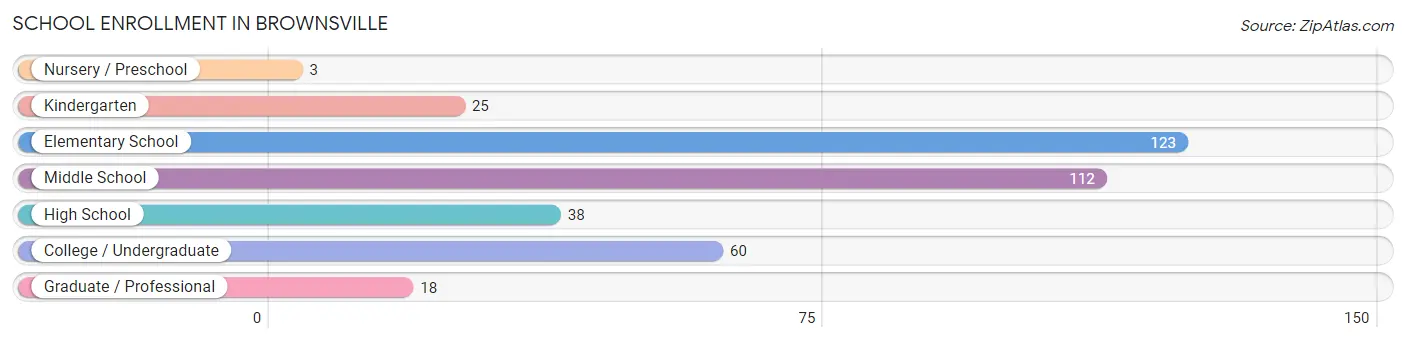
| School Level | # Students | % Students |
| Nursery / Preschool | 3 | 0.8% |
| Kindergarten | 25 | 6.6% |
| Elementary School | 123 | 32.5% |
| Middle School | 112 | 29.5% |
| High School | 38 | 10.0% |
| College / Undergraduate | 60 | 15.8% |
| Graduate / Professional | 18 | 4.8% |
| Total | 379 | 100.0% |
School Enrollment by Age by Funding Source in Brownsville
Out of a total of 379 students who are enrolled in schools in Brownsville, 103 (27.2%) attend a private institution, while the remaining 276 (72.8%) are enrolled in public schools. The age group of 18 to 19 year olds has the highest likelihood of being enrolled in private schools, with 11 (84.6% in the age bracket) enrolled. Conversely, the age group of 20 to 24 year olds has the lowest likelihood of being enrolled in a private school, with 22 (100.0% in the age bracket) attending a public institution.
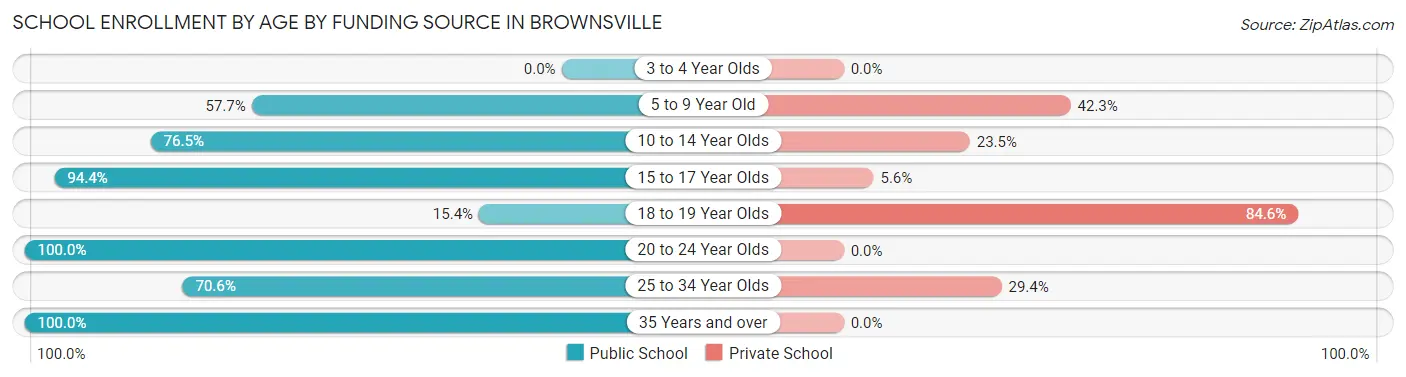
| Age Bracket | Public School | Private School |
| 3 to 4 Year Olds | 0 (0.0%) | 0 (0.0%) |
| 5 to 9 Year Old | 56 (57.7%) | 41 (42.3%) |
| 10 to 14 Year Olds | 127 (76.5%) | 39 (23.5%) |
| 15 to 17 Year Olds | 34 (94.4%) | 2 (5.6%) |
| 18 to 19 Year Olds | 2 (15.4%) | 11 (84.6%) |
| 20 to 24 Year Olds | 22 (100.0%) | 0 (0.0%) |
| 25 to 34 Year Olds | 24 (70.6%) | 10 (29.4%) |
| 35 Years and over | 11 (100.0%) | 0 (0.0%) |
| Total | 276 (72.8%) | 103 (27.2%) |
Educational Attainment by Field of Study in Brownsville
Bio, nature & agricultural (67 | 17.3%), education (60 | 15.5%), arts & humanities (46 | 11.9%), science & technology (36 | 9.3%), and psychology (32 | 8.3%) are the most common fields of study among 387 individuals in Brownsville who have obtained a bachelor's degree or higher.
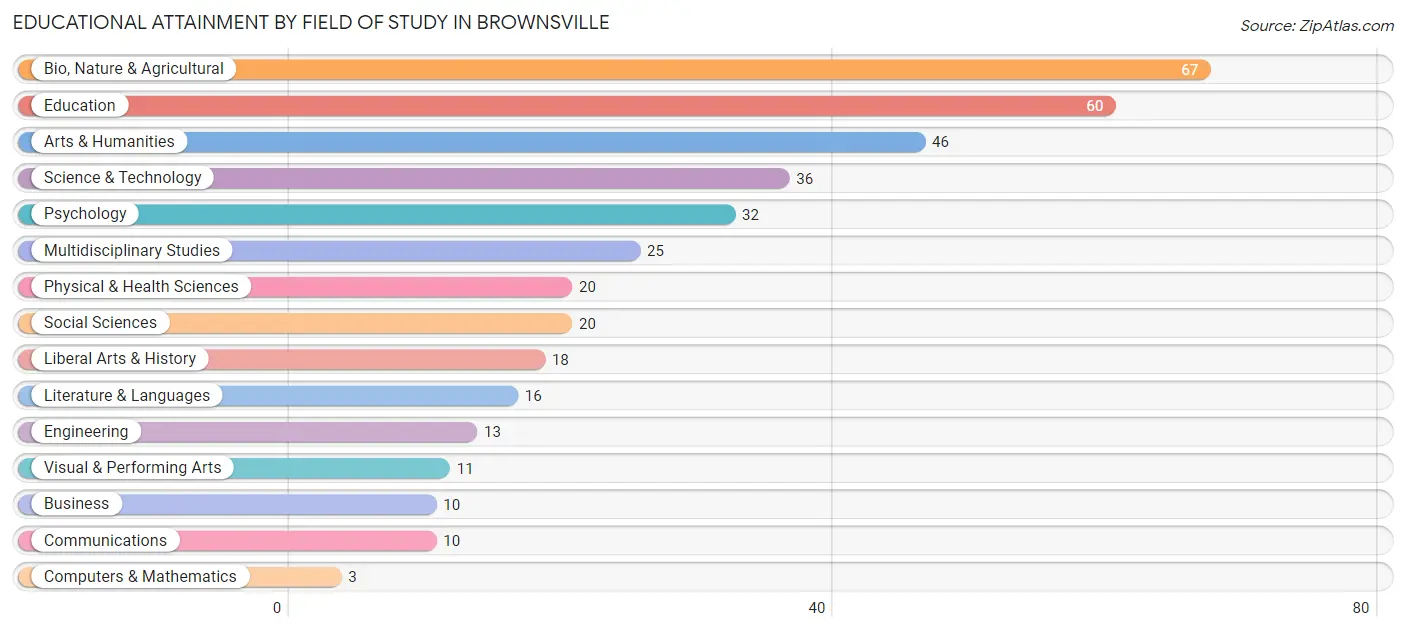
| Field of Study | # Graduates | % Graduates |
| Computers & Mathematics | 3 | 0.8% |
| Bio, Nature & Agricultural | 67 | 17.3% |
| Physical & Health Sciences | 20 | 5.2% |
| Psychology | 32 | 8.3% |
| Social Sciences | 20 | 5.2% |
| Engineering | 13 | 3.4% |
| Multidisciplinary Studies | 25 | 6.5% |
| Science & Technology | 36 | 9.3% |
| Business | 10 | 2.6% |
| Education | 60 | 15.5% |
| Literature & Languages | 16 | 4.1% |
| Liberal Arts & History | 18 | 4.6% |
| Visual & Performing Arts | 11 | 2.8% |
| Communications | 10 | 2.6% |
| Arts & Humanities | 46 | 11.9% |
| Total | 387 | 100.0% |
Transportation & Commute in Brownsville
Vehicle Availability by Sex in Brownsville
The most prevalent vehicle ownership categories in Brownsville are males with 2 vehicles (228, accounting for 49.1%) and females with 2 vehicles (191, making up 54.4%).
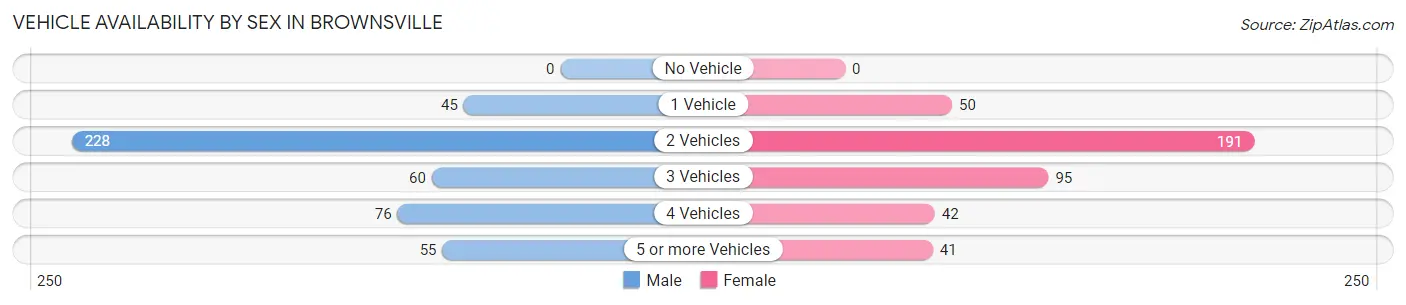
| Vehicles Available | Male | Female |
| No Vehicle | 0 (0.0%) | 0 (0.0%) |
| 1 Vehicle | 45 (9.7%) | 50 (11.9%) |
| 2 Vehicles | 228 (49.1%) | 191 (45.6%) |
| 3 Vehicles | 60 (12.9%) | 95 (22.7%) |
| 4 Vehicles | 76 (16.4%) | 42 (10.0%) |
| 5 or more Vehicles | 55 (11.8%) | 41 (9.8%) |
| Total | 464 (100.0%) | 419 (100.0%) |
Commute Time in Brownsville
The most frequently occuring commute durations in Brownsville are 30 to 34 minutes (238 commuters, 28.6%), 25 to 29 minutes (79 commuters, 9.5%), and 35 to 39 minutes (75 commuters, 9.0%).
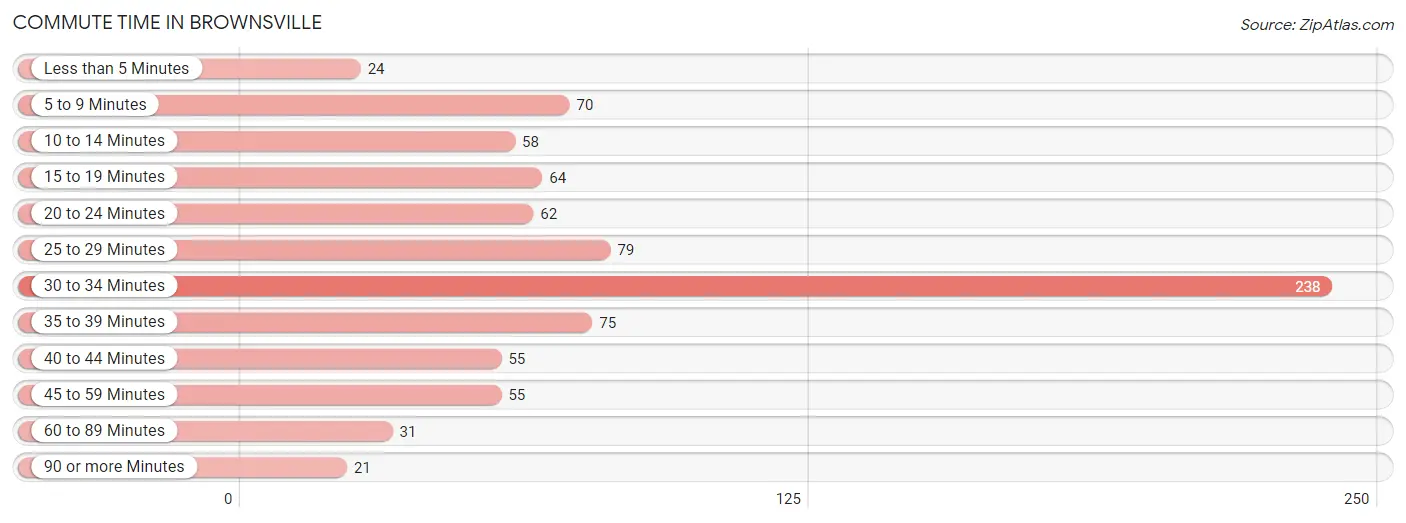
| Commute Time | # Commuters | % Commuters |
| Less than 5 Minutes | 24 | 2.9% |
| 5 to 9 Minutes | 70 | 8.4% |
| 10 to 14 Minutes | 58 | 7.0% |
| 15 to 19 Minutes | 64 | 7.7% |
| 20 to 24 Minutes | 62 | 7.4% |
| 25 to 29 Minutes | 79 | 9.5% |
| 30 to 34 Minutes | 238 | 28.6% |
| 35 to 39 Minutes | 75 | 9.0% |
| 40 to 44 Minutes | 55 | 6.6% |
| 45 to 59 Minutes | 55 | 6.6% |
| 60 to 89 Minutes | 31 | 3.7% |
| 90 or more Minutes | 21 | 2.5% |
Commute Time by Sex in Brownsville
The most common commute times in Brownsville are 30 to 34 minutes (105 commuters, 24.4%) for males and 30 to 34 minutes (133 commuters, 33.1%) for females.
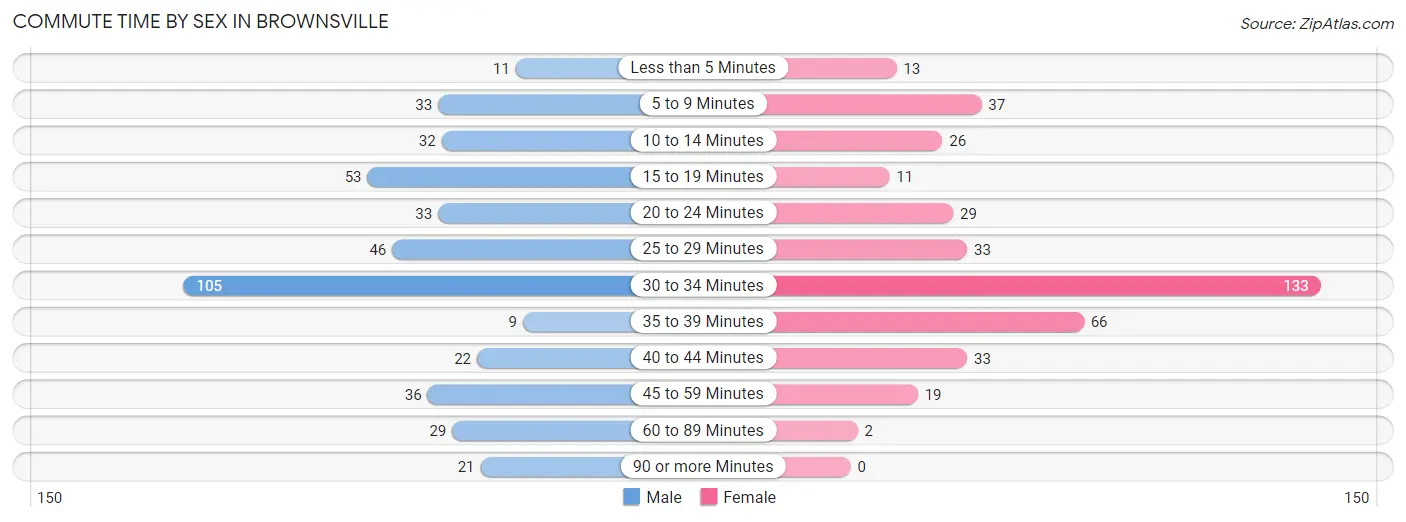
| Commute Time | Male | Female |
| Less than 5 Minutes | 11 (2.6%) | 13 (3.2%) |
| 5 to 9 Minutes | 33 (7.7%) | 37 (9.2%) |
| 10 to 14 Minutes | 32 (7.4%) | 26 (6.5%) |
| 15 to 19 Minutes | 53 (12.3%) | 11 (2.7%) |
| 20 to 24 Minutes | 33 (7.7%) | 29 (7.2%) |
| 25 to 29 Minutes | 46 (10.7%) | 33 (8.2%) |
| 30 to 34 Minutes | 105 (24.4%) | 133 (33.1%) |
| 35 to 39 Minutes | 9 (2.1%) | 66 (16.4%) |
| 40 to 44 Minutes | 22 (5.1%) | 33 (8.2%) |
| 45 to 59 Minutes | 36 (8.4%) | 19 (4.7%) |
| 60 to 89 Minutes | 29 (6.7%) | 2 (0.5%) |
| 90 or more Minutes | 21 (4.9%) | 0 (0.0%) |
Time of Departure to Work by Sex in Brownsville
The most frequent times of departure to work in Brownsville are 12:00 AM to 4:59 AM (79, 18.4%) for males and 7:00 AM to 7:29 AM (95, 23.6%) for females.
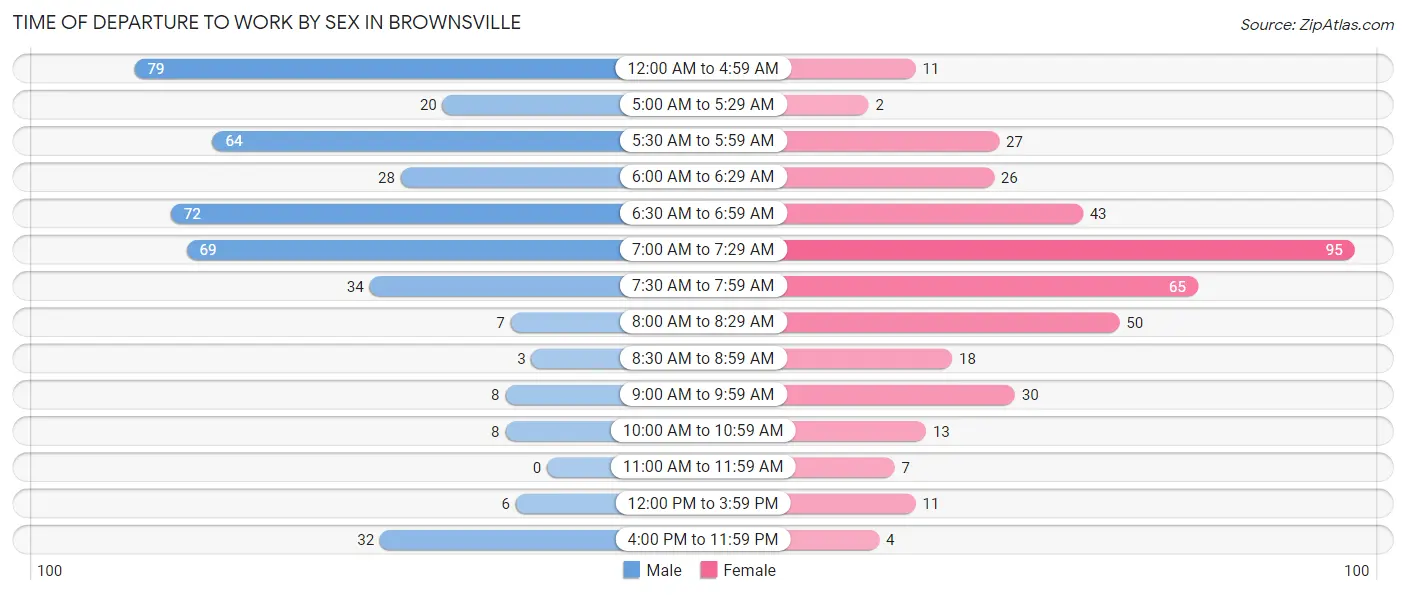
| Time of Departure | Male | Female |
| 12:00 AM to 4:59 AM | 79 (18.4%) | 11 (2.7%) |
| 5:00 AM to 5:29 AM | 20 (4.6%) | 2 (0.5%) |
| 5:30 AM to 5:59 AM | 64 (14.9%) | 27 (6.7%) |
| 6:00 AM to 6:29 AM | 28 (6.5%) | 26 (6.5%) |
| 6:30 AM to 6:59 AM | 72 (16.7%) | 43 (10.7%) |
| 7:00 AM to 7:29 AM | 69 (16.1%) | 95 (23.6%) |
| 7:30 AM to 7:59 AM | 34 (7.9%) | 65 (16.2%) |
| 8:00 AM to 8:29 AM | 7 (1.6%) | 50 (12.4%) |
| 8:30 AM to 8:59 AM | 3 (0.7%) | 18 (4.5%) |
| 9:00 AM to 9:59 AM | 8 (1.9%) | 30 (7.5%) |
| 10:00 AM to 10:59 AM | 8 (1.9%) | 13 (3.2%) |
| 11:00 AM to 11:59 AM | 0 (0.0%) | 7 (1.7%) |
| 12:00 PM to 3:59 PM | 6 (1.4%) | 11 (2.7%) |
| 4:00 PM to 11:59 PM | 32 (7.4%) | 4 (1.0%) |
| Total | 430 (100.0%) | 402 (100.0%) |
Housing Occupancy in Brownsville
Occupancy by Ownership in Brownsville
Of the total 774 dwellings in Brownsville, owner-occupied units account for 623 (80.5%), while renter-occupied units make up 151 (19.5%).
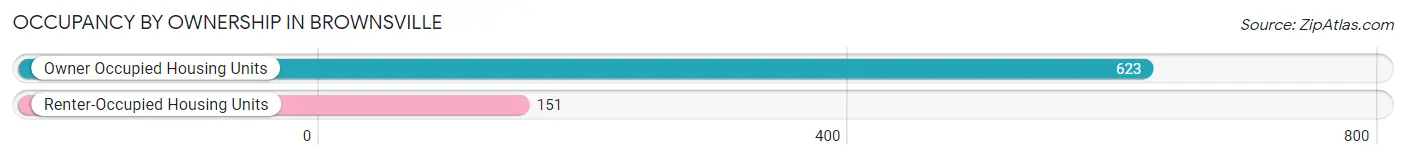
| Occupancy | # Housing Units | % Housing Units |
| Owner Occupied Housing Units | 623 | 80.5% |
| Renter-Occupied Housing Units | 151 | 19.5% |
| Total Occupied Housing Units | 774 | 100.0% |
Occupancy by Household Size in Brownsville
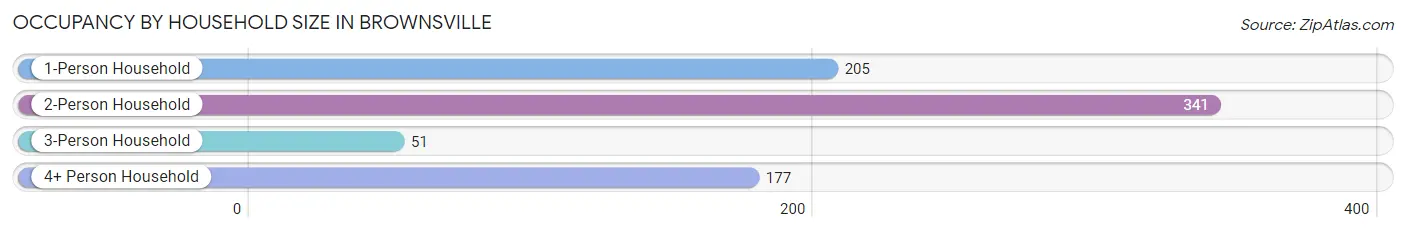
| Household Size | # Housing Units | % Housing Units |
| 1-Person Household | 205 | 26.5% |
| 2-Person Household | 341 | 44.1% |
| 3-Person Household | 51 | 6.6% |
| 4+ Person Household | 177 | 22.9% |
| Total Housing Units | 774 | 100.0% |
Occupancy by Ownership by Household Size in Brownsville
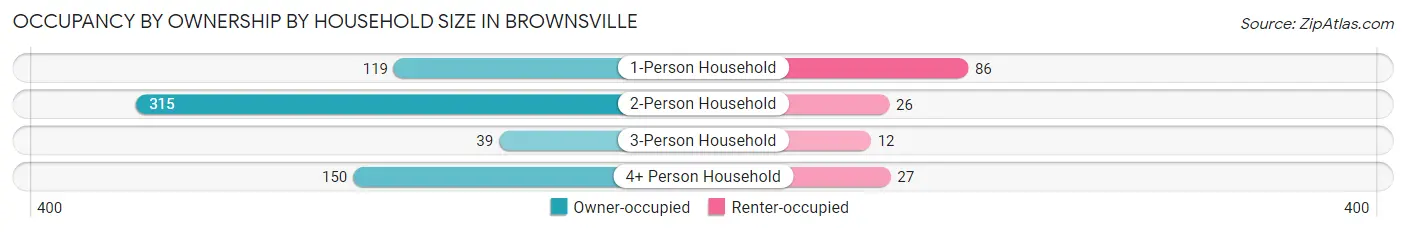
| Household Size | Owner-occupied | Renter-occupied |
| 1-Person Household | 119 (58.1%) | 86 (41.9%) |
| 2-Person Household | 315 (92.4%) | 26 (7.6%) |
| 3-Person Household | 39 (76.5%) | 12 (23.5%) |
| 4+ Person Household | 150 (84.8%) | 27 (15.2%) |
| Total Housing Units | 623 (80.5%) | 151 (19.5%) |
Occupancy by Educational Attainment in Brownsville
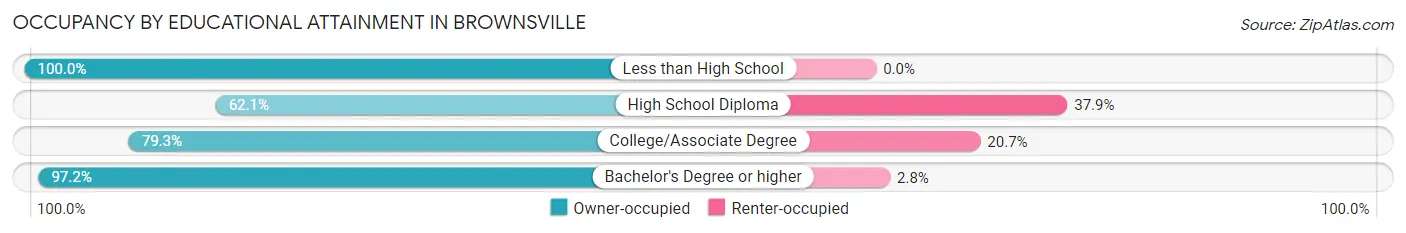
| Household Size | Owner-occupied | Renter-occupied |
| Less than High School | 38 (100.0%) | 0 (0.0%) |
| High School Diploma | 136 (62.1%) | 83 (37.9%) |
| College/Associate Degree | 238 (79.3%) | 62 (20.7%) |
| Bachelor's Degree or higher | 211 (97.2%) | 6 (2.8%) |
Occupancy by Age of Householder in Brownsville
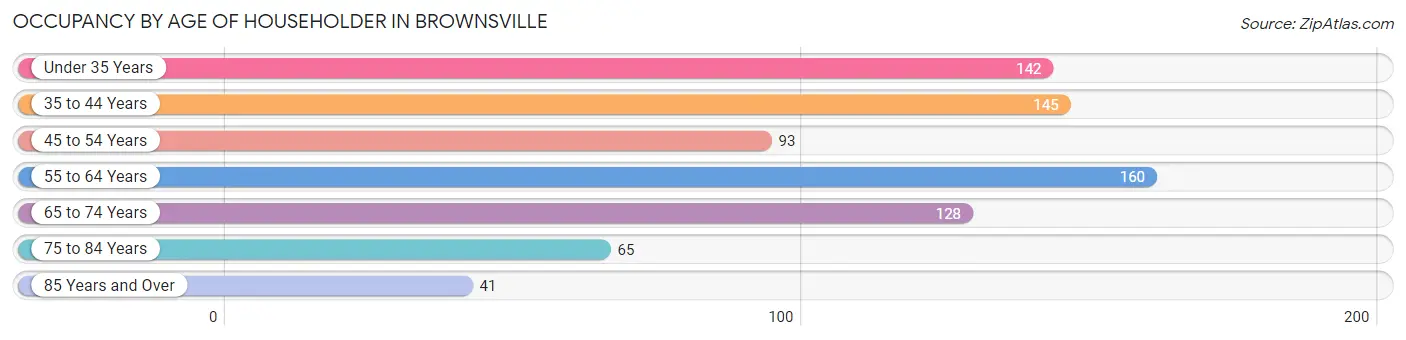
| Age Bracket | # Households | % Households |
| Under 35 Years | 142 | 18.3% |
| 35 to 44 Years | 145 | 18.7% |
| 45 to 54 Years | 93 | 12.0% |
| 55 to 64 Years | 160 | 20.7% |
| 65 to 74 Years | 128 | 16.5% |
| 75 to 84 Years | 65 | 8.4% |
| 85 Years and Over | 41 | 5.3% |
| Total | 774 | 100.0% |
Housing Finances in Brownsville
Median Income by Occupancy in Brownsville
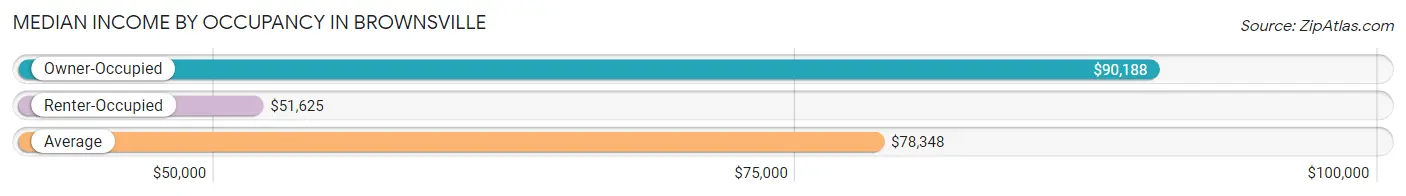
| Occupancy Type | # Households | Median Income |
| Owner-Occupied | 623 (80.5%) | $90,188 |
| Renter-Occupied | 151 (19.5%) | $51,625 |
| Average | 774 (100.0%) | $78,348 |
Occupancy by Householder Income Bracket in Brownsville
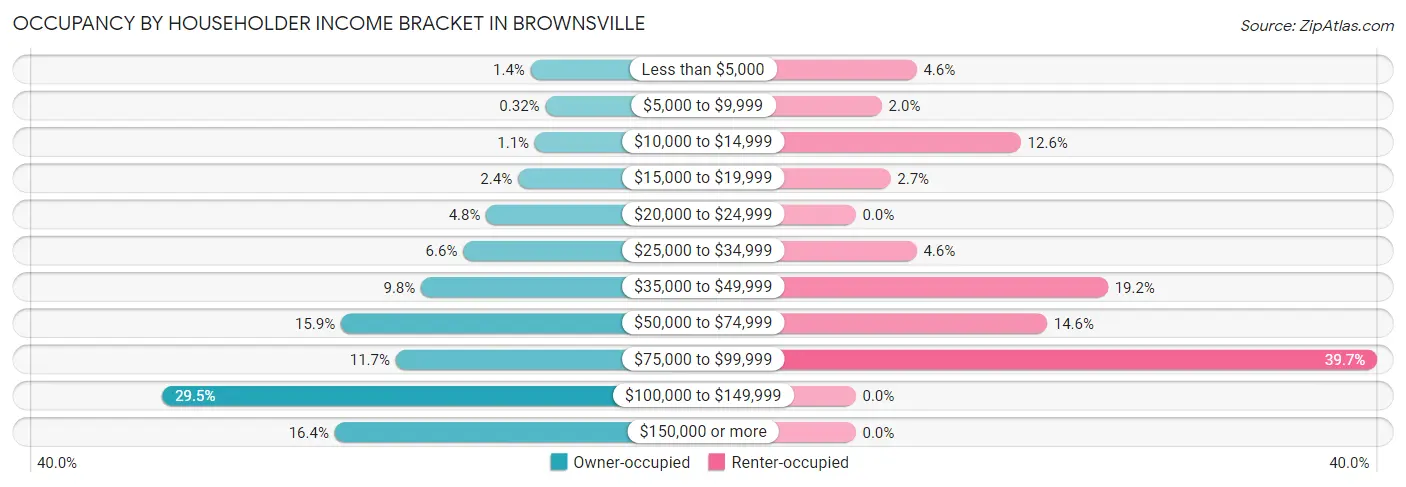
| Income Bracket | Owner-occupied | Renter-occupied |
| Less than $5,000 | 9 (1.4%) | 7 (4.6%) |
| $5,000 to $9,999 | 2 (0.3%) | 3 (2.0%) |
| $10,000 to $14,999 | 7 (1.1%) | 19 (12.6%) |
| $15,000 to $19,999 | 15 (2.4%) | 4 (2.6%) |
| $20,000 to $24,999 | 30 (4.8%) | 0 (0.0%) |
| $25,000 to $34,999 | 41 (6.6%) | 7 (4.6%) |
| $35,000 to $49,999 | 61 (9.8%) | 29 (19.2%) |
| $50,000 to $74,999 | 99 (15.9%) | 22 (14.6%) |
| $75,000 to $99,999 | 73 (11.7%) | 60 (39.7%) |
| $100,000 to $149,999 | 184 (29.5%) | 0 (0.0%) |
| $150,000 or more | 102 (16.4%) | 0 (0.0%) |
| Total | 623 (100.0%) | 151 (100.0%) |
Monthly Housing Cost Tiers in Brownsville
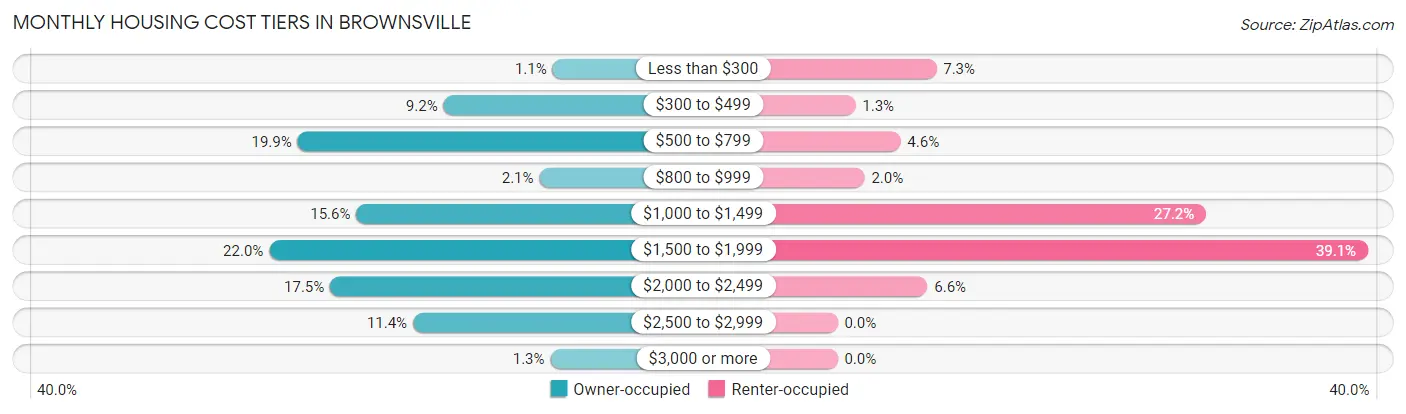
| Monthly Cost | Owner-occupied | Renter-occupied |
| Less than $300 | 7 (1.1%) | 11 (7.3%) |
| $300 to $499 | 57 (9.1%) | 2 (1.3%) |
| $500 to $799 | 124 (19.9%) | 7 (4.6%) |
| $800 to $999 | 13 (2.1%) | 3 (2.0%) |
| $1,000 to $1,499 | 97 (15.6%) | 41 (27.2%) |
| $1,500 to $1,999 | 137 (22.0%) | 59 (39.1%) |
| $2,000 to $2,499 | 109 (17.5%) | 10 (6.6%) |
| $2,500 to $2,999 | 71 (11.4%) | 0 (0.0%) |
| $3,000 or more | 8 (1.3%) | 0 (0.0%) |
| Total | 623 (100.0%) | 151 (100.0%) |
Physical Housing Characteristics in Brownsville
Housing Structures in Brownsville
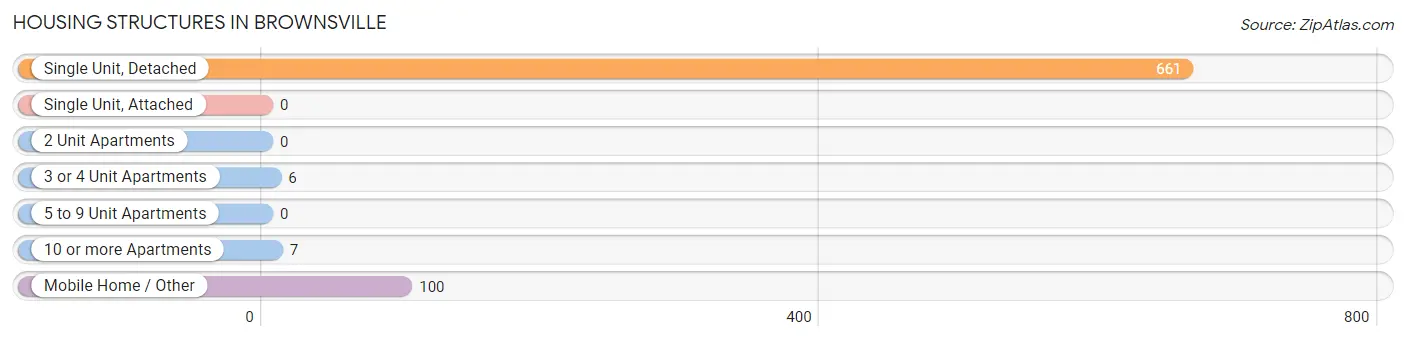
| Structure Type | # Housing Units | % Housing Units |
| Single Unit, Detached | 661 | 85.4% |
| Single Unit, Attached | 0 | 0.0% |
| 2 Unit Apartments | 0 | 0.0% |
| 3 or 4 Unit Apartments | 6 | 0.8% |
| 5 to 9 Unit Apartments | 0 | 0.0% |
| 10 or more Apartments | 7 | 0.9% |
| Mobile Home / Other | 100 | 12.9% |
| Total | 774 | 100.0% |
Housing Structures by Occupancy in Brownsville
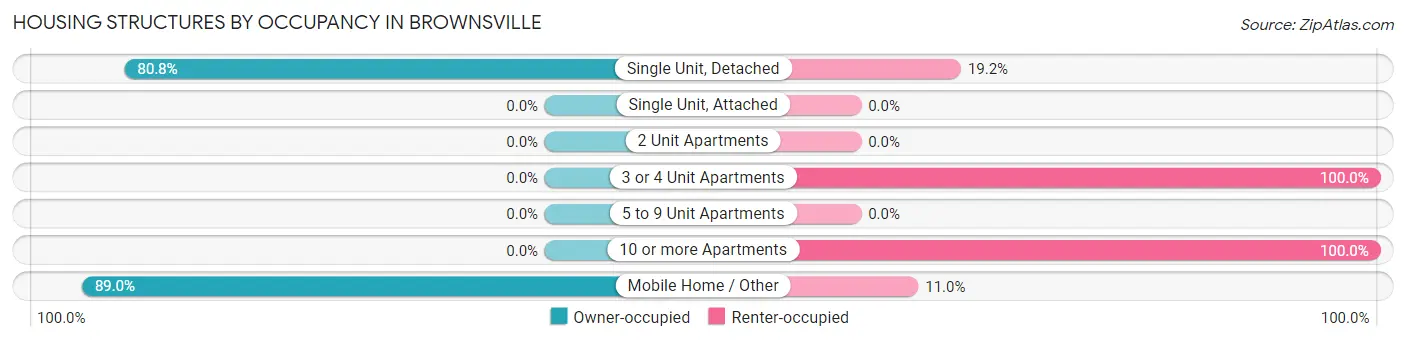
| Structure Type | Owner-occupied | Renter-occupied |
| Single Unit, Detached | 534 (80.8%) | 127 (19.2%) |
| Single Unit, Attached | 0 (0.0%) | 0 (0.0%) |
| 2 Unit Apartments | 0 (0.0%) | 0 (0.0%) |
| 3 or 4 Unit Apartments | 0 (0.0%) | 6 (100.0%) |
| 5 to 9 Unit Apartments | 0 (0.0%) | 0 (0.0%) |
| 10 or more Apartments | 0 (0.0%) | 7 (100.0%) |
| Mobile Home / Other | 89 (89.0%) | 11 (11.0%) |
| Total | 623 (80.5%) | 151 (19.5%) |
Housing Structures by Number of Rooms in Brownsville
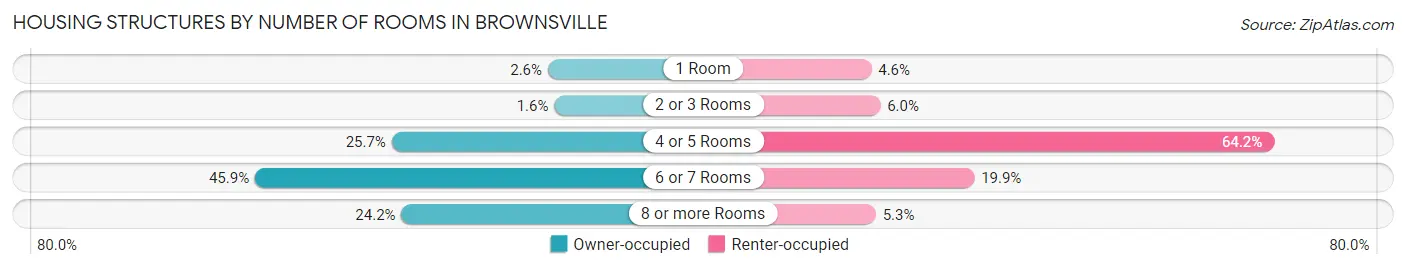
| Number of Rooms | Owner-occupied | Renter-occupied |
| 1 Room | 16 (2.6%) | 7 (4.6%) |
| 2 or 3 Rooms | 10 (1.6%) | 9 (6.0%) |
| 4 or 5 Rooms | 160 (25.7%) | 97 (64.2%) |
| 6 or 7 Rooms | 286 (45.9%) | 30 (19.9%) |
| 8 or more Rooms | 151 (24.2%) | 8 (5.3%) |
| Total | 623 (100.0%) | 151 (100.0%) |
Housing Structure by Heating Type in Brownsville
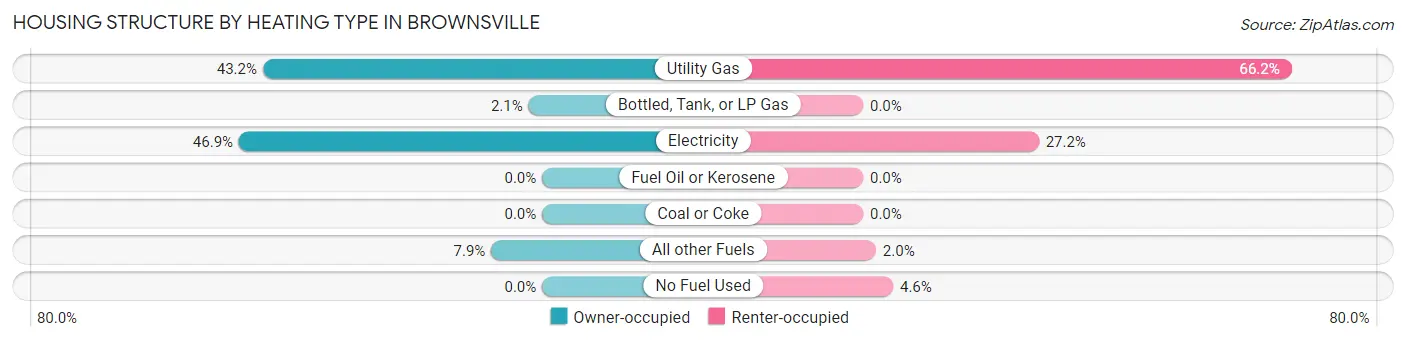
| Heating Type | Owner-occupied | Renter-occupied |
| Utility Gas | 269 (43.2%) | 100 (66.2%) |
| Bottled, Tank, or LP Gas | 13 (2.1%) | 0 (0.0%) |
| Electricity | 292 (46.9%) | 41 (27.2%) |
| Fuel Oil or Kerosene | 0 (0.0%) | 0 (0.0%) |
| Coal or Coke | 0 (0.0%) | 0 (0.0%) |
| All other Fuels | 49 (7.9%) | 3 (2.0%) |
| No Fuel Used | 0 (0.0%) | 7 (4.6%) |
| Total | 623 (100.0%) | 151 (100.0%) |
Household Vehicle Usage in Brownsville
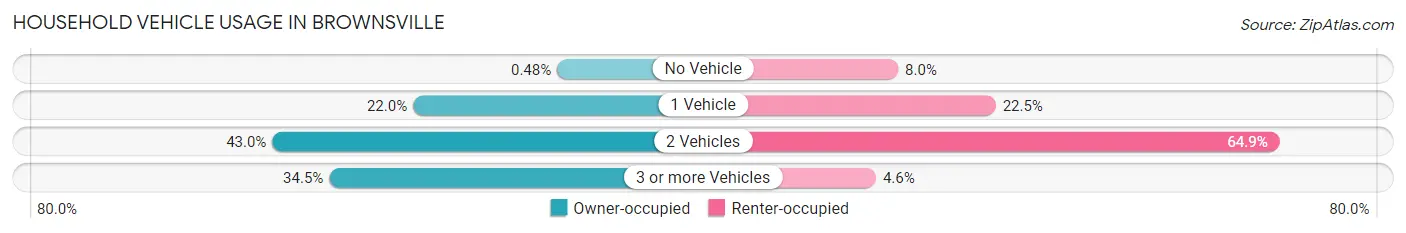
| Vehicles per Household | Owner-occupied | Renter-occupied |
| No Vehicle | 3 (0.5%) | 12 (8.0%) |
| 1 Vehicle | 137 (22.0%) | 34 (22.5%) |
| 2 Vehicles | 268 (43.0%) | 98 (64.9%) |
| 3 or more Vehicles | 215 (34.5%) | 7 (4.6%) |
| Total | 623 (100.0%) | 151 (100.0%) |
Real Estate & Mortgages in Brownsville
Real Estate and Mortgage Overview in Brownsville
| Characteristic | Without Mortgage | With Mortgage |
| Housing Units | 179 | 444 |
| Median Property Value | $249,400 | $321,200 |
| Median Household Income | $50,417 | $97 |
| Monthly Housing Costs | $595 | $8 |
| Real Estate Taxes | $2,660 | $18 |
Property Value by Mortgage Status in Brownsville
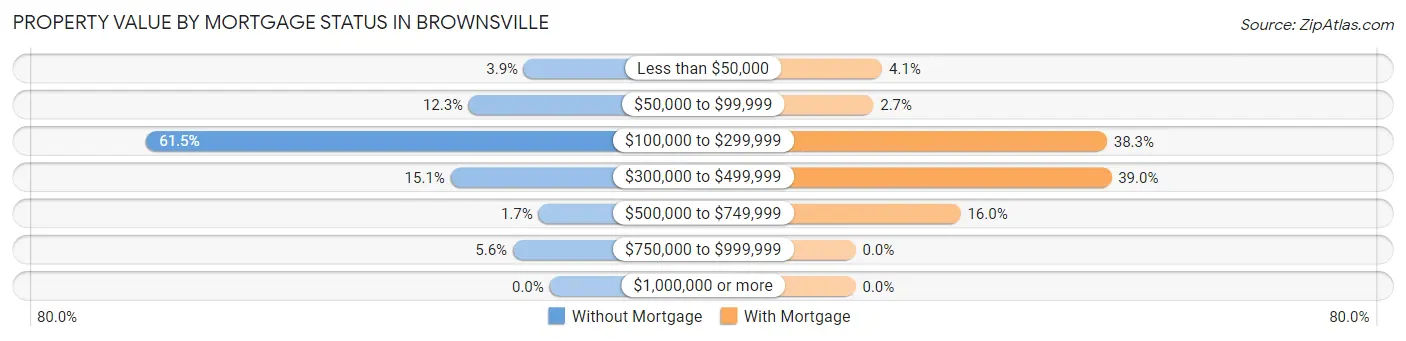
| Property Value | Without Mortgage | With Mortgage |
| Less than $50,000 | 7 (3.9%) | 18 (4.1%) |
| $50,000 to $99,999 | 22 (12.3%) | 12 (2.7%) |
| $100,000 to $299,999 | 110 (61.5%) | 170 (38.3%) |
| $300,000 to $499,999 | 27 (15.1%) | 173 (39.0%) |
| $500,000 to $749,999 | 3 (1.7%) | 71 (16.0%) |
| $750,000 to $999,999 | 10 (5.6%) | 0 (0.0%) |
| $1,000,000 or more | 0 (0.0%) | 0 (0.0%) |
| Total | 179 (100.0%) | 444 (100.0%) |
Household Income by Mortgage Status in Brownsville
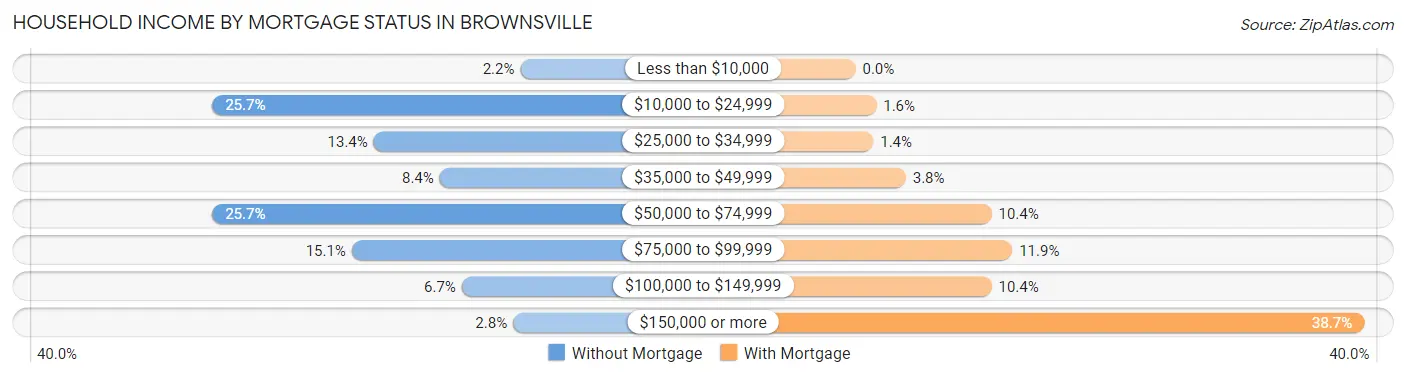
| Household Income | Without Mortgage | With Mortgage |
| Less than $10,000 | 4 (2.2%) | 0 (0.0%) |
| $10,000 to $24,999 | 46 (25.7%) | 7 (1.6%) |
| $25,000 to $34,999 | 24 (13.4%) | 6 (1.3%) |
| $35,000 to $49,999 | 15 (8.4%) | 17 (3.8%) |
| $50,000 to $74,999 | 46 (25.7%) | 46 (10.4%) |
| $75,000 to $99,999 | 27 (15.1%) | 53 (11.9%) |
| $100,000 to $149,999 | 12 (6.7%) | 46 (10.4%) |
| $150,000 or more | 5 (2.8%) | 172 (38.7%) |
| Total | 179 (100.0%) | 444 (100.0%) |
Property Value to Household Income Ratio in Brownsville
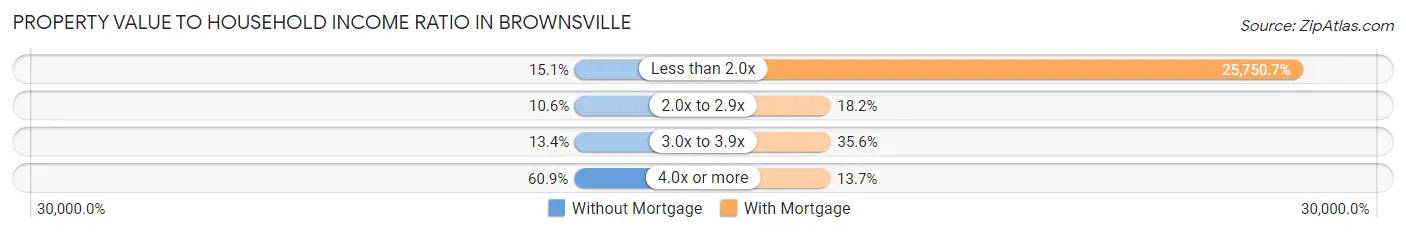
| Value-to-Income Ratio | Without Mortgage | With Mortgage |
| Less than 2.0x | 27 (15.1%) | 114,333 (25,750.7%) |
| 2.0x to 2.9x | 19 (10.6%) | 81 (18.2%) |
| 3.0x to 3.9x | 24 (13.4%) | 158 (35.6%) |
| 4.0x or more | 109 (60.9%) | 61 (13.7%) |
| Total | 179 (100.0%) | 444 (100.0%) |
Real Estate Taxes by Mortgage Status in Brownsville
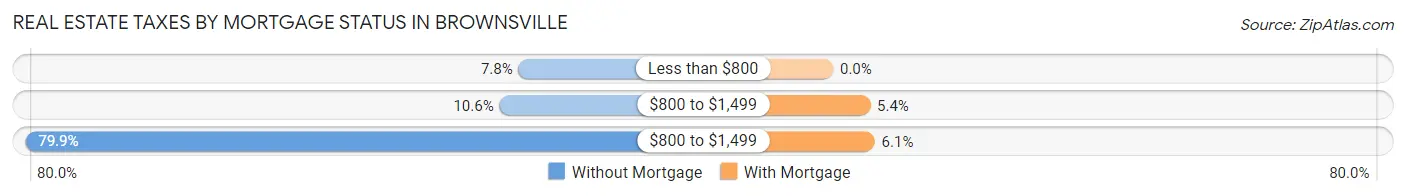
| Property Taxes | Without Mortgage | With Mortgage |
| Less than $800 | 14 (7.8%) | 0 (0.0%) |
| $800 to $1,499 | 19 (10.6%) | 24 (5.4%) |
| $800 to $1,499 | 143 (79.9%) | 27 (6.1%) |
| Total | 179 (100.0%) | 444 (100.0%) |
Health & Disability in Brownsville
Health Insurance Coverage by Age in Brownsville
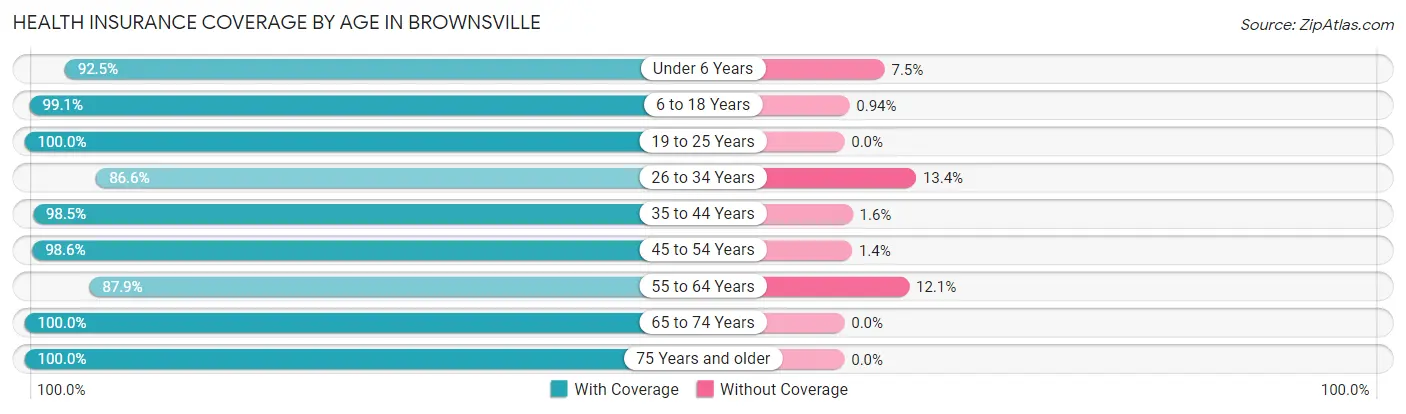
| Age Bracket | With Coverage | Without Coverage |
| Under 6 Years | 74 (92.5%) | 6 (7.5%) |
| 6 to 18 Years | 316 (99.1%) | 3 (0.9%) |
| 19 to 25 Years | 105 (100.0%) | 0 (0.0%) |
| 26 to 34 Years | 188 (86.6%) | 29 (13.4%) |
| 35 to 44 Years | 254 (98.5%) | 4 (1.5%) |
| 45 to 54 Years | 207 (98.6%) | 3 (1.4%) |
| 55 to 64 Years | 233 (87.9%) | 32 (12.1%) |
| 65 to 74 Years | 238 (100.0%) | 0 (0.0%) |
| 75 Years and older | 140 (100.0%) | 0 (0.0%) |
| Total | 1,755 (95.8%) | 77 (4.2%) |
Health Insurance Coverage by Citizenship Status in Brownsville
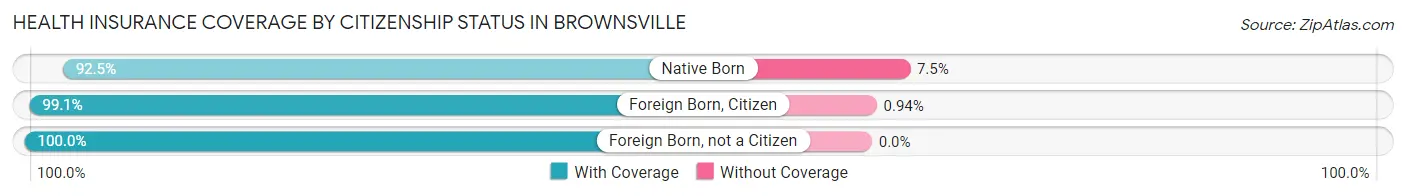
| Citizenship Status | With Coverage | Without Coverage |
| Native Born | 74 (92.5%) | 6 (7.5%) |
| Foreign Born, Citizen | 316 (99.1%) | 3 (0.9%) |
| Foreign Born, not a Citizen | 105 (100.0%) | 0 (0.0%) |
Health Insurance Coverage by Household Income in Brownsville
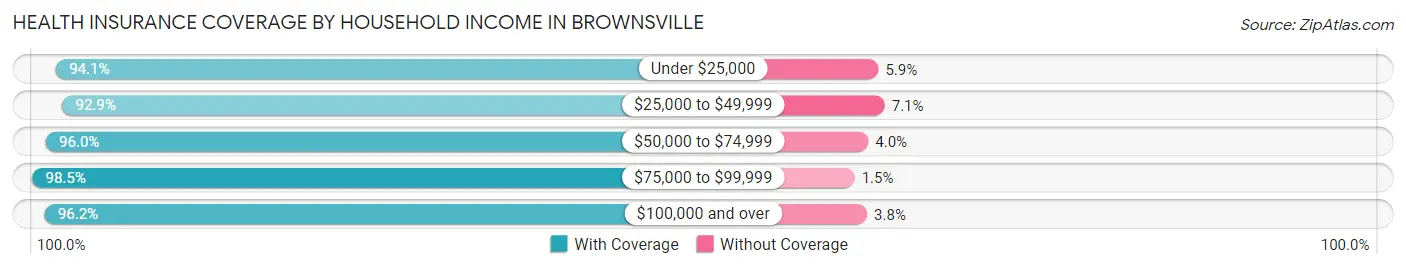
| Household Income | With Coverage | Without Coverage |
| Under $25,000 | 111 (94.1%) | 7 (5.9%) |
| $25,000 to $49,999 | 287 (92.9%) | 22 (7.1%) |
| $50,000 to $74,999 | 309 (96.0%) | 13 (4.0%) |
| $75,000 to $99,999 | 265 (98.5%) | 4 (1.5%) |
| $100,000 and over | 783 (96.2%) | 31 (3.8%) |
Public vs Private Health Insurance Coverage by Age in Brownsville
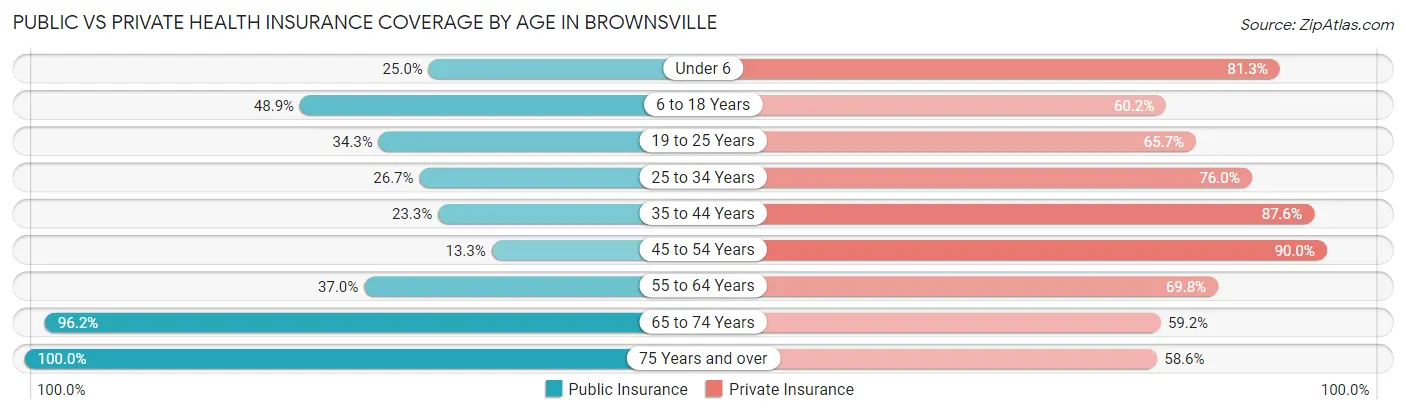
| Age Bracket | Public Insurance | Private Insurance |
| Under 6 | 20 (25.0%) | 65 (81.2%) |
| 6 to 18 Years | 156 (48.9%) | 192 (60.2%) |
| 19 to 25 Years | 36 (34.3%) | 69 (65.7%) |
| 25 to 34 Years | 58 (26.7%) | 165 (76.0%) |
| 35 to 44 Years | 60 (23.3%) | 226 (87.6%) |
| 45 to 54 Years | 28 (13.3%) | 189 (90.0%) |
| 55 to 64 Years | 98 (37.0%) | 185 (69.8%) |
| 65 to 74 Years | 229 (96.2%) | 141 (59.2%) |
| 75 Years and over | 140 (100.0%) | 82 (58.6%) |
| Total | 825 (45.0%) | 1,314 (71.7%) |
Disability Status by Sex by Age in Brownsville
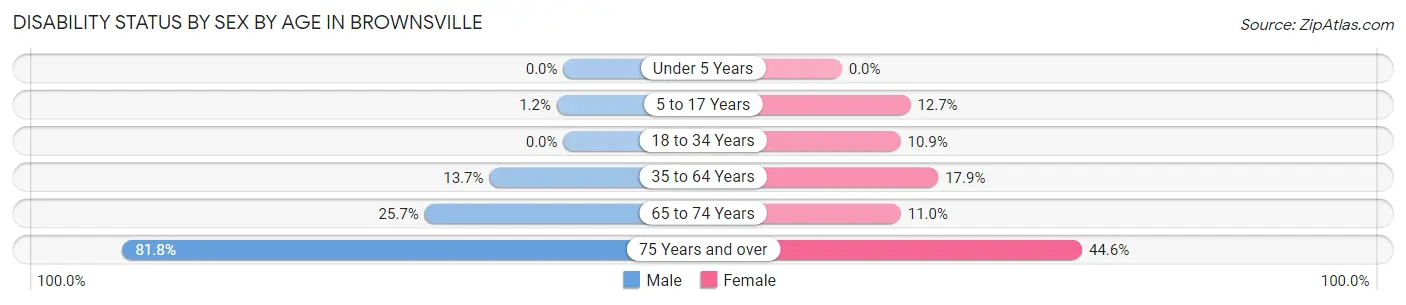
| Age Bracket | Male | Female |
| Under 5 Years | 0 (0.0%) | 0 (0.0%) |
| 5 to 17 Years | 2 (1.2%) | 20 (12.7%) |
| 18 to 34 Years | 0 (0.0%) | 17 (10.9%) |
| 35 to 64 Years | 47 (13.7%) | 70 (17.9%) |
| 65 to 74 Years | 26 (25.7%) | 15 (11.0%) |
| 75 Years and over | 54 (81.8%) | 33 (44.6%) |
Disability Class by Sex by Age in Brownsville
Disability Class: Hearing Difficulty
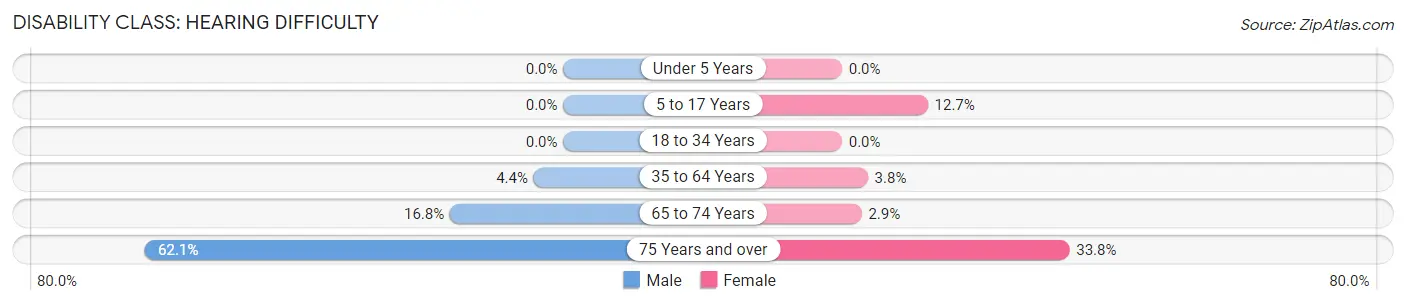
| Age Bracket | Male | Female |
| Under 5 Years | 0 (0.0%) | 0 (0.0%) |
| 5 to 17 Years | 0 (0.0%) | 20 (12.7%) |
| 18 to 34 Years | 0 (0.0%) | 0 (0.0%) |
| 35 to 64 Years | 15 (4.4%) | 15 (3.8%) |
| 65 to 74 Years | 17 (16.8%) | 4 (2.9%) |
| 75 Years and over | 41 (62.1%) | 25 (33.8%) |
Disability Class: Vision Difficulty
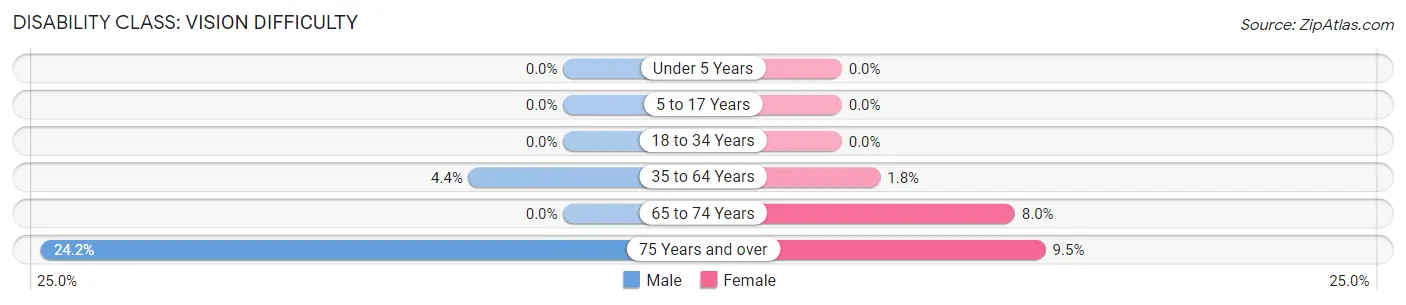
| Age Bracket | Male | Female |
| Under 5 Years | 0 (0.0%) | 0 (0.0%) |
| 5 to 17 Years | 0 (0.0%) | 0 (0.0%) |
| 18 to 34 Years | 0 (0.0%) | 0 (0.0%) |
| 35 to 64 Years | 15 (4.4%) | 7 (1.8%) |
| 65 to 74 Years | 0 (0.0%) | 11 (8.0%) |
| 75 Years and over | 16 (24.2%) | 7 (9.5%) |
Disability Class: Cognitive Difficulty
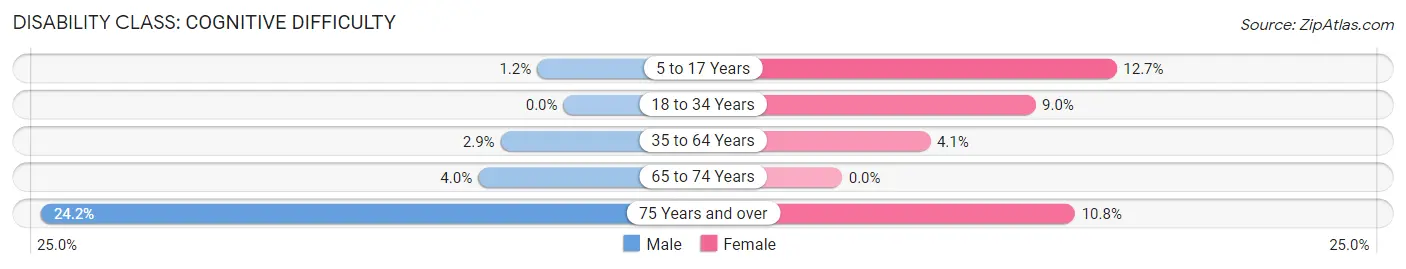
| Age Bracket | Male | Female |
| 5 to 17 Years | 2 (1.2%) | 20 (12.7%) |
| 18 to 34 Years | 0 (0.0%) | 14 (9.0%) |
| 35 to 64 Years | 10 (2.9%) | 16 (4.1%) |
| 65 to 74 Years | 4 (4.0%) | 0 (0.0%) |
| 75 Years and over | 16 (24.2%) | 8 (10.8%) |
Disability Class: Ambulatory Difficulty
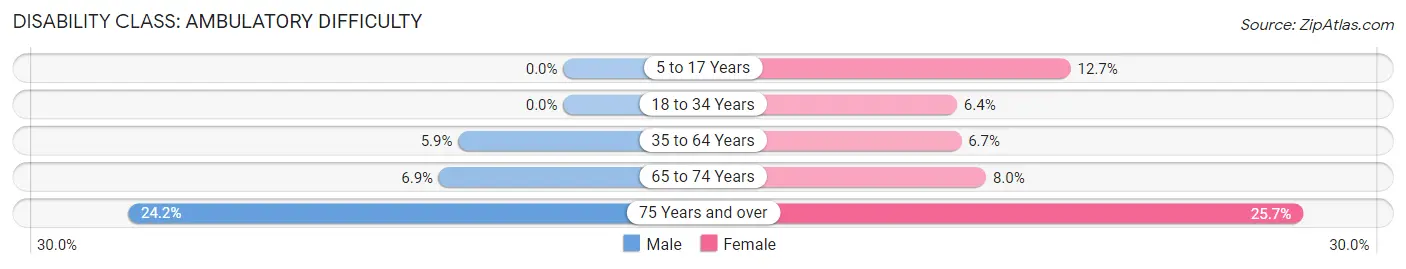
| Age Bracket | Male | Female |
| 5 to 17 Years | 0 (0.0%) | 20 (12.7%) |
| 18 to 34 Years | 0 (0.0%) | 10 (6.4%) |
| 35 to 64 Years | 20 (5.9%) | 26 (6.7%) |
| 65 to 74 Years | 7 (6.9%) | 11 (8.0%) |
| 75 Years and over | 16 (24.2%) | 19 (25.7%) |
Disability Class: Self-Care Difficulty
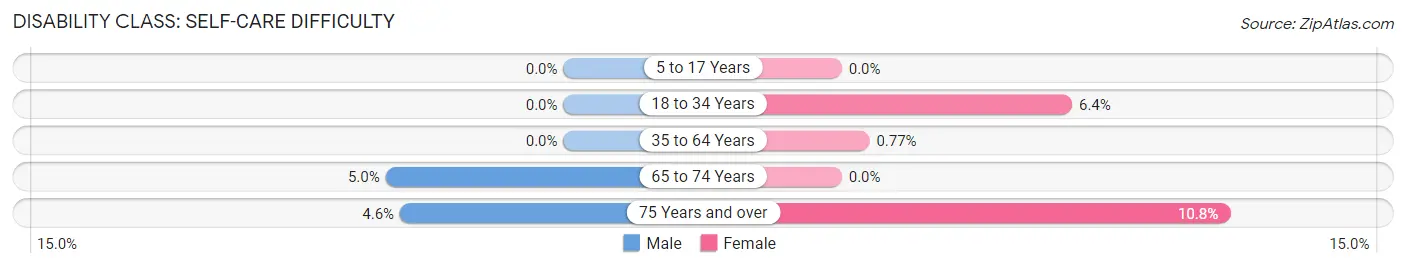
| Age Bracket | Male | Female |
| 5 to 17 Years | 0 (0.0%) | 0 (0.0%) |
| 18 to 34 Years | 0 (0.0%) | 10 (6.4%) |
| 35 to 64 Years | 0 (0.0%) | 3 (0.8%) |
| 65 to 74 Years | 5 (5.0%) | 0 (0.0%) |
| 75 Years and over | 3 (4.5%) | 8 (10.8%) |
Technology Access in Brownsville
Computing Device Access in Brownsville
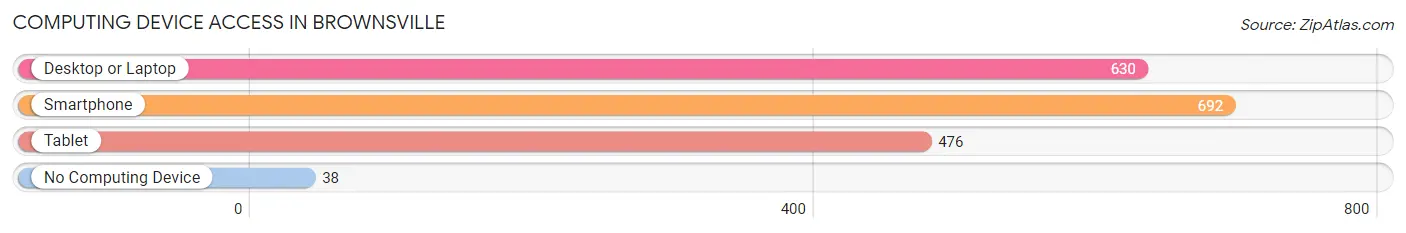
| Device Type | # Households | % Households |
| Desktop or Laptop | 630 | 81.4% |
| Smartphone | 692 | 89.4% |
| Tablet | 476 | 61.5% |
| No Computing Device | 38 | 4.9% |
| Total | 774 | 100.0% |
Internet Access in Brownsville
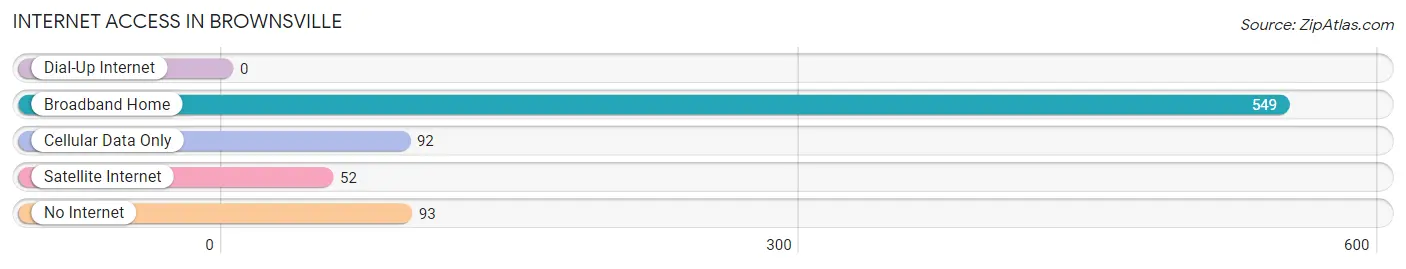
| Internet Type | # Households | % Households |
| Dial-Up Internet | 0 | 0.0% |
| Broadband Home | 549 | 70.9% |
| Cellular Data Only | 92 | 11.9% |
| Satellite Internet | 52 | 6.7% |
| No Internet | 93 | 12.0% |
| Total | 774 | 100.0% |
Brownsville Summary
Brownsville is a small city located in Linn County, Oregon, United States. It is situated on the banks of the Calapooia River, about 20 miles east of Albany. The population was 1,719 at the 2010 census.
History
The area that is now Brownsville was first settled in 1846 by William and Mary Brown, who established a homestead on the banks of the Calapooia River. The Brownsville post office was established in 1851, and the town was platted in 1853. The town was named after the Browns, and the name was officially changed to Brownsville in 1854.
In the late 19th century, Brownsville was a thriving agricultural and lumber town. The town was home to several sawmills, a grist mill, a woolen mill, and a cannery. The town also had a hotel, a bank, a newspaper, and several churches.
In the early 20th century, Brownsville was a popular tourist destination. The town was home to several resorts, including the Brownsville Hotel, which was built in 1906. The hotel was a popular destination for visitors from Portland and other nearby cities.
Geography
Brownsville is located at the confluence of the Calapooia River and the Willamette River. The city is situated in the foothills of the Cascade Mountains, about 20 miles east of Albany. The city has a total area of 1.3 square miles, all of which is land.
Climate
Brownsville has a humid continental climate, with warm summers and cool winters. The average annual temperature is 52°F, and the average annual precipitation is 37 inches.
Demographics
As of the 2010 census, there were 1,719 people, 690 households, and 463 families residing in the city. The population density was 1,323.8 people per square mile. The racial makeup of the city was 92.2% White, 0.5% African American, 0.7% Native American, 0.7% Asian, 0.1% Pacific Islander, 3.2% from other races, and 2.6% from two or more races. Hispanic or Latino of any race were 6.2% of the population.
Economy
The economy of Brownsville is largely based on agriculture and timber. The city is home to several farms, and the surrounding area is home to several timber companies. The city is also home to several small businesses, including restaurants, retail stores, and service providers. The city is also home to a branch of the Linn-Benton Community College.
Common Questions
What is Per Capita Income in Brownsville?
Per Capita income in Brownsville is $37,047.
What is the Median Family Income in Brownsville?
Median Family Income in Brownsville is $91,563.
What is the Median Household income in Brownsville?
Median Household Income in Brownsville is $78,348.
What is Income or Wage Gap in Brownsville?
Income or Wage Gap in Brownsville is 47.4%.
Women in Brownsville earn 52.6 cents for every dollar earned by a man.
What is Inequality or Gini Index in Brownsville?
Inequality or Gini Index in Brownsville is 0.36.
What is the Total Population of Brownsville?
Total Population of Brownsville is 1,832.
What is the Total Male Population of Brownsville?
Total Male Population of Brownsville is 883.
What is the Total Female Population of Brownsville?
Total Female Population of Brownsville is 949.
What is the Ratio of Males per 100 Females in Brownsville?
There are 93.05 Males per 100 Females in Brownsville.
What is the Ratio of Females per 100 Males in Brownsville?
There are 107.47 Females per 100 Males in Brownsville.
What is the Median Population Age in Brownsville?
Median Population Age in Brownsville is 44.0 Years.
What is the Average Family Size in Brownsville
Average Family Size in Brownsville is 2.9 People.
What is the Average Household Size in Brownsville
Average Household Size in Brownsville is 2.4 People.
How Large is the Labor Force in Brownsville?
There are 904 People in the Labor Forcein in Brownsville.
What is the Percentage of People in the Labor Force in Brownsville?
61.9% of People are in the Labor Force in Brownsville.
What is the Unemployment Rate in Brownsville?
Unemployment Rate in Brownsville is 2.0%.