Zip Codes with the Highest Percentage of Population Employed in Architecture & Engineering in Las Cruces, NM
RELATED REPORTS & OPTIONS
Architecture & Engineering
Las Cruces
Compare Zip Codes
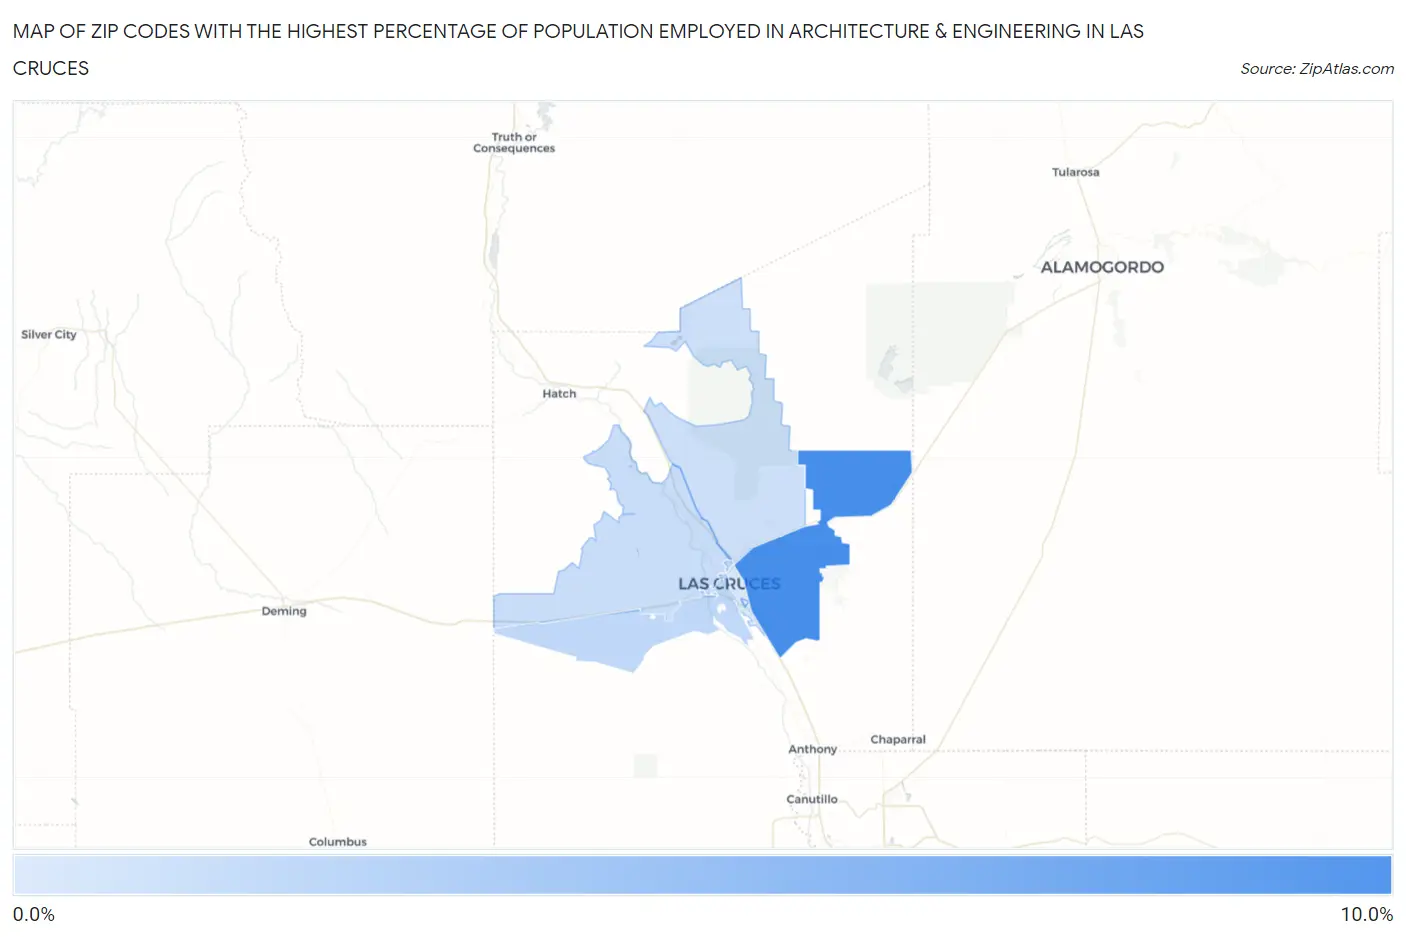
Map of Zip Codes with the Highest Percentage of Population Employed in Architecture & Engineering in Las Cruces
1.6%
8.7%
Zip Codes with the Highest Percentage of Population Employed in Architecture & Engineering in Las Cruces, NM
| Zip Code | % Employed | vs State | vs National | |
| 1. | 88011 | 8.7% | 2.5%(+6.19)#10 | 2.1%(+6.56)#460 |
| 2. | 88005 | 3.0% | 2.5%(+0.450)#43 | 2.1%(+0.817)#5,172 |
| 3. | 88007 | 2.6% | 2.5%(+0.065)#49 | 2.1%(+0.433)#6,656 |
| 4. | 88012 | 2.3% | 2.5%(-0.191)#58 | 2.1%(+0.176)#7,826 |
| 5. | 88001 | 1.6% | 2.5%(-0.884)#79 | 2.1%(-0.517)#11,965 |
1
Common Questions
What are the Top 5 Zip Codes with the Highest Percentage of Population Employed in Architecture & Engineering in Las Cruces, NM?
Top 5 Zip Codes with the Highest Percentage of Population Employed in Architecture & Engineering in Las Cruces, NM are:
What zip code has the Highest Percentage of Population Employed in Architecture & Engineering in Las Cruces, NM?
88011 has the Highest Percentage of Population Employed in Architecture & Engineering in Las Cruces, NM with 8.7%.
What is the Percentage of Population Employed in Architecture & Engineering in Las Cruces, NM?
Percentage of Population Employed in Architecture & Engineering in Las Cruces is 3.6%.
What is the Percentage of Population Employed in Architecture & Engineering in New Mexico?
Percentage of Population Employed in Architecture & Engineering in New Mexico is 2.5%.
What is the Percentage of Population Employed in Architecture & Engineering in the United States?
Percentage of Population Employed in Architecture & Engineering in the United States is 2.1%.