Zip Codes with the Highest Percentage of Population Employed in Architecture & Engineering in Gallup, NM
RELATED REPORTS & OPTIONS
Architecture & Engineering
Gallup
Compare Zip Codes
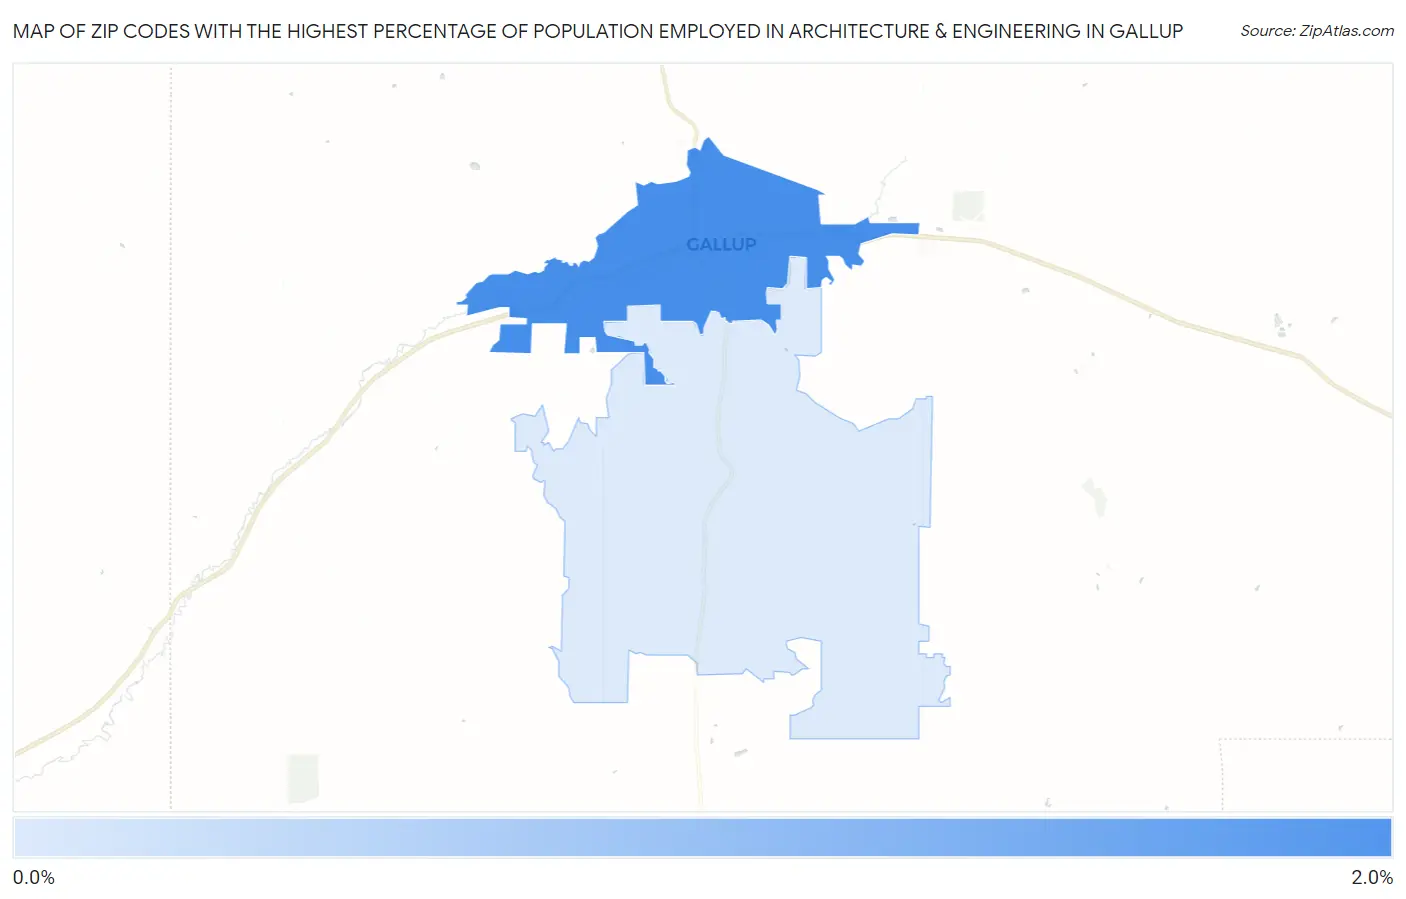
Map of Zip Codes with the Highest Percentage of Population Employed in Architecture & Engineering in Gallup
0.77%
1.8%
Zip Codes with the Highest Percentage of Population Employed in Architecture & Engineering in Gallup, NM
| Zip Code | % Employed | vs State | vs National | |
| 1. | 87301 | 1.8% | 2.5%(-0.714)#74 | 2.1%(-0.347)#10,808 |
| 2. | 87305 | 0.77% | 2.5%(-1.74)#106 | 2.1%(-1.38)#18,333 |
1
Common Questions
What are the Top Zip Codes with the Highest Percentage of Population Employed in Architecture & Engineering in Gallup, NM?
Top Zip Codes with the Highest Percentage of Population Employed in Architecture & Engineering in Gallup, NM are:
What zip code has the Highest Percentage of Population Employed in Architecture & Engineering in Gallup, NM?
87301 has the Highest Percentage of Population Employed in Architecture & Engineering in Gallup, NM with 1.8%.
What is the Percentage of Population Employed in Architecture & Engineering in Gallup, NM?
Percentage of Population Employed in Architecture & Engineering in Gallup is 1.3%.
What is the Percentage of Population Employed in Architecture & Engineering in New Mexico?
Percentage of Population Employed in Architecture & Engineering in New Mexico is 2.5%.
What is the Percentage of Population Employed in Architecture & Engineering in the United States?
Percentage of Population Employed in Architecture & Engineering in the United States is 2.1%.