Floyd, NM Map & Demographics
Floyd Map
Floyd Overview
$24,411
PER CAPITA INCOME
$35,938
AVG HOUSEHOLD INCOME
0.41
INEQUALITY / GINI INDEX
87
TOTAL POPULATION
56
MALE POPULATION
31
FEMALE POPULATION
180.65
MALES / 100 FEMALES
55.36
FEMALES / 100 MALES
22.9
MEDIAN AGE
3.4
AVG FAMILY SIZE
2.8
AVG HOUSEHOLD SIZE
42
LABOR FORCE [ PEOPLE ]
59.2%
PERCENT IN LABOR FORCE
Floyd Zip Codes
Income in Floyd
Income Overview in Floyd
| Characteristic | Number | Measure |
| Per Capita Income | 87 | $24,411 |
| Median Family Income | 23 | $0 |
| Mean Family Income | 23 | $56,391 |
| Median Household Income | 31 | $35,938 |
| Mean Household Income | 31 | $58,584 |
| Income Deficit | 23 | $0 |
| Wage / Income Gap (%) | 87 | 0.00% |
| Wage / Income Gap ($) | 87 | 100.00¢ per $1 |
| Gini / Inequality Index | 87 | 0.41 |
Earnings by Sex in Floyd
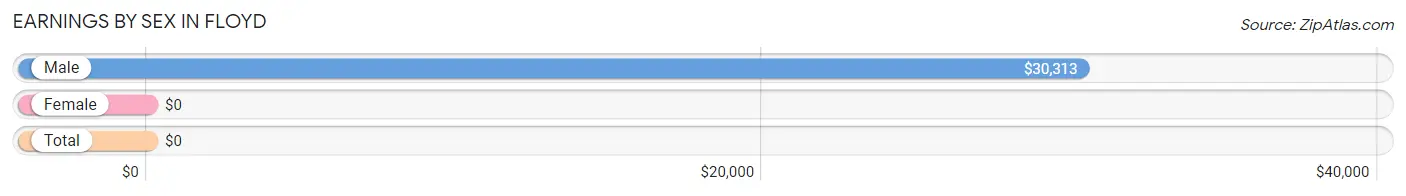
| Sex | Number | Average Earnings |
| Male | 32 (58.2%) | $30,313 |
| Female | 23 (41.8%) | $0 |
| Total | 55 (100.0%) | $0 |
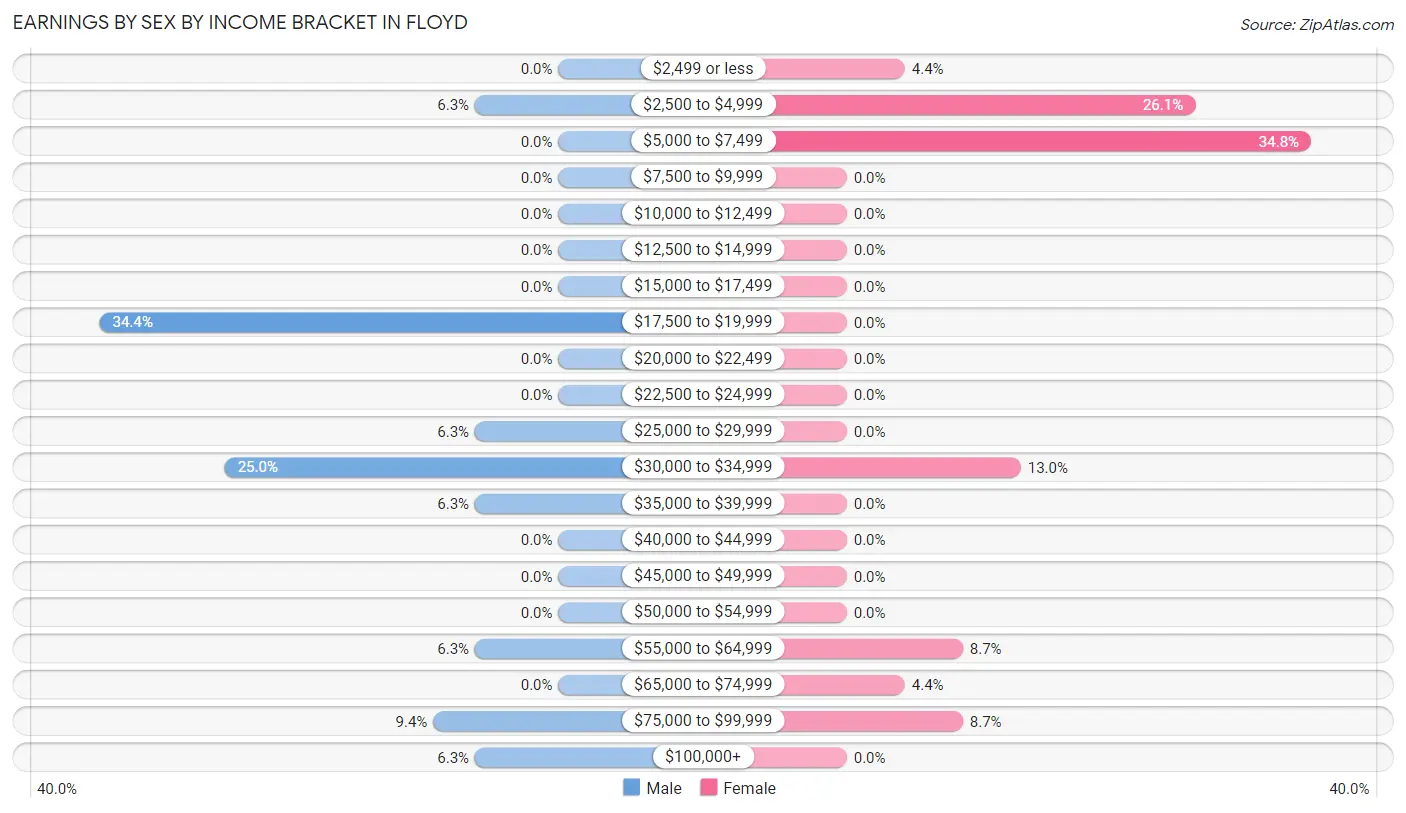
Earnings by Sex by Income Bracket in Floyd
The most common earnings brackets in Floyd are $17,500 to $19,999 for men (11 | 34.4%) and $5,000 to $7,499 for women (8 | 34.8%).
| Income | Male | Female |
| $2,499 or less | 0 (0.0%) | 1 (4.3%) |
| $2,500 to $4,999 | 2 (6.2%) | 6 (26.1%) |
| $5,000 to $7,499 | 0 (0.0%) | 8 (34.8%) |
| $7,500 to $9,999 | 0 (0.0%) | 0 (0.0%) |
| $10,000 to $12,499 | 0 (0.0%) | 0 (0.0%) |
| $12,500 to $14,999 | 0 (0.0%) | 0 (0.0%) |
| $15,000 to $17,499 | 0 (0.0%) | 0 (0.0%) |
| $17,500 to $19,999 | 11 (34.4%) | 0 (0.0%) |
| $20,000 to $22,499 | 0 (0.0%) | 0 (0.0%) |
| $22,500 to $24,999 | 0 (0.0%) | 0 (0.0%) |
| $25,000 to $29,999 | 2 (6.2%) | 0 (0.0%) |
| $30,000 to $34,999 | 8 (25.0%) | 3 (13.0%) |
| $35,000 to $39,999 | 2 (6.2%) | 0 (0.0%) |
| $40,000 to $44,999 | 0 (0.0%) | 0 (0.0%) |
| $45,000 to $49,999 | 0 (0.0%) | 0 (0.0%) |
| $50,000 to $54,999 | 0 (0.0%) | 0 (0.0%) |
| $55,000 to $64,999 | 2 (6.2%) | 2 (8.7%) |
| $65,000 to $74,999 | 0 (0.0%) | 1 (4.3%) |
| $75,000 to $99,999 | 3 (9.4%) | 2 (8.7%) |
| $100,000+ | 2 (6.2%) | 0 (0.0%) |
| Total | 32 (100.0%) | 23 (100.0%) |
Earnings by Sex by Educational Attainment in Floyd
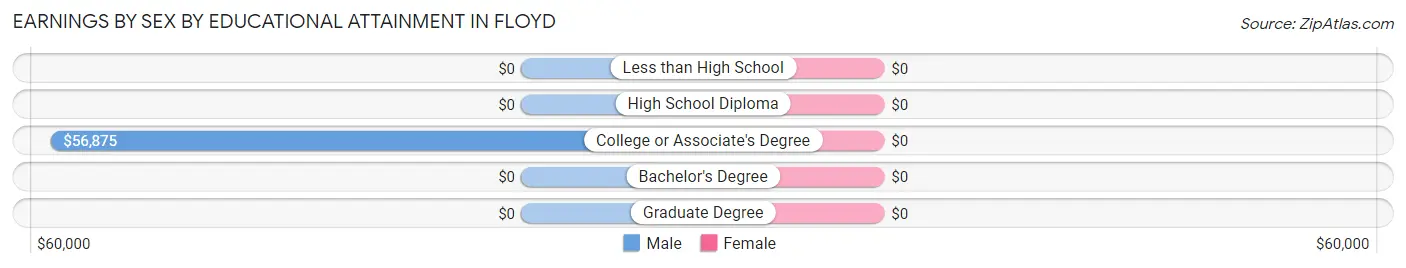
| Educational Attainment | Male Income | Female Income |
| Less than High School | - | - |
| High School Diploma | - | - |
| College or Associate's Degree | $56,875 | $0 |
| Bachelor's Degree | - | - |
| Graduate Degree | - | - |
| Total | - | - |
Family Income in Floyd
Family Income Brackets in Floyd
According to the Floyd family income data, there are 8 families falling into the $15,000 to $24,999 income range, which is the most common income bracket and makes up 34.8% of all families.
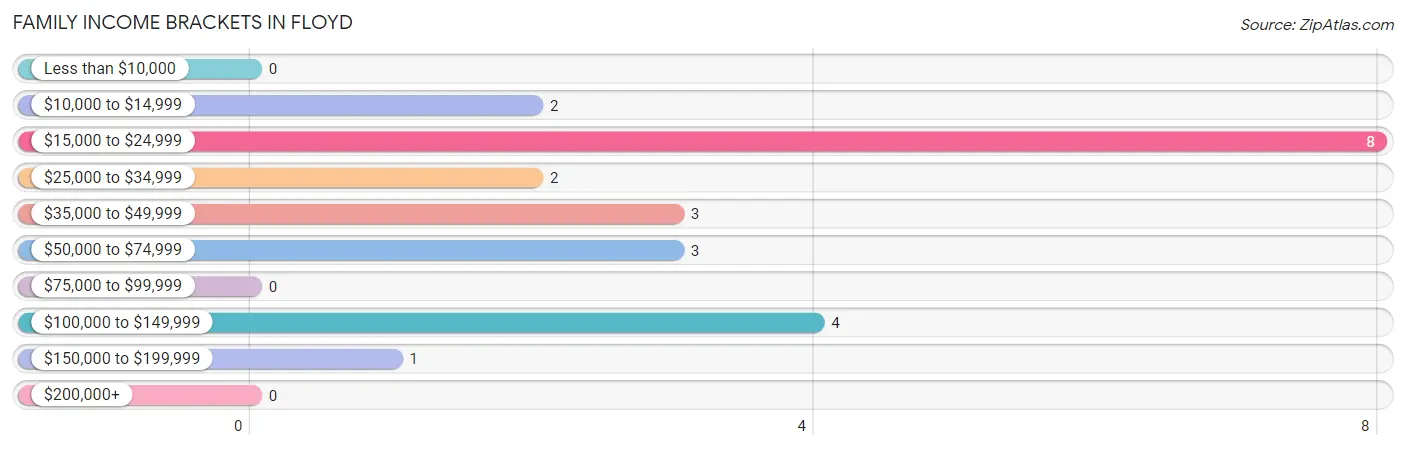
| Income Bracket | # Families | % Families |
| Less than $10,000 | 0 | 0.0% |
| $10,000 to $14,999 | 2 | 8.7% |
| $15,000 to $24,999 | 8 | 34.8% |
| $25,000 to $34,999 | 2 | 8.7% |
| $35,000 to $49,999 | 3 | 13.0% |
| $50,000 to $74,999 | 3 | 13.0% |
| $75,000 to $99,999 | 0 | 0.0% |
| $100,000 to $149,999 | 4 | 17.4% |
| $150,000 to $199,999 | 1 | 4.3% |
| $200,000+ | 0 | 0.0% |
Family Income by Famaliy Size in Floyd
2-person families (14 | 60.9%) account for the highest median family income in Floyd with $24,063 per family, while 2-person families (14 | 60.9%) have the highest median income of $12,032 per family member.
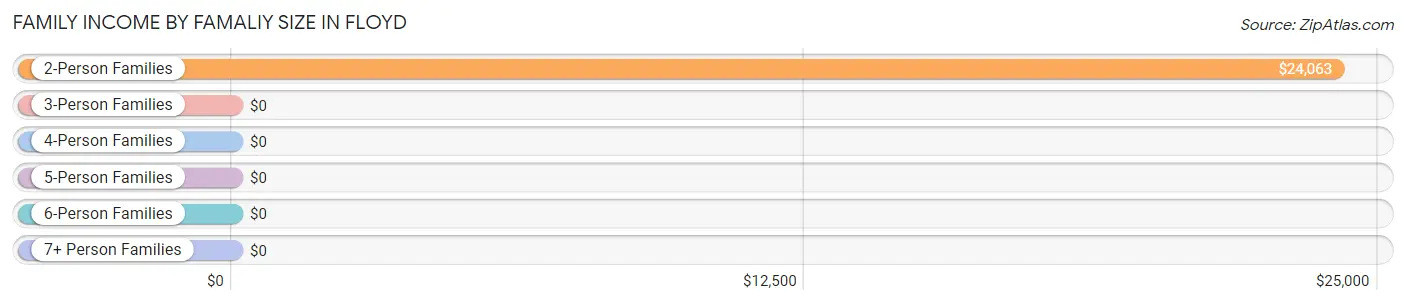
| Income Bracket | # Families | Median Income |
| 2-Person Families | 14 (60.9%) | $24,063 |
| 3-Person Families | 4 (17.4%) | $0 |
| 4-Person Families | 5 (21.7%) | $0 |
| 5-Person Families | 0 (0.0%) | $0 |
| 6-Person Families | 0 (0.0%) | $0 |
| 7+ Person Families | 0 (0.0%) | $0 |
| Total | 23 (100.0%) | $0 |
Family Income by Number of Earners in Floyd
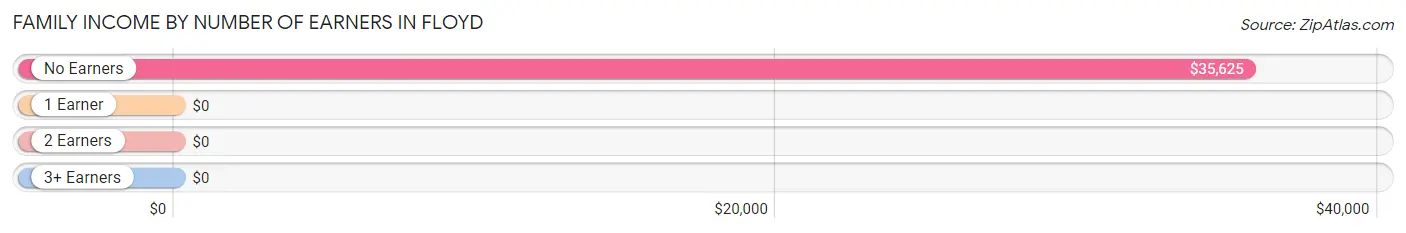
| Number of Earners | # Families | Median Income |
| No Earners | 5 (21.7%) | $35,625 |
| 1 Earner | 0 (0.0%) | $0 |
| 2 Earners | 15 (65.2%) | $0 |
| 3+ Earners | 3 (13.0%) | $0 |
| Total | 23 (100.0%) | $0 |
Household Income in Floyd
Household Income Brackets in Floyd
With 8 households falling in the category, the $15,000 to $24,999 income range is the most frequent in Floyd, accounting for 25.8% of all households.
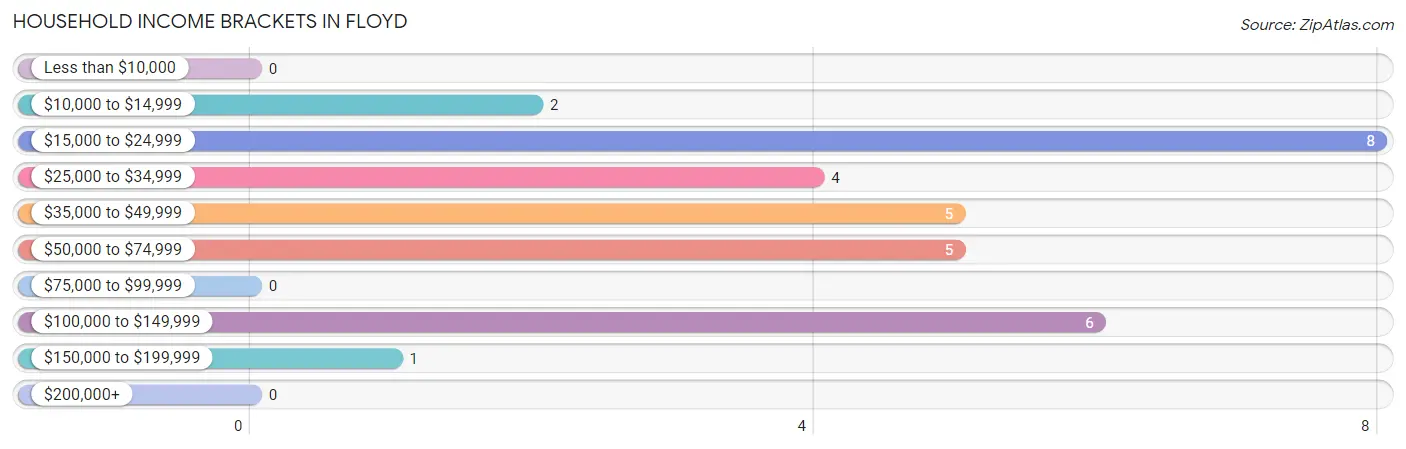
| Income Bracket | # Households | % Households |
| Less than $10,000 | 0 | 0.0% |
| $10,000 to $14,999 | 2 | 6.5% |
| $15,000 to $24,999 | 8 | 25.8% |
| $25,000 to $34,999 | 4 | 12.9% |
| $35,000 to $49,999 | 5 | 16.1% |
| $50,000 to $74,999 | 5 | 16.1% |
| $75,000 to $99,999 | 0 | 0.0% |
| $100,000 to $149,999 | 6 | 19.4% |
| $150,000 to $199,999 | 1 | 3.2% |
| $200,000+ | 0 | 0.0% |
Household Income by Householder Age in Floyd
The median household income in Floyd is $35,938, with the highest median household income of $65,833 found in the 45 to 64 years age bracket for the primary householder. A total of 14 households (45.2%) fall into this category. Meanwhile, the 15 to 24 years age bracket for the primary householder has the lowest median household income of $0, with 8 households (25.8%) in this group.
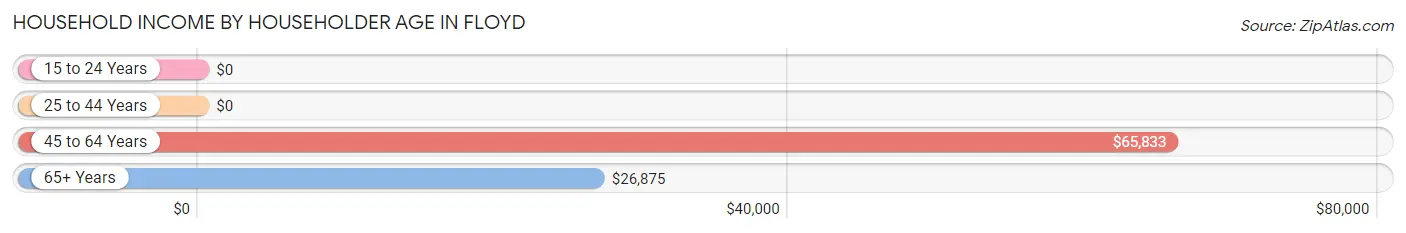
| Income Bracket | # Households | Median Income |
| 15 to 24 Years | 8 (25.8%) | $0 |
| 25 to 44 Years | 2 (6.5%) | $0 |
| 45 to 64 Years | 14 (45.2%) | $65,833 |
| 65+ Years | 7 (22.6%) | $26,875 |
| Total | 31 (100.0%) | $35,938 |
Poverty in Floyd
Income Below Poverty by Sex and Age in Floyd
With 3.6% poverty level for males and 6.5% for females among the residents of Floyd, 75 year old and over males and 75 year old and over females are the most vulnerable to poverty, with 2 males (33.3%) and 2 females (40.0%) in their respective age groups living below the poverty level.
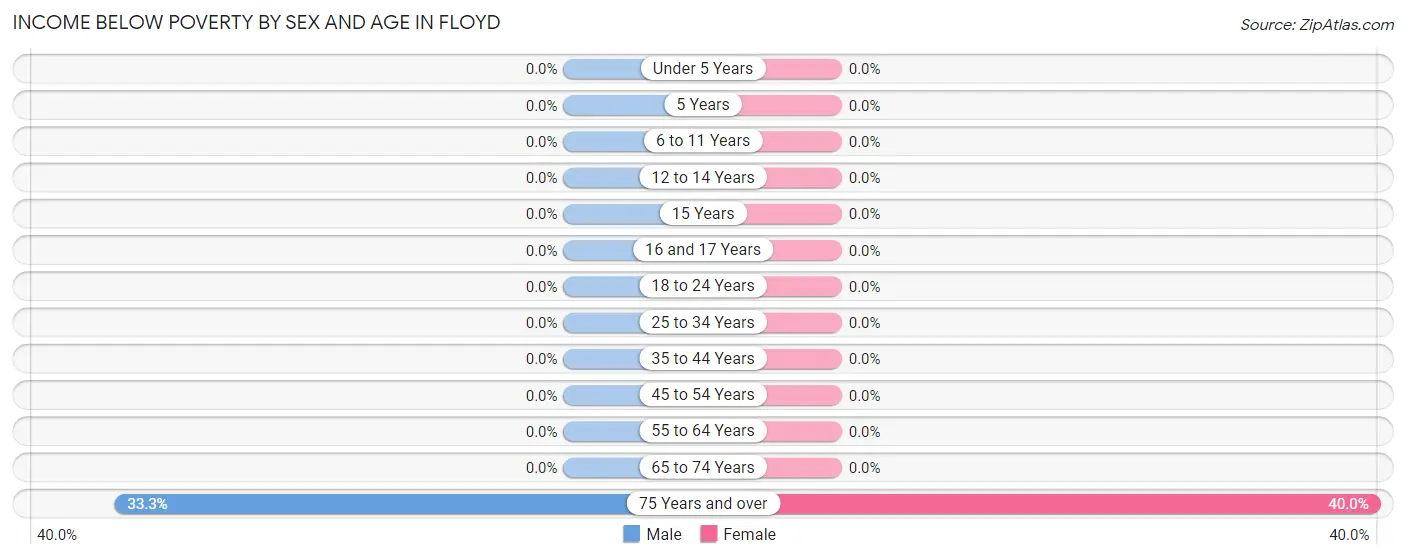
| Age Bracket | Male | Female |
| Under 5 Years | 0 (0.0%) | 0 (0.0%) |
| 5 Years | 0 (0.0%) | 0 (0.0%) |
| 6 to 11 Years | 0 (0.0%) | 0 (0.0%) |
| 12 to 14 Years | 0 (0.0%) | 0 (0.0%) |
| 15 Years | 0 (0.0%) | 0 (0.0%) |
| 16 and 17 Years | 0 (0.0%) | 0 (0.0%) |
| 18 to 24 Years | 0 (0.0%) | 0 (0.0%) |
| 25 to 34 Years | 0 (0.0%) | 0 (0.0%) |
| 35 to 44 Years | 0 (0.0%) | 0 (0.0%) |
| 45 to 54 Years | 0 (0.0%) | 0 (0.0%) |
| 55 to 64 Years | 0 (0.0%) | 0 (0.0%) |
| 65 to 74 Years | 0 (0.0%) | 0 (0.0%) |
| 75 Years and over | 2 (33.3%) | 2 (40.0%) |
| Total | 2 (3.6%) | 2 (6.5%) |
Income Above Poverty by Sex and Age in Floyd
According to the poverty statistics in Floyd, males aged under 5 years and females aged 18 to 24 years are the age groups that are most secure financially, with 100.0% of males and 100.0% of females in these age groups living above the poverty line.
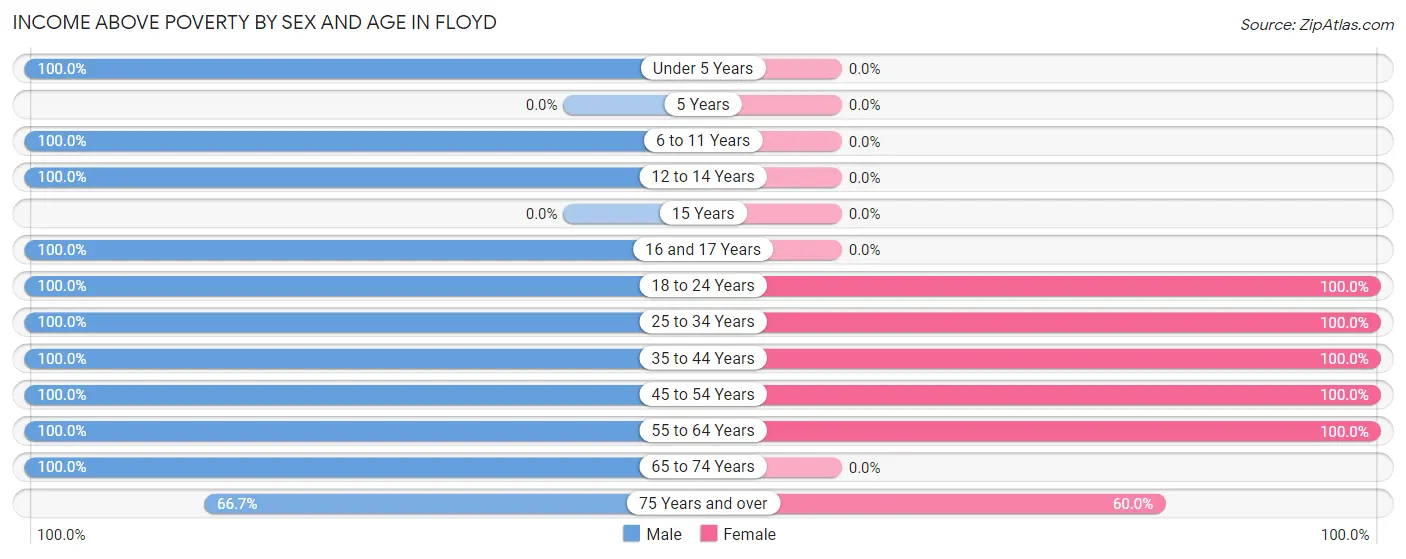
| Age Bracket | Male | Female |
| Under 5 Years | 1 (100.0%) | 0 (0.0%) |
| 5 Years | 0 (0.0%) | 0 (0.0%) |
| 6 to 11 Years | 1 (100.0%) | 0 (0.0%) |
| 12 to 14 Years | 14 (100.0%) | 0 (0.0%) |
| 15 Years | 0 (0.0%) | 0 (0.0%) |
| 16 and 17 Years | 1 (100.0%) | 0 (0.0%) |
| 18 to 24 Years | 17 (100.0%) | 12 (100.0%) |
| 25 to 34 Years | 2 (100.0%) | 1 (100.0%) |
| 35 to 44 Years | 2 (100.0%) | 1 (100.0%) |
| 45 to 54 Years | 4 (100.0%) | 3 (100.0%) |
| 55 to 64 Years | 7 (100.0%) | 9 (100.0%) |
| 65 to 74 Years | 1 (100.0%) | 0 (0.0%) |
| 75 Years and over | 4 (66.7%) | 3 (60.0%) |
| Total | 54 (96.4%) | 29 (93.5%) |
Income Below Poverty Among Married-Couple Families in Floyd
The poverty statistics for married-couple families in Floyd show that 9.1% or 2 of the total 22 families live below the poverty line. Families with no children have the highest poverty rate of 11.1%, comprising of 2 families. On the other hand, families with 1 or 2 children have the lowest poverty rate of 0.0%, which includes 0 families.
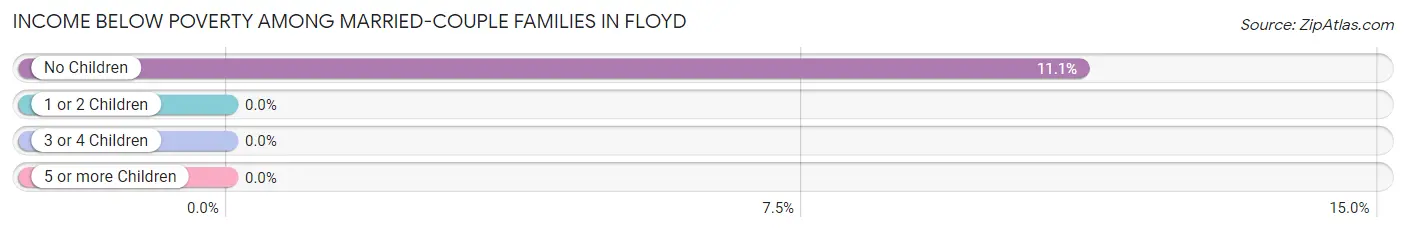
| Children | Above Poverty | Below Poverty |
| No Children | 16 (88.9%) | 2 (11.1%) |
| 1 or 2 Children | 4 (100.0%) | 0 (0.0%) |
| 3 or 4 Children | 0 (0.0%) | 0 (0.0%) |
| 5 or more Children | 0 (0.0%) | 0 (0.0%) |
| Total | 20 (90.9%) | 2 (9.1%) |
Income Below Poverty Among Single-Parent Households in Floyd
| Children | Single Father | Single Mother |
| No Children | 0 (0.0%) | 0 (0.0%) |
| 1 or 2 Children | 0 (0.0%) | 0 (0.0%) |
| 3 or 4 Children | 0 (0.0%) | 0 (0.0%) |
| 5 or more Children | 0 (0.0%) | 0 (0.0%) |
| Total | 0 (0.0%) | 0 (0.0%) |
Income Below Poverty Among Married-Couple vs Single-Parent Households in Floyd
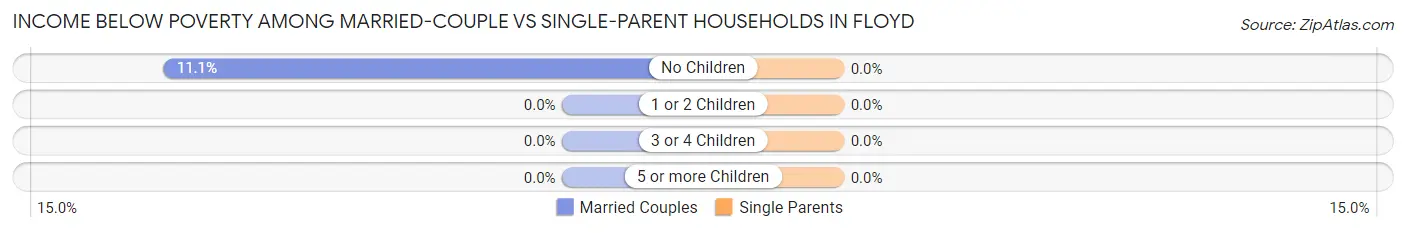
| Children | Married-Couple Families | Single-Parent Households |
| No Children | 2 (11.1%) | 0 (0.0%) |
| 1 or 2 Children | 0 (0.0%) | 0 (0.0%) |
| 3 or 4 Children | 0 (0.0%) | 0 (0.0%) |
| 5 or more Children | 0 (0.0%) | 0 (0.0%) |
| Total | 2 (9.1%) | 0 (0.0%) |
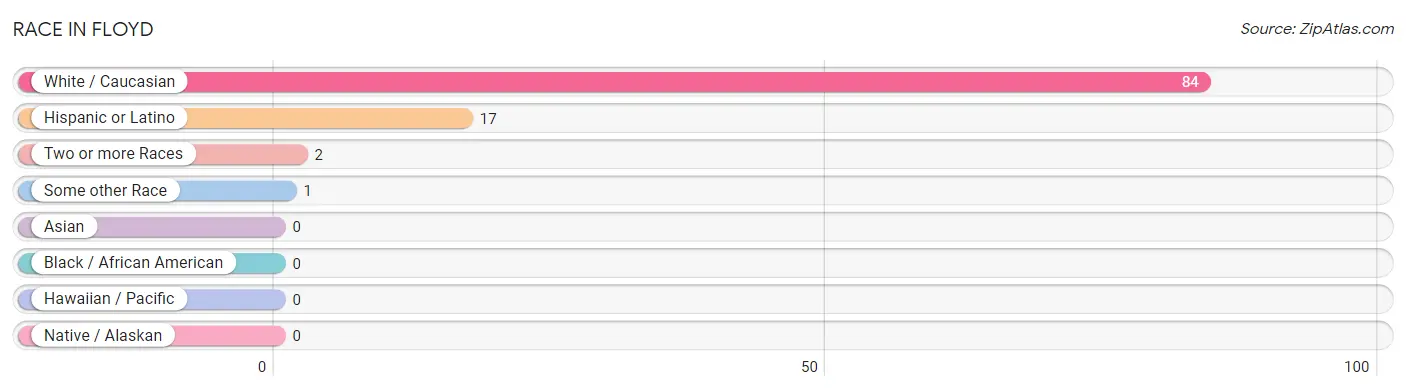
Race in Floyd
The most populous races in Floyd are White / Caucasian (84 | 96.6%), Hispanic or Latino (17 | 19.5%), and Two or more Races (2 | 2.3%).
| Race | # Population | % Population |
| Asian | 0 | 0.0% |
| Black / African American | 0 | 0.0% |
| Hawaiian / Pacific | 0 | 0.0% |
| Hispanic or Latino | 17 | 19.5% |
| Native / Alaskan | 0 | 0.0% |
| White / Caucasian | 84 | 96.6% |
| Two or more Races | 2 | 2.3% |
| Some other Race | 1 | 1.1% |
| Total | 87 | 100.0% |
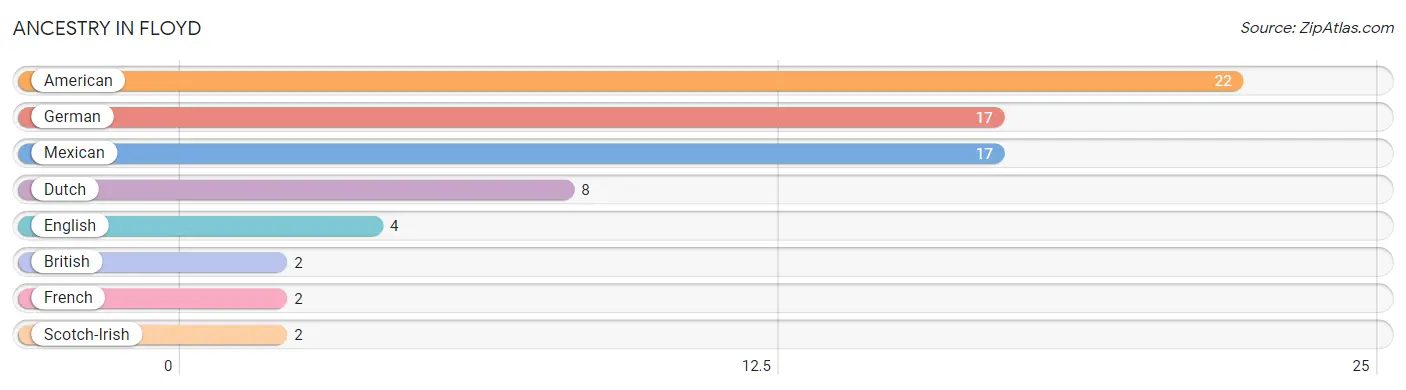
Ancestry in Floyd
The most populous ancestries reported in Floyd are American (22 | 25.3%), German (17 | 19.5%), Mexican (17 | 19.5%), Dutch (8 | 9.2%), and English (4 | 4.6%), together accounting for 78.2% of all Floyd residents.
| Ancestry | # Population | % Population |
| American | 22 | 25.3% |
| British | 2 | 2.3% |
| Dutch | 8 | 9.2% |
| English | 4 | 4.6% |
| French | 2 | 2.3% |
| German | 17 | 19.5% |
| Mexican | 17 | 19.5% |
| Scotch-Irish | 2 | 2.3% | View All 8 Rows |
Immigrants in Floyd
The most numerous immigrant groups reported in Floyd came from Europe (4 | 4.6%), Netherlands (4 | 4.6%), Western Europe (4 | 4.6%), Central America (2 | 2.3%), and Latin America (2 | 2.3%), together accounting for 18.4% of all Floyd residents.
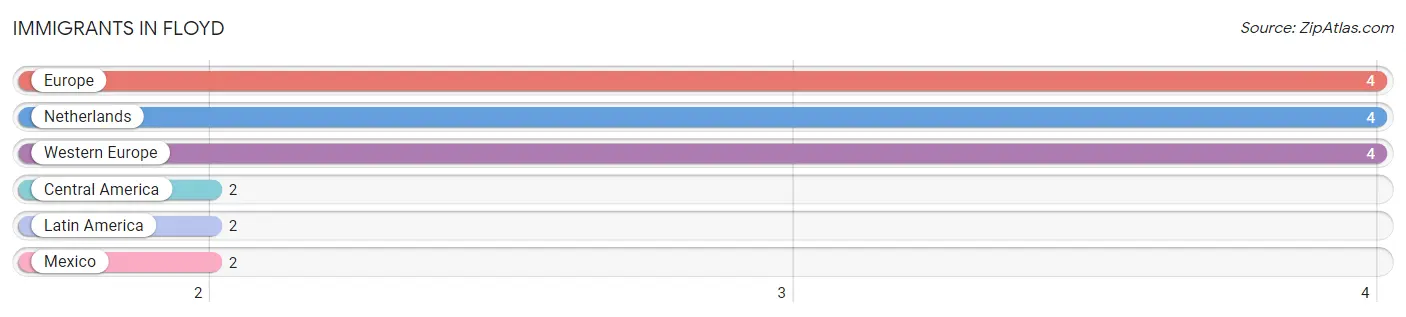
| Immigration Origin | # Population | % Population |
| Central America | 2 | 2.3% |
| Europe | 4 | 4.6% |
| Latin America | 2 | 2.3% |
| Mexico | 2 | 2.3% |
| Netherlands | 4 | 4.6% |
| Western Europe | 4 | 4.6% | View All 6 Rows |
Sex and Age in Floyd
Sex and Age in Floyd
The most populous age groups in Floyd are 20 to 24 Years (17 | 30.4%) for men and 20 to 24 Years (12 | 38.7%) for women.
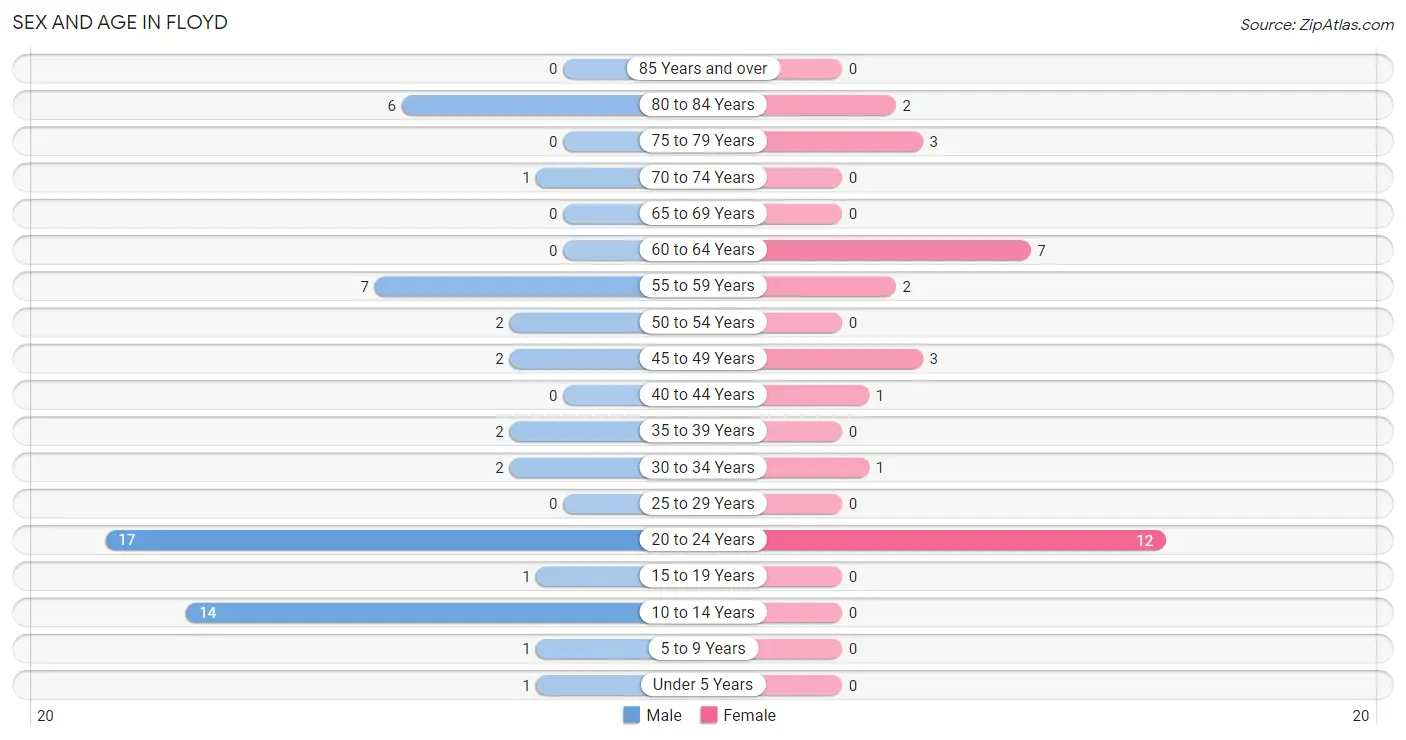
| Age Bracket | Male | Female |
| Under 5 Years | 1 (1.8%) | 0 (0.0%) |
| 5 to 9 Years | 1 (1.8%) | 0 (0.0%) |
| 10 to 14 Years | 14 (25.0%) | 0 (0.0%) |
| 15 to 19 Years | 1 (1.8%) | 0 (0.0%) |
| 20 to 24 Years | 17 (30.4%) | 12 (38.7%) |
| 25 to 29 Years | 0 (0.0%) | 0 (0.0%) |
| 30 to 34 Years | 2 (3.6%) | 1 (3.2%) |
| 35 to 39 Years | 2 (3.6%) | 0 (0.0%) |
| 40 to 44 Years | 0 (0.0%) | 1 (3.2%) |
| 45 to 49 Years | 2 (3.6%) | 3 (9.7%) |
| 50 to 54 Years | 2 (3.6%) | 0 (0.0%) |
| 55 to 59 Years | 7 (12.5%) | 2 (6.5%) |
| 60 to 64 Years | 0 (0.0%) | 7 (22.6%) |
| 65 to 69 Years | 0 (0.0%) | 0 (0.0%) |
| 70 to 74 Years | 1 (1.8%) | 0 (0.0%) |
| 75 to 79 Years | 0 (0.0%) | 3 (9.7%) |
| 80 to 84 Years | 6 (10.7%) | 2 (6.5%) |
| 85 Years and over | 0 (0.0%) | 0 (0.0%) |
| Total | 56 (100.0%) | 31 (100.0%) |
Families and Households in Floyd
Median Family Size in Floyd
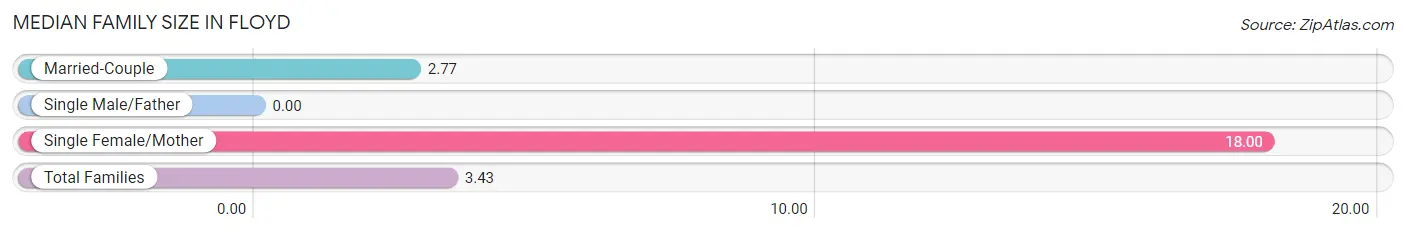
| Family Type | # Families | Family Size |
| Married-Couple | 22 (95.7%) | 2.77 |
| Single Male/Father | 0 (0.0%) | - |
| Single Female/Mother | 1 (4.3%) | 18.00 |
| Total Families | 23 (100.0%) | 3.43 |
Median Household Size in Floyd
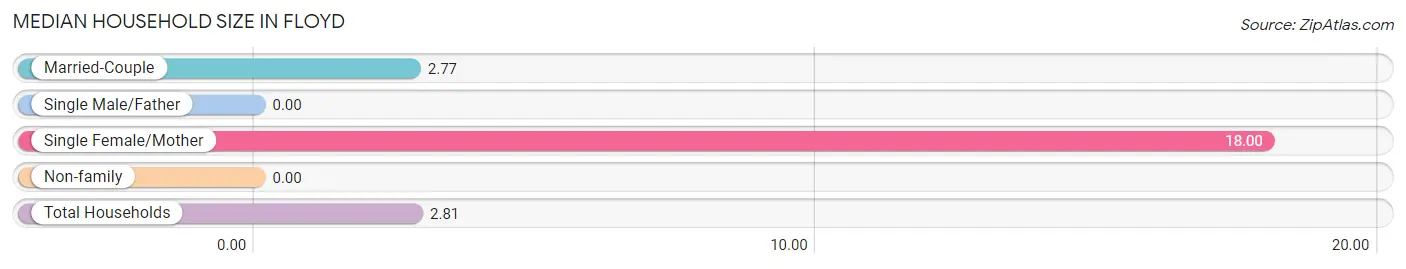
| Household Type | # Households | Household Size |
| Married-Couple | 22 (71.0%) | 2.77 |
| Single Male/Father | 0 (0.0%) | - |
| Single Female/Mother | 1 (3.2%) | 18.00 |
| Non-family | 8 (25.8%) | - |
| Total Households | 31 (100.0%) | 2.81 |
Household Size by Marriage Status in Floyd
Out of a total of 31 households in Floyd, 23 (74.2%) are family households, while 8 (25.8%) are nonfamily households. The most numerous type of family households are 2-person households, comprising 14, and the most common type of nonfamily households are 1-person households, comprising 8.
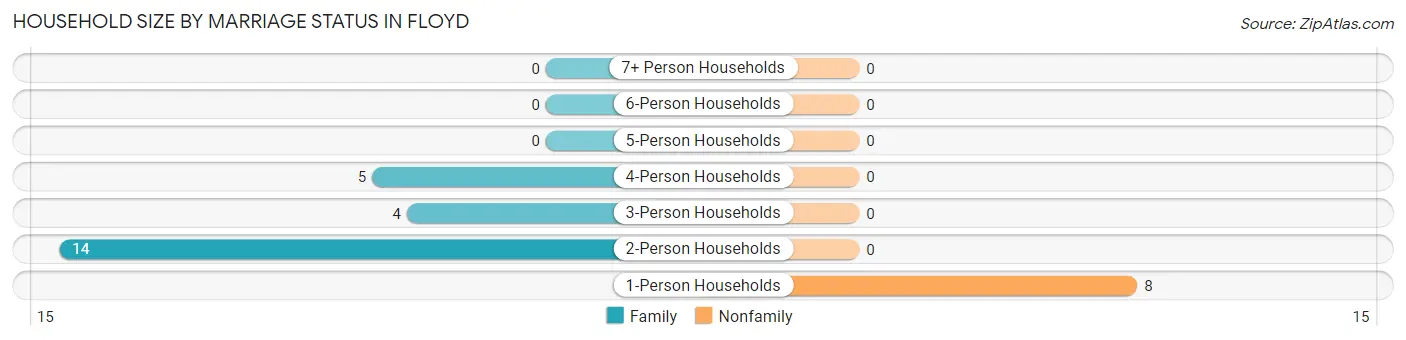
| Household Size | Family Households | Nonfamily Households |
| 1-Person Households | - | 8 (25.8%) |
| 2-Person Households | 14 (45.2%) | 0 (0.0%) |
| 3-Person Households | 4 (12.9%) | 0 (0.0%) |
| 4-Person Households | 5 (16.1%) | 0 (0.0%) |
| 5-Person Households | 0 (0.0%) | 0 (0.0%) |
| 6-Person Households | 0 (0.0%) | 0 (0.0%) |
| 7+ Person Households | 0 (0.0%) | 0 (0.0%) |
| Total | 23 (74.2%) | 8 (25.8%) |
Female Fertility in Floyd
Fertility by Age in Floyd
| Age Bracket | Women with Births | Births / 1,000 Women |
| 15 to 19 years | 0 (0.0%) | 0.0 |
| 20 to 34 years | 0 (0.0%) | 0.0 |
| 35 to 50 years | 0 (0.0%) | 0.0 |
| Total | 0 (0.0%) | 0.0 |
Fertility by Age by Marriage Status in Floyd
| Age Bracket | Married | Unmarried |
| 15 to 19 years | 0 (0.0%) | 0 (0.0%) |
| 20 to 34 years | 0 (0.0%) | 0 (0.0%) |
| 35 to 50 years | 0 (0.0%) | 0 (0.0%) |
| Total | 0 (0.0%) | 0 (0.0%) |
Fertility by Education in Floyd
| Educational Attainment | Women with Births | Births / 1,000 Women |
| Less than High School | 0 (0.0%) | 0.0 |
| High School Diploma | 0 (0.0%) | 0.0 |
| College or Associate's Degree | 0 (0.0%) | 0.0 |
| Bachelor's Degree | 0 (0.0%) | 0.0 |
| Graduate Degree | 0 (0.0%) | 0.0 |
| Total | 0 (0.0%) | 0.0 |
Fertility by Education by Marriage Status in Floyd
| Educational Attainment | Married | Unmarried |
| Less than High School | 0 (0.0%) | 0 (0.0%) |
| High School Diploma | 0 (0.0%) | 0 (0.0%) |
| College or Associate's Degree | 0 (0.0%) | 0 (0.0%) |
| Bachelor's Degree | 0 (0.0%) | 0 (0.0%) |
| Graduate Degree | 0 (0.0%) | 0 (0.0%) |
| Total | 0 (0.0%) | 0 (0.0%) |
Employment Characteristics in Floyd
Employment by Class of Employer in Floyd
Among the 42 employed individuals in Floyd, private company employees (16 | 38.1%), self-employed (incorporated) (11 | 26.2%), and self-employed (not incorporated) (10 | 23.8%) make up the most common classes of employment.
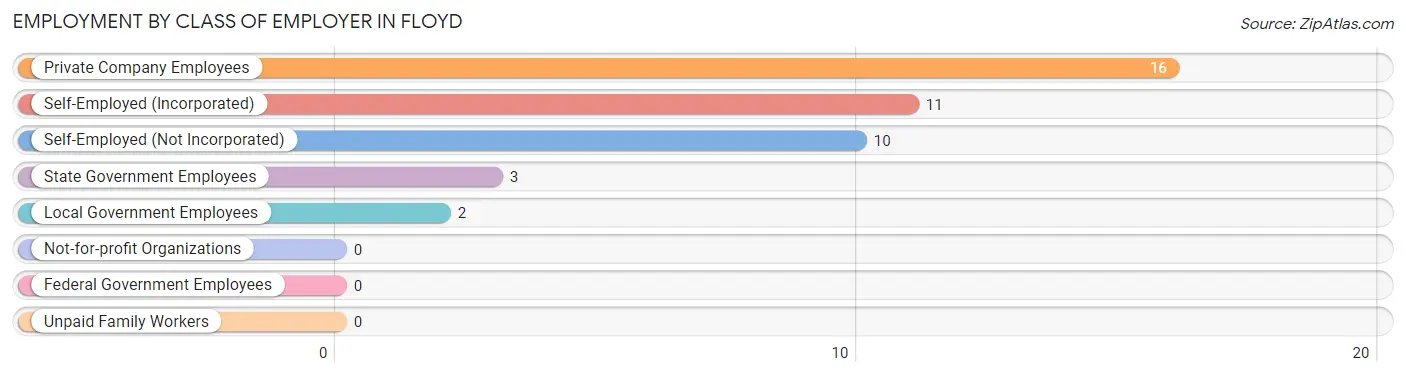
| Employer Class | # Employees | % Employees |
| Private Company Employees | 16 | 38.1% |
| Self-Employed (Incorporated) | 11 | 26.2% |
| Self-Employed (Not Incorporated) | 10 | 23.8% |
| Not-for-profit Organizations | 0 | 0.0% |
| Local Government Employees | 2 | 4.8% |
| State Government Employees | 3 | 7.1% |
| Federal Government Employees | 0 | 0.0% |
| Unpaid Family Workers | 0 | 0.0% |
| Total | 42 | 100.0% |
Employment Status by Age in Floyd
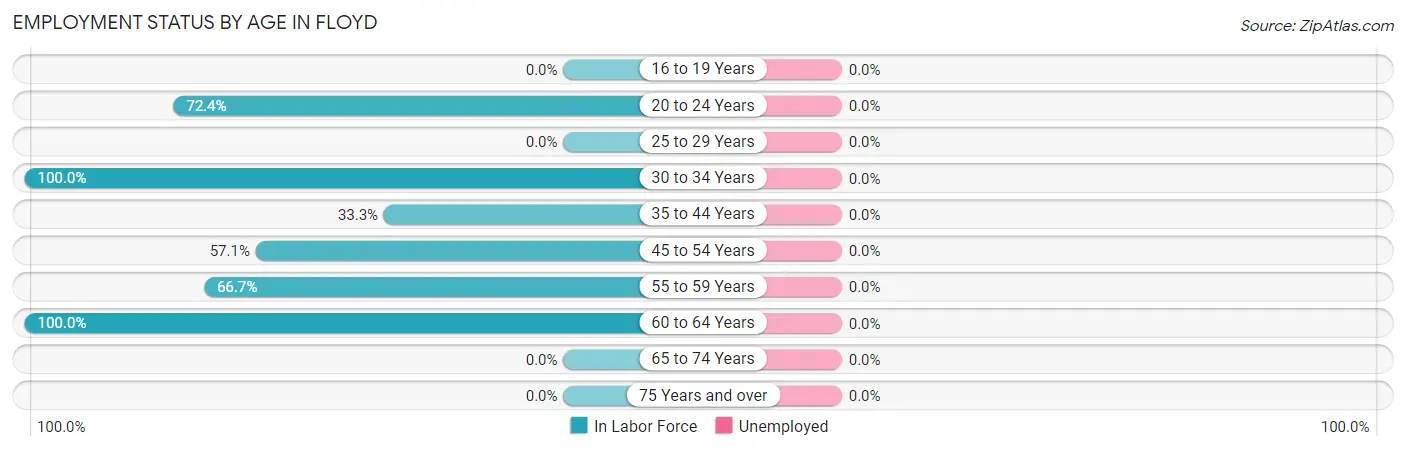
| Age Bracket | In Labor Force | Unemployed |
| 16 to 19 Years | 0 (0.0%) | 0 (0.0%) |
| 20 to 24 Years | 21 (72.4%) | 0 (0.0%) |
| 25 to 29 Years | 0 (0.0%) | 0 (0.0%) |
| 30 to 34 Years | 3 (100.0%) | 0 (0.0%) |
| 35 to 44 Years | 1 (33.3%) | 0 (0.0%) |
| 45 to 54 Years | 4 (57.1%) | 0 (0.0%) |
| 55 to 59 Years | 6 (66.7%) | 0 (0.0%) |
| 60 to 64 Years | 7 (100.0%) | 0 (0.0%) |
| 65 to 74 Years | 0 (0.0%) | 0 (0.0%) |
| 75 Years and over | 0 (0.0%) | 0 (0.0%) |
| Total | 42 (59.2%) | 0 (0.0%) |
Employment Status by Educational Attainment in Floyd
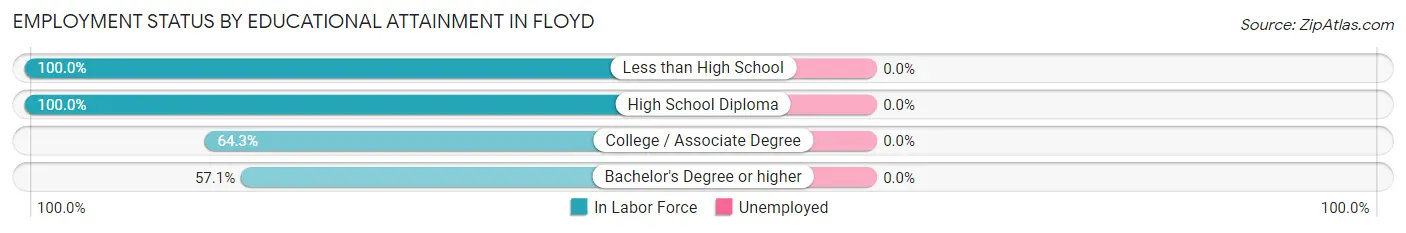
| Educational Attainment | In Labor Force | Unemployed |
| Less than High School | 6 (100.0%) | 0 (0.0%) |
| High School Diploma | 2 (100.0%) | 0 (0.0%) |
| College / Associate Degree | 9 (64.3%) | 0 (0.0%) |
| Bachelor's Degree or higher | 4 (57.1%) | 0 (0.0%) |
| Total | 21 (72.4%) | 0 (0.0%) |
Employment Occupations by Sex in Floyd
Management, Business, Science and Arts Occupations
The most common Management, Business, Science and Arts occupations in Floyd are Management (6 | 14.3%), Community & Social Service (4 | 9.5%), Education Instruction & Library (3 | 7.1%), Computers, Engineering & Science (2 | 4.8%), and Architecture & Engineering (2 | 4.8%).
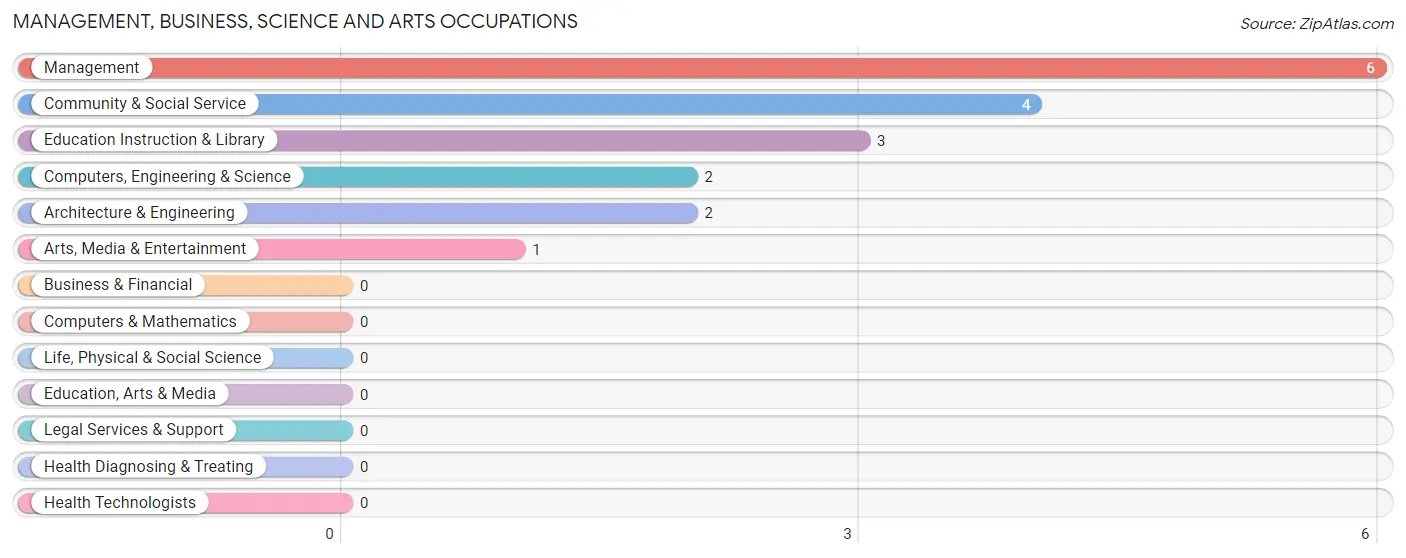
Management, Business, Science and Arts Occupations by Sex
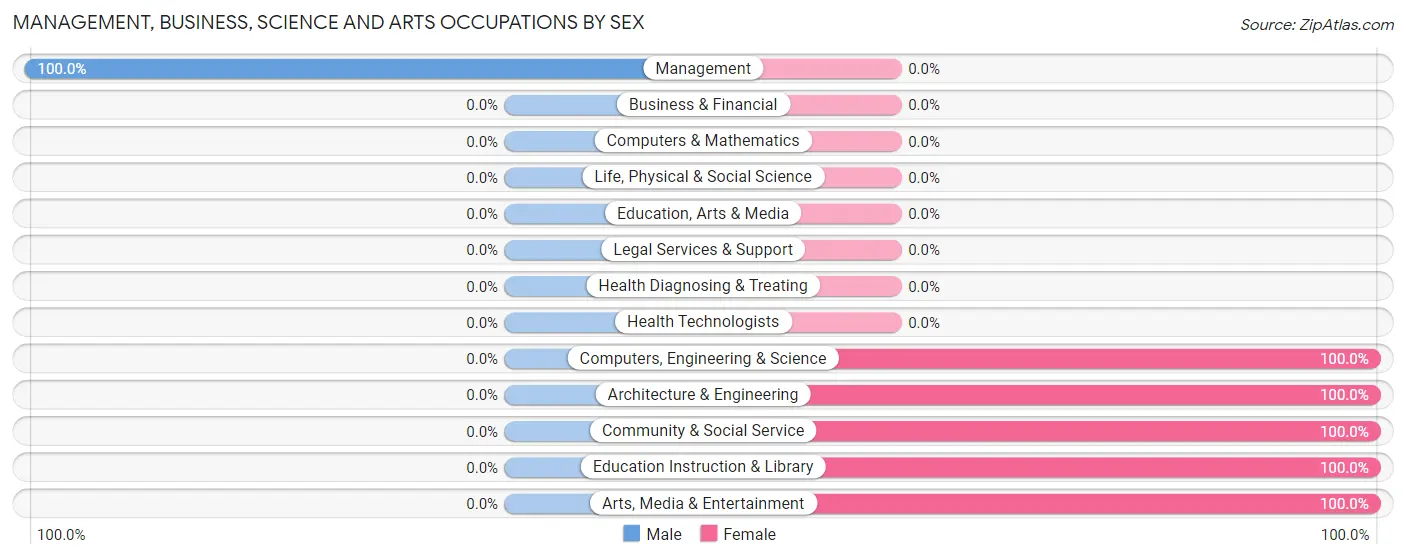
| Occupation | Male | Female |
| Management | 6 (100.0%) | 0 (0.0%) |
| Business & Financial | 0 (0.0%) | 0 (0.0%) |
| Computers, Engineering & Science | 0 (0.0%) | 2 (100.0%) |
| Computers & Mathematics | 0 (0.0%) | 0 (0.0%) |
| Architecture & Engineering | 0 (0.0%) | 2 (100.0%) |
| Life, Physical & Social Science | 0 (0.0%) | 0 (0.0%) |
| Community & Social Service | 0 (0.0%) | 4 (100.0%) |
| Education, Arts & Media | 0 (0.0%) | 0 (0.0%) |
| Legal Services & Support | 0 (0.0%) | 0 (0.0%) |
| Education Instruction & Library | 0 (0.0%) | 3 (100.0%) |
| Arts, Media & Entertainment | 0 (0.0%) | 1 (100.0%) |
| Health Diagnosing & Treating | 0 (0.0%) | 0 (0.0%) |
| Health Technologists | 0 (0.0%) | 0 (0.0%) |
| Total (Category) | 6 (50.0%) | 6 (50.0%) |
| Total (Overall) | 27 (64.3%) | 15 (35.7%) |
Services Occupations
The most common Services occupations in Floyd are Cleaning & Maintenance (5 | 11.9%), and Personal Care & Service (4 | 9.5%).
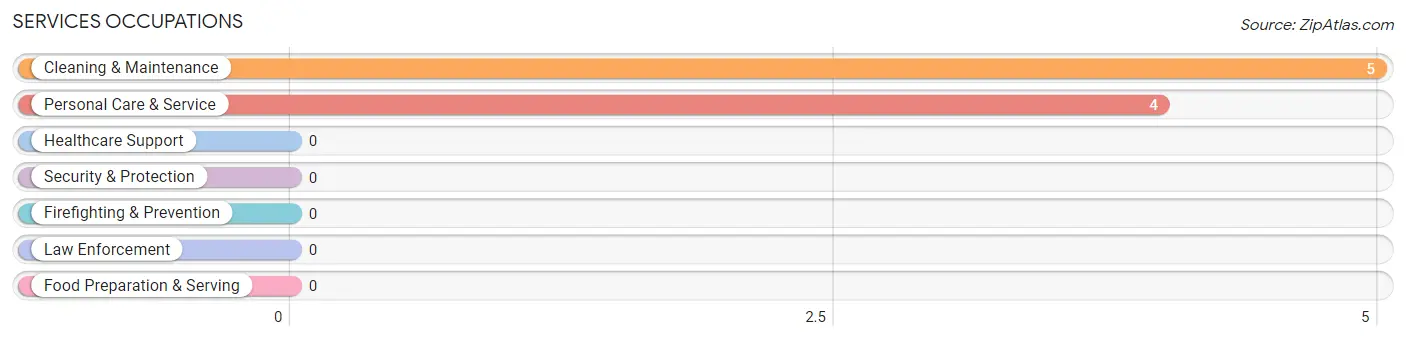
Services Occupations by Sex
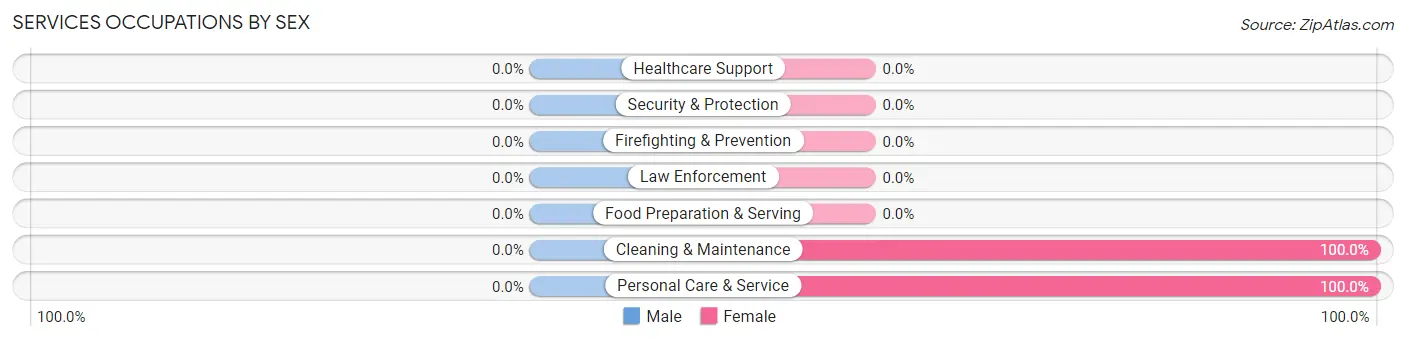
| Occupation | Male | Female |
| Healthcare Support | 0 (0.0%) | 0 (0.0%) |
| Security & Protection | 0 (0.0%) | 0 (0.0%) |
| Firefighting & Prevention | 0 (0.0%) | 0 (0.0%) |
| Law Enforcement | 0 (0.0%) | 0 (0.0%) |
| Food Preparation & Serving | 0 (0.0%) | 0 (0.0%) |
| Cleaning & Maintenance | 0 (0.0%) | 5 (100.0%) |
| Personal Care & Service | 0 (0.0%) | 4 (100.0%) |
| Total (Category) | 0 (0.0%) | 9 (100.0%) |
| Total (Overall) | 27 (64.3%) | 15 (35.7%) |
Sales and Office Occupations
The most common Sales and Office occupations in Floyd are , and Sales & Related (11 | 26.2%).
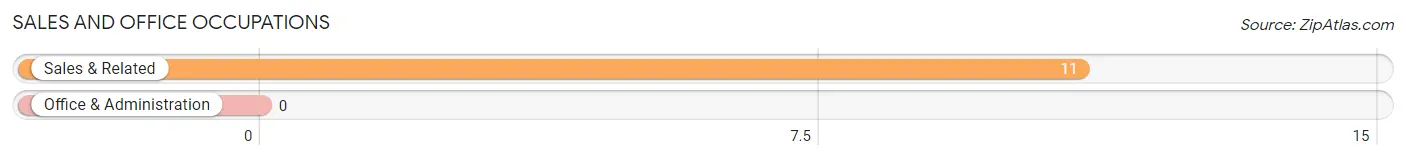
Sales and Office Occupations by Sex
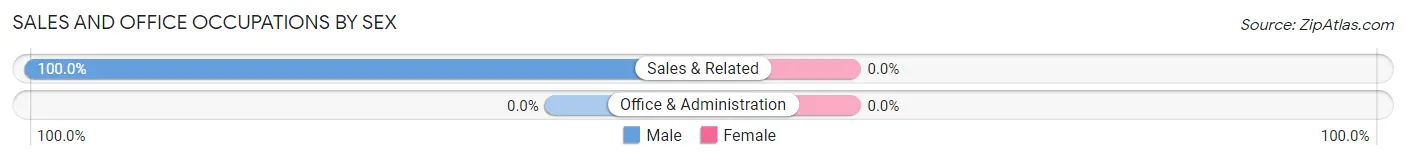
| Occupation | Male | Female |
| Sales & Related | 11 (100.0%) | 0 (0.0%) |
| Office & Administration | 0 (0.0%) | 0 (0.0%) |
| Total (Category) | 11 (100.0%) | 0 (0.0%) |
| Total (Overall) | 27 (64.3%) | 15 (35.7%) |
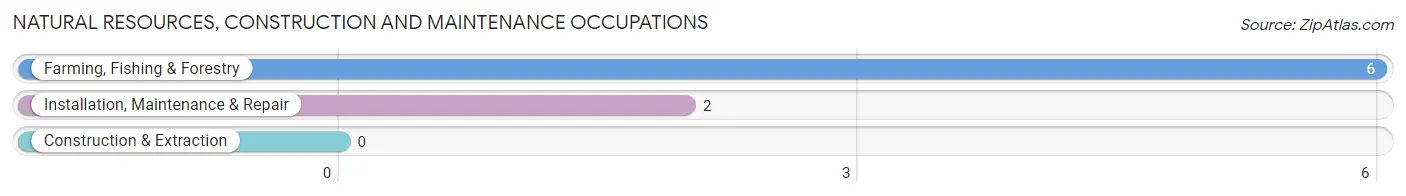
Natural Resources, Construction and Maintenance Occupations
The most common Natural Resources, Construction and Maintenance occupations in Floyd are Farming, Fishing & Forestry (6 | 14.3%), and Installation, Maintenance & Repair (2 | 4.8%).
Natural Resources, Construction and Maintenance Occupations by Sex
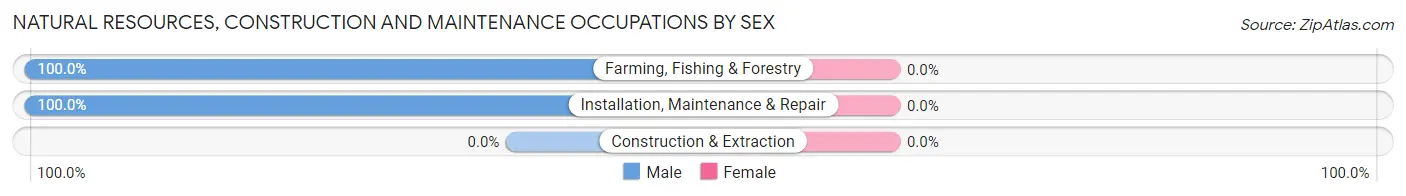
| Occupation | Male | Female |
| Farming, Fishing & Forestry | 6 (100.0%) | 0 (0.0%) |
| Construction & Extraction | 0 (0.0%) | 0 (0.0%) |
| Installation, Maintenance & Repair | 2 (100.0%) | 0 (0.0%) |
| Total (Category) | 8 (100.0%) | 0 (0.0%) |
| Total (Overall) | 27 (64.3%) | 15 (35.7%) |
Production, Transportation and Moving Occupations
The most common Production, Transportation and Moving occupations in Floyd are , and Transportation (2 | 4.8%).
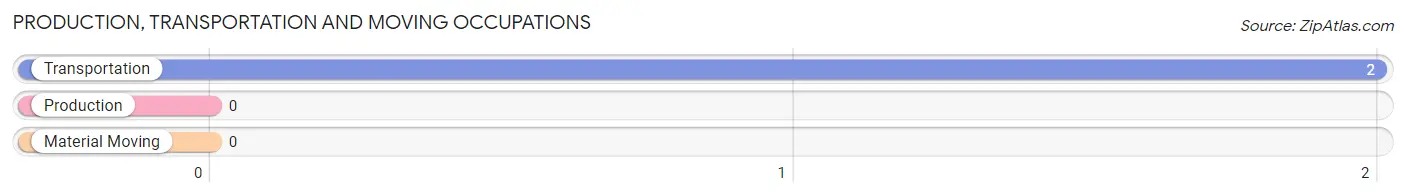
Production, Transportation and Moving Occupations by Sex
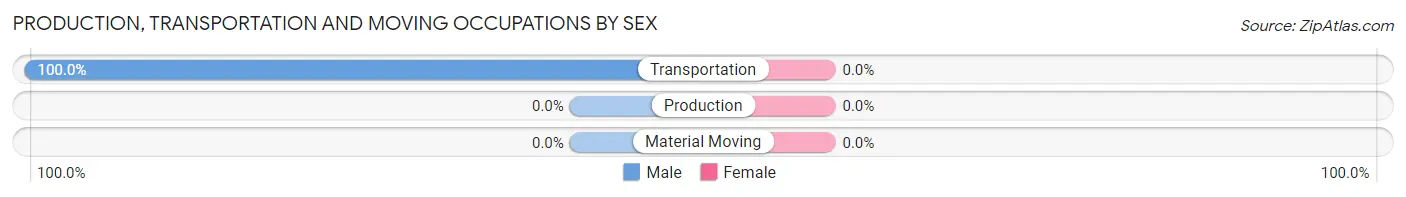
| Occupation | Male | Female |
| Production | 0 (0.0%) | 0 (0.0%) |
| Transportation | 2 (100.0%) | 0 (0.0%) |
| Material Moving | 0 (0.0%) | 0 (0.0%) |
| Total (Category) | 2 (100.0%) | 0 (0.0%) |
| Total (Overall) | 27 (64.3%) | 15 (35.7%) |
Employment Industries by Sex in Floyd
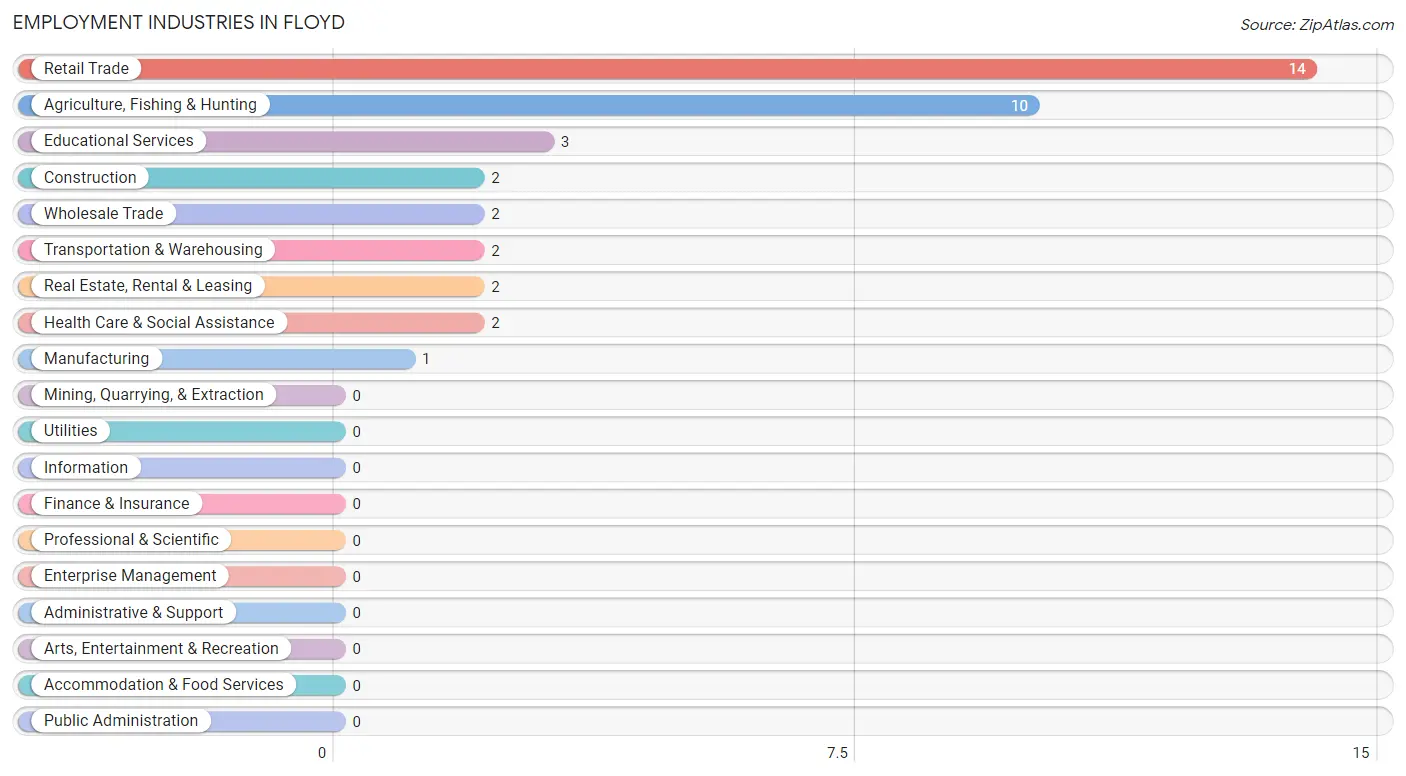
Employment Industries in Floyd
The major employment industries in Floyd include Retail Trade (14 | 33.3%), Agriculture, Fishing & Hunting (10 | 23.8%), Educational Services (3 | 7.1%), Construction (2 | 4.8%), and Wholesale Trade (2 | 4.8%).
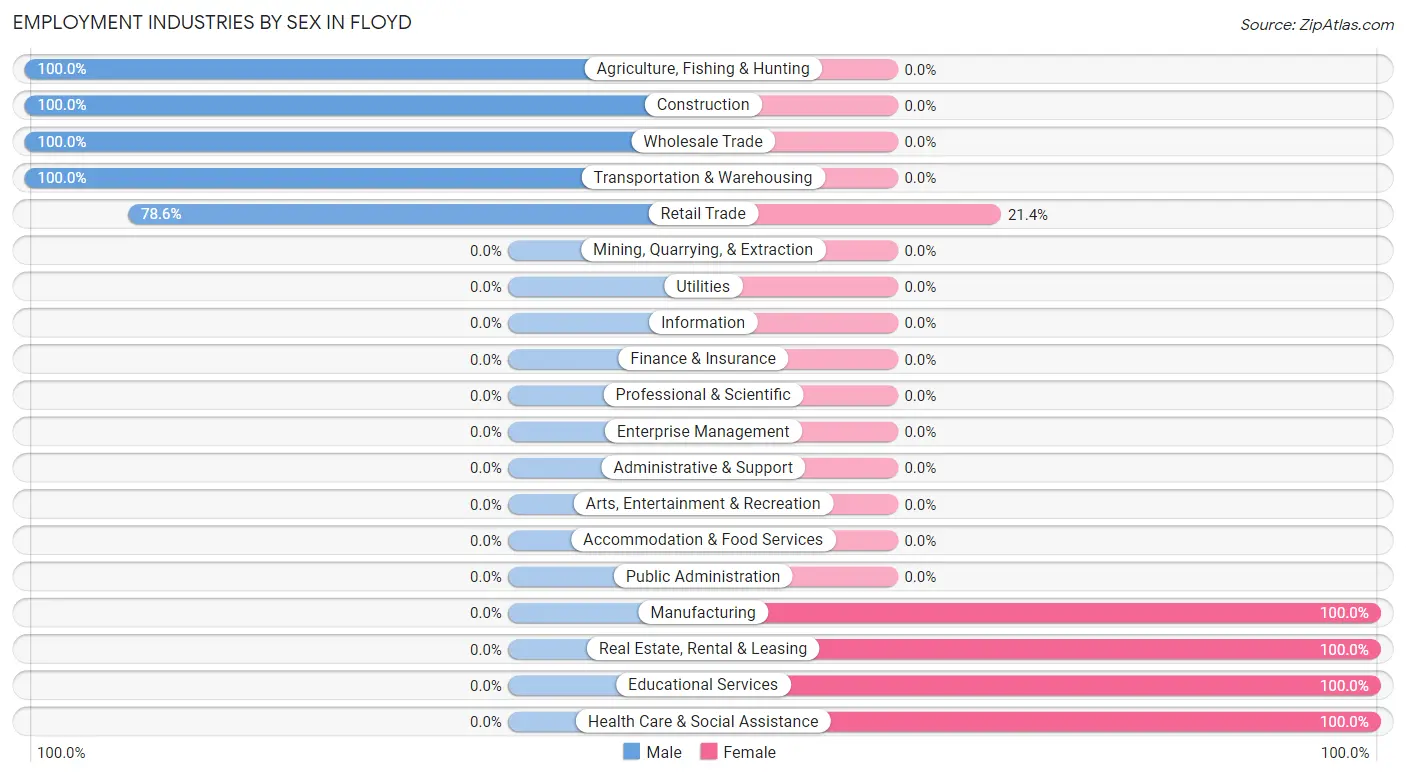
Employment Industries by Sex in Floyd
The Floyd industries that see more men than women are Agriculture, Fishing & Hunting (100.0%), Construction (100.0%), and Wholesale Trade (100.0%), whereas the industries that tend to have a higher number of women are Manufacturing (100.0%), Real Estate, Rental & Leasing (100.0%), and Educational Services (100.0%).
| Industry | Male | Female |
| Agriculture, Fishing & Hunting | 10 (100.0%) | 0 (0.0%) |
| Mining, Quarrying, & Extraction | 0 (0.0%) | 0 (0.0%) |
| Construction | 2 (100.0%) | 0 (0.0%) |
| Manufacturing | 0 (0.0%) | 1 (100.0%) |
| Wholesale Trade | 2 (100.0%) | 0 (0.0%) |
| Retail Trade | 11 (78.6%) | 3 (21.4%) |
| Transportation & Warehousing | 2 (100.0%) | 0 (0.0%) |
| Utilities | 0 (0.0%) | 0 (0.0%) |
| Information | 0 (0.0%) | 0 (0.0%) |
| Finance & Insurance | 0 (0.0%) | 0 (0.0%) |
| Real Estate, Rental & Leasing | 0 (0.0%) | 2 (100.0%) |
| Professional & Scientific | 0 (0.0%) | 0 (0.0%) |
| Enterprise Management | 0 (0.0%) | 0 (0.0%) |
| Administrative & Support | 0 (0.0%) | 0 (0.0%) |
| Educational Services | 0 (0.0%) | 3 (100.0%) |
| Health Care & Social Assistance | 0 (0.0%) | 2 (100.0%) |
| Arts, Entertainment & Recreation | 0 (0.0%) | 0 (0.0%) |
| Accommodation & Food Services | 0 (0.0%) | 0 (0.0%) |
| Public Administration | 0 (0.0%) | 0 (0.0%) |
| Total | 27 (64.3%) | 15 (35.7%) |
Education in Floyd
School Enrollment in Floyd
The most common levels of schooling among the 25 students in Floyd are middle school (14 | 56.0%), college / undergraduate (8 | 32.0%), and nursery / preschool (1 | 4.0%).
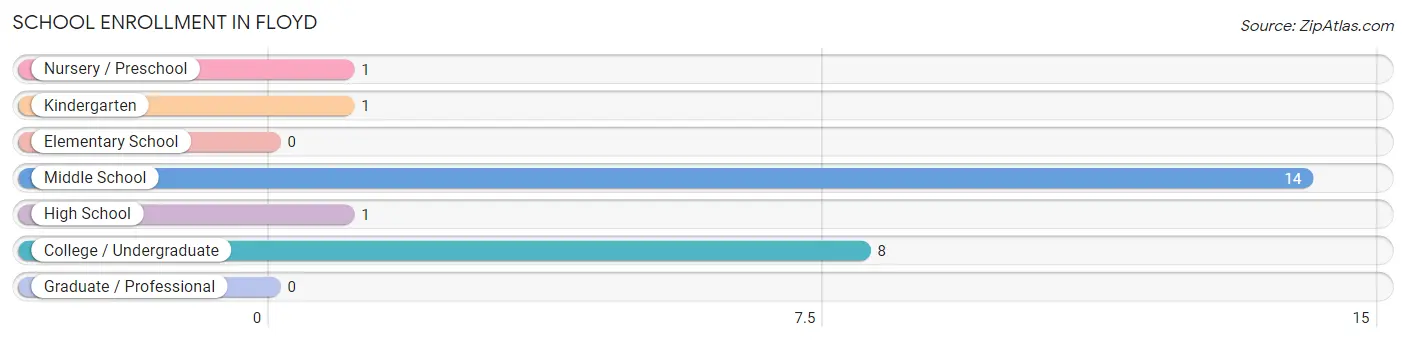
| School Level | # Students | % Students |
| Nursery / Preschool | 1 | 4.0% |
| Kindergarten | 1 | 4.0% |
| Elementary School | 0 | 0.0% |
| Middle School | 14 | 56.0% |
| High School | 1 | 4.0% |
| College / Undergraduate | 8 | 32.0% |
| Graduate / Professional | 0 | 0.0% |
| Total | 25 | 100.0% |
School Enrollment by Age by Funding Source in Floyd
Out of a total of 25 students who are enrolled in schools in Floyd, 2 (8.0%) attend a private institution, while the remaining 23 (92.0%) are enrolled in public schools. The age group of 3 to 4 year olds has the highest likelihood of being enrolled in private schools, with 1 (100.0% in the age bracket) enrolled. Conversely, the age group of 10 to 14 year olds has the lowest likelihood of being enrolled in a private school, with 14 (100.0% in the age bracket) attending a public institution.
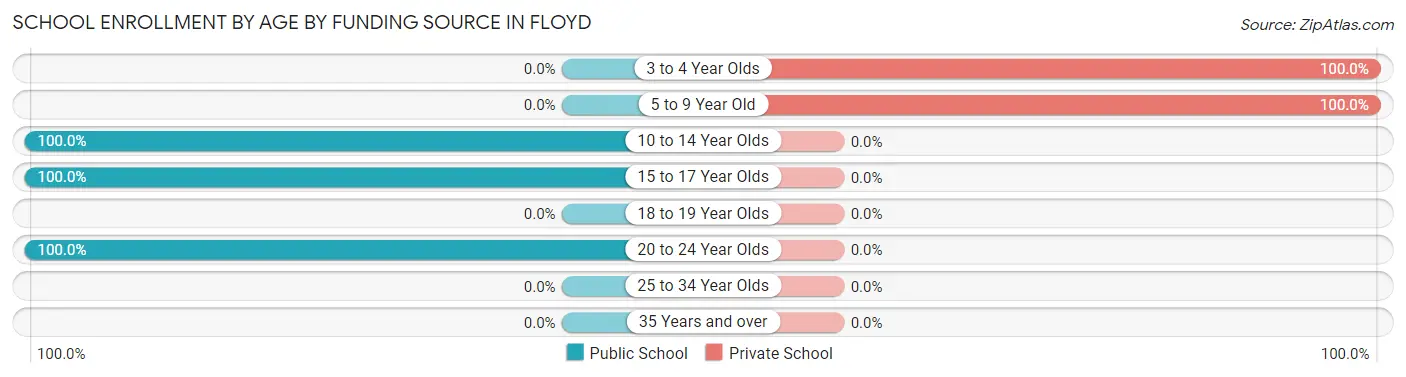
| Age Bracket | Public School | Private School |
| 3 to 4 Year Olds | 0 (0.0%) | 1 (100.0%) |
| 5 to 9 Year Old | 0 (0.0%) | 1 (100.0%) |
| 10 to 14 Year Olds | 14 (100.0%) | 0 (0.0%) |
| 15 to 17 Year Olds | 1 (100.0%) | 0 (0.0%) |
| 18 to 19 Year Olds | 0 (0.0%) | 0 (0.0%) |
| 20 to 24 Year Olds | 8 (100.0%) | 0 (0.0%) |
| 25 to 34 Year Olds | 0 (0.0%) | 0 (0.0%) |
| 35 Years and over | 0 (0.0%) | 0 (0.0%) |
| Total | 23 (92.0%) | 2 (8.0%) |
Educational Attainment by Field of Study in Floyd
Education (3 | 27.3%), arts & humanities (3 | 27.3%), science & technology (2 | 18.2%), business (2 | 18.2%), and visual & performing arts (1 | 9.1%) are the most common fields of study among 11 individuals in Floyd who have obtained a bachelor's degree or higher.
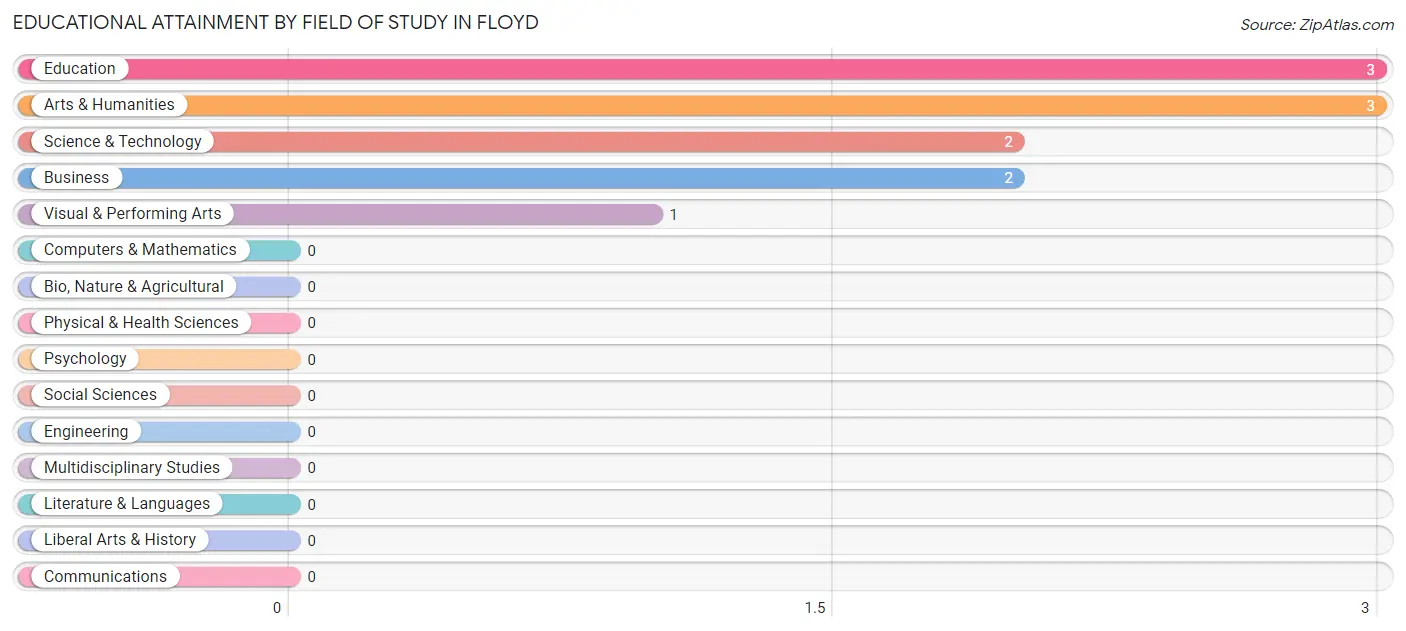
| Field of Study | # Graduates | % Graduates |
| Computers & Mathematics | 0 | 0.0% |
| Bio, Nature & Agricultural | 0 | 0.0% |
| Physical & Health Sciences | 0 | 0.0% |
| Psychology | 0 | 0.0% |
| Social Sciences | 0 | 0.0% |
| Engineering | 0 | 0.0% |
| Multidisciplinary Studies | 0 | 0.0% |
| Science & Technology | 2 | 18.2% |
| Business | 2 | 18.2% |
| Education | 3 | 27.3% |
| Literature & Languages | 0 | 0.0% |
| Liberal Arts & History | 0 | 0.0% |
| Visual & Performing Arts | 1 | 9.1% |
| Communications | 0 | 0.0% |
| Arts & Humanities | 3 | 27.3% |
| Total | 11 | 100.0% |
Transportation & Commute in Floyd
Vehicle Availability by Sex in Floyd
The most prevalent vehicle ownership categories in Floyd are males with 2 vehicles (15, accounting for 55.6%) and females with 2 vehicles (2, making up 100.0%).
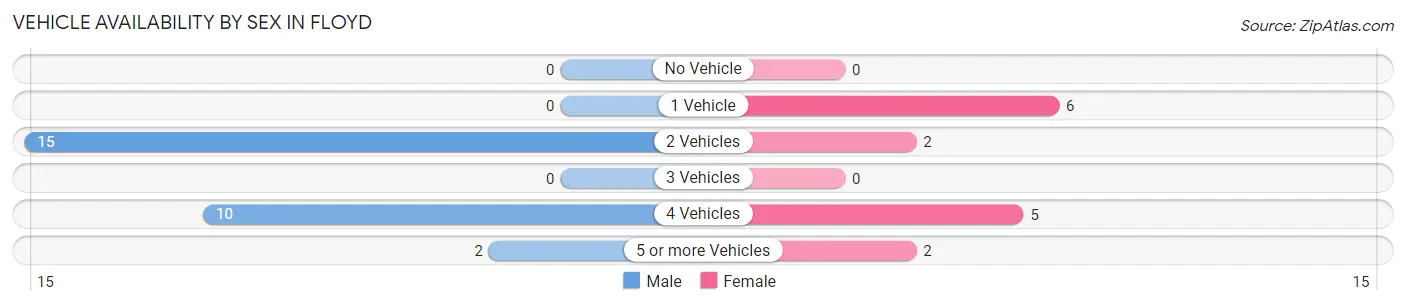
| Vehicles Available | Male | Female |
| No Vehicle | 0 (0.0%) | 0 (0.0%) |
| 1 Vehicle | 0 (0.0%) | 6 (40.0%) |
| 2 Vehicles | 15 (55.6%) | 2 (13.3%) |
| 3 Vehicles | 0 (0.0%) | 0 (0.0%) |
| 4 Vehicles | 10 (37.0%) | 5 (33.3%) |
| 5 or more Vehicles | 2 (7.4%) | 2 (13.3%) |
| Total | 27 (100.0%) | 15 (100.0%) |
Commute Time in Floyd
The most frequently occuring commute durations in Floyd are less than 5 minutes (14 commuters, 34.2%), 60 to 89 minutes (11 commuters, 26.8%), and 5 to 9 minutes (6 commuters, 14.6%).
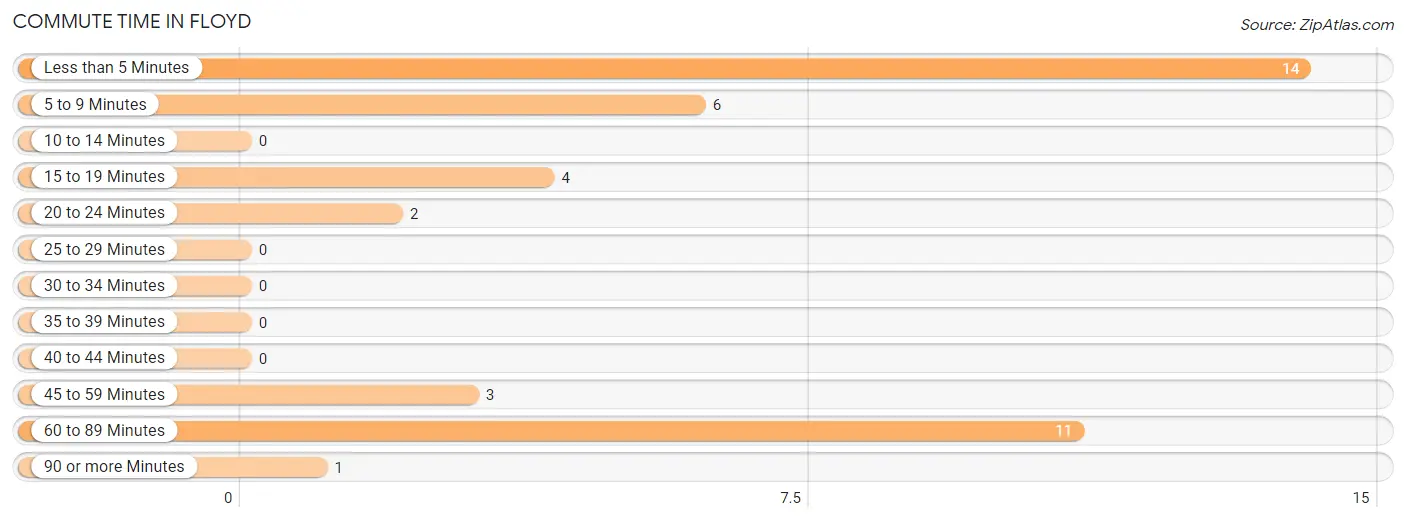
| Commute Time | # Commuters | % Commuters |
| Less than 5 Minutes | 14 | 34.2% |
| 5 to 9 Minutes | 6 | 14.6% |
| 10 to 14 Minutes | 0 | 0.0% |
| 15 to 19 Minutes | 4 | 9.8% |
| 20 to 24 Minutes | 2 | 4.9% |
| 25 to 29 Minutes | 0 | 0.0% |
| 30 to 34 Minutes | 0 | 0.0% |
| 35 to 39 Minutes | 0 | 0.0% |
| 40 to 44 Minutes | 0 | 0.0% |
| 45 to 59 Minutes | 3 | 7.3% |
| 60 to 89 Minutes | 11 | 26.8% |
| 90 or more Minutes | 1 | 2.4% |
Commute Time by Sex in Floyd
The most common commute times in Floyd are less than 5 minutes (12 commuters, 44.4%) for males and 5 to 9 minutes (4 commuters, 28.6%) for females.
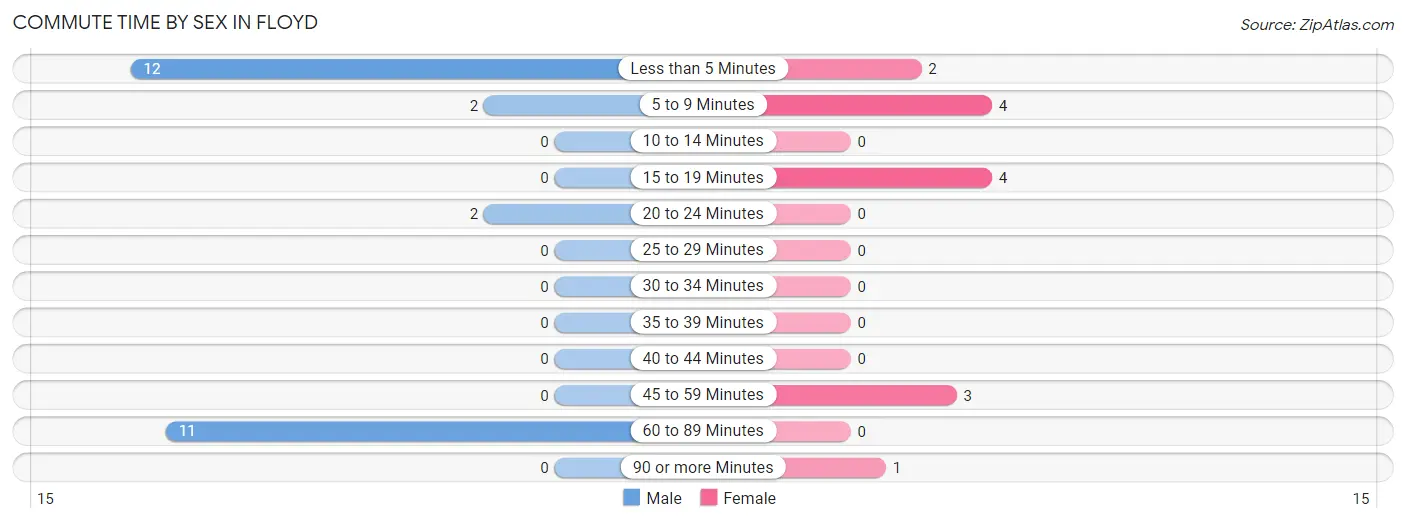
| Commute Time | Male | Female |
| Less than 5 Minutes | 12 (44.4%) | 2 (14.3%) |
| 5 to 9 Minutes | 2 (7.4%) | 4 (28.6%) |
| 10 to 14 Minutes | 0 (0.0%) | 0 (0.0%) |
| 15 to 19 Minutes | 0 (0.0%) | 4 (28.6%) |
| 20 to 24 Minutes | 2 (7.4%) | 0 (0.0%) |
| 25 to 29 Minutes | 0 (0.0%) | 0 (0.0%) |
| 30 to 34 Minutes | 0 (0.0%) | 0 (0.0%) |
| 35 to 39 Minutes | 0 (0.0%) | 0 (0.0%) |
| 40 to 44 Minutes | 0 (0.0%) | 0 (0.0%) |
| 45 to 59 Minutes | 0 (0.0%) | 3 (21.4%) |
| 60 to 89 Minutes | 11 (40.7%) | 0 (0.0%) |
| 90 or more Minutes | 0 (0.0%) | 1 (7.1%) |
Time of Departure to Work by Sex in Floyd
The most frequent times of departure to work in Floyd are 8:00 AM to 8:29 AM (15, 55.6%) for males and 7:30 AM to 7:59 AM (5, 35.7%) for females.
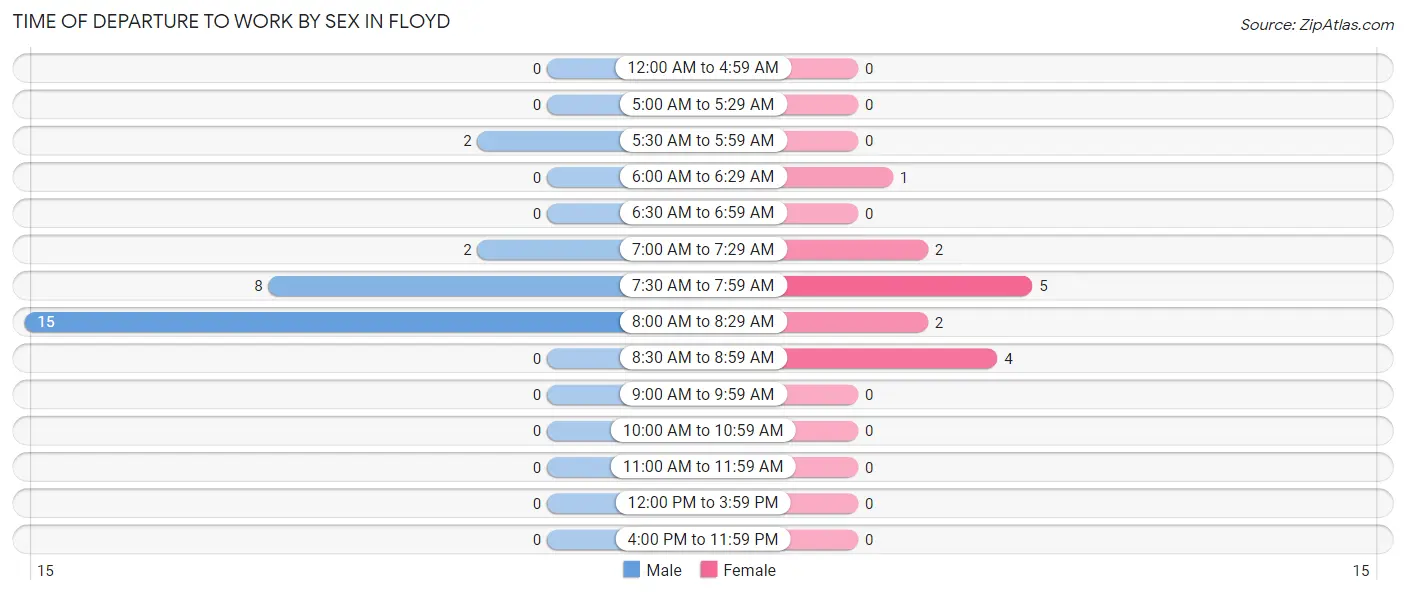
| Time of Departure | Male | Female |
| 12:00 AM to 4:59 AM | 0 (0.0%) | 0 (0.0%) |
| 5:00 AM to 5:29 AM | 0 (0.0%) | 0 (0.0%) |
| 5:30 AM to 5:59 AM | 2 (7.4%) | 0 (0.0%) |
| 6:00 AM to 6:29 AM | 0 (0.0%) | 1 (7.1%) |
| 6:30 AM to 6:59 AM | 0 (0.0%) | 0 (0.0%) |
| 7:00 AM to 7:29 AM | 2 (7.4%) | 2 (14.3%) |
| 7:30 AM to 7:59 AM | 8 (29.6%) | 5 (35.7%) |
| 8:00 AM to 8:29 AM | 15 (55.6%) | 2 (14.3%) |
| 8:30 AM to 8:59 AM | 0 (0.0%) | 4 (28.6%) |
| 9:00 AM to 9:59 AM | 0 (0.0%) | 0 (0.0%) |
| 10:00 AM to 10:59 AM | 0 (0.0%) | 0 (0.0%) |
| 11:00 AM to 11:59 AM | 0 (0.0%) | 0 (0.0%) |
| 12:00 PM to 3:59 PM | 0 (0.0%) | 0 (0.0%) |
| 4:00 PM to 11:59 PM | 0 (0.0%) | 0 (0.0%) |
| Total | 27 (100.0%) | 14 (100.0%) |
Housing Occupancy in Floyd
Occupancy by Ownership in Floyd
Of the total 31 dwellings in Floyd, owner-occupied units account for 29 (93.5%), while renter-occupied units make up 2 (6.5%).
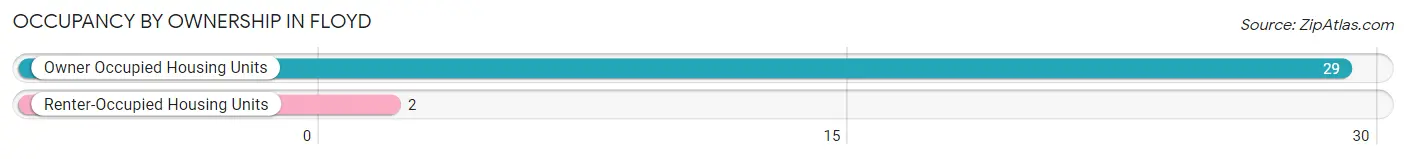
| Occupancy | # Housing Units | % Housing Units |
| Owner Occupied Housing Units | 29 | 93.5% |
| Renter-Occupied Housing Units | 2 | 6.5% |
| Total Occupied Housing Units | 31 | 100.0% |
Occupancy by Household Size in Floyd
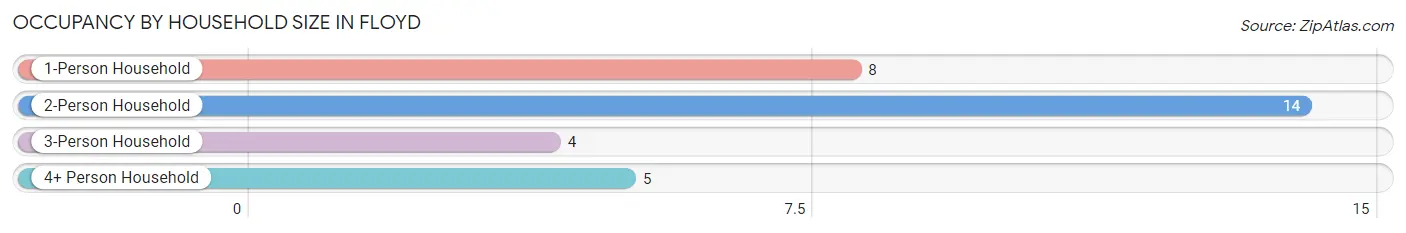
| Household Size | # Housing Units | % Housing Units |
| 1-Person Household | 8 | 25.8% |
| 2-Person Household | 14 | 45.2% |
| 3-Person Household | 4 | 12.9% |
| 4+ Person Household | 5 | 16.1% |
| Total Housing Units | 31 | 100.0% |
Occupancy by Ownership by Household Size in Floyd
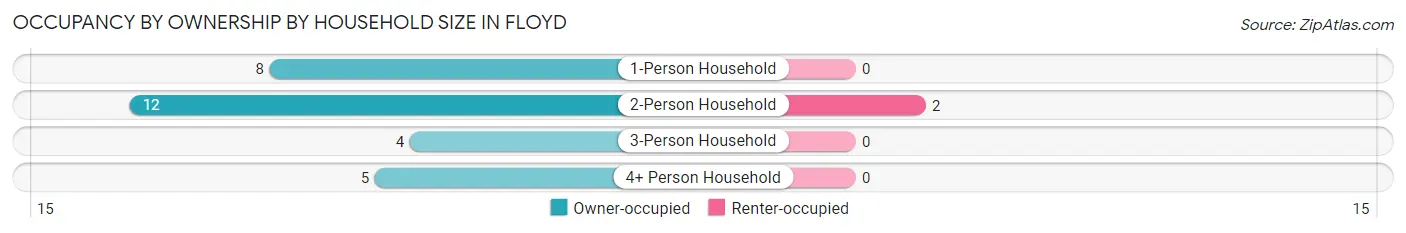
| Household Size | Owner-occupied | Renter-occupied |
| 1-Person Household | 8 (100.0%) | 0 (0.0%) |
| 2-Person Household | 12 (85.7%) | 2 (14.3%) |
| 3-Person Household | 4 (100.0%) | 0 (0.0%) |
| 4+ Person Household | 5 (100.0%) | 0 (0.0%) |
| Total Housing Units | 29 (93.5%) | 2 (6.5%) |
Occupancy by Educational Attainment in Floyd
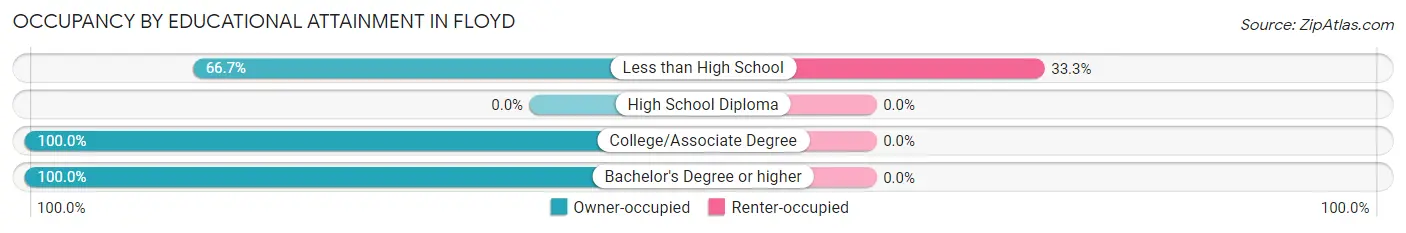
| Household Size | Owner-occupied | Renter-occupied |
| Less than High School | 4 (66.7%) | 2 (33.3%) |
| High School Diploma | 0 (0.0%) | 0 (0.0%) |
| College/Associate Degree | 18 (100.0%) | 0 (0.0%) |
| Bachelor's Degree or higher | 7 (100.0%) | 0 (0.0%) |
Occupancy by Age of Householder in Floyd
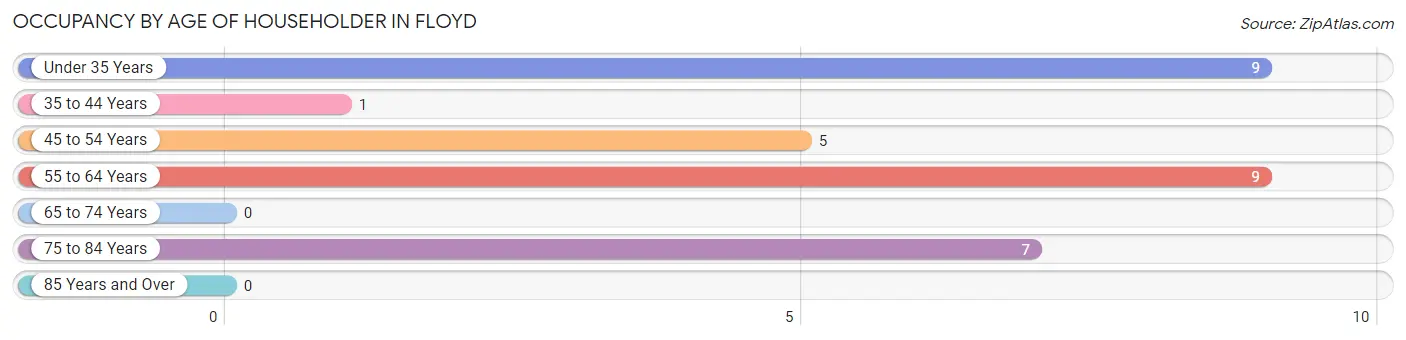
| Age Bracket | # Households | % Households |
| Under 35 Years | 9 | 29.0% |
| 35 to 44 Years | 1 | 3.2% |
| 45 to 54 Years | 5 | 16.1% |
| 55 to 64 Years | 9 | 29.0% |
| 65 to 74 Years | 0 | 0.0% |
| 75 to 84 Years | 7 | 22.6% |
| 85 Years and Over | 0 | 0.0% |
| Total | 31 | 100.0% |
Housing Finances in Floyd
Median Income by Occupancy in Floyd
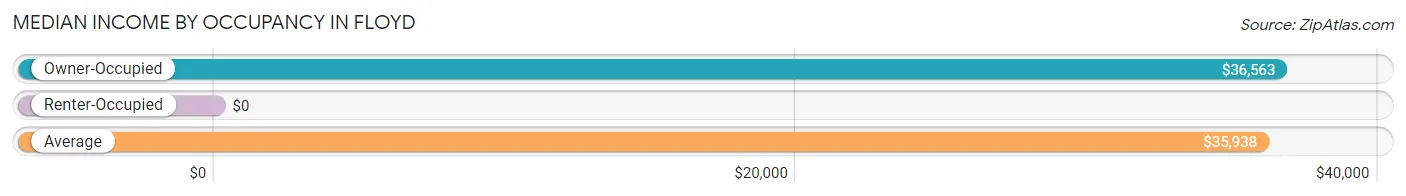
| Occupancy Type | # Households | Median Income |
| Owner-Occupied | 29 (93.5%) | $36,563 |
| Renter-Occupied | 2 (6.5%) | $0 |
| Average | 31 (100.0%) | $35,938 |
Occupancy by Householder Income Bracket in Floyd
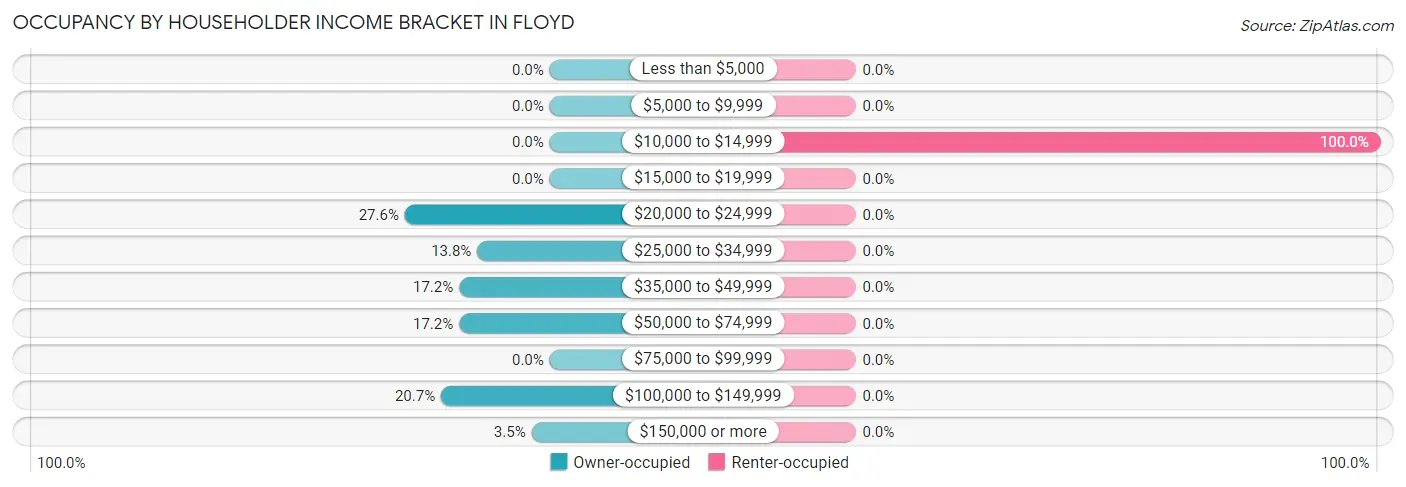
| Income Bracket | Owner-occupied | Renter-occupied |
| Less than $5,000 | 0 (0.0%) | 0 (0.0%) |
| $5,000 to $9,999 | 0 (0.0%) | 0 (0.0%) |
| $10,000 to $14,999 | 0 (0.0%) | 2 (100.0%) |
| $15,000 to $19,999 | 0 (0.0%) | 0 (0.0%) |
| $20,000 to $24,999 | 8 (27.6%) | 0 (0.0%) |
| $25,000 to $34,999 | 4 (13.8%) | 0 (0.0%) |
| $35,000 to $49,999 | 5 (17.2%) | 0 (0.0%) |
| $50,000 to $74,999 | 5 (17.2%) | 0 (0.0%) |
| $75,000 to $99,999 | 0 (0.0%) | 0 (0.0%) |
| $100,000 to $149,999 | 6 (20.7%) | 0 (0.0%) |
| $150,000 or more | 1 (3.5%) | 0 (0.0%) |
| Total | 29 (100.0%) | 2 (100.0%) |
Monthly Housing Cost Tiers in Floyd
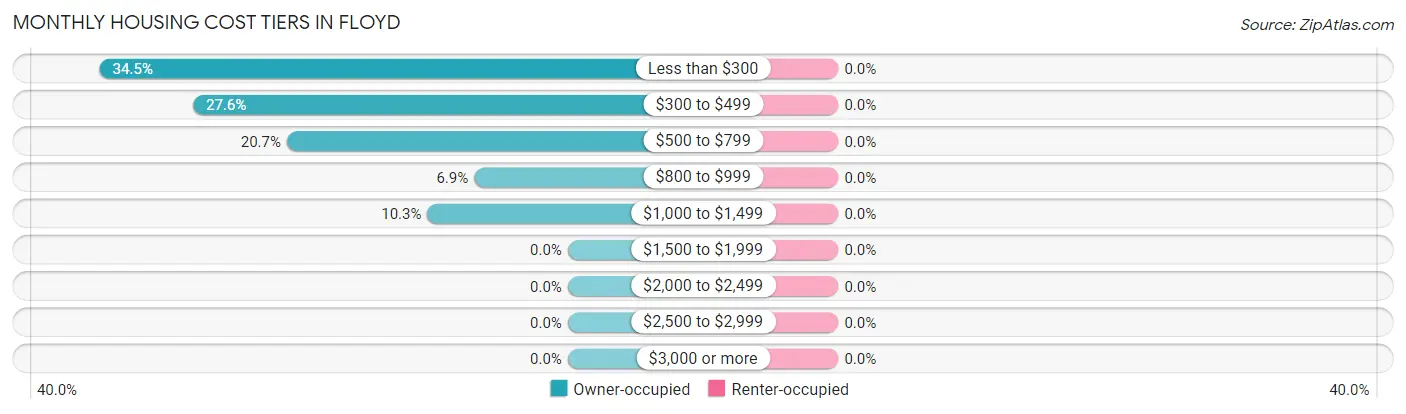
| Monthly Cost | Owner-occupied | Renter-occupied |
| Less than $300 | 10 (34.5%) | 0 (0.0%) |
| $300 to $499 | 8 (27.6%) | 0 (0.0%) |
| $500 to $799 | 6 (20.7%) | 0 (0.0%) |
| $800 to $999 | 2 (6.9%) | 0 (0.0%) |
| $1,000 to $1,499 | 3 (10.3%) | 0 (0.0%) |
| $1,500 to $1,999 | 0 (0.0%) | 0 (0.0%) |
| $2,000 to $2,499 | 0 (0.0%) | 0 (0.0%) |
| $2,500 to $2,999 | 0 (0.0%) | 0 (0.0%) |
| $3,000 or more | 0 (0.0%) | 0 (0.0%) |
| Total | 29 (100.0%) | 2 (100.0%) |
Physical Housing Characteristics in Floyd
Housing Structures in Floyd
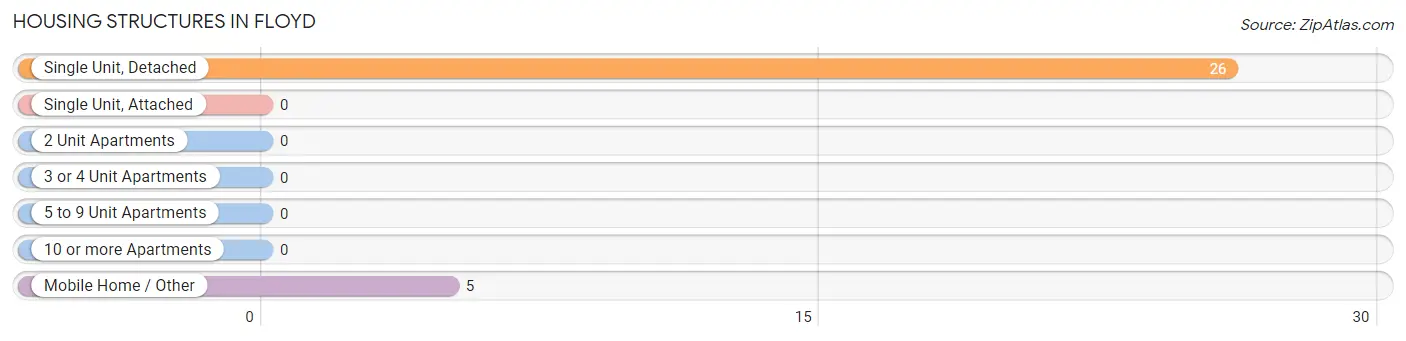
| Structure Type | # Housing Units | % Housing Units |
| Single Unit, Detached | 26 | 83.9% |
| Single Unit, Attached | 0 | 0.0% |
| 2 Unit Apartments | 0 | 0.0% |
| 3 or 4 Unit Apartments | 0 | 0.0% |
| 5 to 9 Unit Apartments | 0 | 0.0% |
| 10 or more Apartments | 0 | 0.0% |
| Mobile Home / Other | 5 | 16.1% |
| Total | 31 | 100.0% |
Housing Structures by Occupancy in Floyd
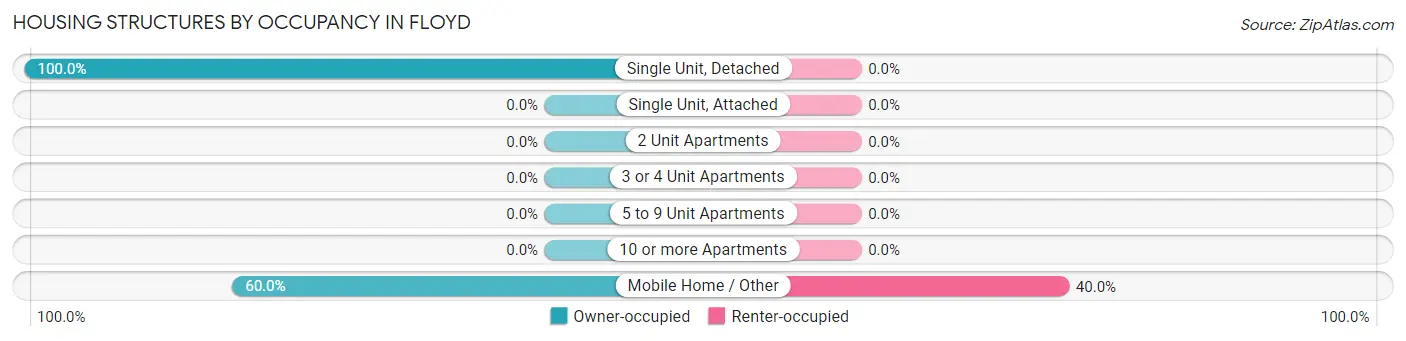
| Structure Type | Owner-occupied | Renter-occupied |
| Single Unit, Detached | 26 (100.0%) | 0 (0.0%) |
| Single Unit, Attached | 0 (0.0%) | 0 (0.0%) |
| 2 Unit Apartments | 0 (0.0%) | 0 (0.0%) |
| 3 or 4 Unit Apartments | 0 (0.0%) | 0 (0.0%) |
| 5 to 9 Unit Apartments | 0 (0.0%) | 0 (0.0%) |
| 10 or more Apartments | 0 (0.0%) | 0 (0.0%) |
| Mobile Home / Other | 3 (60.0%) | 2 (40.0%) |
| Total | 29 (93.5%) | 2 (6.5%) |
Housing Structures by Number of Rooms in Floyd
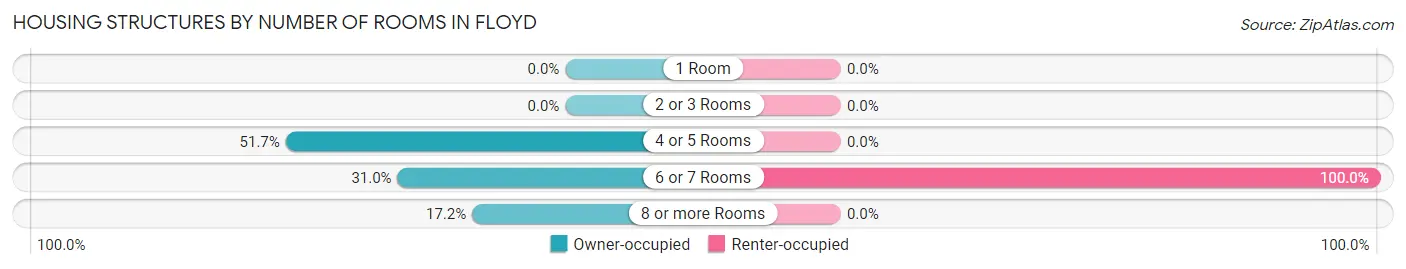
| Number of Rooms | Owner-occupied | Renter-occupied |
| 1 Room | 0 (0.0%) | 0 (0.0%) |
| 2 or 3 Rooms | 0 (0.0%) | 0 (0.0%) |
| 4 or 5 Rooms | 15 (51.7%) | 0 (0.0%) |
| 6 or 7 Rooms | 9 (31.0%) | 2 (100.0%) |
| 8 or more Rooms | 5 (17.2%) | 0 (0.0%) |
| Total | 29 (100.0%) | 2 (100.0%) |
Housing Structure by Heating Type in Floyd
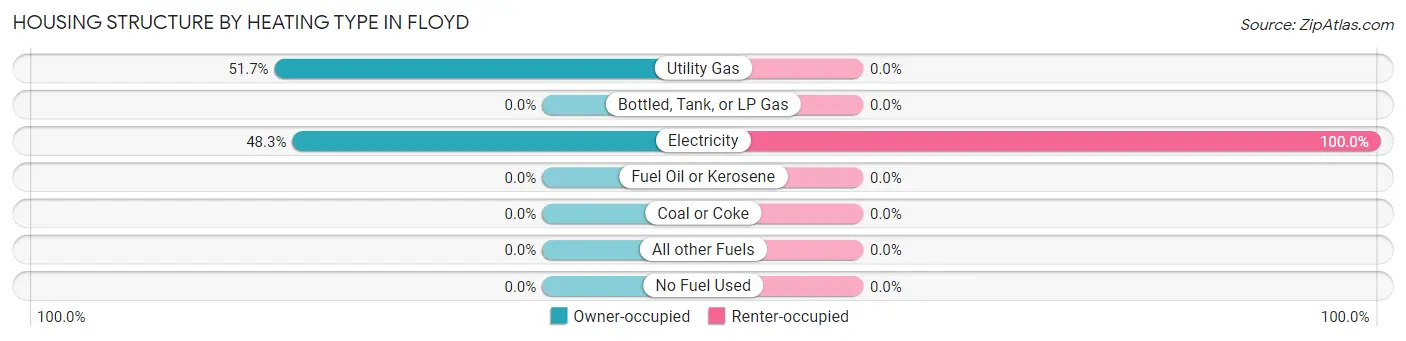
| Heating Type | Owner-occupied | Renter-occupied |
| Utility Gas | 15 (51.7%) | 0 (0.0%) |
| Bottled, Tank, or LP Gas | 0 (0.0%) | 0 (0.0%) |
| Electricity | 14 (48.3%) | 2 (100.0%) |
| Fuel Oil or Kerosene | 0 (0.0%) | 0 (0.0%) |
| Coal or Coke | 0 (0.0%) | 0 (0.0%) |
| All other Fuels | 0 (0.0%) | 0 (0.0%) |
| No Fuel Used | 0 (0.0%) | 0 (0.0%) |
| Total | 29 (100.0%) | 2 (100.0%) |
Household Vehicle Usage in Floyd
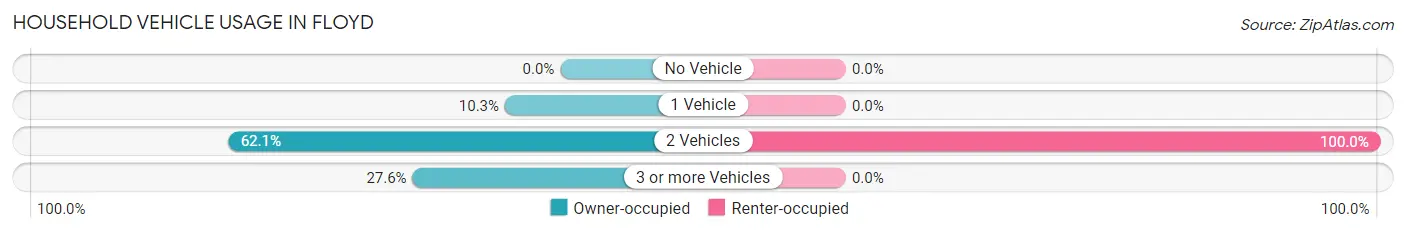
| Vehicles per Household | Owner-occupied | Renter-occupied |
| No Vehicle | 0 (0.0%) | 0 (0.0%) |
| 1 Vehicle | 3 (10.3%) | 0 (0.0%) |
| 2 Vehicles | 18 (62.1%) | 2 (100.0%) |
| 3 or more Vehicles | 8 (27.6%) | 0 (0.0%) |
| Total | 29 (100.0%) | 2 (100.0%) |
Real Estate & Mortgages in Floyd
Real Estate and Mortgage Overview in Floyd
| Characteristic | Without Mortgage | With Mortgage |
| Housing Units | 21 | 8 |
| Median Property Value | - | - |
| Median Household Income | $33,125 | $1 |
| Monthly Housing Costs | - | - |
| Real Estate Taxes | $550 | $0 |
Property Value by Mortgage Status in Floyd
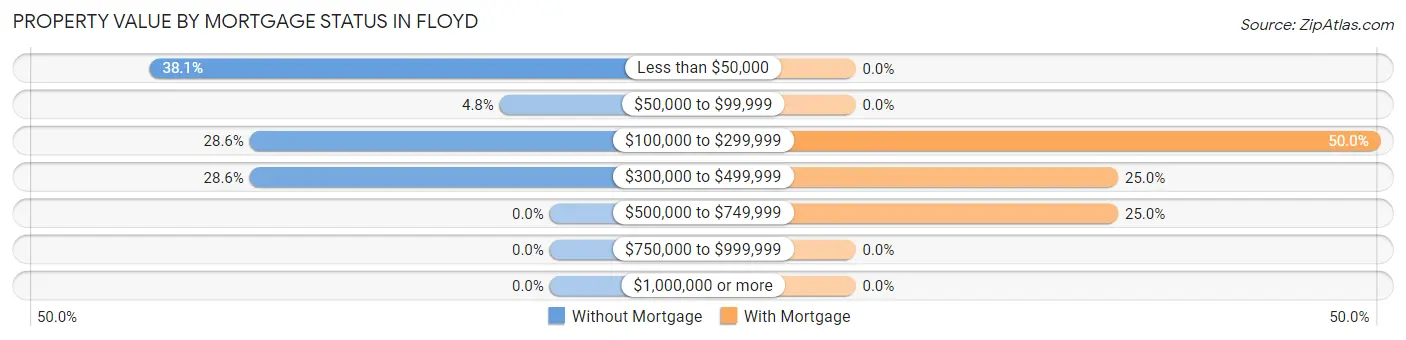
| Property Value | Without Mortgage | With Mortgage |
| Less than $50,000 | 8 (38.1%) | 0 (0.0%) |
| $50,000 to $99,999 | 1 (4.8%) | 0 (0.0%) |
| $100,000 to $299,999 | 6 (28.6%) | 4 (50.0%) |
| $300,000 to $499,999 | 6 (28.6%) | 2 (25.0%) |
| $500,000 to $749,999 | 0 (0.0%) | 2 (25.0%) |
| $750,000 to $999,999 | 0 (0.0%) | 0 (0.0%) |
| $1,000,000 or more | 0 (0.0%) | 0 (0.0%) |
| Total | 21 (100.0%) | 8 (100.0%) |
Household Income by Mortgage Status in Floyd
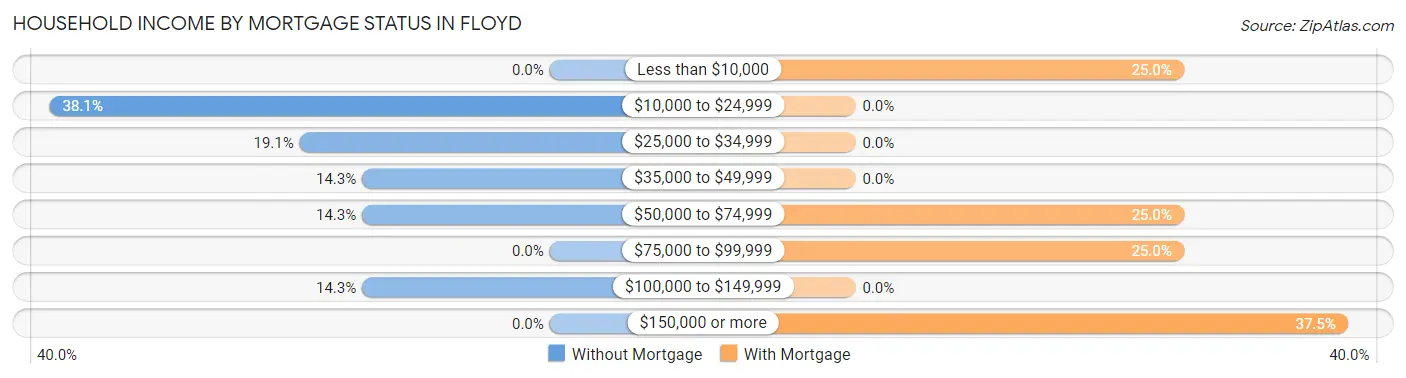
| Household Income | Without Mortgage | With Mortgage |
| Less than $10,000 | 0 (0.0%) | 2 (25.0%) |
| $10,000 to $24,999 | 8 (38.1%) | 0 (0.0%) |
| $25,000 to $34,999 | 4 (19.1%) | 0 (0.0%) |
| $35,000 to $49,999 | 3 (14.3%) | 0 (0.0%) |
| $50,000 to $74,999 | 3 (14.3%) | 2 (25.0%) |
| $75,000 to $99,999 | 0 (0.0%) | 2 (25.0%) |
| $100,000 to $149,999 | 3 (14.3%) | 0 (0.0%) |
| $150,000 or more | 0 (0.0%) | 3 (37.5%) |
| Total | 21 (100.0%) | 8 (100.0%) |
Property Value to Household Income Ratio in Floyd
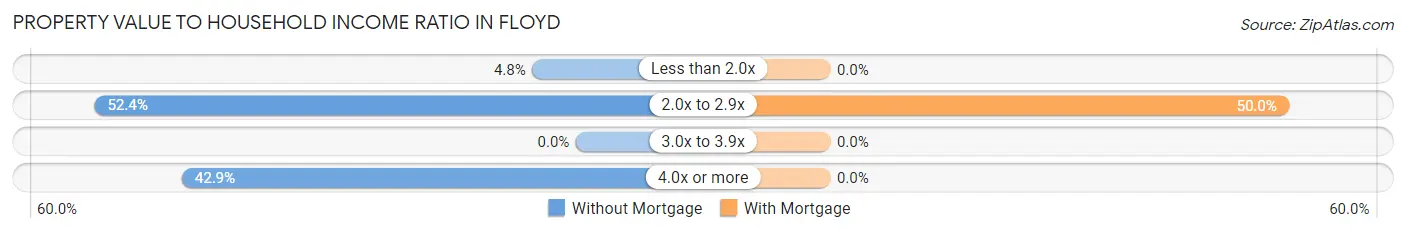
| Value-to-Income Ratio | Without Mortgage | With Mortgage |
| Less than 2.0x | 1 (4.8%) | 0 (0.0%) |
| 2.0x to 2.9x | 11 (52.4%) | 4 (50.0%) |
| 3.0x to 3.9x | 0 (0.0%) | 0 (0.0%) |
| 4.0x or more | 9 (42.9%) | 0 (0.0%) |
| Total | 21 (100.0%) | 8 (100.0%) |
Real Estate Taxes by Mortgage Status in Floyd
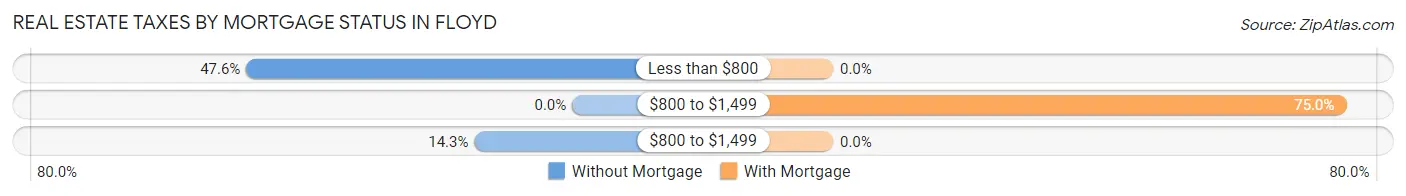
| Property Taxes | Without Mortgage | With Mortgage |
| Less than $800 | 10 (47.6%) | 0 (0.0%) |
| $800 to $1,499 | 0 (0.0%) | 6 (75.0%) |
| $800 to $1,499 | 3 (14.3%) | 0 (0.0%) |
| Total | 21 (100.0%) | 8 (100.0%) |
Health & Disability in Floyd
Health Insurance Coverage by Age in Floyd
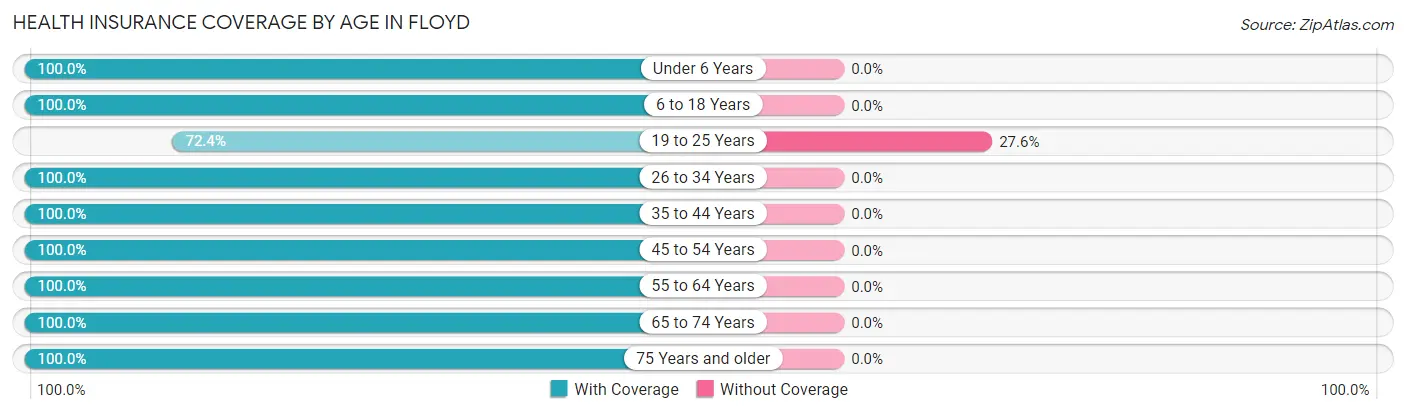
| Age Bracket | With Coverage | Without Coverage |
| Under 6 Years | 1 (100.0%) | 0 (0.0%) |
| 6 to 18 Years | 16 (100.0%) | 0 (0.0%) |
| 19 to 25 Years | 21 (72.4%) | 8 (27.6%) |
| 26 to 34 Years | 3 (100.0%) | 0 (0.0%) |
| 35 to 44 Years | 3 (100.0%) | 0 (0.0%) |
| 45 to 54 Years | 7 (100.0%) | 0 (0.0%) |
| 55 to 64 Years | 16 (100.0%) | 0 (0.0%) |
| 65 to 74 Years | 1 (100.0%) | 0 (0.0%) |
| 75 Years and older | 11 (100.0%) | 0 (0.0%) |
| Total | 79 (90.8%) | 8 (9.2%) |
Health Insurance Coverage by Citizenship Status in Floyd
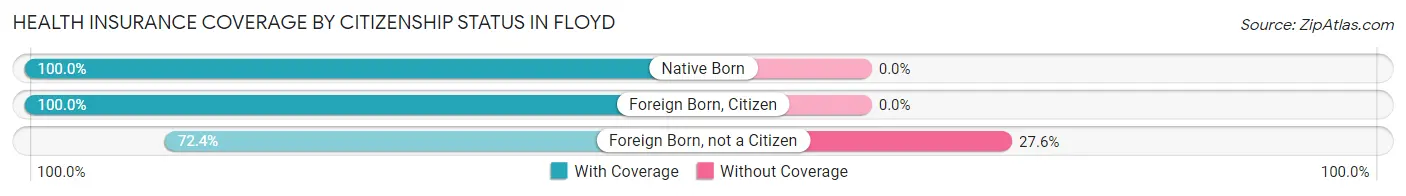
| Citizenship Status | With Coverage | Without Coverage |
| Native Born | 1 (100.0%) | 0 (0.0%) |
| Foreign Born, Citizen | 16 (100.0%) | 0 (0.0%) |
| Foreign Born, not a Citizen | 21 (72.4%) | 8 (27.6%) |
Health Insurance Coverage by Household Income in Floyd
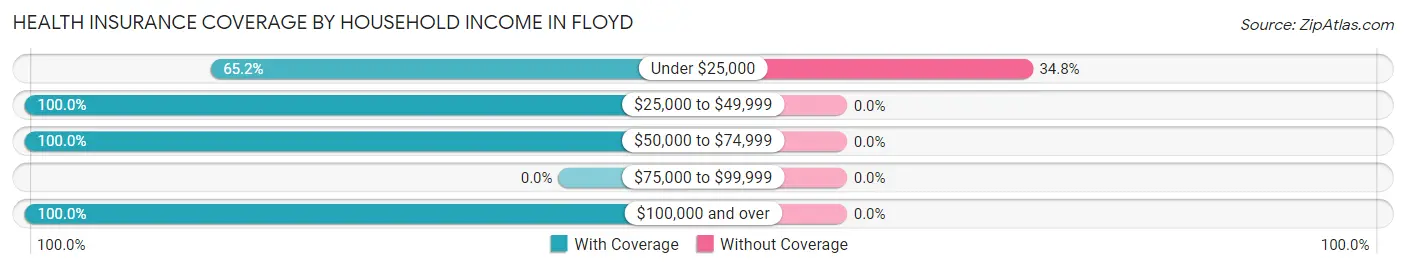
| Household Income | With Coverage | Without Coverage |
| Under $25,000 | 15 (65.2%) | 8 (34.8%) |
| $25,000 to $49,999 | 16 (100.0%) | 0 (0.0%) |
| $50,000 to $74,999 | 17 (100.0%) | 0 (0.0%) |
| $75,000 to $99,999 | 0 (0.0%) | 0 (0.0%) |
| $100,000 and over | 31 (100.0%) | 0 (0.0%) |
Public vs Private Health Insurance Coverage by Age in Floyd
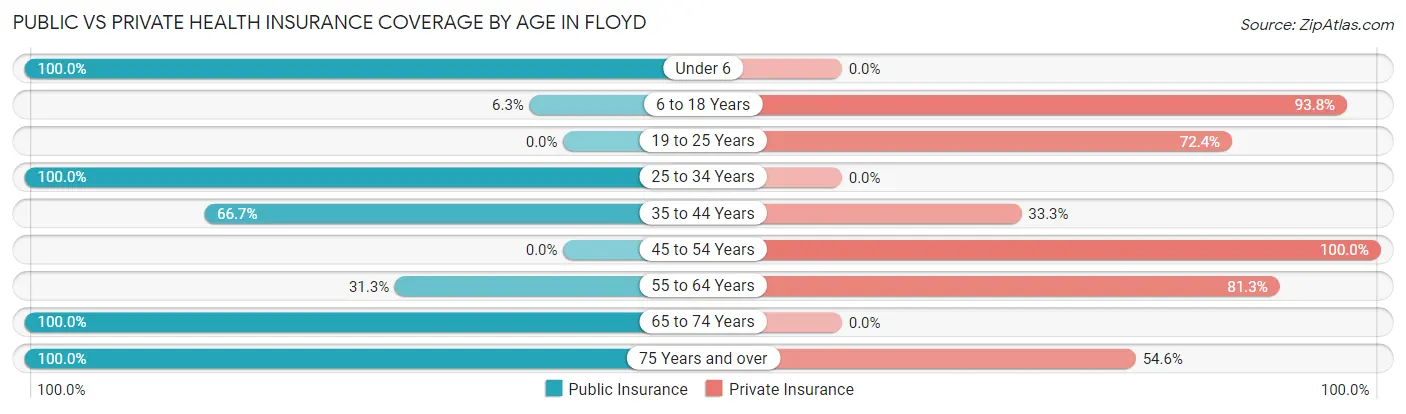
| Age Bracket | Public Insurance | Private Insurance |
| Under 6 | 1 (100.0%) | 0 (0.0%) |
| 6 to 18 Years | 1 (6.2%) | 15 (93.8%) |
| 19 to 25 Years | 0 (0.0%) | 21 (72.4%) |
| 25 to 34 Years | 3 (100.0%) | 0 (0.0%) |
| 35 to 44 Years | 2 (66.7%) | 1 (33.3%) |
| 45 to 54 Years | 0 (0.0%) | 7 (100.0%) |
| 55 to 64 Years | 5 (31.2%) | 13 (81.2%) |
| 65 to 74 Years | 1 (100.0%) | 0 (0.0%) |
| 75 Years and over | 11 (100.0%) | 6 (54.5%) |
| Total | 24 (27.6%) | 63 (72.4%) |
Disability Status by Sex by Age in Floyd
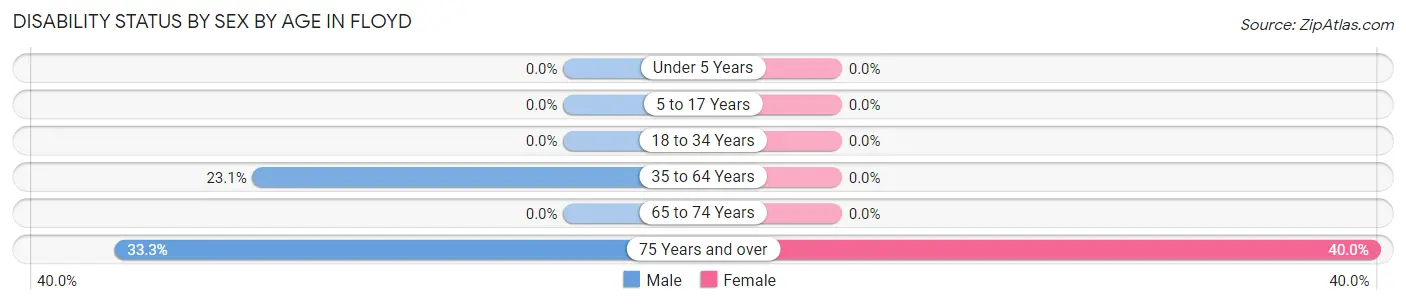
| Age Bracket | Male | Female |
| Under 5 Years | 0 (0.0%) | 0 (0.0%) |
| 5 to 17 Years | 0 (0.0%) | 0 (0.0%) |
| 18 to 34 Years | 0 (0.0%) | 0 (0.0%) |
| 35 to 64 Years | 3 (23.1%) | 0 (0.0%) |
| 65 to 74 Years | 0 (0.0%) | 0 (0.0%) |
| 75 Years and over | 2 (33.3%) | 2 (40.0%) |
Disability Class by Sex by Age in Floyd
Disability Class: Hearing Difficulty
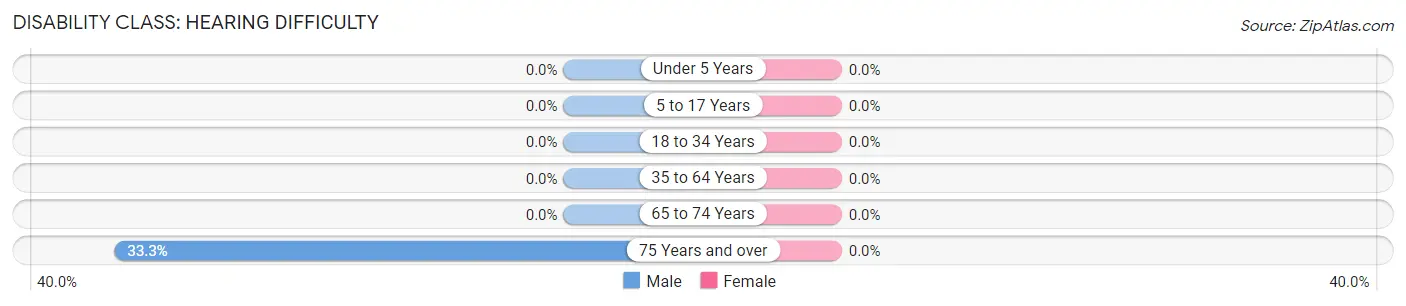
| Age Bracket | Male | Female |
| Under 5 Years | 0 (0.0%) | 0 (0.0%) |
| 5 to 17 Years | 0 (0.0%) | 0 (0.0%) |
| 18 to 34 Years | 0 (0.0%) | 0 (0.0%) |
| 35 to 64 Years | 0 (0.0%) | 0 (0.0%) |
| 65 to 74 Years | 0 (0.0%) | 0 (0.0%) |
| 75 Years and over | 2 (33.3%) | 0 (0.0%) |
Disability Class: Vision Difficulty
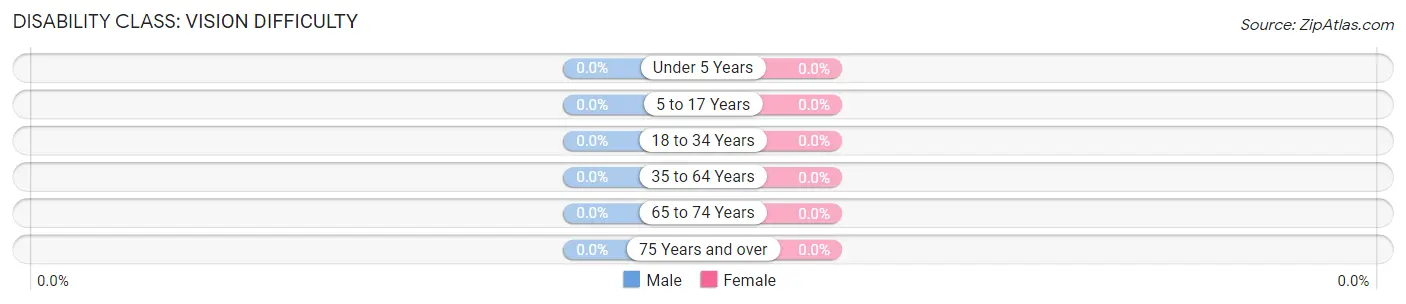
| Age Bracket | Male | Female |
| Under 5 Years | 0 (0.0%) | 0 (0.0%) |
| 5 to 17 Years | 0 (0.0%) | 0 (0.0%) |
| 18 to 34 Years | 0 (0.0%) | 0 (0.0%) |
| 35 to 64 Years | 0 (0.0%) | 0 (0.0%) |
| 65 to 74 Years | 0 (0.0%) | 0 (0.0%) |
| 75 Years and over | 0 (0.0%) | 0 (0.0%) |
Disability Class: Cognitive Difficulty
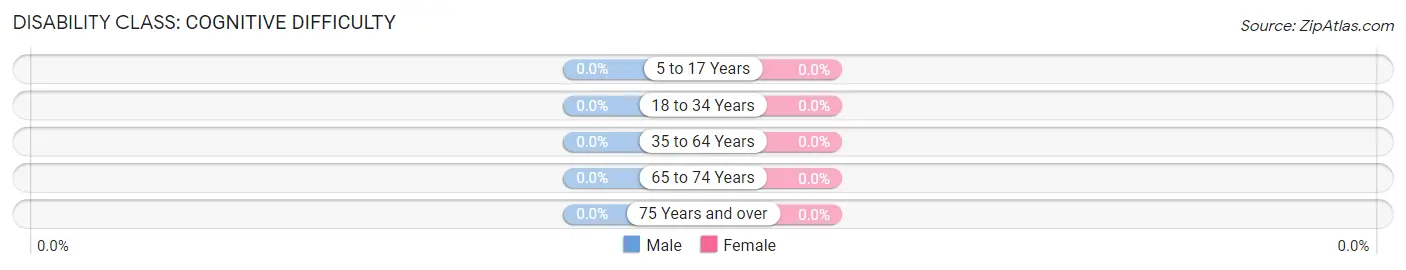
| Age Bracket | Male | Female |
| 5 to 17 Years | 0 (0.0%) | 0 (0.0%) |
| 18 to 34 Years | 0 (0.0%) | 0 (0.0%) |
| 35 to 64 Years | 0 (0.0%) | 0 (0.0%) |
| 65 to 74 Years | 0 (0.0%) | 0 (0.0%) |
| 75 Years and over | 0 (0.0%) | 0 (0.0%) |
Disability Class: Ambulatory Difficulty
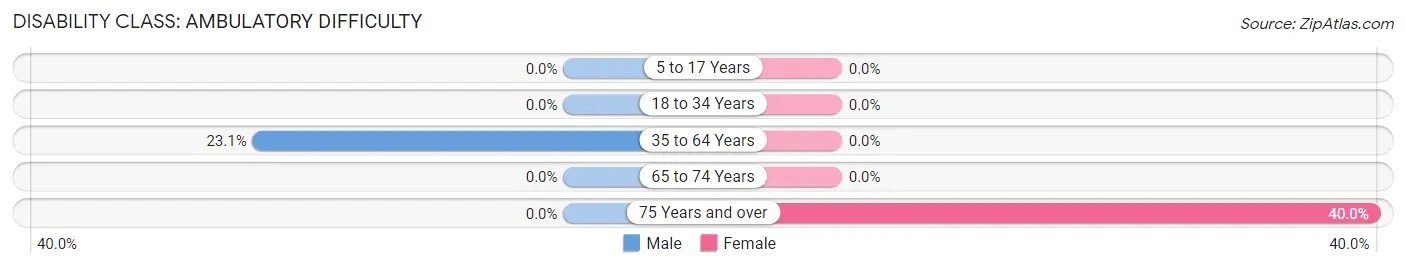
| Age Bracket | Male | Female |
| 5 to 17 Years | 0 (0.0%) | 0 (0.0%) |
| 18 to 34 Years | 0 (0.0%) | 0 (0.0%) |
| 35 to 64 Years | 3 (23.1%) | 0 (0.0%) |
| 65 to 74 Years | 0 (0.0%) | 0 (0.0%) |
| 75 Years and over | 0 (0.0%) | 2 (40.0%) |
Disability Class: Self-Care Difficulty
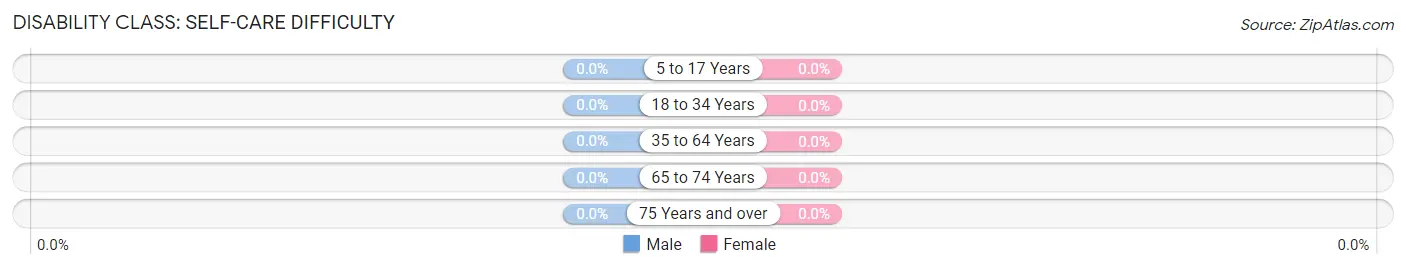
| Age Bracket | Male | Female |
| 5 to 17 Years | 0 (0.0%) | 0 (0.0%) |
| 18 to 34 Years | 0 (0.0%) | 0 (0.0%) |
| 35 to 64 Years | 0 (0.0%) | 0 (0.0%) |
| 65 to 74 Years | 0 (0.0%) | 0 (0.0%) |
| 75 Years and over | 0 (0.0%) | 0 (0.0%) |
Technology Access in Floyd
Computing Device Access in Floyd
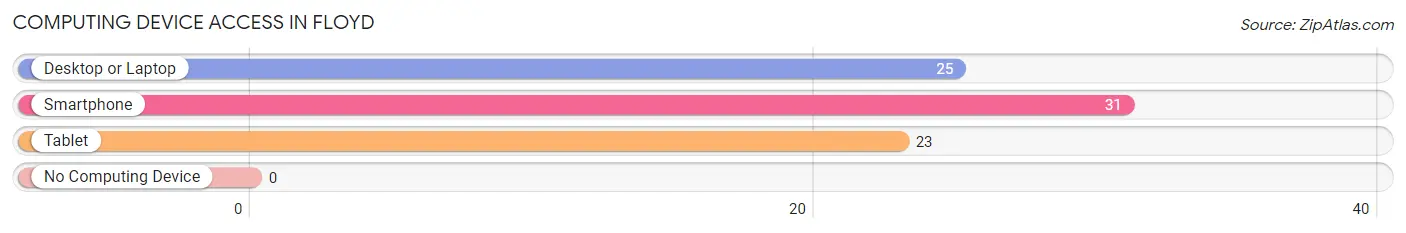
| Device Type | # Households | % Households |
| Desktop or Laptop | 25 | 80.6% |
| Smartphone | 31 | 100.0% |
| Tablet | 23 | 74.2% |
| No Computing Device | 0 | 0.0% |
| Total | 31 | 100.0% |
Internet Access in Floyd
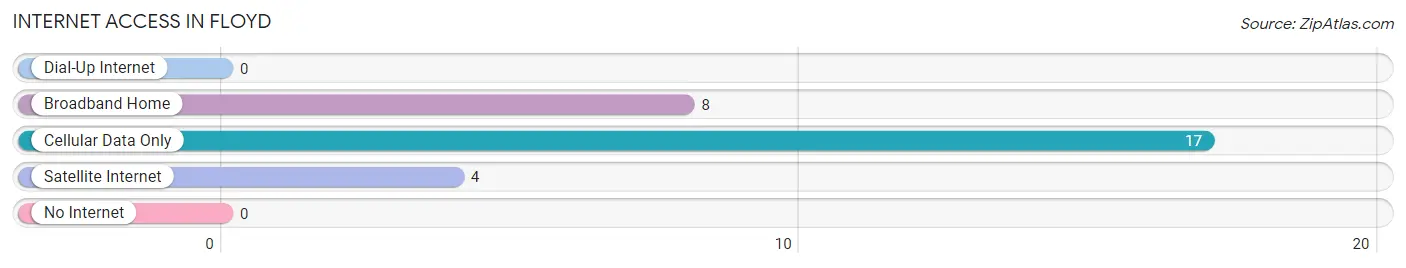
| Internet Type | # Households | % Households |
| Dial-Up Internet | 0 | 0.0% |
| Broadband Home | 8 | 25.8% |
| Cellular Data Only | 17 | 54.8% |
| Satellite Internet | 4 | 12.9% |
| No Internet | 0 | 0.0% |
| Total | 31 | 100.0% |
Floyd Summary
Floyd is a small unincorporated community located in the northeastern corner of New Mexico, in the county of Roosevelt. It is situated in the foothills of the Sangre de Cristo Mountains, approximately 25 miles east of the city of Tucumcari. The town is home to a population of approximately 500 people, and is known for its rural charm and friendly atmosphere.
History
The area that is now Floyd was first settled in the late 1800s by ranchers and farmers. The town was officially established in 1901, when the post office was established. The town was named after the first postmaster, Floyd B. Smith.
In the early 1900s, Floyd was a thriving agricultural community, with a variety of crops being grown in the area. The town also had a number of businesses, including a general store, a blacksmith shop, and a hotel.
In the 1920s, the town began to decline as the railroad bypassed it. This caused many of the businesses to close, and the population began to dwindle.
In the 1950s, the town began to experience a resurgence, as the nearby Tucumcari Air Force Base was established. This brought a number of new jobs to the area, and the population began to grow again.
Geography
Floyd is located in the northeastern corner of New Mexico, in the county of Roosevelt. It is situated in the foothills of the Sangre de Cristo Mountains, approximately 25 miles east of the city of Tucumcari. The town is located at an elevation of 4,400 feet, and has a total area of 0.6 square miles.
The climate in Floyd is semi-arid, with hot summers and cold winters. The average annual temperature is around 60 degrees Fahrenheit, and the average annual precipitation is around 12 inches.
Economy
The economy of Floyd is largely based on agriculture and tourism. The town is home to a number of farms, which produce a variety of crops, including alfalfa, corn, wheat, and hay.
The town is also home to a number of tourist attractions, including the nearby Tucumcari Air Force Base, the nearby Capulin Volcano National Monument, and the nearby Ute Lake State Park.
Demographics
As of the 2010 census, the population of Floyd was 498. The racial makeup of the town was 94.4% White, 0.2% African American, 0.6% Native American, 0.2% Asian, 0.2% Pacific Islander, and 4.4% from other races. The median household income was $31,250, and the median family income was $35,000.
The town is served by the Floyd Municipal School District, which consists of one elementary school, one middle school, and one high school. The town is also home to a number of churches, including the First Baptist Church, the Church of Jesus Christ of Latter-day Saints, and the United Methodist Church.
Common Questions
What is Per Capita Income in Floyd?
Per Capita income in Floyd is $24,411.
What is the Median Household income in Floyd?
Median Household Income in Floyd is $35,938.
What is Inequality or Gini Index in Floyd?
Inequality or Gini Index in Floyd is 0.41.
What is the Total Population of Floyd?
Total Population of Floyd is 87.
What is the Total Male Population of Floyd?
Total Male Population of Floyd is 56.
What is the Total Female Population of Floyd?
Total Female Population of Floyd is 31.
What is the Ratio of Males per 100 Females in Floyd?
There are 180.65 Males per 100 Females in Floyd.
What is the Ratio of Females per 100 Males in Floyd?
There are 55.36 Females per 100 Males in Floyd.
What is the Median Population Age in Floyd?
Median Population Age in Floyd is 22.9 Years.
What is the Average Family Size in Floyd
Average Family Size in Floyd is 3.4 People.
What is the Average Household Size in Floyd
Average Household Size in Floyd is 2.8 People.
How Large is the Labor Force in Floyd?
There are 42 People in the Labor Forcein in Floyd.
What is the Percentage of People in the Labor Force in Floyd?
59.2% of People are in the Labor Force in Floyd.