Zip Codes with the Highest Percentage of Population Employed in Architecture & Engineering in Farmington, NM
RELATED REPORTS & OPTIONS
Architecture & Engineering
Farmington
Compare Zip Codes
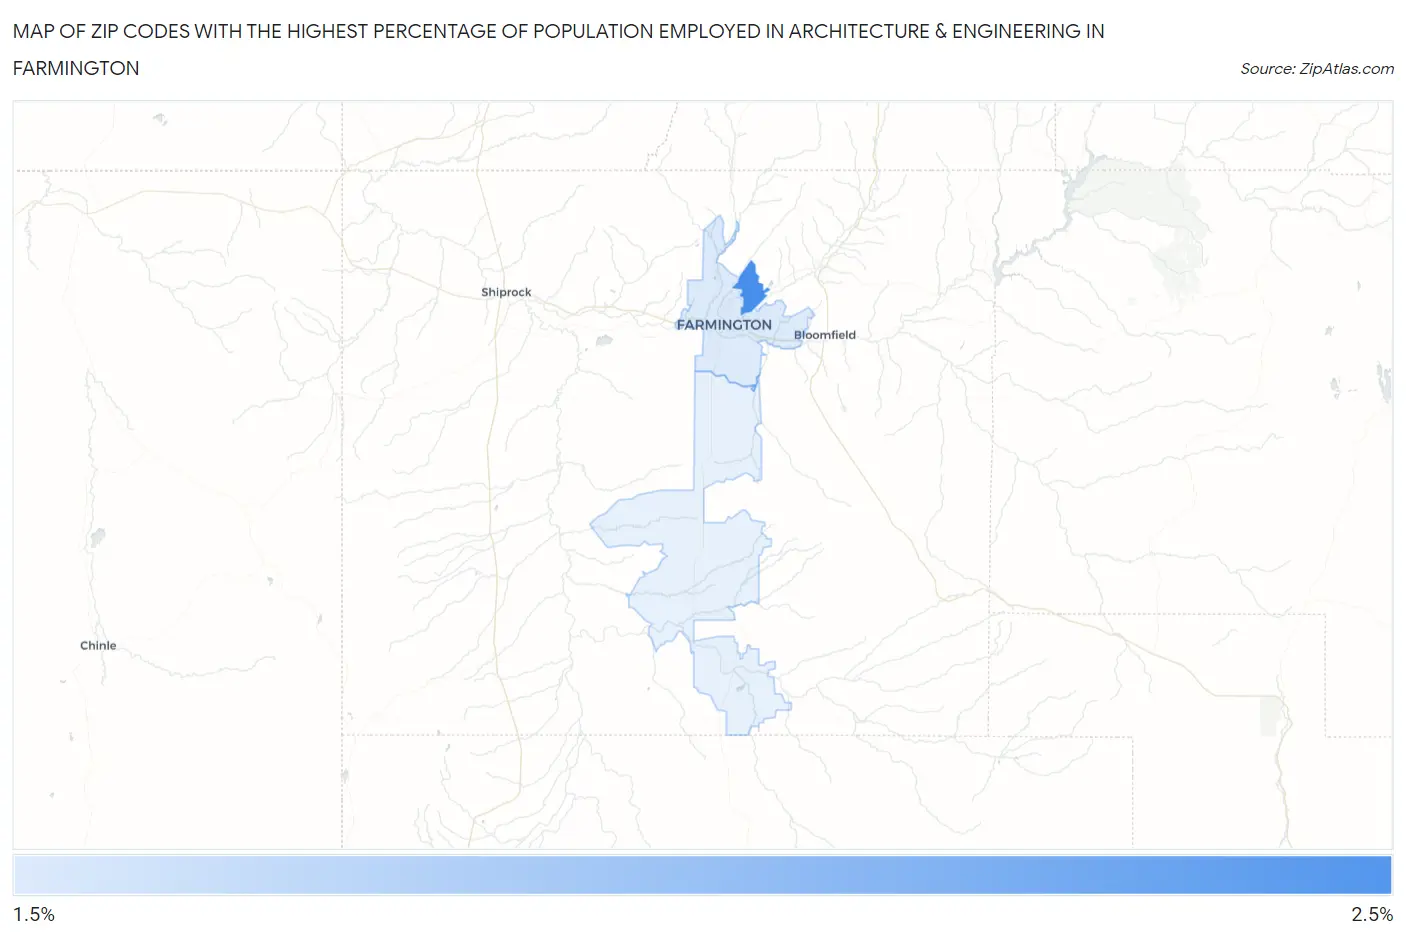
Map of Zip Codes with the Highest Percentage of Population Employed in Architecture & Engineering in Farmington
1.6%
2.5%
Zip Codes with the Highest Percentage of Population Employed in Architecture & Engineering in Farmington, NM
| Zip Code | % Employed | vs State | vs National | |
| 1. | 87402 | 2.5% | 2.5%(-0.023)#52 | 2.1%(+0.345)#7,019 |
| 2. | 87401 | 1.6% | 2.5%(-0.914)#80 | 2.1%(-0.547)#12,168 |
1
Common Questions
What are the Top Zip Codes with the Highest Percentage of Population Employed in Architecture & Engineering in Farmington, NM?
Top Zip Codes with the Highest Percentage of Population Employed in Architecture & Engineering in Farmington, NM are:
What zip code has the Highest Percentage of Population Employed in Architecture & Engineering in Farmington, NM?
87402 has the Highest Percentage of Population Employed in Architecture & Engineering in Farmington, NM with 2.5%.
What is the Percentage of Population Employed in Architecture & Engineering in Farmington, NM?
Percentage of Population Employed in Architecture & Engineering in Farmington is 2.1%.
What is the Percentage of Population Employed in Architecture & Engineering in New Mexico?
Percentage of Population Employed in Architecture & Engineering in New Mexico is 2.5%.
What is the Percentage of Population Employed in Architecture & Engineering in the United States?
Percentage of Population Employed in Architecture & Engineering in the United States is 2.1%.