Zip Codes with the Highest Percentage of Population Employed in Architecture & Engineering in New Mexico
RELATED REPORTS & OPTIONS
Architecture & Engineering
New Mexico
Compare Zip Codes
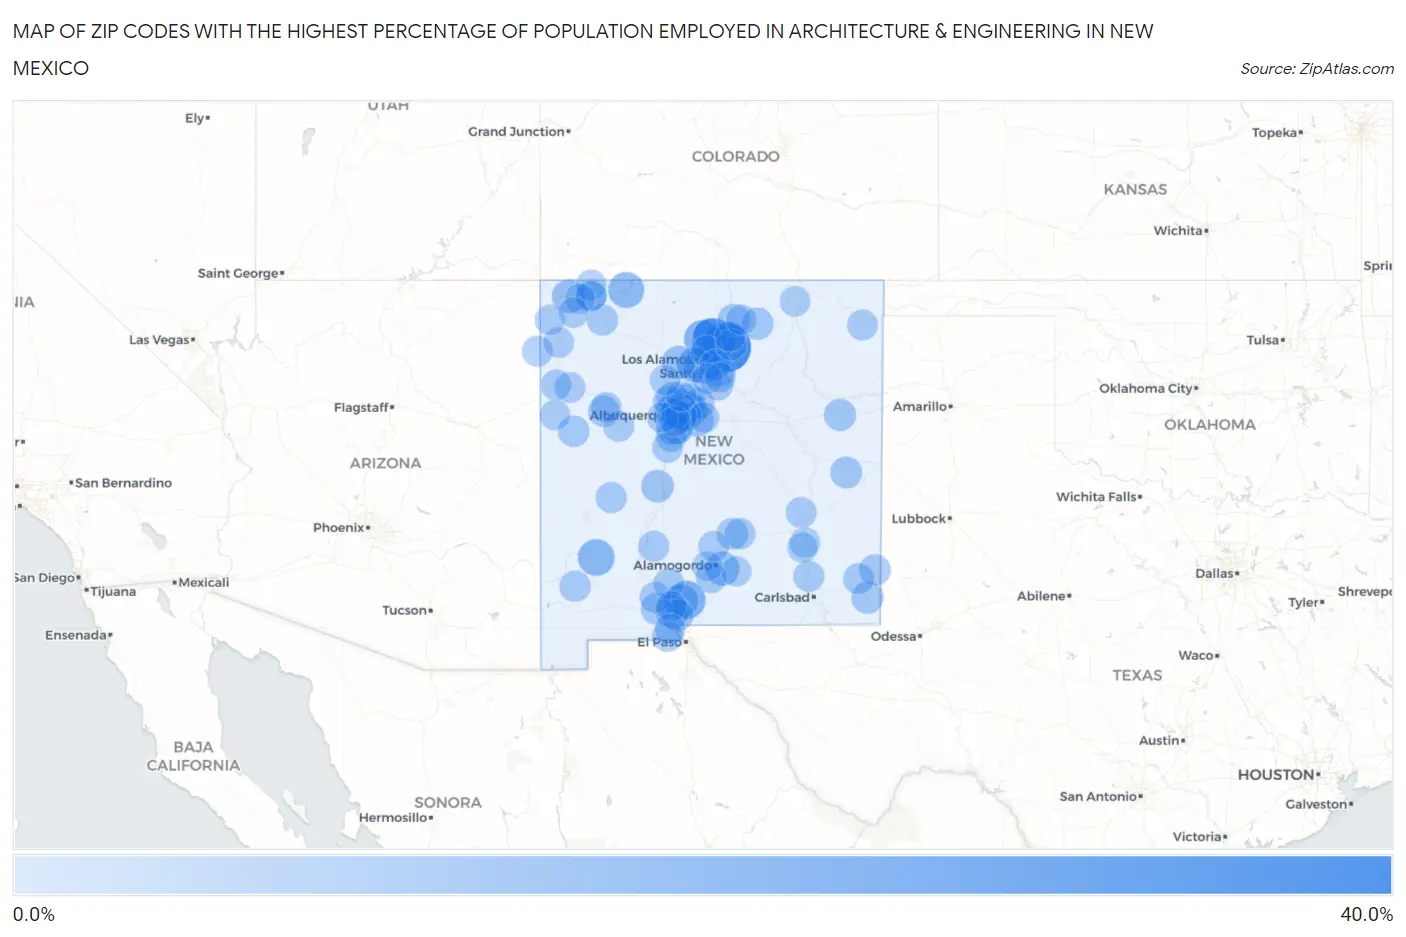
Map of Zip Codes with the Highest Percentage of Population Employed in Architecture & Engineering in New Mexico
0.0%
40.0%
Zip Codes with the Highest Percentage of Population Employed in Architecture & Engineering in New Mexico
| Zip Code | % Employed | vs State | vs National | |
| 1. | 87578 | 37.8% | 2.5%(+35.3)#1 | 2.1%(+35.7)#32 |
| 2. | 87582 | 26.4% | 2.5%(+23.9)#2 | 2.1%(+24.2)#58 |
| 3. | 88002 | 16.3% | 2.5%(+13.7)#3 | 2.1%(+14.1)#134 |
| 4. | 87548 | 13.3% | 2.5%(+10.8)#4 | 2.1%(+11.2)#189 |
| 5. | 88049 | 12.8% | 2.5%(+10.3)#5 | 2.1%(+10.7)#205 |
| 6. | 87547 | 12.8% | 2.5%(+10.3)#6 | 2.1%(+10.7)#207 |
| 7. | 87419 | 11.5% | 2.5%(+8.97)#7 | 2.1%(+9.33)#264 |
| 8. | 87544 | 10.9% | 2.5%(+8.36)#8 | 2.1%(+8.73)#290 |
| 9. | 87022 | 9.8% | 2.5%(+7.25)#9 | 2.1%(+7.62)#359 |
| 10. | 88011 | 8.7% | 2.5%(+6.19)#10 | 2.1%(+6.56)#460 |
| 11. | 88325 | 8.1% | 2.5%(+5.55)#11 | 2.1%(+5.92)#561 |
| 12. | 87421 | 7.3% | 2.5%(+4.78)#12 | 2.1%(+5.14)#691 |
| 13. | 87122 | 7.1% | 2.5%(+4.60)#13 | 2.1%(+4.97)#724 |
| 14. | 88047 | 6.9% | 2.5%(+4.39)#14 | 2.1%(+4.75)#774 |
| 15. | 87025 | 6.8% | 2.5%(+4.25)#15 | 2.1%(+4.61)#810 |
| 16. | 87549 | 6.6% | 2.5%(+4.10)#16 | 2.1%(+4.46)#849 |
| 17. | 87043 | 6.3% | 2.5%(+3.77)#17 | 2.1%(+4.14)#964 |
| 18. | 87059 | 6.2% | 2.5%(+3.65)#18 | 2.1%(+4.02)#1,013 |
| 19. | 87008 | 5.7% | 2.5%(+3.21)#19 | 2.1%(+3.58)#1,208 |
| 20. | 87801 | 5.2% | 2.5%(+2.65)#20 | 2.1%(+3.02)#1,540 |
| 21. | 87529 | 4.8% | 2.5%(+2.26)#21 | 2.1%(+2.62)#1,854 |
| 22. | 87111 | 4.7% | 2.5%(+2.17)#22 | 2.1%(+2.54)#1,953 |
| 23. | 87710 | 4.6% | 2.5%(+2.13)#23 | 2.1%(+2.49)#1,987 |
| 24. | 88231 | 4.5% | 2.5%(+2.02)#24 | 2.1%(+2.39)#2,084 |
| 25. | 87048 | 4.5% | 2.5%(+1.94)#25 | 2.1%(+2.31)#2,187 |
| 26. | 88401 | 4.4% | 2.5%(+1.85)#26 | 2.1%(+2.22)#2,293 |
| 27. | 87106 | 4.3% | 2.5%(+1.83)#27 | 2.1%(+2.20)#2,327 |
| 28. | 88072 | 4.3% | 2.5%(+1.80)#28 | 2.1%(+2.17)#2,354 |
| 29. | 87114 | 3.9% | 2.5%(+1.36)#29 | 2.1%(+1.73)#2,969 |
| 30. | 87102 | 3.8% | 2.5%(+1.31)#30 | 2.1%(+1.68)#3,043 |
| 31. | 88118 | 3.8% | 2.5%(+1.26)#31 | 2.1%(+1.62)#3,145 |
| 32. | 87112 | 3.7% | 2.5%(+1.20)#32 | 2.1%(+1.57)#3,257 |
| 33. | 87113 | 3.6% | 2.5%(+1.03)#33 | 2.1%(+1.40)#3,607 |
| 34. | 87110 | 3.5% | 2.5%(+0.964)#34 | 2.1%(+1.33)#3,783 |
| 35. | 87120 | 3.4% | 2.5%(+0.919)#35 | 2.1%(+1.29)#3,889 |
| 36. | 87109 | 3.4% | 2.5%(+0.838)#36 | 2.1%(+1.21)#4,058 |
| 37. | 87144 | 3.3% | 2.5%(+0.773)#37 | 2.1%(+1.14)#4,229 |
| 38. | 88242 | 3.3% | 2.5%(+0.767)#38 | 2.1%(+1.13)#4,246 |
| 39. | 88345 | 3.2% | 2.5%(+0.705)#39 | 2.1%(+1.07)#4,412 |
| 40. | 87047 | 3.2% | 2.5%(+0.672)#40 | 2.1%(+1.04)#4,491 |
| 41. | 87532 | 3.1% | 2.5%(+0.572)#41 | 2.1%(+0.939)#4,774 |
| 42. | 87116 | 3.0% | 2.5%(+0.487)#42 | 2.1%(+0.854)#5,049 |
| 43. | 88005 | 3.0% | 2.5%(+0.450)#43 | 2.1%(+0.817)#5,172 |
| 44. | 87020 | 2.9% | 2.5%(+0.420)#44 | 2.1%(+0.788)#5,290 |
| 45. | 87357 | 2.9% | 2.5%(+0.403)#45 | 2.1%(+0.770)#5,359 |
| 46. | 87124 | 2.8% | 2.5%(+0.267)#46 | 2.1%(+0.635)#5,844 |
| 47. | 87501 | 2.8% | 2.5%(+0.256)#47 | 2.1%(+0.623)#5,894 |
| 48. | 87508 | 2.7% | 2.5%(+0.179)#48 | 2.1%(+0.546)#6,185 |
| 49. | 88007 | 2.6% | 2.5%(+0.065)#49 | 2.1%(+0.433)#6,656 |
| 50. | 87123 | 2.6% | 2.5%(+0.039)#50 | 2.1%(+0.406)#6,766 |
| 51. | 87413 | 2.5% | 2.5%(+0.005)#51 | 2.1%(+0.372)#6,899 |
| 52. | 87402 | 2.5% | 2.5%(-0.023)#52 | 2.1%(+0.345)#7,019 |
| 53. | 87506 | 2.5% | 2.5%(-0.033)#53 | 2.1%(+0.335)#7,074 |
| 54. | 88346 | 2.4% | 2.5%(-0.084)#54 | 2.1%(+0.283)#7,322 |
| 55. | 88061 | 2.4% | 2.5%(-0.098)#55 | 2.1%(+0.269)#7,390 |
| 56. | 87901 | 2.3% | 2.5%(-0.181)#56 | 2.1%(+0.186)#7,781 |
| 57. | 87031 | 2.3% | 2.5%(-0.187)#57 | 2.1%(+0.180)#7,801 |
| 58. | 88012 | 2.3% | 2.5%(-0.191)#58 | 2.1%(+0.176)#7,826 |
| 59. | 88210 | 2.3% | 2.5%(-0.214)#59 | 2.1%(+0.153)#7,924 |
| 60. | 87107 | 2.3% | 2.5%(-0.220)#60 | 2.1%(+0.147)#7,966 |
| 61. | 88008 | 2.3% | 2.5%(-0.233)#61 | 2.1%(+0.134)#8,038 |
| 62. | 87521 | 2.3% | 2.5%(-0.266)#62 | 2.1%(+0.102)#8,200 |
| 63. | 88240 | 2.2% | 2.5%(-0.291)#63 | 2.1%(+0.077)#8,336 |
| 64. | 87108 | 2.2% | 2.5%(-0.325)#64 | 2.1%(+0.043)#8,513 |
| 65. | 87068 | 2.2% | 2.5%(-0.339)#65 | 2.1%(+0.028)#8,614 |
| 66. | 88310 | 2.1% | 2.5%(-0.410)#66 | 2.1%(-0.042)#9,001 |
| 67. | 87825 | 2.1% | 2.5%(-0.447)#67 | 2.1%(-0.079)#9,208 |
| 68. | 88201 | 2.0% | 2.5%(-0.518)#68 | 2.1%(-0.150)#9,616 |
| 69. | 87034 | 2.0% | 2.5%(-0.529)#69 | 2.1%(-0.161)#9,687 |
| 70. | 87328 | 1.9% | 2.5%(-0.580)#70 | 2.1%(-0.213)#10,006 |
| 71. | 87015 | 1.9% | 2.5%(-0.589)#71 | 2.1%(-0.221)#10,054 |
| 72. | 87316 | 1.9% | 2.5%(-0.640)#72 | 2.1%(-0.273)#10,399 |
| 73. | 87553 | 1.8% | 2.5%(-0.698)#73 | 2.1%(-0.331)#10,725 |
| 74. | 87301 | 1.8% | 2.5%(-0.714)#74 | 2.1%(-0.347)#10,808 |
| 75. | 88352 | 1.7% | 2.5%(-0.787)#75 | 2.1%(-0.419)#11,291 |
| 76. | 88415 | 1.7% | 2.5%(-0.827)#76 | 2.1%(-0.459)#11,574 |
| 77. | 87104 | 1.6% | 2.5%(-0.880)#77 | 2.1%(-0.512)#11,933 |
| 78. | 87418 | 1.6% | 2.5%(-0.883)#78 | 2.1%(-0.515)#11,952 |
| 79. | 88001 | 1.6% | 2.5%(-0.884)#79 | 2.1%(-0.517)#11,965 |
| 80. | 87401 | 1.6% | 2.5%(-0.914)#80 | 2.1%(-0.547)#12,168 |
| 81. | 87507 | 1.6% | 2.5%(-0.923)#81 | 2.1%(-0.555)#12,228 |
| 82. | 87121 | 1.5% | 2.5%(-0.984)#82 | 2.1%(-0.616)#12,627 |
| 83. | 87364 | 1.5% | 2.5%(-1.05)#83 | 2.1%(-0.679)#13,089 |
| 84. | 87002 | 1.5% | 2.5%(-1.06)#84 | 2.1%(-0.697)#13,221 |
| 85. | 87021 | 1.5% | 2.5%(-1.07)#85 | 2.1%(-0.698)#13,229 |
| 86. | 87105 | 1.4% | 2.5%(-1.14)#86 | 2.1%(-0.769)#13,728 |
| 87. | 87571 | 1.3% | 2.5%(-1.19)#87 | 2.1%(-0.819)#14,090 |
| 88. | 87505 | 1.3% | 2.5%(-1.24)#88 | 2.1%(-0.868)#14,446 |
| 89. | 87740 | 1.3% | 2.5%(-1.24)#89 | 2.1%(-0.875)#14,500 |
| 90. | 87004 | 1.2% | 2.5%(-1.31)#90 | 2.1%(-0.941)#15,011 |
| 91. | 87417 | 1.2% | 2.5%(-1.35)#91 | 2.1%(-0.986)#15,379 |
| 92. | 88317 | 1.2% | 2.5%(-1.37)#92 | 2.1%(-0.998)#15,464 |
| 93. | 87461 | 1.1% | 2.5%(-1.40)#93 | 2.1%(-1.03)#15,714 |
| 94. | 88021 | 1.1% | 2.5%(-1.41)#94 | 2.1%(-1.04)#15,802 |
| 95. | 88230 | 1.0% | 2.5%(-1.48)#95 | 2.1%(-1.11)#16,342 |
| 96. | 88330 | 1.0% | 2.5%(-1.49)#96 | 2.1%(-1.12)#16,380 |
| 97. | 87053 | 1.0% | 2.5%(-1.49)#97 | 2.1%(-1.12)#16,434 |
| 98. | 88203 | 0.98% | 2.5%(-1.54)#98 | 2.1%(-1.17)#16,751 |
| 99. | 87416 | 0.93% | 2.5%(-1.58)#99 | 2.1%(-1.22)#17,110 |
| 100. | 87327 | 0.91% | 2.5%(-1.60)#100 | 2.1%(-1.23)#17,252 |
Common Questions
What are the Top 10 Zip Codes with the Highest Percentage of Population Employed in Architecture & Engineering in New Mexico?
Top 10 Zip Codes with the Highest Percentage of Population Employed in Architecture & Engineering in New Mexico are:
What zip code has the Highest Percentage of Population Employed in Architecture & Engineering in New Mexico?
87578 has the Highest Percentage of Population Employed in Architecture & Engineering in New Mexico with 37.8%.
What is the Percentage of Population Employed in Architecture & Engineering in the State of New Mexico?
Percentage of Population Employed in Architecture & Engineering in New Mexico is 2.5%.
What is the Percentage of Population Employed in Architecture & Engineering in the United States?
Percentage of Population Employed in Architecture & Engineering in the United States is 2.1%.