Bloomfield, NM Map & Demographics
Bloomfield Map
Bloomfield Overview
$23,513
PER CAPITA INCOME
$50,355
AVG FAMILY INCOME
$49,442
AVG HOUSEHOLD INCOME
48.3%
WAGE / INCOME GAP [ % ]
51.7¢/ $1
WAGE / INCOME GAP [ $ ]
0.47
INEQUALITY / GINI INDEX
7,430
TOTAL POPULATION
3,742
MALE POPULATION
3,688
FEMALE POPULATION
101.46
MALES / 100 FEMALES
98.56
FEMALES / 100 MALES
33.0
MEDIAN AGE
3.4
AVG FAMILY SIZE
2.8
AVG HOUSEHOLD SIZE
3,121
LABOR FORCE [ PEOPLE ]
58.0%
PERCENT IN LABOR FORCE
3.0%
UNEMPLOYMENT RATE
Bloomfield Zip Codes
Bloomfield Area Codes
Income in Bloomfield
Income Overview in Bloomfield
Per Capita Income in Bloomfield is $23,513, while median incomes of families and households are $50,355 and $49,442 respectively.
| Characteristic | Number | Measure |
| Per Capita Income | 7,430 | $23,513 |
| Median Family Income | 1,809 | $50,355 |
| Mean Family Income | 1,809 | $67,671 |
| Median Household Income | 2,605 | $49,442 |
| Mean Household Income | 2,605 | $63,120 |
| Income Deficit | 1,809 | $0 |
| Wage / Income Gap (%) | 7,430 | 48.30% |
| Wage / Income Gap ($) | 7,430 | 51.70¢ per $1 |
| Gini / Inequality Index | 7,430 | 0.47 |
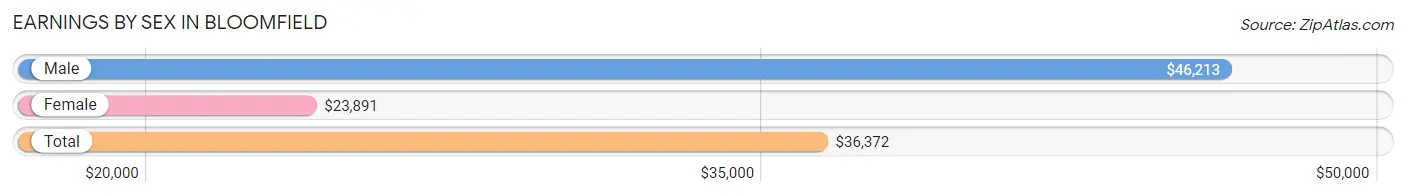
Earnings by Sex in Bloomfield
Average Earnings in Bloomfield are $36,372, $46,213 for men and $23,891 for women, a difference of 48.3%.
| Sex | Number | Average Earnings |
| Male | 1,558 (50.1%) | $46,213 |
| Female | 1,552 (49.9%) | $23,891 |
| Total | 3,110 (100.0%) | $36,372 |
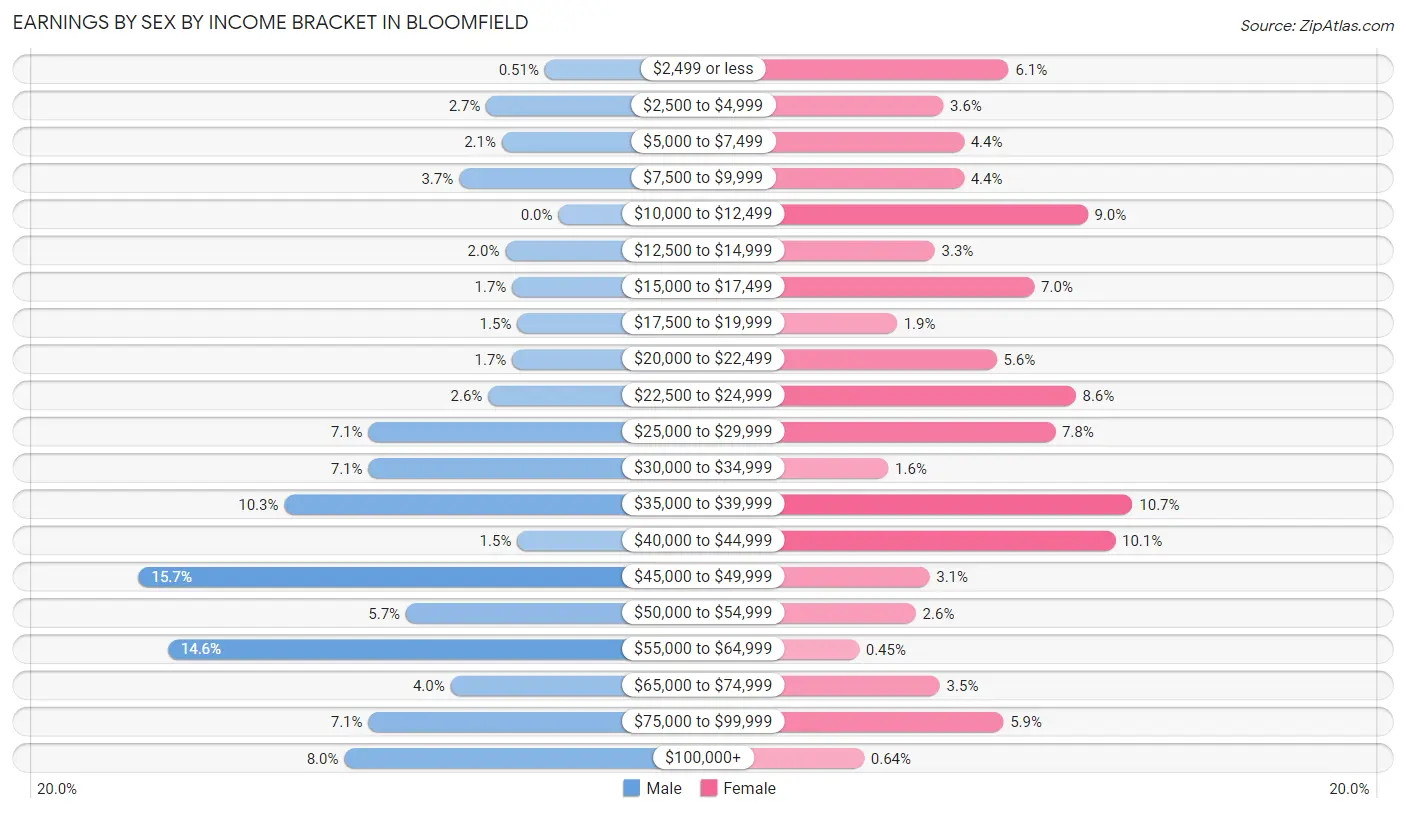
Earnings by Sex by Income Bracket in Bloomfield
The most common earnings brackets in Bloomfield are $45,000 to $49,999 for men (245 | 15.7%) and $35,000 to $39,999 for women (166 | 10.7%).
| Income | Male | Female |
| $2,499 or less | 8 (0.5%) | 94 (6.1%) |
| $2,500 to $4,999 | 42 (2.7%) | 56 (3.6%) |
| $5,000 to $7,499 | 33 (2.1%) | 68 (4.4%) |
| $7,500 to $9,999 | 58 (3.7%) | 68 (4.4%) |
| $10,000 to $12,499 | 0 (0.0%) | 140 (9.0%) |
| $12,500 to $14,999 | 31 (2.0%) | 51 (3.3%) |
| $15,000 to $17,499 | 27 (1.7%) | 109 (7.0%) |
| $17,500 to $19,999 | 24 (1.5%) | 29 (1.9%) |
| $20,000 to $22,499 | 27 (1.7%) | 87 (5.6%) |
| $22,500 to $24,999 | 41 (2.6%) | 133 (8.6%) |
| $25,000 to $29,999 | 111 (7.1%) | 121 (7.8%) |
| $30,000 to $34,999 | 111 (7.1%) | 24 (1.5%) |
| $35,000 to $39,999 | 160 (10.3%) | 166 (10.7%) |
| $40,000 to $44,999 | 24 (1.5%) | 156 (10.1%) |
| $45,000 to $49,999 | 245 (15.7%) | 48 (3.1%) |
| $50,000 to $54,999 | 89 (5.7%) | 40 (2.6%) |
| $55,000 to $64,999 | 228 (14.6%) | 7 (0.4%) |
| $65,000 to $74,999 | 63 (4.0%) | 54 (3.5%) |
| $75,000 to $99,999 | 111 (7.1%) | 91 (5.9%) |
| $100,000+ | 125 (8.0%) | 10 (0.6%) |
| Total | 1,558 (100.0%) | 1,552 (100.0%) |
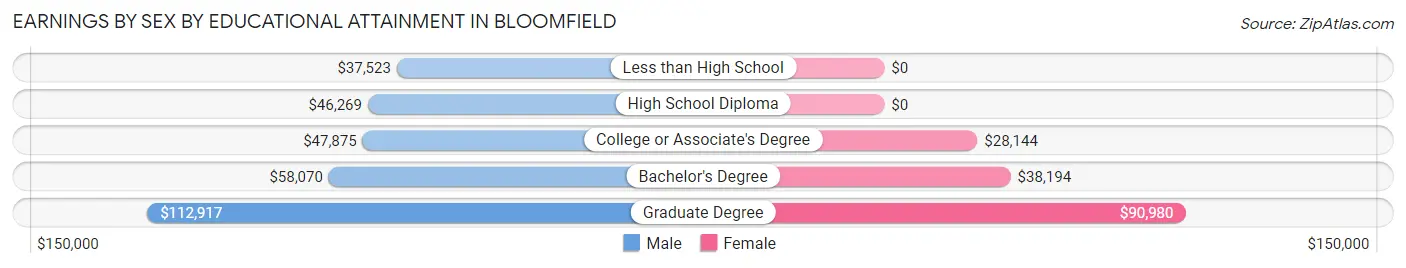
Earnings by Sex by Educational Attainment in Bloomfield
Average earnings in Bloomfield are $47,367 for men and $27,612 for women, a difference of 41.7%. Men with an educational attainment of graduate degree enjoy the highest average annual earnings of $112,917, while those with less than high school education earn the least with $37,523. Women with an educational attainment of graduate degree earn the most with the average annual earnings of $90,980, while those with college or associate's degree education have the smallest earnings of $28,144.
| Educational Attainment | Male Income | Female Income |
| Less than High School | $37,523 | $0 |
| High School Diploma | $46,269 | $0 |
| College or Associate's Degree | $47,875 | $28,144 |
| Bachelor's Degree | $58,070 | $38,194 |
| Graduate Degree | $112,917 | $90,980 |
| Total | $47,367 | $27,612 |
Family Income in Bloomfield
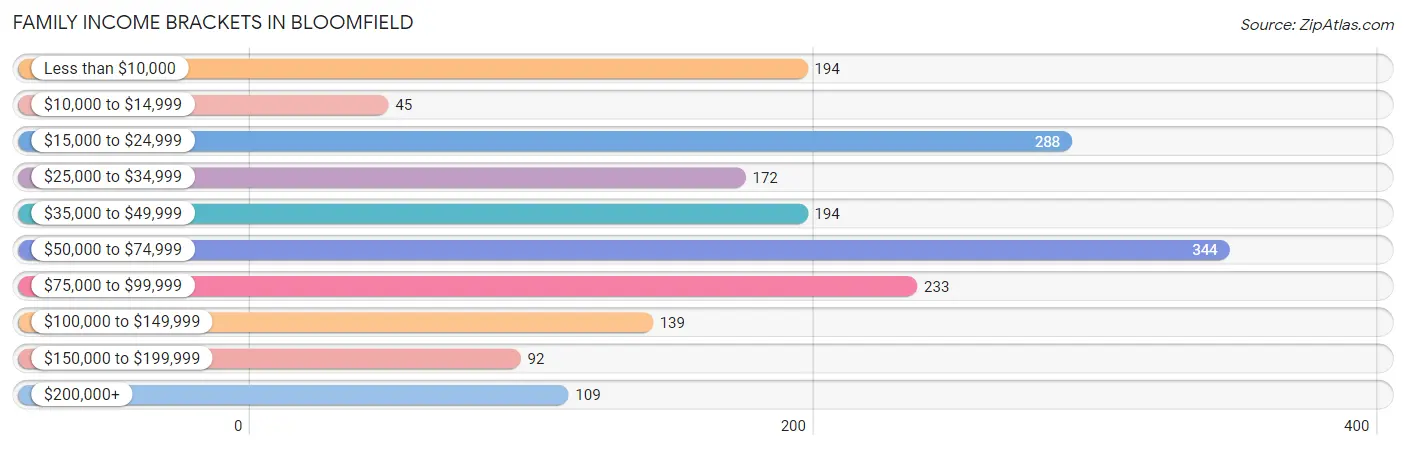
Family Income Brackets in Bloomfield
According to the Bloomfield family income data, there are 344 families falling into the $50,000 to $74,999 income range, which is the most common income bracket and makes up 19.0% of all families. Conversely, the $10,000 to $14,999 income bracket is the least frequent group with only 45 families (2.5%) belonging to this category.
| Income Bracket | # Families | % Families |
| Less than $10,000 | 194 | 10.7% |
| $10,000 to $14,999 | 45 | 2.5% |
| $15,000 to $24,999 | 288 | 15.9% |
| $25,000 to $34,999 | 172 | 9.5% |
| $35,000 to $49,999 | 194 | 10.7% |
| $50,000 to $74,999 | 344 | 19.0% |
| $75,000 to $99,999 | 233 | 12.9% |
| $100,000 to $149,999 | 139 | 7.7% |
| $150,000 to $199,999 | 92 | 5.1% |
| $200,000+ | 109 | 6.0% |
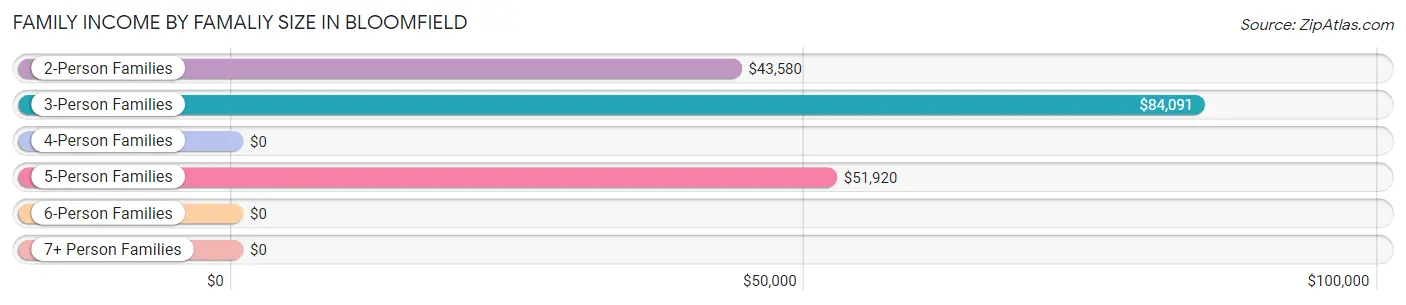
Family Income by Famaliy Size in Bloomfield
3-person families (352 | 19.5%) account for the highest median family income in Bloomfield with $84,091 per family, while 3-person families (352 | 19.5%) have the highest median income of $28,030 per family member.
| Income Bracket | # Families | Median Income |
| 2-Person Families | 843 (46.6%) | $43,580 |
| 3-Person Families | 352 (19.5%) | $84,091 |
| 4-Person Families | 331 (18.3%) | $0 |
| 5-Person Families | 138 (7.6%) | $51,920 |
| 6-Person Families | 78 (4.3%) | $0 |
| 7+ Person Families | 67 (3.7%) | $0 |
| Total | 1,809 (100.0%) | $50,355 |
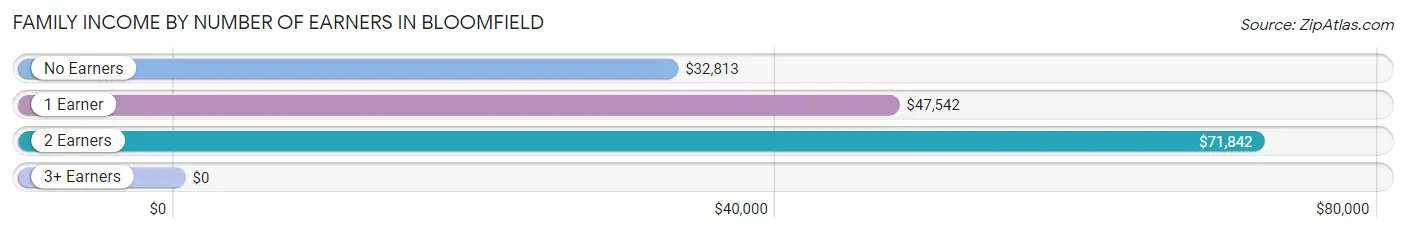
Family Income by Number of Earners in Bloomfield
| Number of Earners | # Families | Median Income |
| No Earners | 420 (23.2%) | $32,813 |
| 1 Earner | 839 (46.4%) | $47,542 |
| 2 Earners | 354 (19.6%) | $71,842 |
| 3+ Earners | 196 (10.8%) | $0 |
| Total | 1,809 (100.0%) | $50,355 |
Household Income in Bloomfield
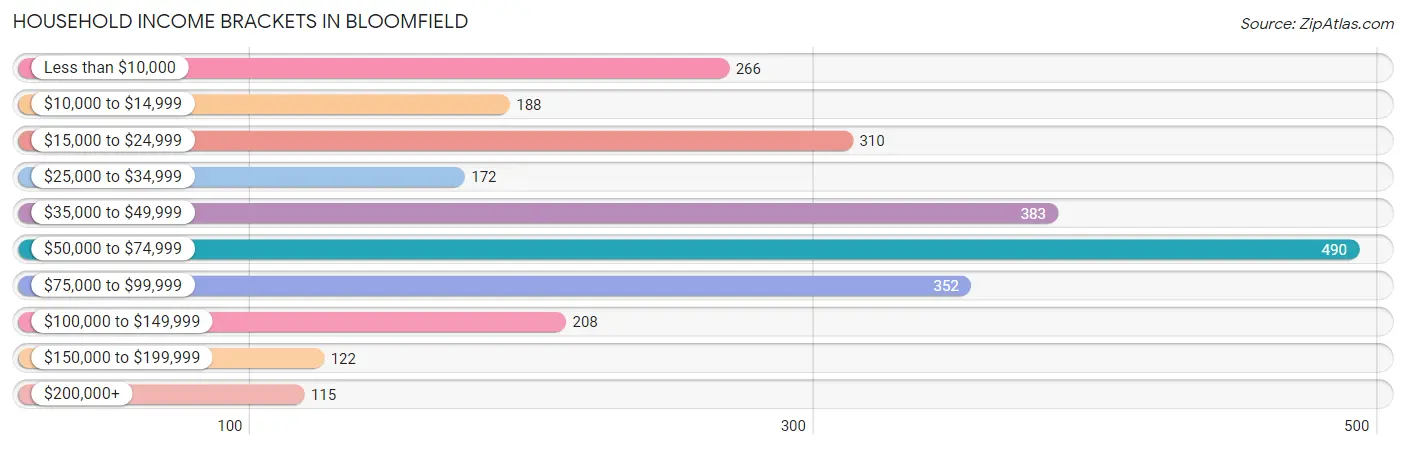
Household Income Brackets in Bloomfield
With 490 households falling in the category, the $50,000 to $74,999 income range is the most frequent in Bloomfield, accounting for 18.8% of all households. In contrast, only 115 households (4.4%) fall into the $200,000+ income bracket, making it the least populous group.
| Income Bracket | # Households | % Households |
| Less than $10,000 | 266 | 10.2% |
| $10,000 to $14,999 | 188 | 7.2% |
| $15,000 to $24,999 | 310 | 11.9% |
| $25,000 to $34,999 | 172 | 6.6% |
| $35,000 to $49,999 | 383 | 14.7% |
| $50,000 to $74,999 | 490 | 18.8% |
| $75,000 to $99,999 | 352 | 13.5% |
| $100,000 to $149,999 | 208 | 8.0% |
| $150,000 to $199,999 | 122 | 4.7% |
| $200,000+ | 115 | 4.4% |
Household Income by Householder Age in Bloomfield
The median household income in Bloomfield is $49,442, with the highest median household income of $51,481 found in the 45 to 64 years age bracket for the primary householder. A total of 930 households (35.7%) fall into this category. Meanwhile, the 15 to 24 years age bracket for the primary householder has the lowest median household income of $0, with 145 households (5.6%) in this group.
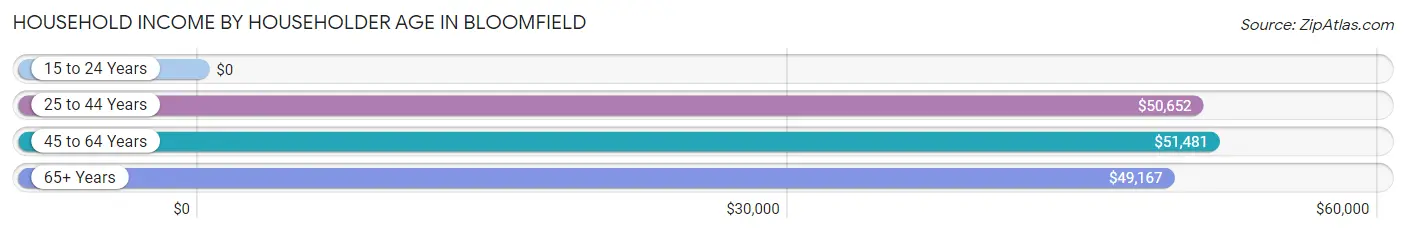
| Income Bracket | # Households | Median Income |
| 15 to 24 Years | 145 (5.6%) | $0 |
| 25 to 44 Years | 728 (28.0%) | $50,652 |
| 45 to 64 Years | 930 (35.7%) | $51,481 |
| 65+ Years | 802 (30.8%) | $49,167 |
| Total | 2,605 (100.0%) | $49,442 |
Poverty in Bloomfield
Income Below Poverty by Sex and Age in Bloomfield
With 16.7% poverty level for males and 28.6% for females among the residents of Bloomfield, 15 year old males and 5 year old females are the most vulnerable to poverty, with 27 males (100.0%) and 79 females (82.3%) in their respective age groups living below the poverty level.
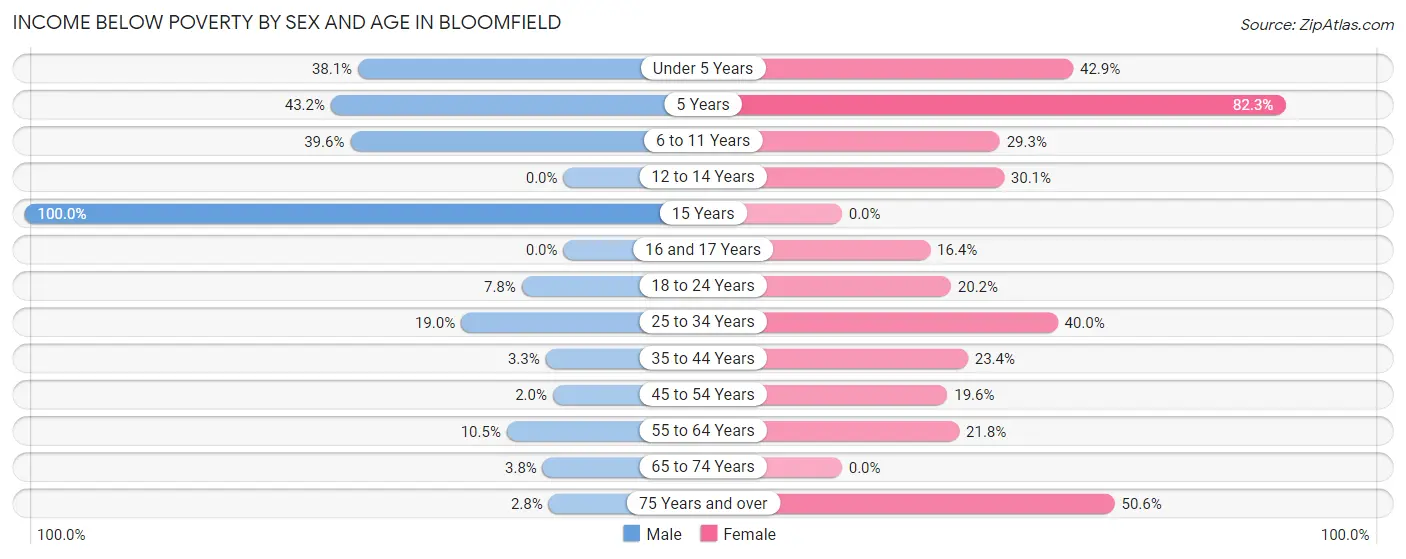
| Age Bracket | Male | Female |
| Under 5 Years | 175 (38.1%) | 85 (42.9%) |
| 5 Years | 41 (43.2%) | 79 (82.3%) |
| 6 to 11 Years | 180 (39.6%) | 117 (29.3%) |
| 12 to 14 Years | 0 (0.0%) | 40 (30.1%) |
| 15 Years | 27 (100.0%) | 0 (0.0%) |
| 16 and 17 Years | 0 (0.0%) | 20 (16.4%) |
| 18 to 24 Years | 22 (7.7%) | 84 (20.2%) |
| 25 to 34 Years | 103 (19.0%) | 227 (40.0%) |
| 35 to 44 Years | 11 (3.3%) | 69 (23.4%) |
| 45 to 54 Years | 8 (2.0%) | 74 (19.6%) |
| 55 to 64 Years | 33 (10.5%) | 125 (21.8%) |
| 65 to 74 Years | 16 (3.8%) | 0 (0.0%) |
| 75 Years and over | 6 (2.8%) | 121 (50.6%) |
| Total | 622 (16.7%) | 1,041 (28.6%) |
Income Above Poverty by Sex and Age in Bloomfield
According to the poverty statistics in Bloomfield, males aged 12 to 14 years and females aged 15 years are the age groups that are most secure financially, with 100.0% of males and 100.0% of females in these age groups living above the poverty line.
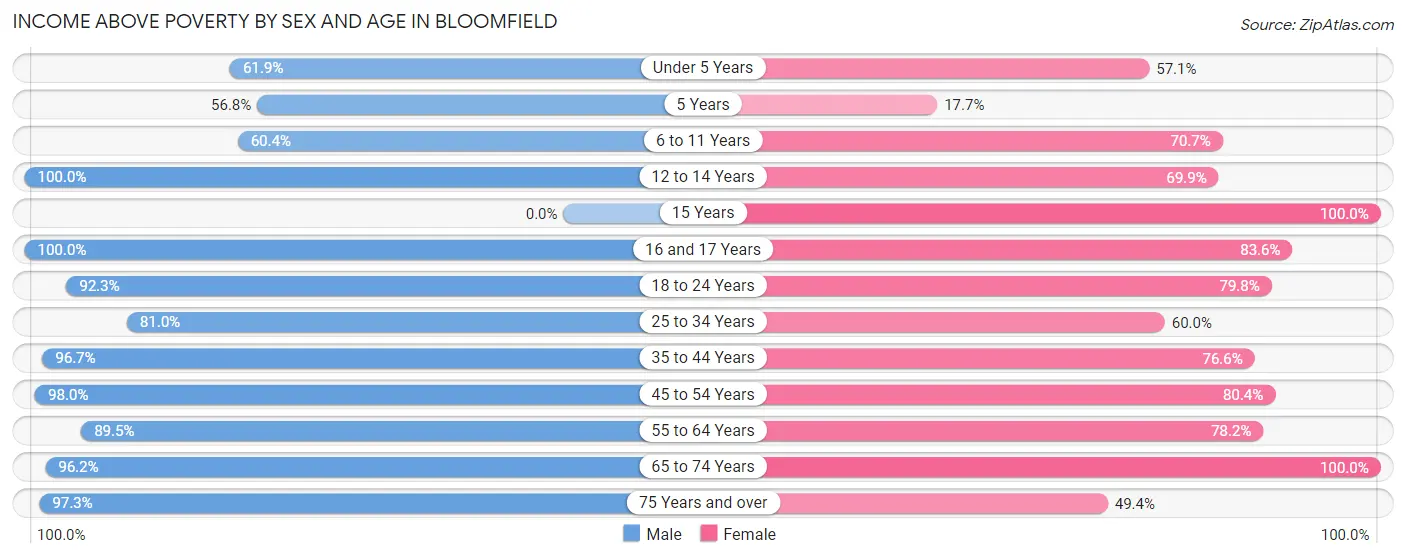
| Age Bracket | Male | Female |
| Under 5 Years | 284 (61.9%) | 113 (57.1%) |
| 5 Years | 54 (56.8%) | 17 (17.7%) |
| 6 to 11 Years | 275 (60.4%) | 282 (70.7%) |
| 12 to 14 Years | 160 (100.0%) | 93 (69.9%) |
| 15 Years | 0 (0.0%) | 27 (100.0%) |
| 16 and 17 Years | 5 (100.0%) | 102 (83.6%) |
| 18 to 24 Years | 262 (92.2%) | 331 (79.8%) |
| 25 to 34 Years | 439 (81.0%) | 340 (60.0%) |
| 35 to 44 Years | 322 (96.7%) | 226 (76.6%) |
| 45 to 54 Years | 401 (98.0%) | 304 (80.4%) |
| 55 to 64 Years | 281 (89.5%) | 449 (78.2%) |
| 65 to 74 Years | 401 (96.2%) | 195 (100.0%) |
| 75 Years and over | 212 (97.3%) | 118 (49.4%) |
| Total | 3,096 (83.3%) | 2,597 (71.4%) |
Income Below Poverty Among Married-Couple Families in Bloomfield
The poverty statistics for married-couple families in Bloomfield show that 10.2% or 102 of the total 1,005 families live below the poverty line. Families with 5 or more children have the highest poverty rate of 85.1%, comprising of 57 families. On the other hand, families with 1 or 2 children have the lowest poverty rate of 0.0%, which includes 0 families.
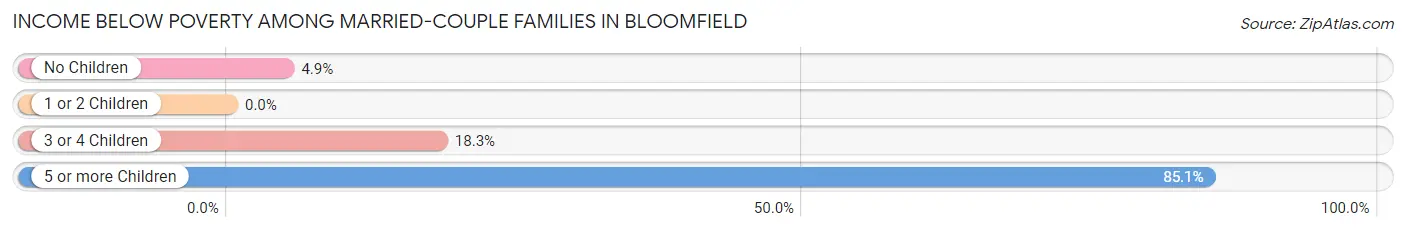
| Children | Above Poverty | Below Poverty |
| No Children | 504 (95.1%) | 26 (4.9%) |
| 1 or 2 Children | 304 (100.0%) | 0 (0.0%) |
| 3 or 4 Children | 85 (81.7%) | 19 (18.3%) |
| 5 or more Children | 10 (14.9%) | 57 (85.1%) |
| Total | 903 (89.8%) | 102 (10.2%) |
Income Below Poverty Among Single-Parent Households in Bloomfield
According to the poverty data in Bloomfield, 9.0% or 18 single-father households and 43.8% or 264 single-mother households are living below the poverty line. Among single-father households, those with 1 or 2 children have the highest poverty rate, with 18 households (10.0%) experiencing poverty. Likewise, among single-mother households, those with 3 or 4 children have the highest poverty rate, with 80 households (71.4%) falling below the poverty line.
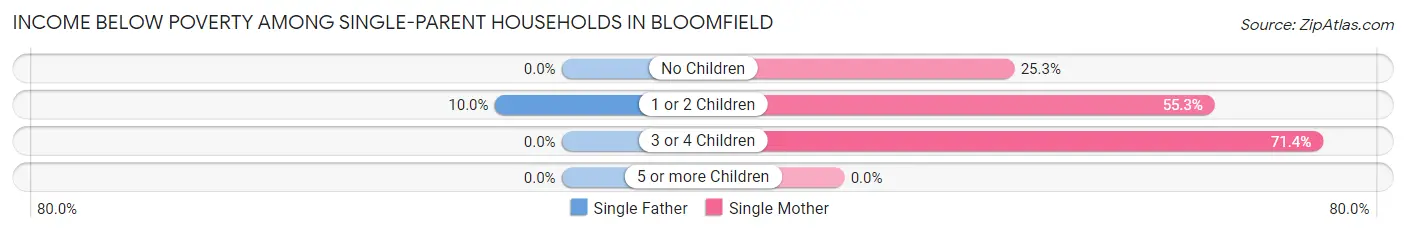
| Children | Single Father | Single Mother |
| No Children | 0 (0.0%) | 74 (25.3%) |
| 1 or 2 Children | 18 (10.0%) | 110 (55.3%) |
| 3 or 4 Children | 0 (0.0%) | 80 (71.4%) |
| 5 or more Children | 0 (0.0%) | 0 (0.0%) |
| Total | 18 (9.0%) | 264 (43.8%) |
Income Below Poverty Among Married-Couple vs Single-Parent Households in Bloomfield
The poverty data for Bloomfield shows that 102 of the married-couple family households (10.2%) and 282 of the single-parent households (35.1%) are living below the poverty level. Within the married-couple family households, those with 5 or more children have the highest poverty rate, with 57 households (85.1%) falling below the poverty line. Among the single-parent households, those with 3 or 4 children have the highest poverty rate, with 80 household (71.4%) living below poverty.
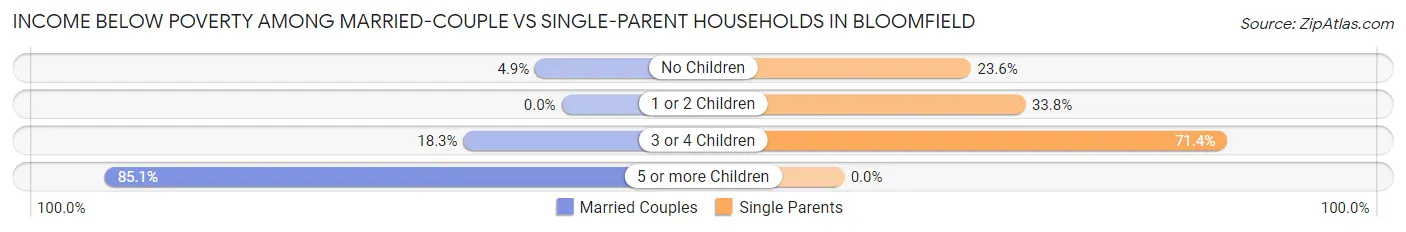
| Children | Married-Couple Families | Single-Parent Households |
| No Children | 26 (4.9%) | 74 (23.6%) |
| 1 or 2 Children | 0 (0.0%) | 128 (33.8%) |
| 3 or 4 Children | 19 (18.3%) | 80 (71.4%) |
| 5 or more Children | 57 (85.1%) | 0 (0.0%) |
| Total | 102 (10.2%) | 282 (35.1%) |
Race in Bloomfield
The most populous races in Bloomfield are White / Caucasian (3,952 | 53.2%), Hispanic or Latino (2,265 | 30.5%), and Native / Alaskan (1,793 | 24.1%).
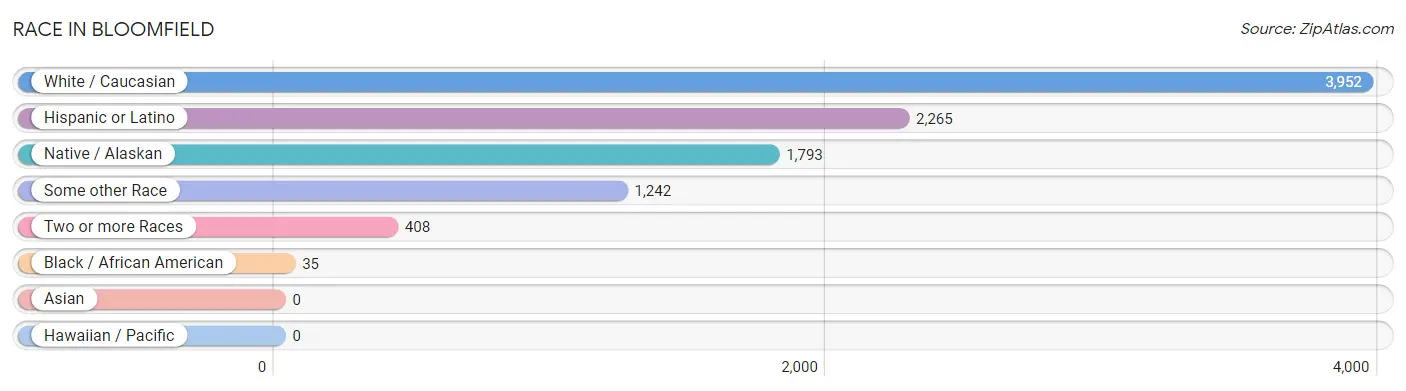
| Race | # Population | % Population |
| Asian | 0 | 0.0% |
| Black / African American | 35 | 0.5% |
| Hawaiian / Pacific | 0 | 0.0% |
| Hispanic or Latino | 2,265 | 30.5% |
| Native / Alaskan | 1,793 | 24.1% |
| White / Caucasian | 3,952 | 53.2% |
| Two or more Races | 408 | 5.5% |
| Some other Race | 1,242 | 16.7% |
| Total | 7,430 | 100.0% |
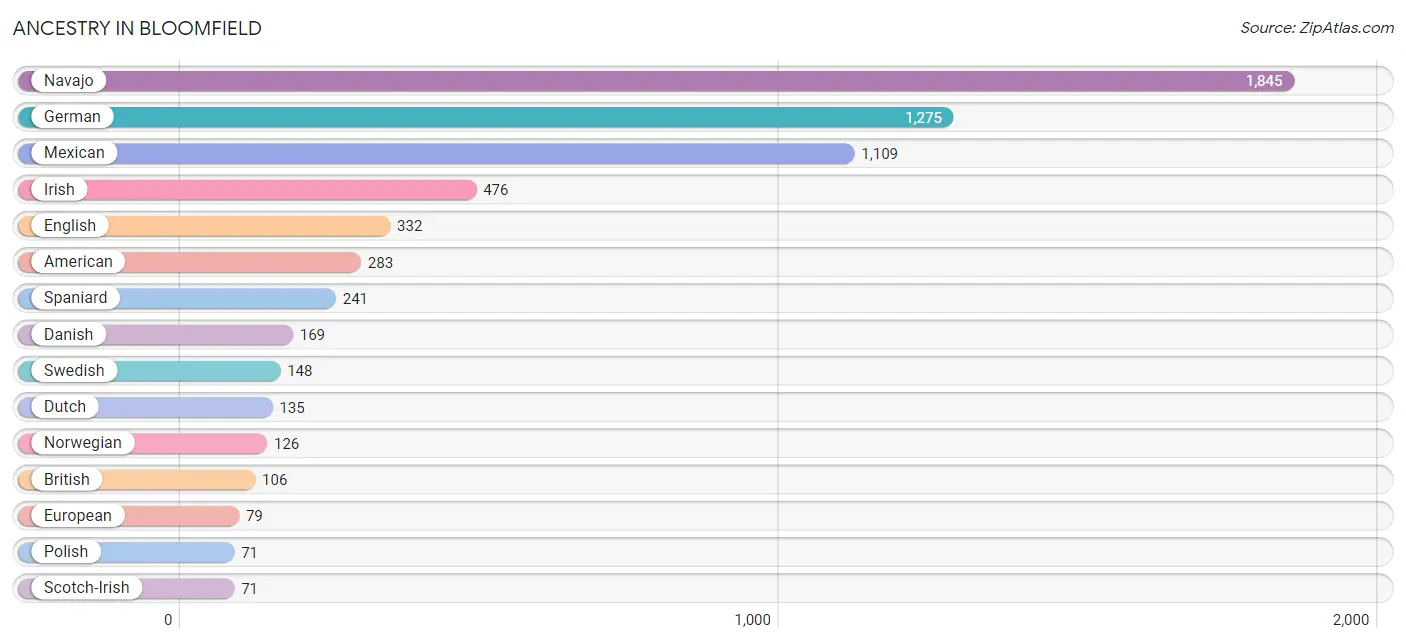
Ancestry in Bloomfield
The most populous ancestries reported in Bloomfield are Navajo (1,845 | 24.8%), German (1,275 | 17.2%), Mexican (1,109 | 14.9%), Irish (476 | 6.4%), and English (332 | 4.5%), together accounting for 67.8% of all Bloomfield residents.
| Ancestry | # Population | % Population |
| African | 40 | 0.5% |
| American | 283 | 3.8% |
| Apache | 25 | 0.3% |
| Basque | 10 | 0.1% |
| British | 106 | 1.4% |
| Canadian | 12 | 0.2% |
| Creek | 19 | 0.3% |
| Croatian | 11 | 0.2% |
| Cuban | 28 | 0.4% |
| Danish | 169 | 2.3% |
| Dutch | 135 | 1.8% |
| English | 332 | 4.5% |
| European | 79 | 1.1% |
| French | 32 | 0.4% |
| German | 1,275 | 17.2% |
| Greek | 10 | 0.1% |
| Irish | 476 | 6.4% |
| Italian | 32 | 0.4% |
| Korean | 5 | 0.1% |
| Mexican | 1,109 | 14.9% |
| Navajo | 1,845 | 24.8% |
| Norwegian | 126 | 1.7% |
| Polish | 71 | 1.0% |
| Portuguese | 16 | 0.2% |
| Pueblo | 7 | 0.1% |
| Puerto Rican | 65 | 0.9% |
| Russian | 17 | 0.2% |
| Scandinavian | 70 | 0.9% |
| Scotch-Irish | 71 | 1.0% |
| Scottish | 32 | 0.4% |
| Spaniard | 241 | 3.2% |
| Spanish | 65 | 0.9% |
| Spanish American | 41 | 0.5% |
| Subsaharan African | 40 | 0.5% |
| Swedish | 148 | 2.0% | View All 35 Rows |
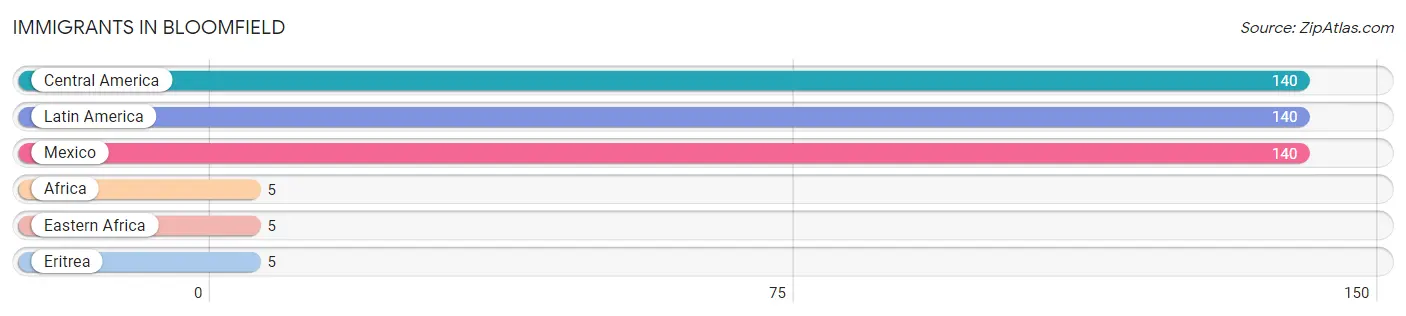
Immigrants in Bloomfield
The most numerous immigrant groups reported in Bloomfield came from Central America (140 | 1.9%), Latin America (140 | 1.9%), Mexico (140 | 1.9%), Africa (5 | 0.1%), and Eastern Africa (5 | 0.1%), together accounting for 5.8% of all Bloomfield residents.
| Immigration Origin | # Population | % Population |
| Africa | 5 | 0.1% |
| Central America | 140 | 1.9% |
| Eastern Africa | 5 | 0.1% |
| Eritrea | 5 | 0.1% |
| Latin America | 140 | 1.9% |
| Mexico | 140 | 1.9% | View All 6 Rows |
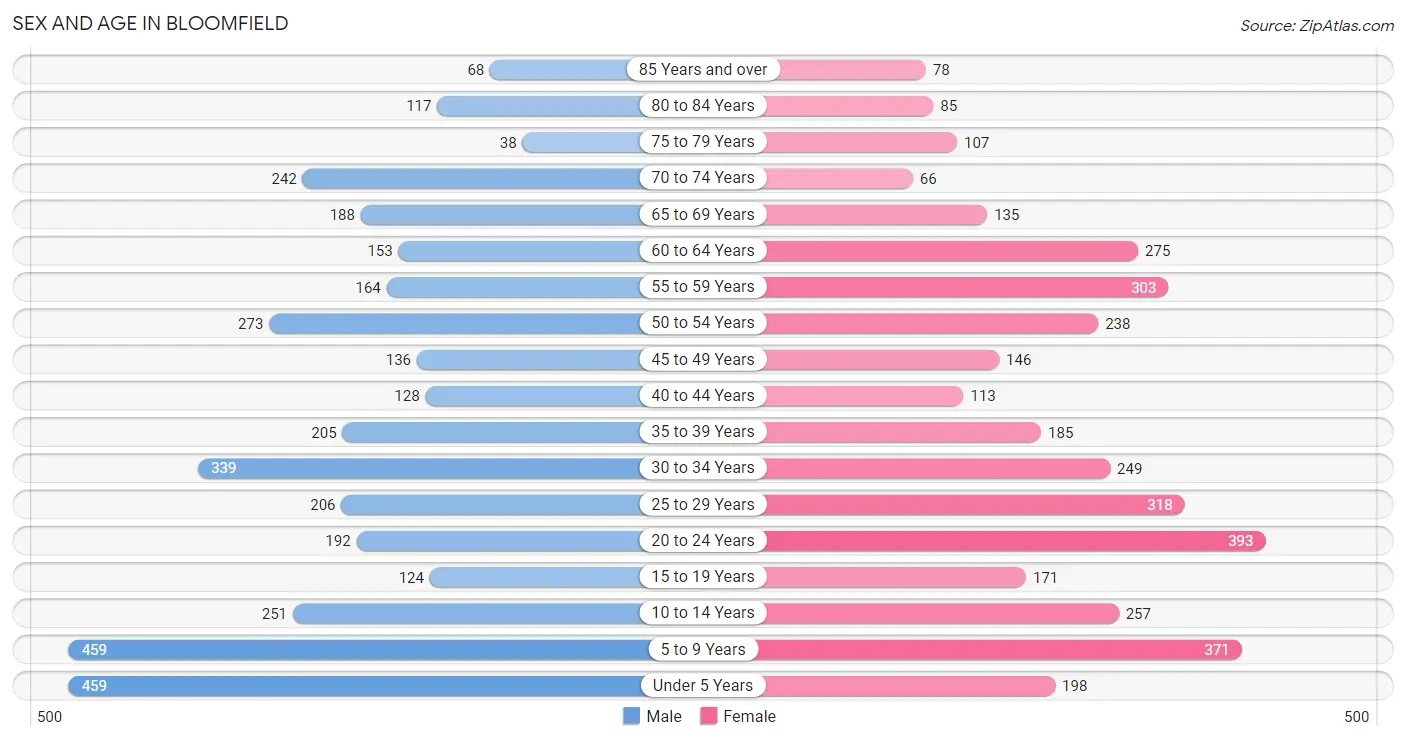
Sex and Age in Bloomfield
Sex and Age in Bloomfield
The most populous age groups in Bloomfield are Under 5 Years (459 | 12.3%) for men and 20 to 24 Years (393 | 10.7%) for women.
| Age Bracket | Male | Female |
| Under 5 Years | 459 (12.3%) | 198 (5.4%) |
| 5 to 9 Years | 459 (12.3%) | 371 (10.1%) |
| 10 to 14 Years | 251 (6.7%) | 257 (7.0%) |
| 15 to 19 Years | 124 (3.3%) | 171 (4.6%) |
| 20 to 24 Years | 192 (5.1%) | 393 (10.7%) |
| 25 to 29 Years | 206 (5.5%) | 318 (8.6%) |
| 30 to 34 Years | 339 (9.1%) | 249 (6.8%) |
| 35 to 39 Years | 205 (5.5%) | 185 (5.0%) |
| 40 to 44 Years | 128 (3.4%) | 113 (3.1%) |
| 45 to 49 Years | 136 (3.6%) | 146 (4.0%) |
| 50 to 54 Years | 273 (7.3%) | 238 (6.5%) |
| 55 to 59 Years | 164 (4.4%) | 303 (8.2%) |
| 60 to 64 Years | 153 (4.1%) | 275 (7.5%) |
| 65 to 69 Years | 188 (5.0%) | 135 (3.7%) |
| 70 to 74 Years | 242 (6.5%) | 66 (1.8%) |
| 75 to 79 Years | 38 (1.0%) | 107 (2.9%) |
| 80 to 84 Years | 117 (3.1%) | 85 (2.3%) |
| 85 Years and over | 68 (1.8%) | 78 (2.1%) |
| Total | 3,742 (100.0%) | 3,688 (100.0%) |
Families and Households in Bloomfield
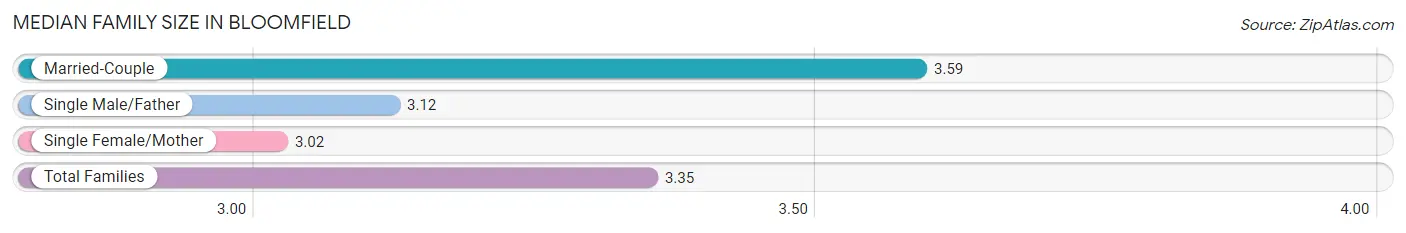
Median Family Size in Bloomfield
The median family size in Bloomfield is 3.35 persons per family, with married-couple families (1,005 | 55.6%) accounting for the largest median family size of 3.59 persons per family. On the other hand, single female/mother families (603 | 33.3%) represent the smallest median family size with 3.02 persons per family.
| Family Type | # Families | Family Size |
| Married-Couple | 1,005 (55.6%) | 3.59 |
| Single Male/Father | 201 (11.1%) | 3.12 |
| Single Female/Mother | 603 (33.3%) | 3.02 |
| Total Families | 1,809 (100.0%) | 3.35 |
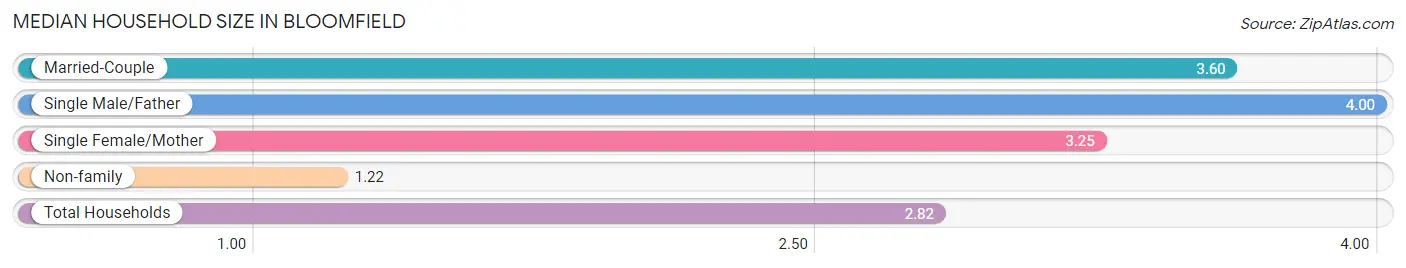
Median Household Size in Bloomfield
The median household size in Bloomfield is 2.82 persons per household, with single male/father households (201 | 7.7%) accounting for the largest median household size of 4 persons per household. non-family households (796 | 30.6%) represent the smallest median household size with 1.22 persons per household.
| Household Type | # Households | Household Size |
| Married-Couple | 1,005 (38.6%) | 3.60 |
| Single Male/Father | 201 (7.7%) | 4.00 |
| Single Female/Mother | 603 (23.2%) | 3.25 |
| Non-family | 796 (30.6%) | 1.22 |
| Total Households | 2,605 (100.0%) | 2.82 |
Household Size by Marriage Status in Bloomfield
Out of a total of 2,605 households in Bloomfield, 1,809 (69.4%) are family households, while 796 (30.6%) are nonfamily households. The most numerous type of family households are 2-person households, comprising 710, and the most common type of nonfamily households are 1-person households, comprising 679.
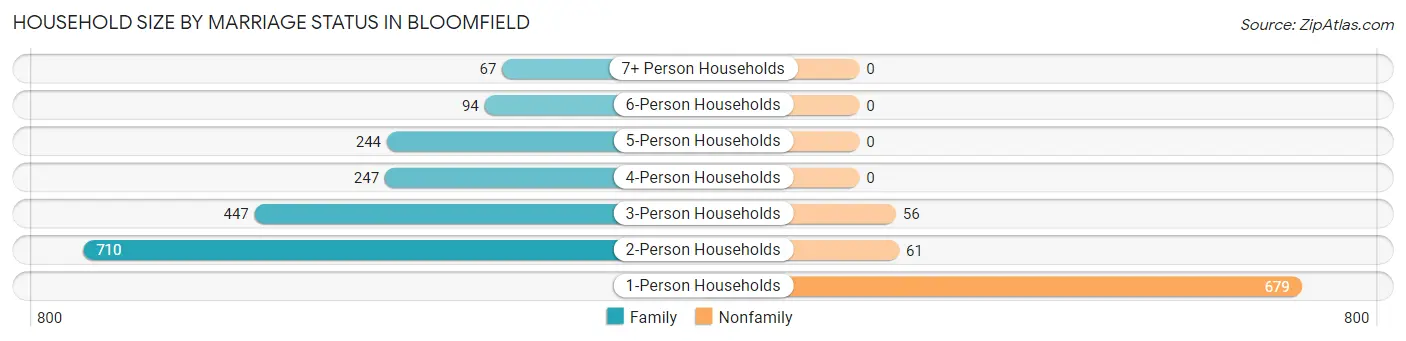
| Household Size | Family Households | Nonfamily Households |
| 1-Person Households | - | 679 (26.1%) |
| 2-Person Households | 710 (27.3%) | 61 (2.3%) |
| 3-Person Households | 447 (17.2%) | 56 (2.1%) |
| 4-Person Households | 247 (9.5%) | 0 (0.0%) |
| 5-Person Households | 244 (9.4%) | 0 (0.0%) |
| 6-Person Households | 94 (3.6%) | 0 (0.0%) |
| 7+ Person Households | 67 (2.6%) | 0 (0.0%) |
| Total | 1,809 (69.4%) | 796 (30.6%) |
Female Fertility in Bloomfield
Fertility by Age in Bloomfield
Average fertility rate in Bloomfield is 165.0 births per 1,000 women. Women in the age bracket of 20 to 34 years have the highest fertility rate with 253.0 births per 1,000 women. Women in the age bracket of 20 to 34 years acount for 91.3% of all women with births.
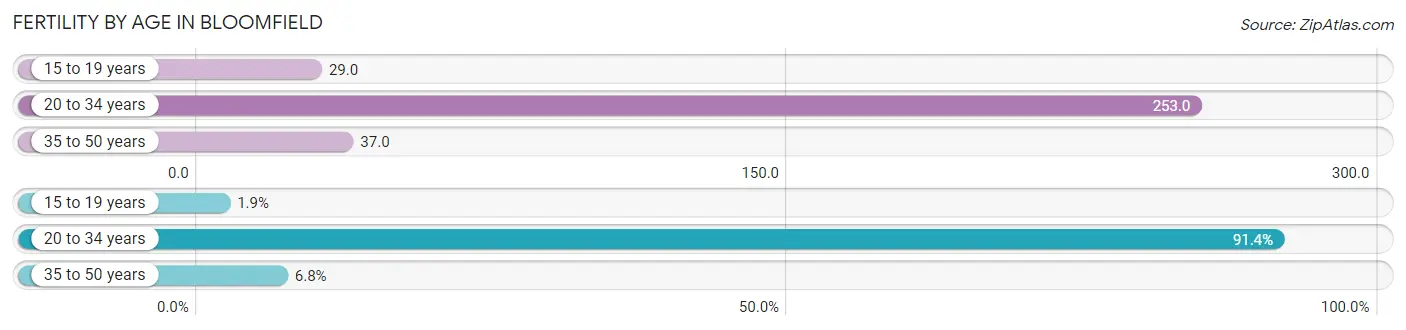
| Age Bracket | Women with Births | Births / 1,000 Women |
| 15 to 19 years | 5 (1.9%) | 29.0 |
| 20 to 34 years | 243 (91.3%) | 253.0 |
| 35 to 50 years | 18 (6.8%) | 37.0 |
| Total | 266 (100.0%) | 165.0 |
Fertility by Age by Marriage Status in Bloomfield
51.5% of women with births (266) in Bloomfield are married. The highest percentage of unmarried women with births falls into 15 to 19 years age bracket with 100.0% of them unmarried at the time of birth, while the lowest percentage of unmarried women with births belong to 20 to 34 years age bracket with 43.6% of them unmarried.
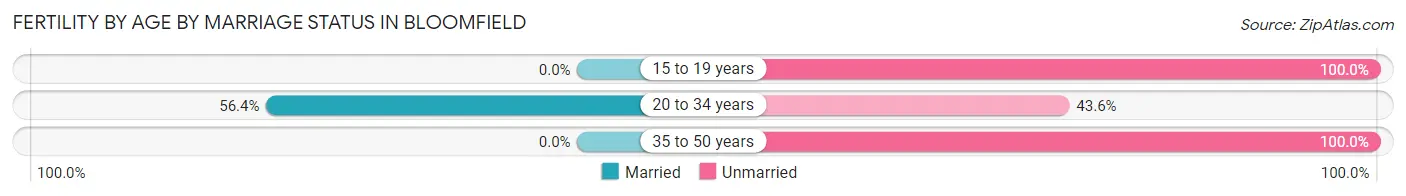
| Age Bracket | Married | Unmarried |
| 15 to 19 years | 0 (0.0%) | 5 (100.0%) |
| 20 to 34 years | 137 (56.4%) | 106 (43.6%) |
| 35 to 50 years | 0 (0.0%) | 18 (100.0%) |
| Total | 137 (51.5%) | 129 (48.5%) |
Fertility by Education in Bloomfield
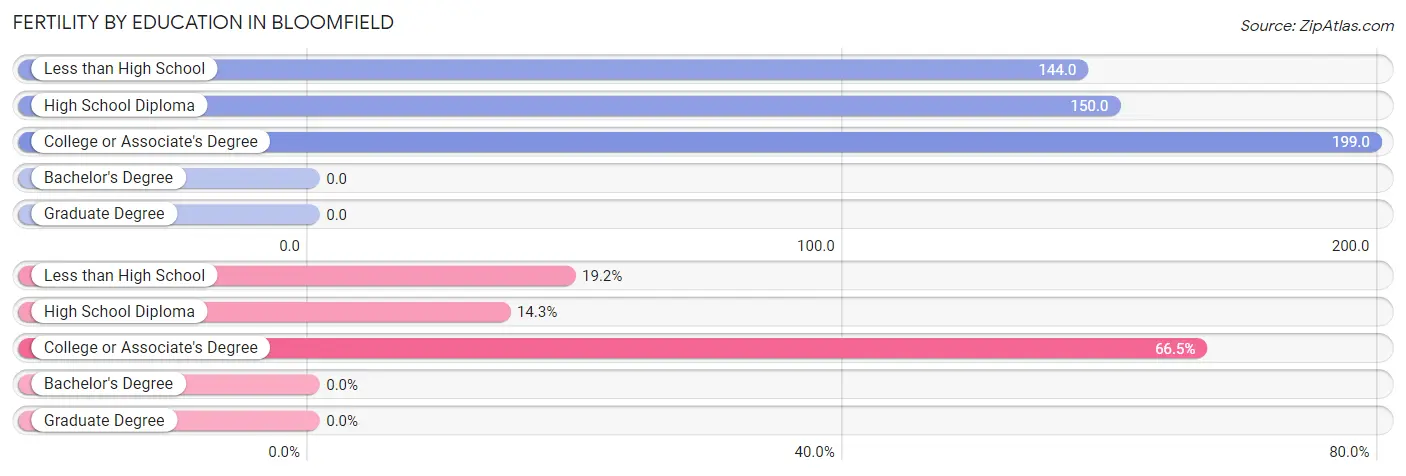
| Educational Attainment | Women with Births | Births / 1,000 Women |
| Less than High School | 51 (19.2%) | 144.0 |
| High School Diploma | 38 (14.3%) | 150.0 |
| College or Associate's Degree | 177 (66.5%) | 199.0 |
| Bachelor's Degree | 0 (0.0%) | 0.0 |
| Graduate Degree | 0 (0.0%) | 0.0 |
| Total | 266 (100.0%) | 165.0 |
Fertility by Education by Marriage Status in Bloomfield
48.5% of women with births in Bloomfield are unmarried. Women with the educational attainment of college or associate's degree are most likely to be married with 77.4% of them married at childbirth, while women with the educational attainment of less than high school are least likely to be married with 100.0% of them unmarried at childbirth.
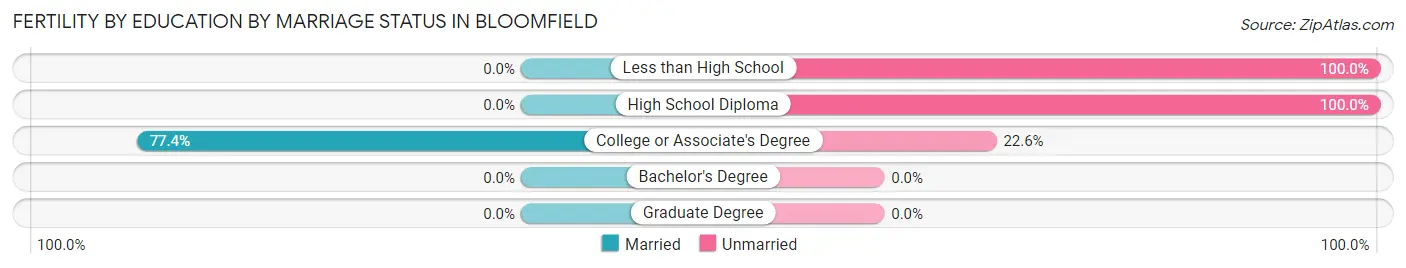
| Educational Attainment | Married | Unmarried |
| Less than High School | 0 (0.0%) | 51 (100.0%) |
| High School Diploma | 0 (0.0%) | 38 (100.0%) |
| College or Associate's Degree | 137 (77.4%) | 40 (22.6%) |
| Bachelor's Degree | 0 (0.0%) | 0 (0.0%) |
| Graduate Degree | 0 (0.0%) | 0 (0.0%) |
| Total | 137 (51.5%) | 129 (48.5%) |
Employment Characteristics in Bloomfield
Employment by Class of Employer in Bloomfield
Among the 2,977 employed individuals in Bloomfield, private company employees (1,825 | 61.3%), local government employees (485 | 16.3%), and state government employees (247 | 8.3%) make up the most common classes of employment.
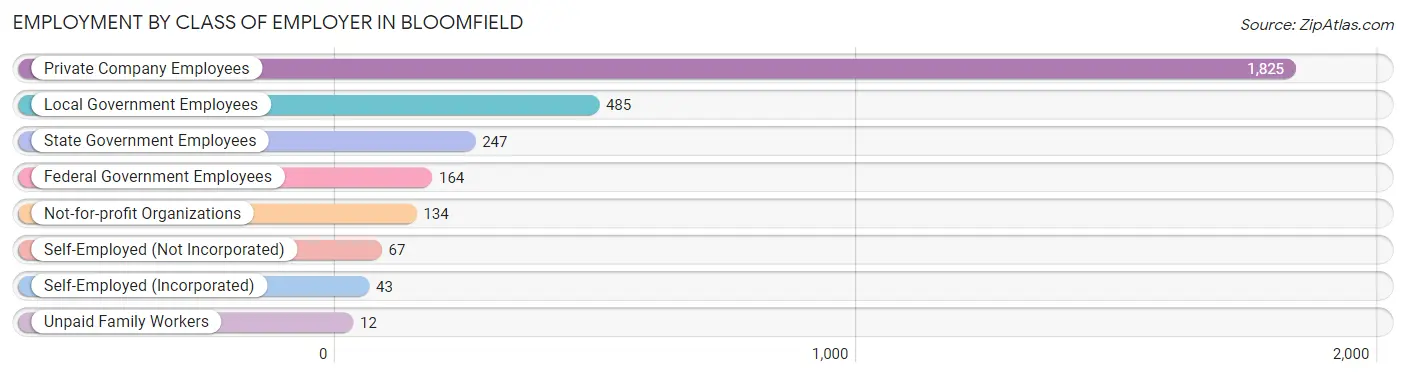
| Employer Class | # Employees | % Employees |
| Private Company Employees | 1,825 | 61.3% |
| Self-Employed (Incorporated) | 43 | 1.4% |
| Self-Employed (Not Incorporated) | 67 | 2.2% |
| Not-for-profit Organizations | 134 | 4.5% |
| Local Government Employees | 485 | 16.3% |
| State Government Employees | 247 | 8.3% |
| Federal Government Employees | 164 | 5.5% |
| Unpaid Family Workers | 12 | 0.4% |
| Total | 2,977 | 100.0% |
Employment Status by Age in Bloomfield
According to the labor force statistics for Bloomfield, out of the total population over 16 years of age (5,381), 58.0% or 3,121 individuals are in the labor force, with 3.0% or 94 of them unemployed. The age group with the highest labor force participation rate is 25 to 29 years, with 97.1% or 509 individuals in the labor force. Within the labor force, the 65 to 74 years age range has the highest percentage of unemployed individuals, with 12.0% or 12 of them being unemployed.
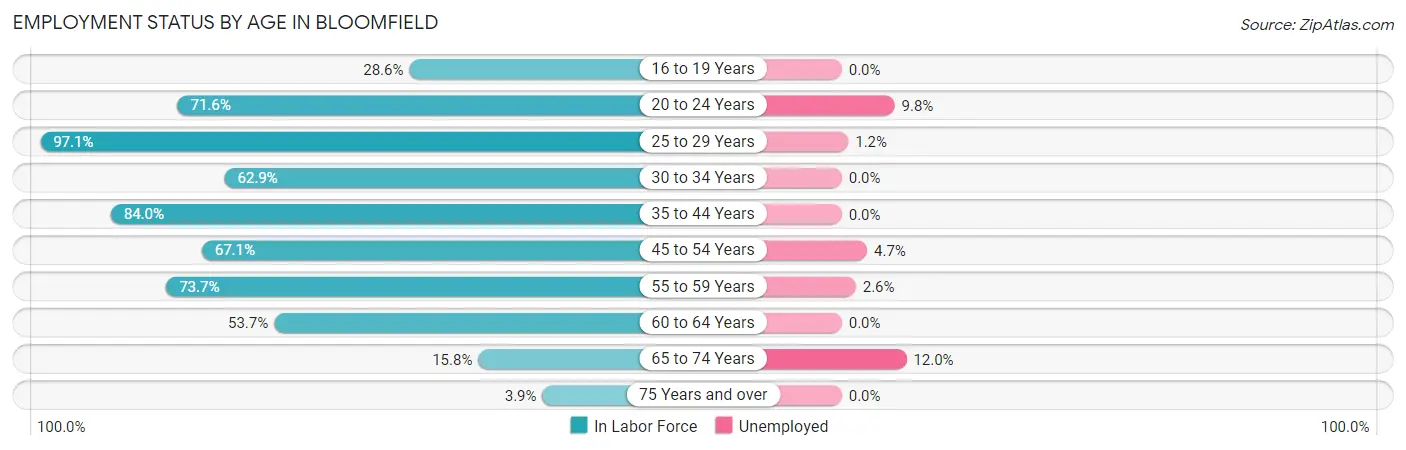
| Age Bracket | In Labor Force | Unemployed |
| 16 to 19 Years | 69 (28.6%) | 0 (0.0%) |
| 20 to 24 Years | 419 (71.6%) | 41 (9.8%) |
| 25 to 29 Years | 509 (97.1%) | 6 (1.2%) |
| 30 to 34 Years | 370 (62.9%) | 0 (0.0%) |
| 35 to 44 Years | 530 (84.0%) | 0 (0.0%) |
| 45 to 54 Years | 532 (67.1%) | 25 (4.7%) |
| 55 to 59 Years | 344 (73.7%) | 9 (2.6%) |
| 60 to 64 Years | 230 (53.7%) | 0 (0.0%) |
| 65 to 74 Years | 100 (15.8%) | 12 (12.0%) |
| 75 Years and over | 19 (3.9%) | 0 (0.0%) |
| Total | 3,121 (58.0%) | 94 (3.0%) |
Employment Status by Educational Attainment in Bloomfield
According to labor force statistics for Bloomfield, 73.3% of individuals (2,515) out of the total population between 25 and 64 years of age (3,431) are in the labor force, with 1.6% or 40 of them being unemployed. The group with the highest labor force participation rate are those with the educational attainment of bachelor's degree or higher, with 80.7% or 384 individuals in the labor force. Within the labor force, individuals with high school diploma education have the highest percentage of unemployment, with 2.5% or 17 of them being unemployed.
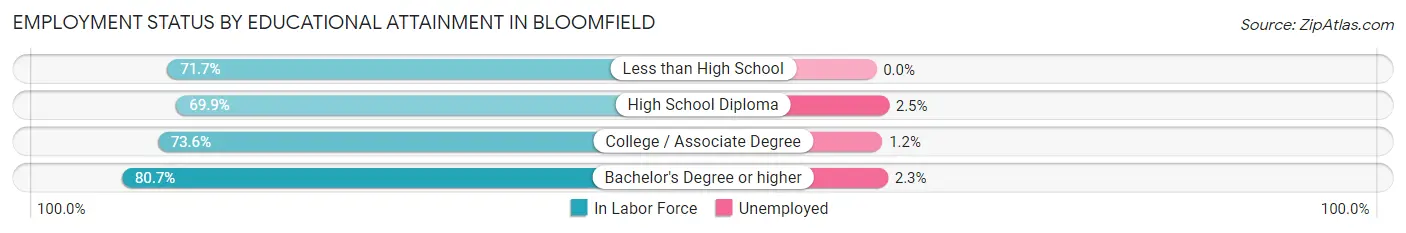
| Educational Attainment | In Labor Force | Unemployed |
| Less than High School | 329 (71.7%) | 0 (0.0%) |
| High School Diploma | 670 (69.9%) | 24 (2.5%) |
| College / Associate Degree | 1,132 (73.6%) | 18 (1.2%) |
| Bachelor's Degree or higher | 384 (80.7%) | 11 (2.3%) |
| Total | 2,515 (73.3%) | 55 (1.6%) |
Employment Occupations by Sex in Bloomfield
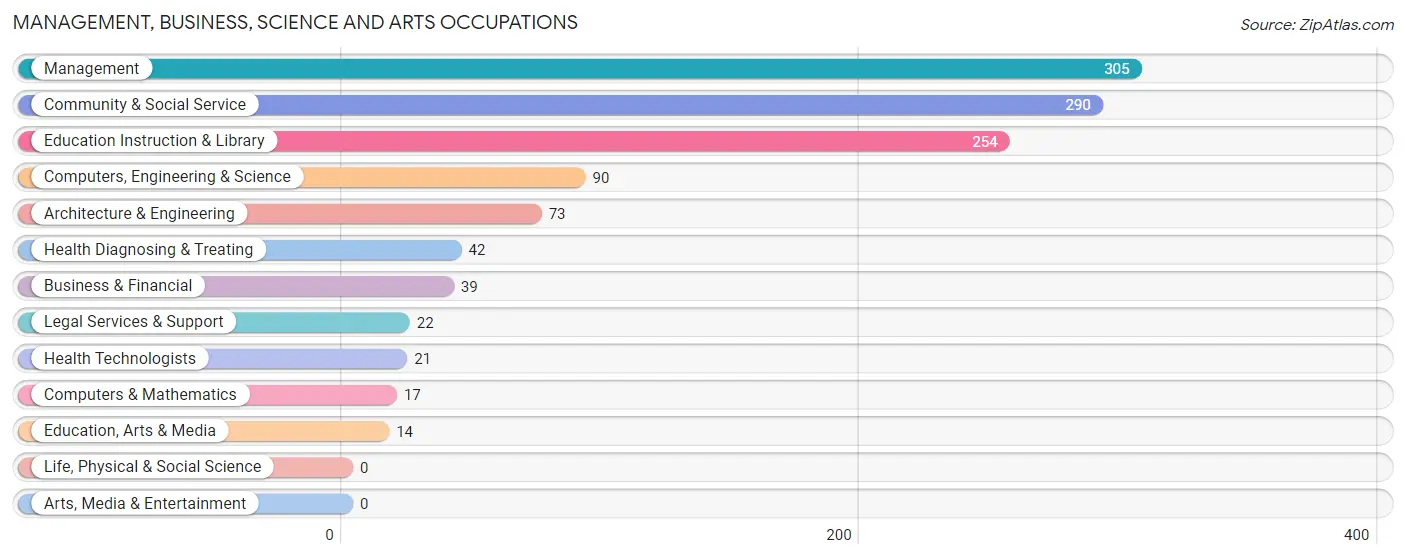
Management, Business, Science and Arts Occupations
The most common Management, Business, Science and Arts occupations in Bloomfield are Management (305 | 10.1%), Community & Social Service (290 | 9.6%), Education Instruction & Library (254 | 8.4%), Computers, Engineering & Science (90 | 3.0%), and Architecture & Engineering (73 | 2.4%).
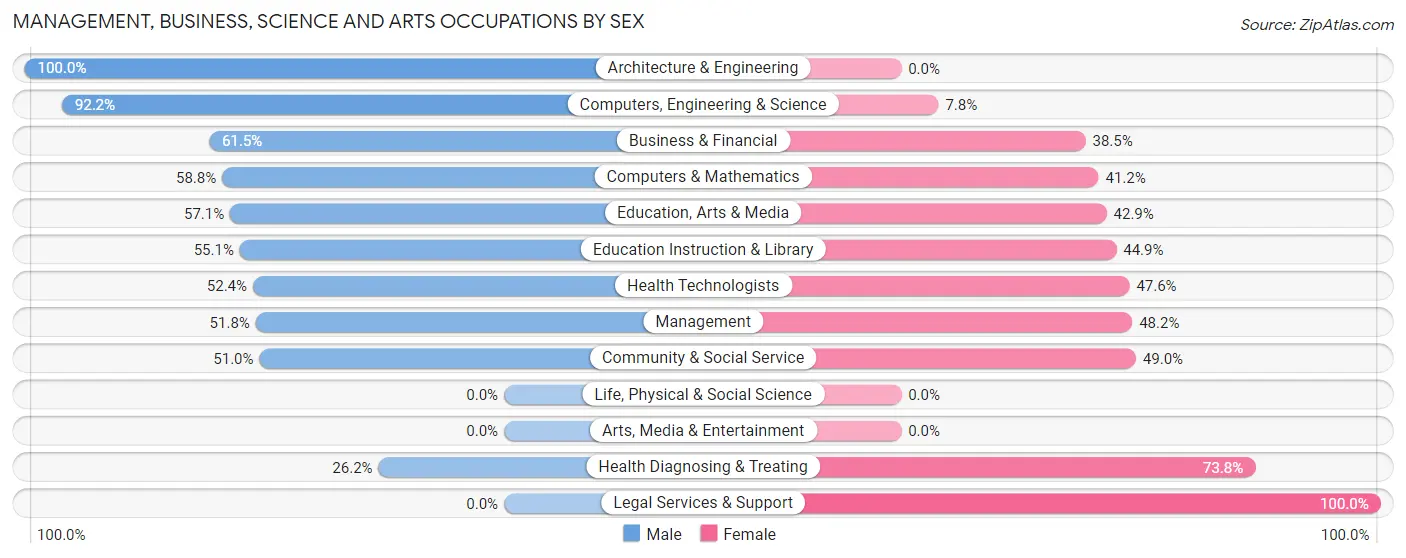
Management, Business, Science and Arts Occupations by Sex
Within the Management, Business, Science and Arts occupations in Bloomfield, the most male-oriented occupations are Architecture & Engineering (100.0%), Computers, Engineering & Science (92.2%), and Business & Financial (61.5%), while the most female-oriented occupations are Legal Services & Support (100.0%), Health Diagnosing & Treating (73.8%), and Community & Social Service (49.0%).
| Occupation | Male | Female |
| Management | 158 (51.8%) | 147 (48.2%) |
| Business & Financial | 24 (61.5%) | 15 (38.5%) |
| Computers, Engineering & Science | 83 (92.2%) | 7 (7.8%) |
| Computers & Mathematics | 10 (58.8%) | 7 (41.2%) |
| Architecture & Engineering | 73 (100.0%) | 0 (0.0%) |
| Life, Physical & Social Science | 0 (0.0%) | 0 (0.0%) |
| Community & Social Service | 148 (51.0%) | 142 (49.0%) |
| Education, Arts & Media | 8 (57.1%) | 6 (42.9%) |
| Legal Services & Support | 0 (0.0%) | 22 (100.0%) |
| Education Instruction & Library | 140 (55.1%) | 114 (44.9%) |
| Arts, Media & Entertainment | 0 (0.0%) | 0 (0.0%) |
| Health Diagnosing & Treating | 11 (26.2%) | 31 (73.8%) |
| Health Technologists | 11 (52.4%) | 10 (47.6%) |
| Total (Category) | 424 (55.3%) | 342 (44.7%) |
| Total (Overall) | 1,521 (50.2%) | 1,508 (49.8%) |
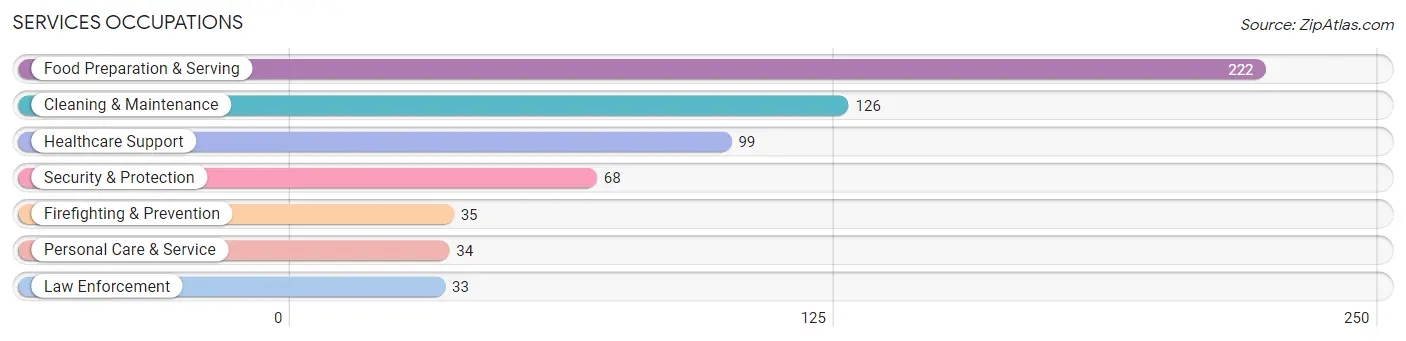
Services Occupations
The most common Services occupations in Bloomfield are Food Preparation & Serving (222 | 7.3%), Cleaning & Maintenance (126 | 4.2%), Healthcare Support (99 | 3.3%), Security & Protection (68 | 2.2%), and Firefighting & Prevention (35 | 1.2%).
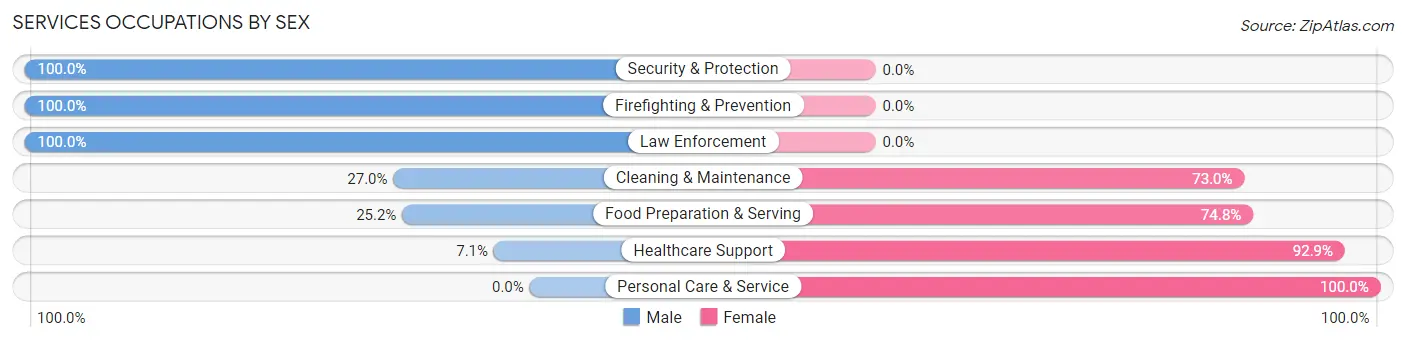
Services Occupations by Sex
Within the Services occupations in Bloomfield, the most male-oriented occupations are Security & Protection (100.0%), Firefighting & Prevention (100.0%), and Law Enforcement (100.0%), while the most female-oriented occupations are Personal Care & Service (100.0%), Healthcare Support (92.9%), and Food Preparation & Serving (74.8%).
| Occupation | Male | Female |
| Healthcare Support | 7 (7.1%) | 92 (92.9%) |
| Security & Protection | 68 (100.0%) | 0 (0.0%) |
| Firefighting & Prevention | 35 (100.0%) | 0 (0.0%) |
| Law Enforcement | 33 (100.0%) | 0 (0.0%) |
| Food Preparation & Serving | 56 (25.2%) | 166 (74.8%) |
| Cleaning & Maintenance | 34 (27.0%) | 92 (73.0%) |
| Personal Care & Service | 0 (0.0%) | 34 (100.0%) |
| Total (Category) | 165 (30.0%) | 384 (70.0%) |
| Total (Overall) | 1,521 (50.2%) | 1,508 (49.8%) |
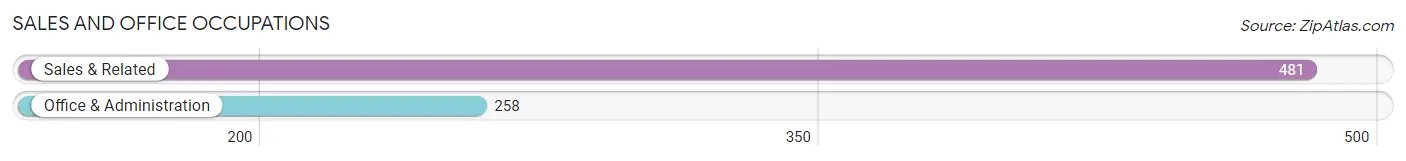
Sales and Office Occupations
The most common Sales and Office occupations in Bloomfield are Sales & Related (481 | 15.9%), and Office & Administration (258 | 8.5%).
Sales and Office Occupations by Sex
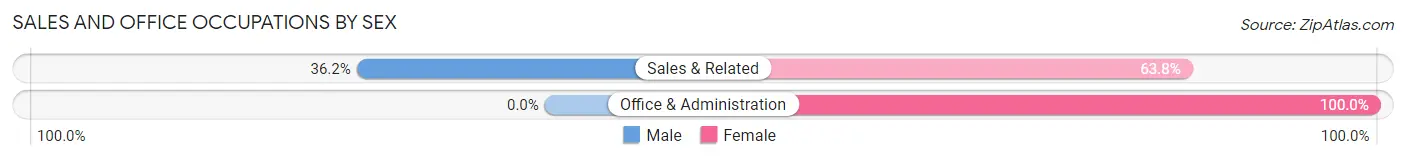
| Occupation | Male | Female |
| Sales & Related | 174 (36.2%) | 307 (63.8%) |
| Office & Administration | 0 (0.0%) | 258 (100.0%) |
| Total (Category) | 174 (23.5%) | 565 (76.4%) |
| Total (Overall) | 1,521 (50.2%) | 1,508 (49.8%) |
Natural Resources, Construction and Maintenance Occupations
The most common Natural Resources, Construction and Maintenance occupations in Bloomfield are Construction & Extraction (322 | 10.6%), Installation, Maintenance & Repair (109 | 3.6%), and Farming, Fishing & Forestry (32 | 1.1%).

Natural Resources, Construction and Maintenance Occupations by Sex
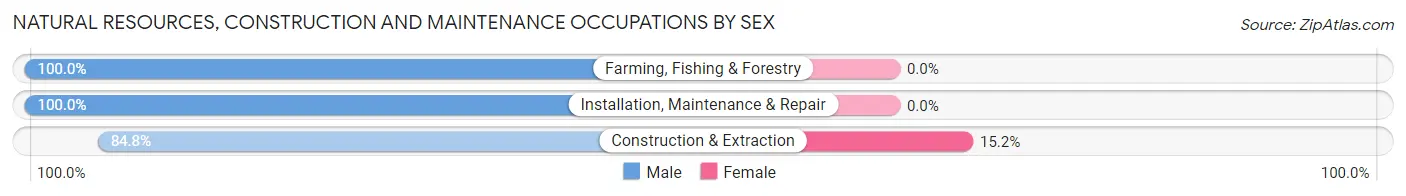
| Occupation | Male | Female |
| Farming, Fishing & Forestry | 32 (100.0%) | 0 (0.0%) |
| Construction & Extraction | 273 (84.8%) | 49 (15.2%) |
| Installation, Maintenance & Repair | 109 (100.0%) | 0 (0.0%) |
| Total (Category) | 414 (89.4%) | 49 (10.6%) |
| Total (Overall) | 1,521 (50.2%) | 1,508 (49.8%) |
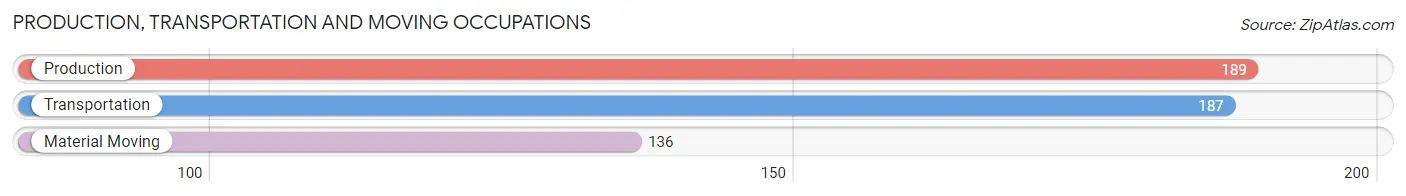
Production, Transportation and Moving Occupations
The most common Production, Transportation and Moving occupations in Bloomfield are Production (189 | 6.2%), Transportation (187 | 6.2%), and Material Moving (136 | 4.5%).
Production, Transportation and Moving Occupations by Sex
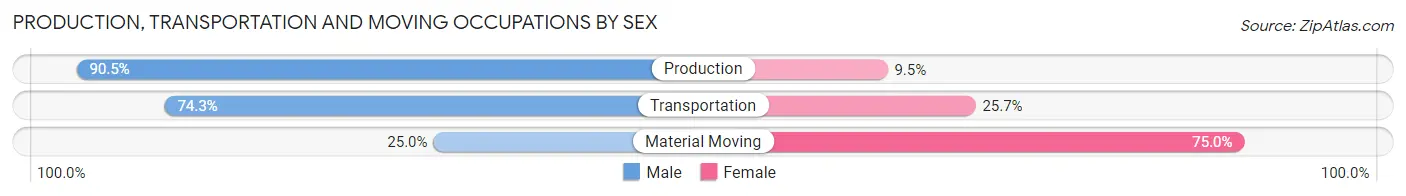
| Occupation | Male | Female |
| Production | 171 (90.5%) | 18 (9.5%) |
| Transportation | 139 (74.3%) | 48 (25.7%) |
| Material Moving | 34 (25.0%) | 102 (75.0%) |
| Total (Category) | 344 (67.2%) | 168 (32.8%) |
| Total (Overall) | 1,521 (50.2%) | 1,508 (49.8%) |
Employment Industries by Sex in Bloomfield
Employment Industries in Bloomfield
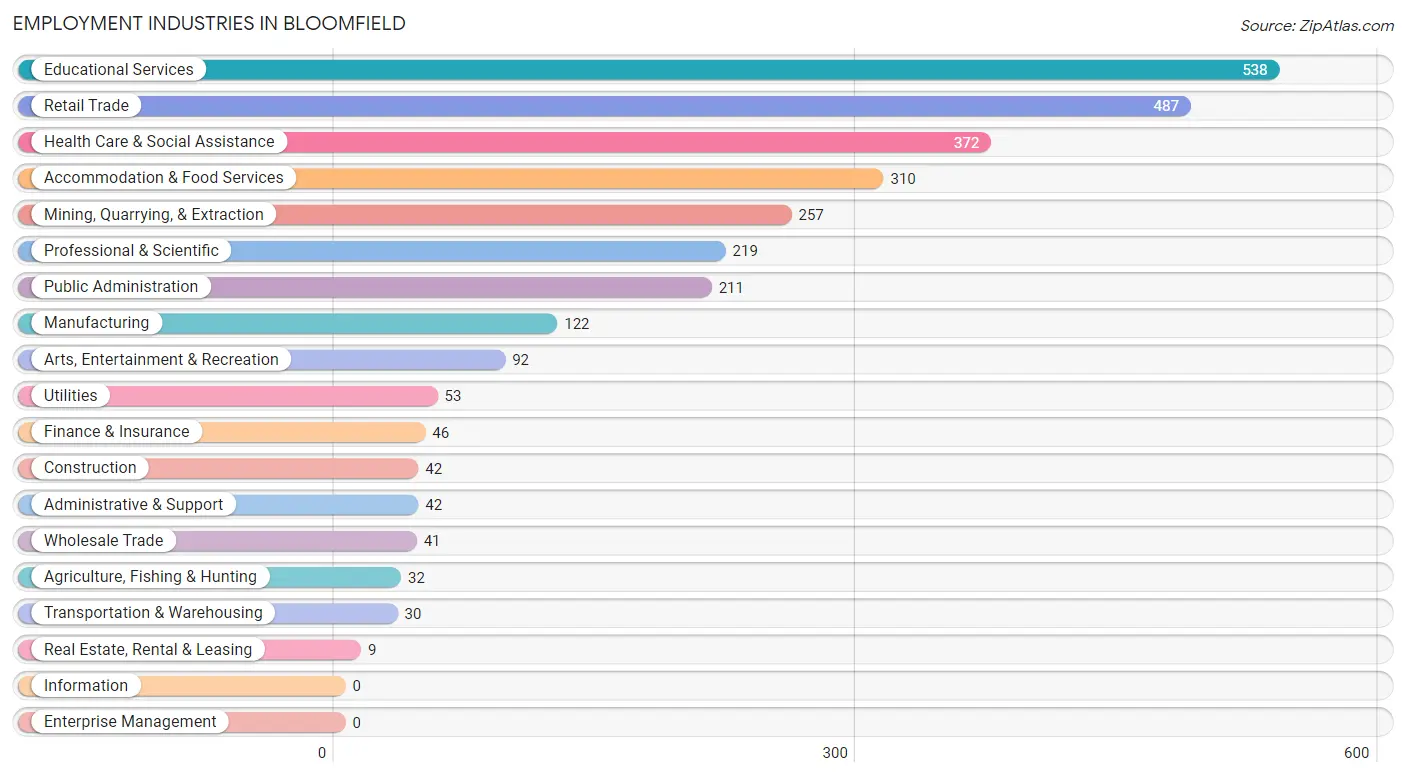
The major employment industries in Bloomfield include Educational Services (538 | 17.8%), Retail Trade (487 | 16.1%), Health Care & Social Assistance (372 | 12.3%), Accommodation & Food Services (310 | 10.2%), and Mining, Quarrying, & Extraction (257 | 8.5%).
Employment Industries by Sex in Bloomfield
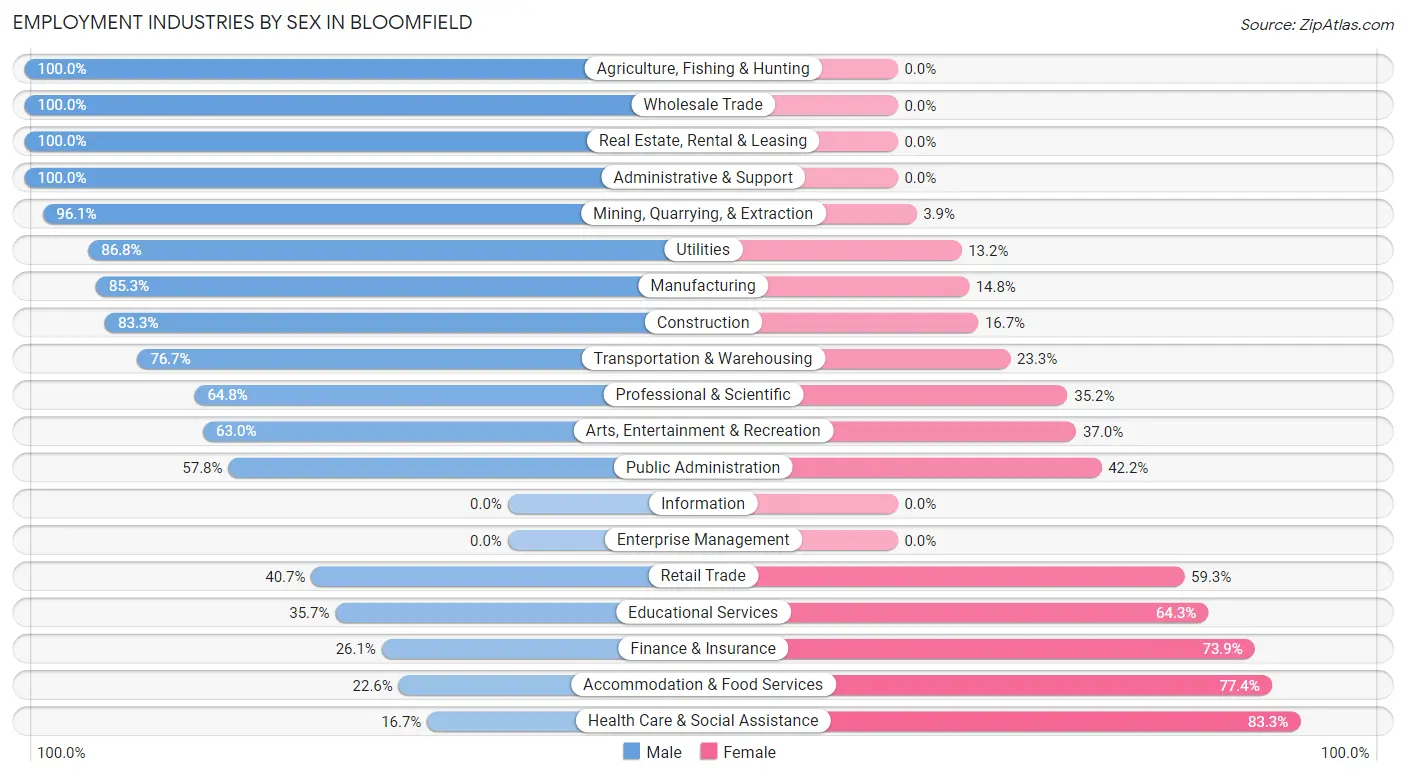
The Bloomfield industries that see more men than women are Agriculture, Fishing & Hunting (100.0%), Wholesale Trade (100.0%), and Real Estate, Rental & Leasing (100.0%), whereas the industries that tend to have a higher number of women are Health Care & Social Assistance (83.3%), Accommodation & Food Services (77.4%), and Finance & Insurance (73.9%).
| Industry | Male | Female |
| Agriculture, Fishing & Hunting | 32 (100.0%) | 0 (0.0%) |
| Mining, Quarrying, & Extraction | 247 (96.1%) | 10 (3.9%) |
| Construction | 35 (83.3%) | 7 (16.7%) |
| Manufacturing | 104 (85.3%) | 18 (14.7%) |
| Wholesale Trade | 41 (100.0%) | 0 (0.0%) |
| Retail Trade | 198 (40.7%) | 289 (59.3%) |
| Transportation & Warehousing | 23 (76.7%) | 7 (23.3%) |
| Utilities | 46 (86.8%) | 7 (13.2%) |
| Information | 0 (0.0%) | 0 (0.0%) |
| Finance & Insurance | 12 (26.1%) | 34 (73.9%) |
| Real Estate, Rental & Leasing | 9 (100.0%) | 0 (0.0%) |
| Professional & Scientific | 142 (64.8%) | 77 (35.2%) |
| Enterprise Management | 0 (0.0%) | 0 (0.0%) |
| Administrative & Support | 42 (100.0%) | 0 (0.0%) |
| Educational Services | 192 (35.7%) | 346 (64.3%) |
| Health Care & Social Assistance | 62 (16.7%) | 310 (83.3%) |
| Arts, Entertainment & Recreation | 58 (63.0%) | 34 (37.0%) |
| Accommodation & Food Services | 70 (22.6%) | 240 (77.4%) |
| Public Administration | 122 (57.8%) | 89 (42.2%) |
| Total | 1,521 (50.2%) | 1,508 (49.8%) |
Education in Bloomfield
School Enrollment in Bloomfield
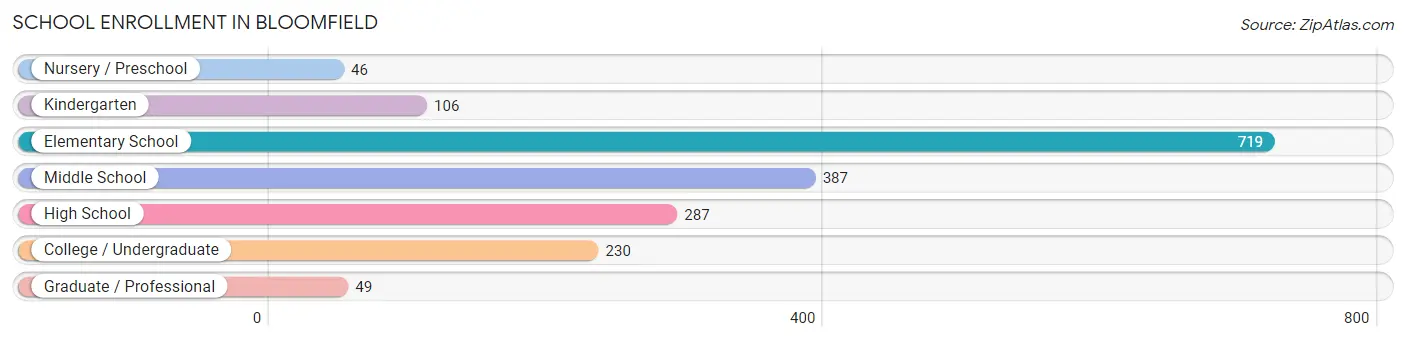
The most common levels of schooling among the 1,824 students in Bloomfield are elementary school (719 | 39.4%), middle school (387 | 21.2%), and high school (287 | 15.7%).
| School Level | # Students | % Students |
| Nursery / Preschool | 46 | 2.5% |
| Kindergarten | 106 | 5.8% |
| Elementary School | 719 | 39.4% |
| Middle School | 387 | 21.2% |
| High School | 287 | 15.7% |
| College / Undergraduate | 230 | 12.6% |
| Graduate / Professional | 49 | 2.7% |
| Total | 1,824 | 100.0% |
School Enrollment by Age by Funding Source in Bloomfield
Out of a total of 1,824 students who are enrolled in schools in Bloomfield, 166 (9.1%) attend a private institution, while the remaining 1,658 (90.9%) are enrolled in public schools. The age group of 5 to 9 year old has the highest likelihood of being enrolled in private schools, with 101 (13.8% in the age bracket) enrolled. Conversely, the age group of 3 to 4 year olds has the lowest likelihood of being enrolled in a private school, with 46 (100.0% in the age bracket) attending a public institution.
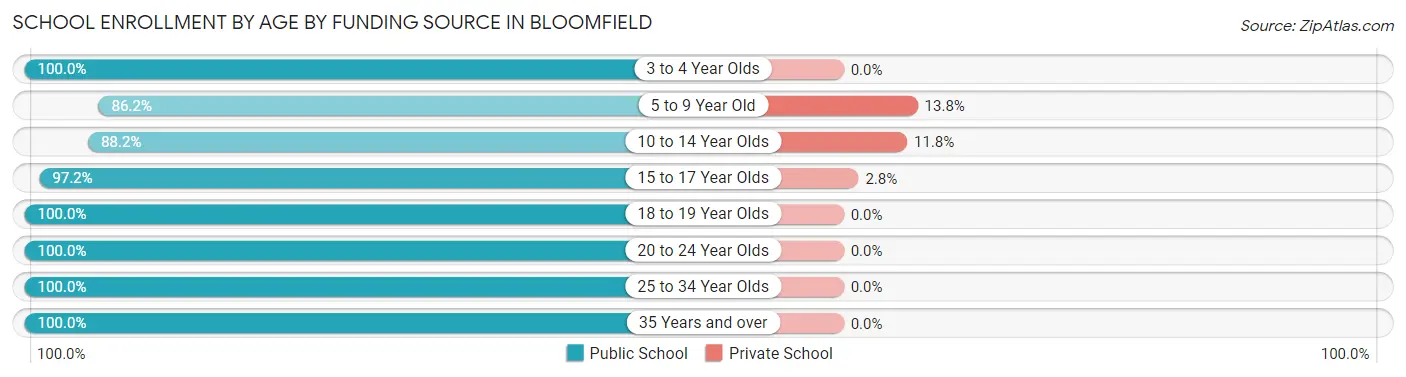
| Age Bracket | Public School | Private School |
| 3 to 4 Year Olds | 46 (100.0%) | 0 (0.0%) |
| 5 to 9 Year Old | 632 (86.2%) | 101 (13.8%) |
| 10 to 14 Year Olds | 448 (88.2%) | 60 (11.8%) |
| 15 to 17 Year Olds | 176 (97.2%) | 5 (2.8%) |
| 18 to 19 Year Olds | 68 (100.0%) | 0 (0.0%) |
| 20 to 24 Year Olds | 93 (100.0%) | 0 (0.0%) |
| 25 to 34 Year Olds | 114 (100.0%) | 0 (0.0%) |
| 35 Years and over | 81 (100.0%) | 0 (0.0%) |
| Total | 1,658 (90.9%) | 166 (9.1%) |
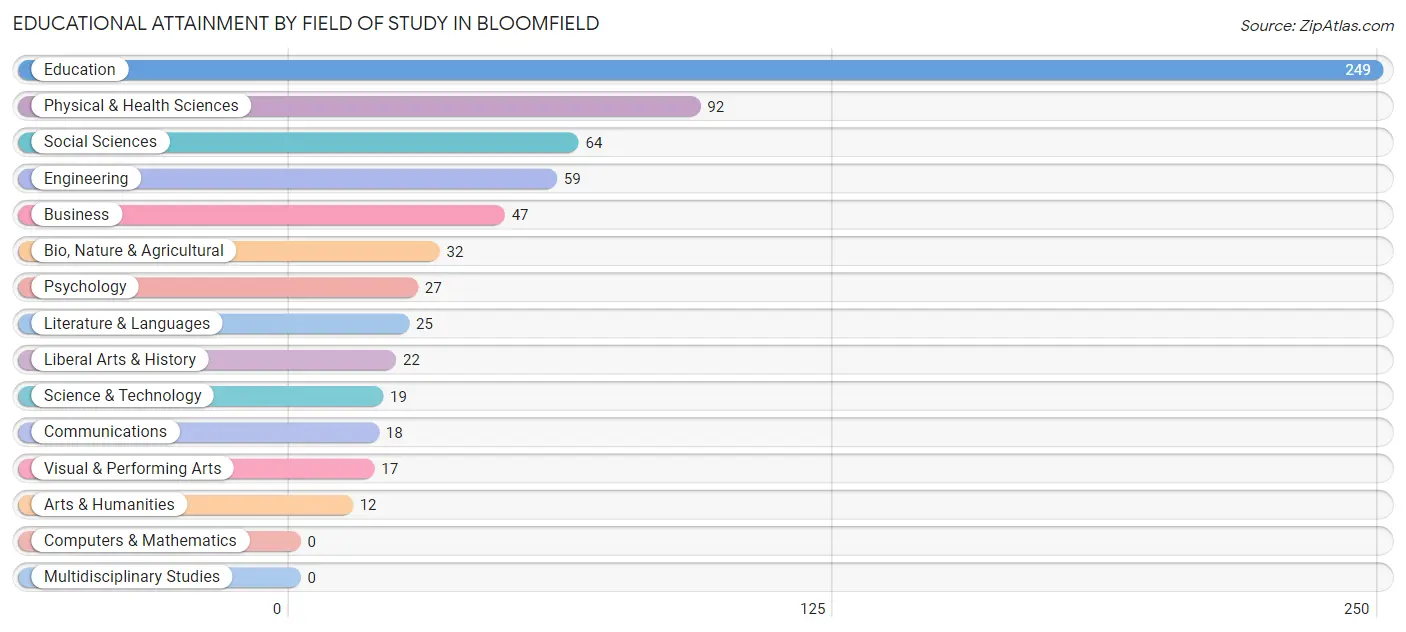
Educational Attainment by Field of Study in Bloomfield
Education (249 | 36.5%), physical & health sciences (92 | 13.5%), social sciences (64 | 9.4%), engineering (59 | 8.6%), and business (47 | 6.9%) are the most common fields of study among 683 individuals in Bloomfield who have obtained a bachelor's degree or higher.
| Field of Study | # Graduates | % Graduates |
| Computers & Mathematics | 0 | 0.0% |
| Bio, Nature & Agricultural | 32 | 4.7% |
| Physical & Health Sciences | 92 | 13.5% |
| Psychology | 27 | 4.0% |
| Social Sciences | 64 | 9.4% |
| Engineering | 59 | 8.6% |
| Multidisciplinary Studies | 0 | 0.0% |
| Science & Technology | 19 | 2.8% |
| Business | 47 | 6.9% |
| Education | 249 | 36.5% |
| Literature & Languages | 25 | 3.7% |
| Liberal Arts & History | 22 | 3.2% |
| Visual & Performing Arts | 17 | 2.5% |
| Communications | 18 | 2.6% |
| Arts & Humanities | 12 | 1.8% |
| Total | 683 | 100.0% |
Transportation & Commute in Bloomfield
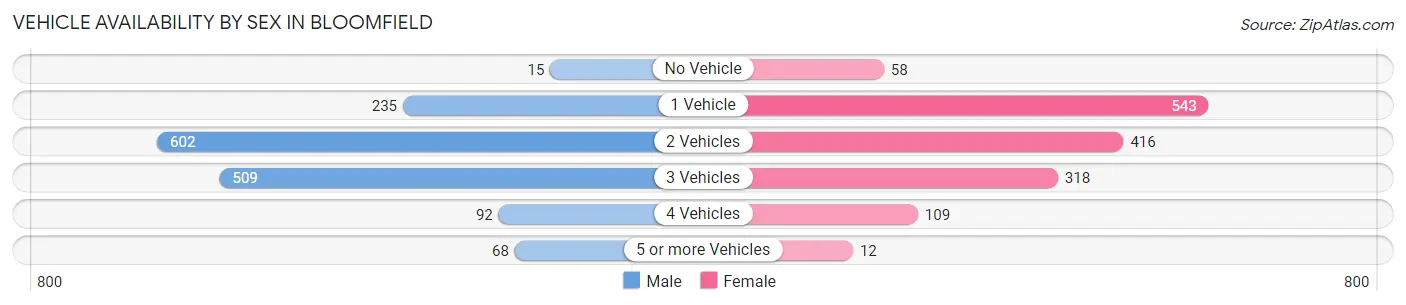
Vehicle Availability by Sex in Bloomfield
The most prevalent vehicle ownership categories in Bloomfield are males with 2 vehicles (602, accounting for 39.6%) and females with 2 vehicles (416, making up 41.3%).
| Vehicles Available | Male | Female |
| No Vehicle | 15 (1.0%) | 58 (4.0%) |
| 1 Vehicle | 235 (15.4%) | 543 (37.3%) |
| 2 Vehicles | 602 (39.6%) | 416 (28.6%) |
| 3 Vehicles | 509 (33.5%) | 318 (21.8%) |
| 4 Vehicles | 92 (6.0%) | 109 (7.5%) |
| 5 or more Vehicles | 68 (4.5%) | 12 (0.8%) |
| Total | 1,521 (100.0%) | 1,456 (100.0%) |
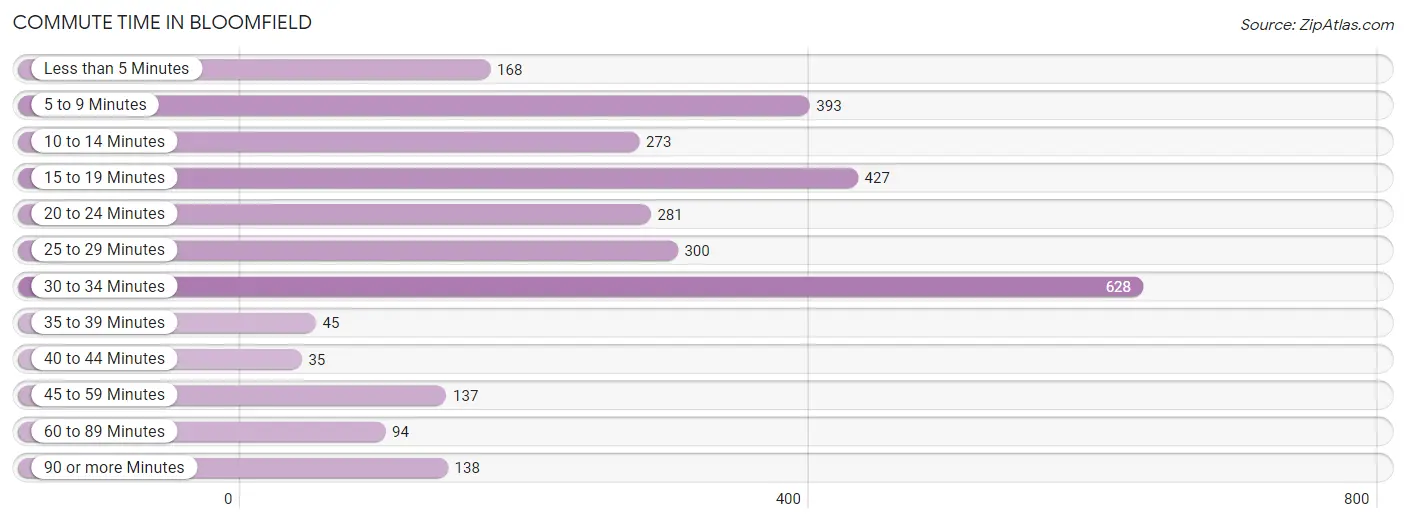
Commute Time in Bloomfield
The most frequently occuring commute durations in Bloomfield are 30 to 34 minutes (628 commuters, 21.5%), 15 to 19 minutes (427 commuters, 14.6%), and 5 to 9 minutes (393 commuters, 13.5%).
| Commute Time | # Commuters | % Commuters |
| Less than 5 Minutes | 168 | 5.8% |
| 5 to 9 Minutes | 393 | 13.5% |
| 10 to 14 Minutes | 273 | 9.3% |
| 15 to 19 Minutes | 427 | 14.6% |
| 20 to 24 Minutes | 281 | 9.6% |
| 25 to 29 Minutes | 300 | 10.3% |
| 30 to 34 Minutes | 628 | 21.5% |
| 35 to 39 Minutes | 45 | 1.5% |
| 40 to 44 Minutes | 35 | 1.2% |
| 45 to 59 Minutes | 137 | 4.7% |
| 60 to 89 Minutes | 94 | 3.2% |
| 90 or more Minutes | 138 | 4.7% |
Commute Time by Sex in Bloomfield
The most common commute times in Bloomfield are 15 to 19 minutes (338 commuters, 22.8%) for males and 30 to 34 minutes (316 commuters, 22.0%) for females.
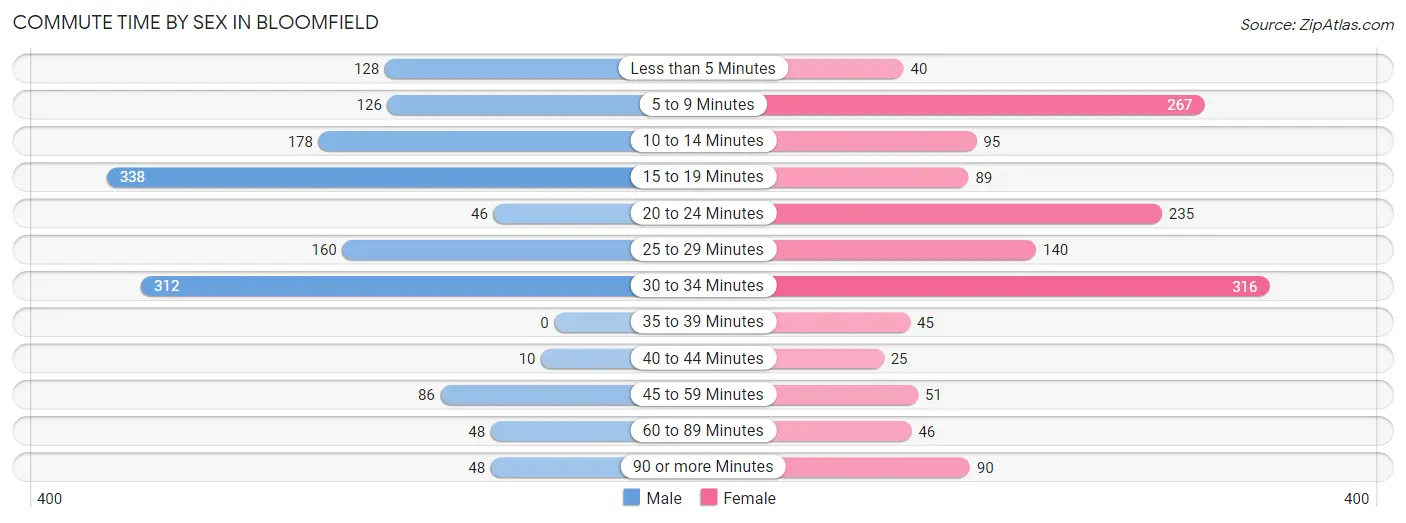
| Commute Time | Male | Female |
| Less than 5 Minutes | 128 (8.6%) | 40 (2.8%) |
| 5 to 9 Minutes | 126 (8.5%) | 267 (18.5%) |
| 10 to 14 Minutes | 178 (12.0%) | 95 (6.6%) |
| 15 to 19 Minutes | 338 (22.8%) | 89 (6.2%) |
| 20 to 24 Minutes | 46 (3.1%) | 235 (16.3%) |
| 25 to 29 Minutes | 160 (10.8%) | 140 (9.7%) |
| 30 to 34 Minutes | 312 (21.1%) | 316 (22.0%) |
| 35 to 39 Minutes | 0 (0.0%) | 45 (3.1%) |
| 40 to 44 Minutes | 10 (0.7%) | 25 (1.7%) |
| 45 to 59 Minutes | 86 (5.8%) | 51 (3.5%) |
| 60 to 89 Minutes | 48 (3.2%) | 46 (3.2%) |
| 90 or more Minutes | 48 (3.2%) | 90 (6.2%) |
Time of Departure to Work by Sex in Bloomfield
The most frequent times of departure to work in Bloomfield are 7:00 AM to 7:29 AM (348, 23.5%) for males and 7:00 AM to 7:29 AM (370, 25.7%) for females.
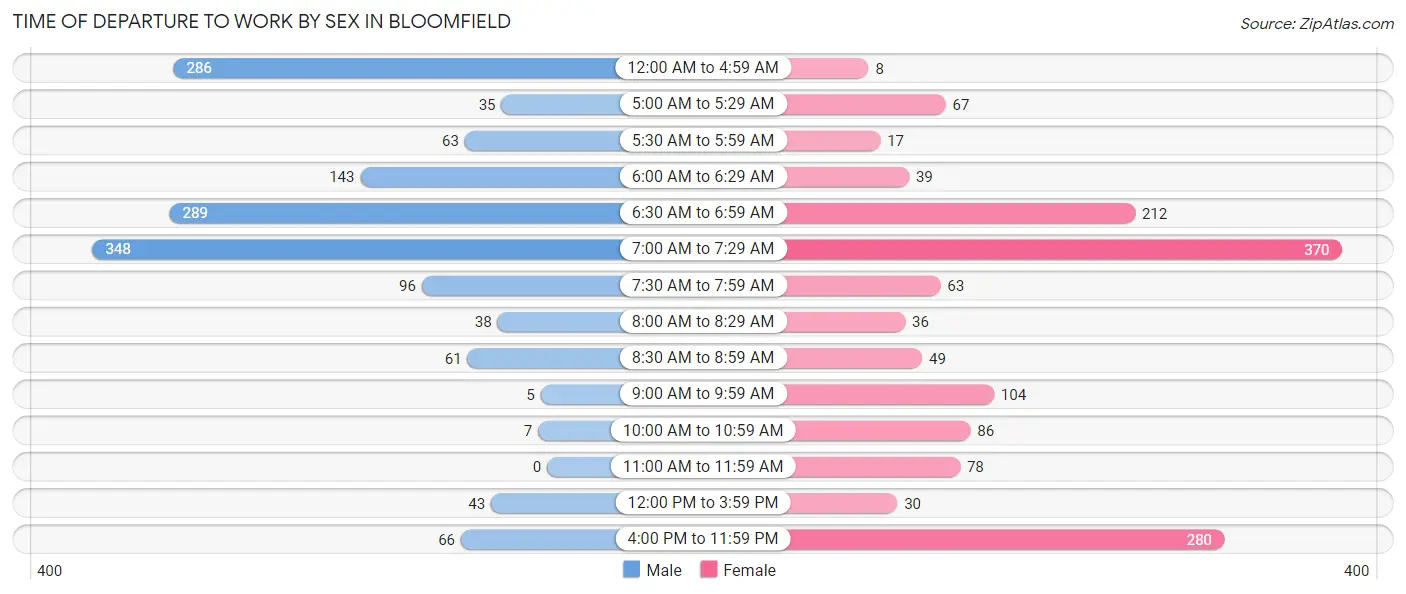
| Time of Departure | Male | Female |
| 12:00 AM to 4:59 AM | 286 (19.3%) | 8 (0.6%) |
| 5:00 AM to 5:29 AM | 35 (2.4%) | 67 (4.7%) |
| 5:30 AM to 5:59 AM | 63 (4.3%) | 17 (1.2%) |
| 6:00 AM to 6:29 AM | 143 (9.7%) | 39 (2.7%) |
| 6:30 AM to 6:59 AM | 289 (19.5%) | 212 (14.7%) |
| 7:00 AM to 7:29 AM | 348 (23.5%) | 370 (25.7%) |
| 7:30 AM to 7:59 AM | 96 (6.5%) | 63 (4.4%) |
| 8:00 AM to 8:29 AM | 38 (2.6%) | 36 (2.5%) |
| 8:30 AM to 8:59 AM | 61 (4.1%) | 49 (3.4%) |
| 9:00 AM to 9:59 AM | 5 (0.3%) | 104 (7.2%) |
| 10:00 AM to 10:59 AM | 7 (0.5%) | 86 (6.0%) |
| 11:00 AM to 11:59 AM | 0 (0.0%) | 78 (5.4%) |
| 12:00 PM to 3:59 PM | 43 (2.9%) | 30 (2.1%) |
| 4:00 PM to 11:59 PM | 66 (4.5%) | 280 (19.5%) |
| Total | 1,480 (100.0%) | 1,439 (100.0%) |
Housing Occupancy in Bloomfield
Occupancy by Ownership in Bloomfield
Of the total 2,605 dwellings in Bloomfield, owner-occupied units account for 1,848 (70.9%), while renter-occupied units make up 757 (29.1%).
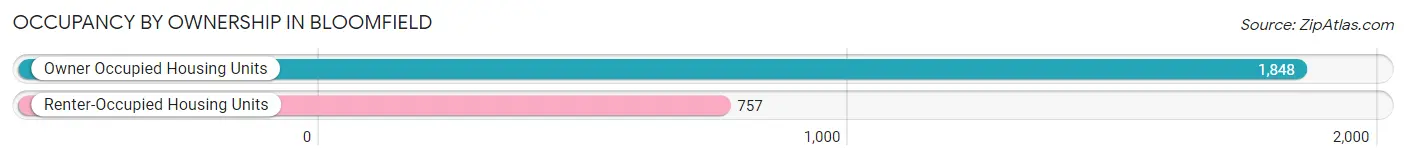
| Occupancy | # Housing Units | % Housing Units |
| Owner Occupied Housing Units | 1,848 | 70.9% |
| Renter-Occupied Housing Units | 757 | 29.1% |
| Total Occupied Housing Units | 2,605 | 100.0% |
Occupancy by Household Size in Bloomfield
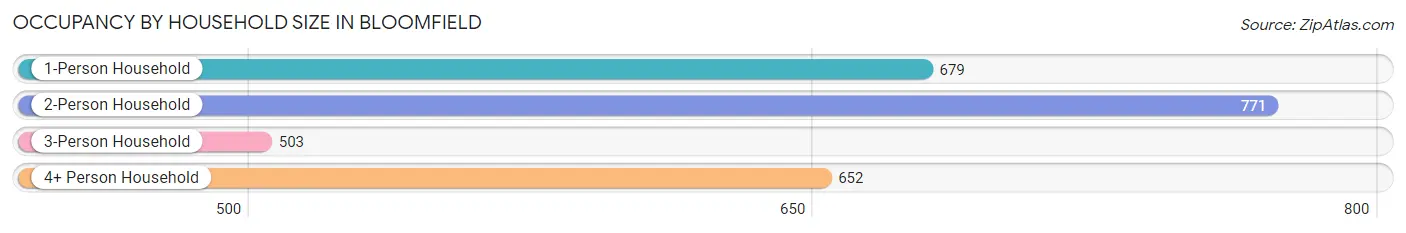
| Household Size | # Housing Units | % Housing Units |
| 1-Person Household | 679 | 26.1% |
| 2-Person Household | 771 | 29.6% |
| 3-Person Household | 503 | 19.3% |
| 4+ Person Household | 652 | 25.0% |
| Total Housing Units | 2,605 | 100.0% |
Occupancy by Ownership by Household Size in Bloomfield
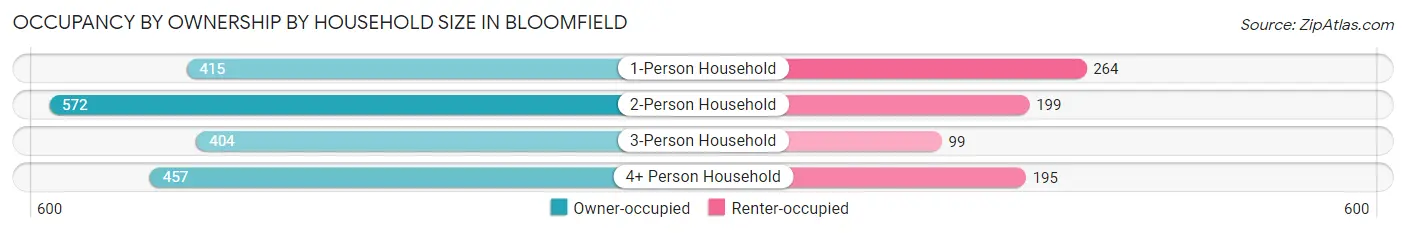
| Household Size | Owner-occupied | Renter-occupied |
| 1-Person Household | 415 (61.1%) | 264 (38.9%) |
| 2-Person Household | 572 (74.2%) | 199 (25.8%) |
| 3-Person Household | 404 (80.3%) | 99 (19.7%) |
| 4+ Person Household | 457 (70.1%) | 195 (29.9%) |
| Total Housing Units | 1,848 (70.9%) | 757 (29.1%) |
Occupancy by Educational Attainment in Bloomfield
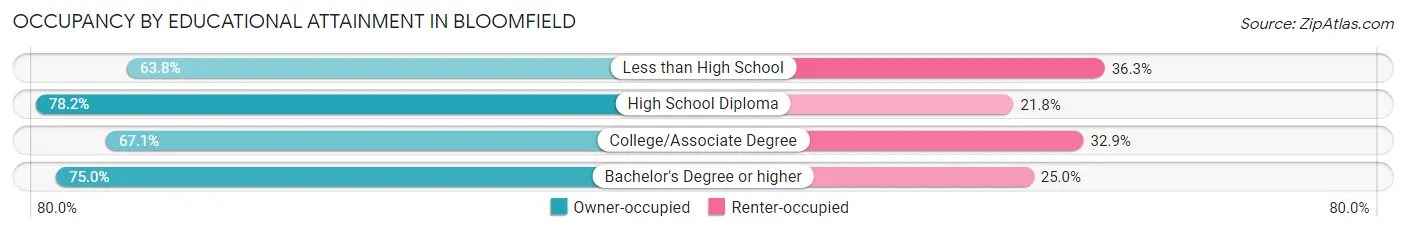
| Household Size | Owner-occupied | Renter-occupied |
| Less than High School | 160 (63.7%) | 91 (36.2%) |
| High School Diploma | 520 (78.2%) | 145 (21.8%) |
| College/Associate Degree | 838 (67.1%) | 411 (32.9%) |
| Bachelor's Degree or higher | 330 (75.0%) | 110 (25.0%) |
Occupancy by Age of Householder in Bloomfield
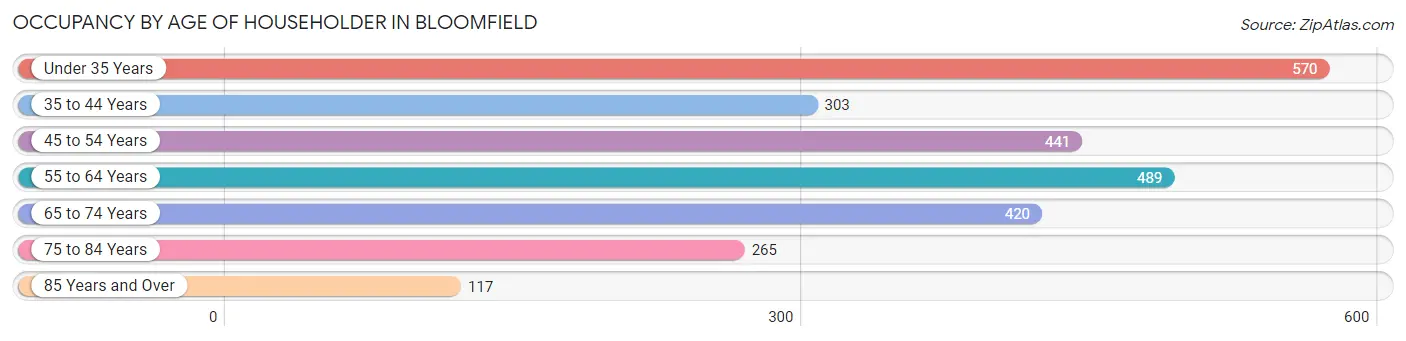
| Age Bracket | # Households | % Households |
| Under 35 Years | 570 | 21.9% |
| 35 to 44 Years | 303 | 11.6% |
| 45 to 54 Years | 441 | 16.9% |
| 55 to 64 Years | 489 | 18.8% |
| 65 to 74 Years | 420 | 16.1% |
| 75 to 84 Years | 265 | 10.2% |
| 85 Years and Over | 117 | 4.5% |
| Total | 2,605 | 100.0% |
Housing Finances in Bloomfield
Median Income by Occupancy in Bloomfield
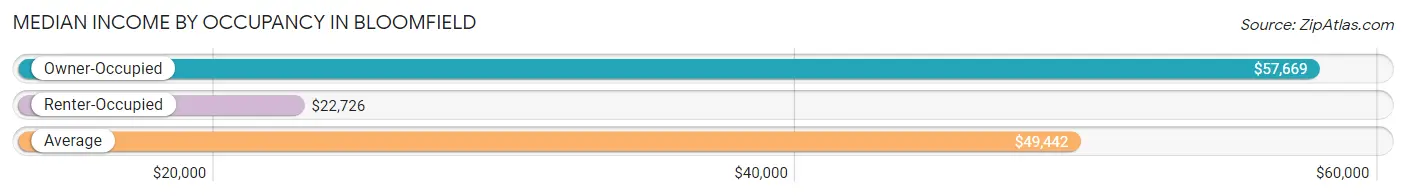
| Occupancy Type | # Households | Median Income |
| Owner-Occupied | 1,848 (70.9%) | $57,669 |
| Renter-Occupied | 757 (29.1%) | $22,726 |
| Average | 2,605 (100.0%) | $49,442 |
Occupancy by Householder Income Bracket in Bloomfield
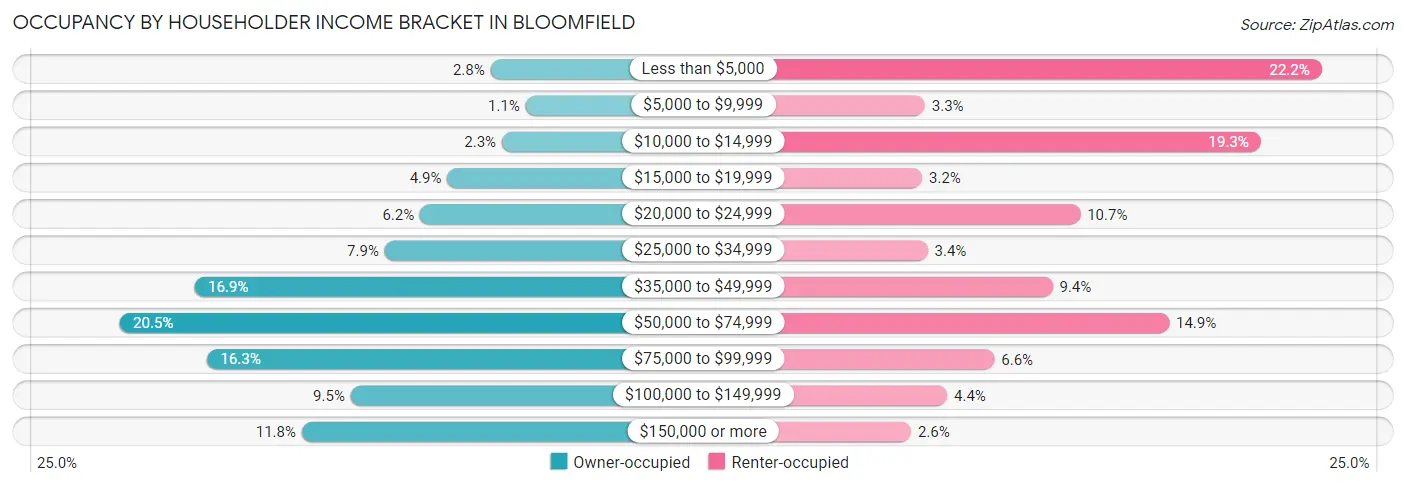
| Income Bracket | Owner-occupied | Renter-occupied |
| Less than $5,000 | 52 (2.8%) | 168 (22.2%) |
| $5,000 to $9,999 | 21 (1.1%) | 25 (3.3%) |
| $10,000 to $14,999 | 42 (2.3%) | 146 (19.3%) |
| $15,000 to $19,999 | 90 (4.9%) | 24 (3.2%) |
| $20,000 to $24,999 | 114 (6.2%) | 81 (10.7%) |
| $25,000 to $34,999 | 145 (7.9%) | 26 (3.4%) |
| $35,000 to $49,999 | 312 (16.9%) | 71 (9.4%) |
| $50,000 to $74,999 | 378 (20.4%) | 113 (14.9%) |
| $75,000 to $99,999 | 301 (16.3%) | 50 (6.6%) |
| $100,000 to $149,999 | 175 (9.5%) | 33 (4.4%) |
| $150,000 or more | 218 (11.8%) | 20 (2.6%) |
| Total | 1,848 (100.0%) | 757 (100.0%) |
Monthly Housing Cost Tiers in Bloomfield
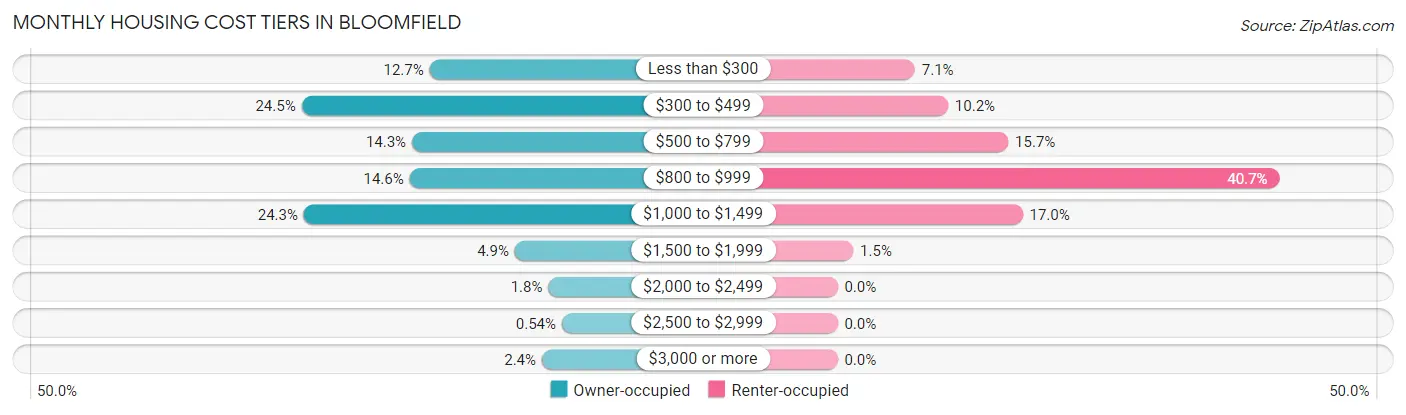
| Monthly Cost | Owner-occupied | Renter-occupied |
| Less than $300 | 235 (12.7%) | 54 (7.1%) |
| $300 to $499 | 453 (24.5%) | 77 (10.2%) |
| $500 to $799 | 265 (14.3%) | 119 (15.7%) |
| $800 to $999 | 269 (14.6%) | 308 (40.7%) |
| $1,000 to $1,499 | 449 (24.3%) | 129 (17.0%) |
| $1,500 to $1,999 | 90 (4.9%) | 11 (1.5%) |
| $2,000 to $2,499 | 33 (1.8%) | 0 (0.0%) |
| $2,500 to $2,999 | 10 (0.5%) | 0 (0.0%) |
| $3,000 or more | 44 (2.4%) | 0 (0.0%) |
| Total | 1,848 (100.0%) | 757 (100.0%) |
Physical Housing Characteristics in Bloomfield
Housing Structures in Bloomfield
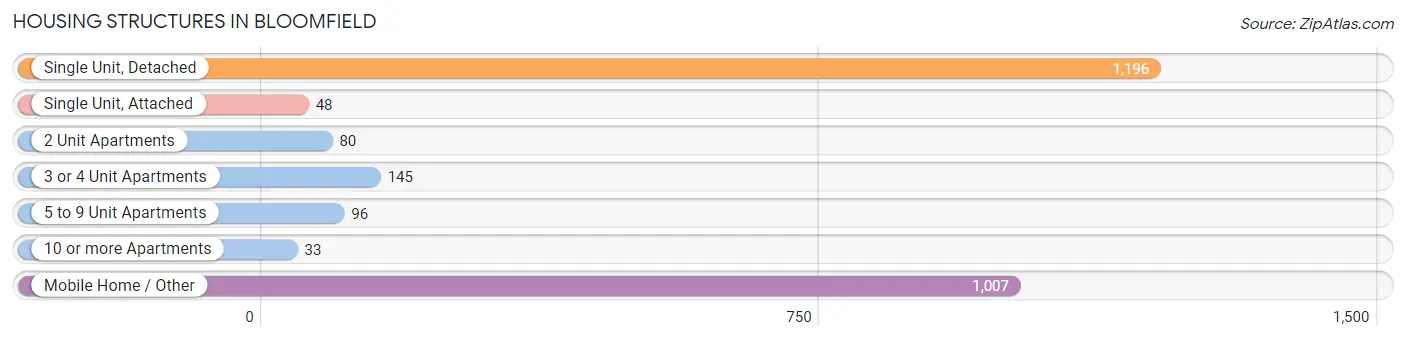
| Structure Type | # Housing Units | % Housing Units |
| Single Unit, Detached | 1,196 | 45.9% |
| Single Unit, Attached | 48 | 1.8% |
| 2 Unit Apartments | 80 | 3.1% |
| 3 or 4 Unit Apartments | 145 | 5.6% |
| 5 to 9 Unit Apartments | 96 | 3.7% |
| 10 or more Apartments | 33 | 1.3% |
| Mobile Home / Other | 1,007 | 38.7% |
| Total | 2,605 | 100.0% |
Housing Structures by Occupancy in Bloomfield
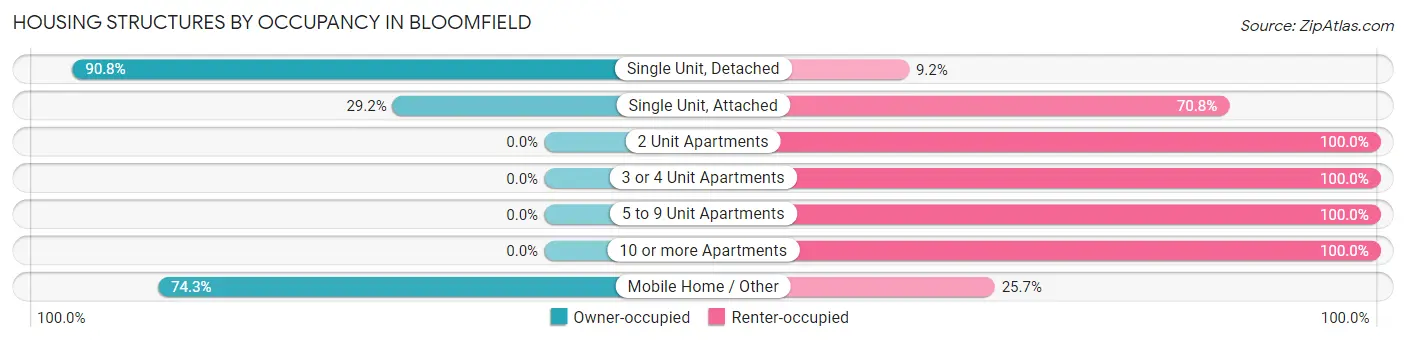
| Structure Type | Owner-occupied | Renter-occupied |
| Single Unit, Detached | 1,086 (90.8%) | 110 (9.2%) |
| Single Unit, Attached | 14 (29.2%) | 34 (70.8%) |
| 2 Unit Apartments | 0 (0.0%) | 80 (100.0%) |
| 3 or 4 Unit Apartments | 0 (0.0%) | 145 (100.0%) |
| 5 to 9 Unit Apartments | 0 (0.0%) | 96 (100.0%) |
| 10 or more Apartments | 0 (0.0%) | 33 (100.0%) |
| Mobile Home / Other | 748 (74.3%) | 259 (25.7%) |
| Total | 1,848 (70.9%) | 757 (29.1%) |
Housing Structures by Number of Rooms in Bloomfield
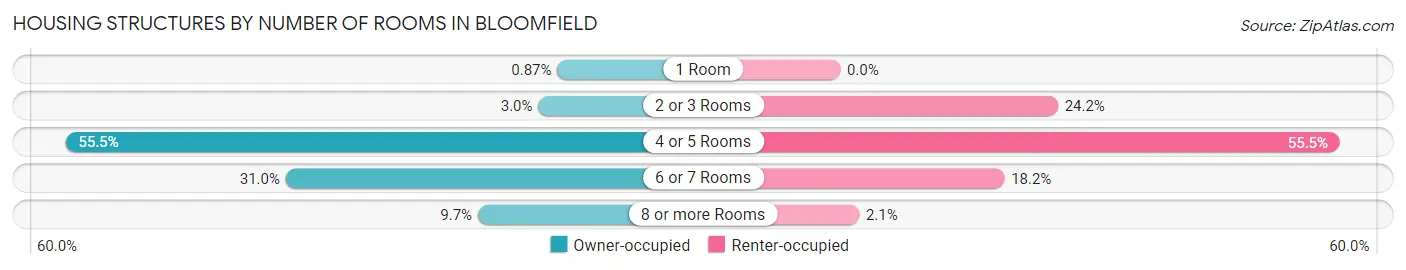
| Number of Rooms | Owner-occupied | Renter-occupied |
| 1 Room | 16 (0.9%) | 0 (0.0%) |
| 2 or 3 Rooms | 55 (3.0%) | 183 (24.2%) |
| 4 or 5 Rooms | 1,025 (55.5%) | 420 (55.5%) |
| 6 or 7 Rooms | 573 (31.0%) | 138 (18.2%) |
| 8 or more Rooms | 179 (9.7%) | 16 (2.1%) |
| Total | 1,848 (100.0%) | 757 (100.0%) |
Housing Structure by Heating Type in Bloomfield
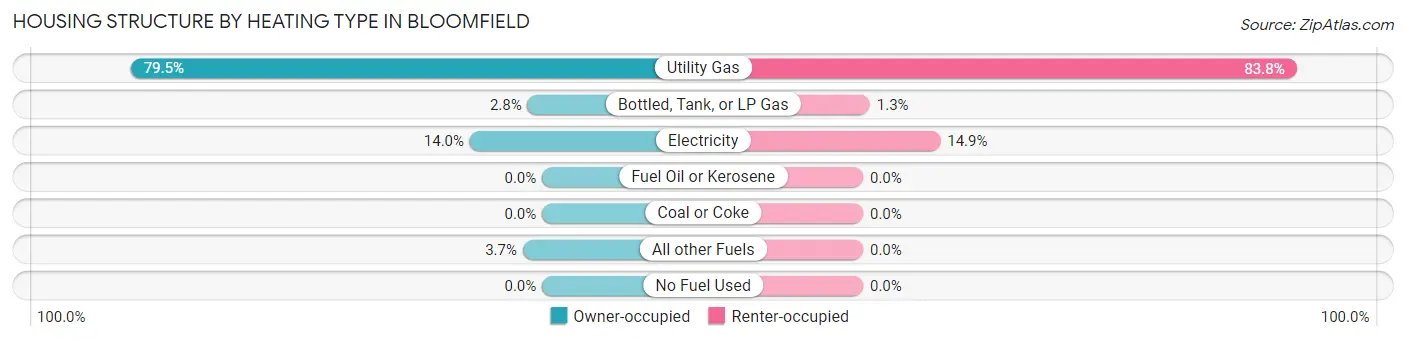
| Heating Type | Owner-occupied | Renter-occupied |
| Utility Gas | 1,469 (79.5%) | 634 (83.8%) |
| Bottled, Tank, or LP Gas | 52 (2.8%) | 10 (1.3%) |
| Electricity | 258 (14.0%) | 113 (14.9%) |
| Fuel Oil or Kerosene | 0 (0.0%) | 0 (0.0%) |
| Coal or Coke | 0 (0.0%) | 0 (0.0%) |
| All other Fuels | 69 (3.7%) | 0 (0.0%) |
| No Fuel Used | 0 (0.0%) | 0 (0.0%) |
| Total | 1,848 (100.0%) | 757 (100.0%) |
Household Vehicle Usage in Bloomfield
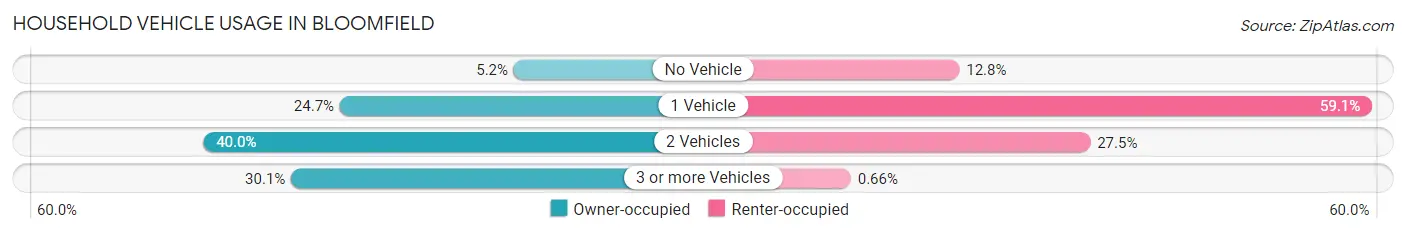
| Vehicles per Household | Owner-occupied | Renter-occupied |
| No Vehicle | 96 (5.2%) | 97 (12.8%) |
| 1 Vehicle | 456 (24.7%) | 447 (59.1%) |
| 2 Vehicles | 739 (40.0%) | 208 (27.5%) |
| 3 or more Vehicles | 557 (30.1%) | 5 (0.7%) |
| Total | 1,848 (100.0%) | 757 (100.0%) |
Real Estate & Mortgages in Bloomfield
Real Estate and Mortgage Overview in Bloomfield
| Characteristic | Without Mortgage | With Mortgage |
| Housing Units | 939 | 909 |
| Median Property Value | $134,600 | $162,700 |
| Median Household Income | $55,811 | $58 |
| Monthly Housing Costs | $436 | $44 |
| Real Estate Taxes | $972 | $27 |
Property Value by Mortgage Status in Bloomfield
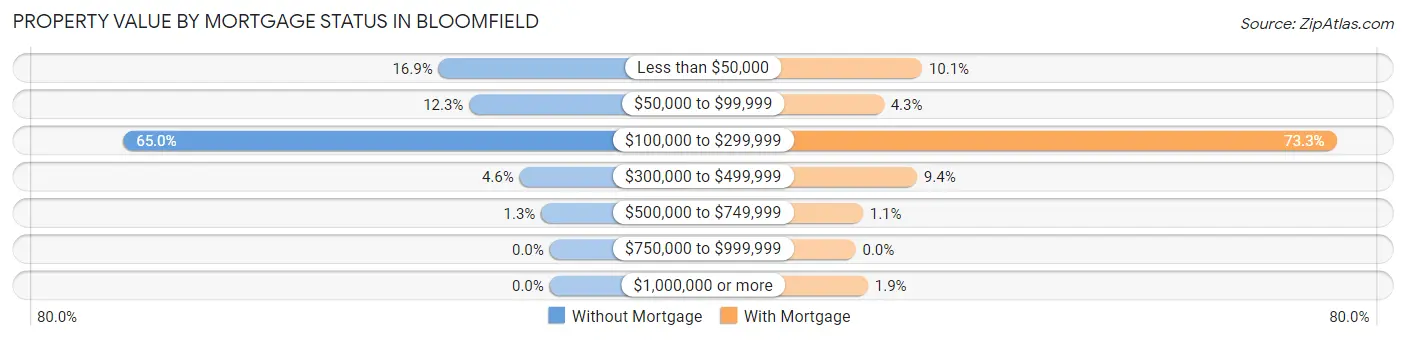
| Property Value | Without Mortgage | With Mortgage |
| Less than $50,000 | 159 (16.9%) | 92 (10.1%) |
| $50,000 to $99,999 | 115 (12.2%) | 39 (4.3%) |
| $100,000 to $299,999 | 610 (65.0%) | 666 (73.3%) |
| $300,000 to $499,999 | 43 (4.6%) | 85 (9.3%) |
| $500,000 to $749,999 | 12 (1.3%) | 10 (1.1%) |
| $750,000 to $999,999 | 0 (0.0%) | 0 (0.0%) |
| $1,000,000 or more | 0 (0.0%) | 17 (1.9%) |
| Total | 939 (100.0%) | 909 (100.0%) |
Household Income by Mortgage Status in Bloomfield
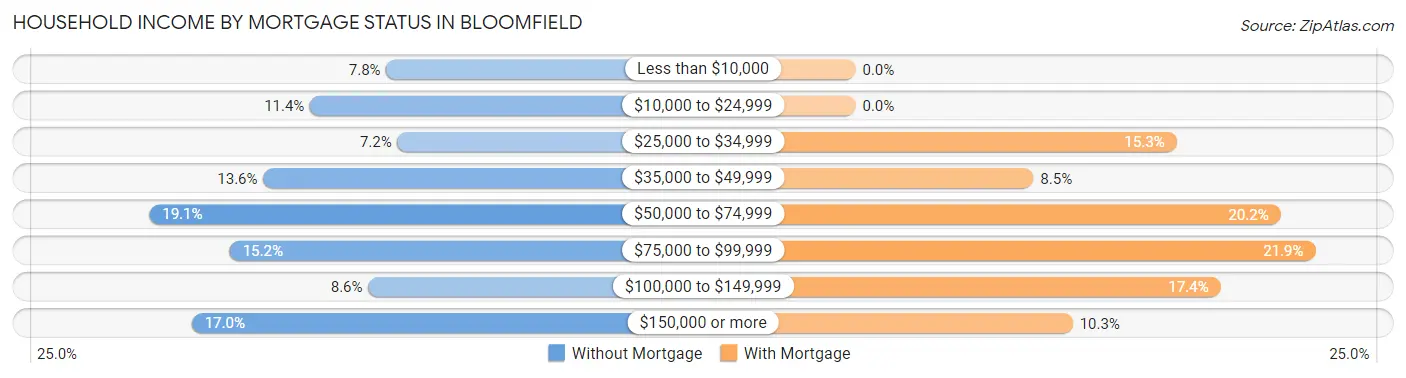
| Household Income | Without Mortgage | With Mortgage |
| Less than $10,000 | 73 (7.8%) | 0 (0.0%) |
| $10,000 to $24,999 | 107 (11.4%) | 0 (0.0%) |
| $25,000 to $34,999 | 68 (7.2%) | 139 (15.3%) |
| $35,000 to $49,999 | 128 (13.6%) | 77 (8.5%) |
| $50,000 to $74,999 | 179 (19.1%) | 184 (20.2%) |
| $75,000 to $99,999 | 143 (15.2%) | 199 (21.9%) |
| $100,000 to $149,999 | 81 (8.6%) | 158 (17.4%) |
| $150,000 or more | 160 (17.0%) | 94 (10.3%) |
| Total | 939 (100.0%) | 909 (100.0%) |
Property Value to Household Income Ratio in Bloomfield
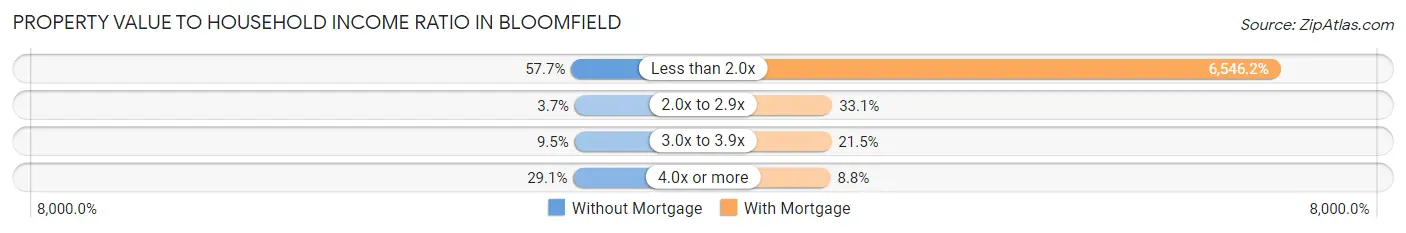
| Value-to-Income Ratio | Without Mortgage | With Mortgage |
| Less than 2.0x | 542 (57.7%) | 59,505 (6,546.2%) |
| 2.0x to 2.9x | 35 (3.7%) | 301 (33.1%) |
| 3.0x to 3.9x | 89 (9.5%) | 195 (21.4%) |
| 4.0x or more | 273 (29.1%) | 80 (8.8%) |
| Total | 939 (100.0%) | 909 (100.0%) |
Real Estate Taxes by Mortgage Status in Bloomfield
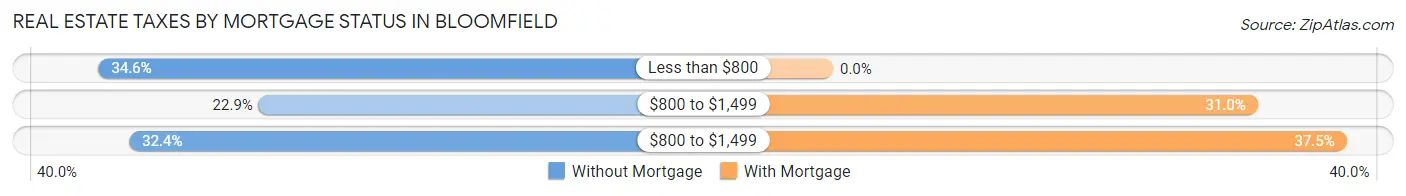
| Property Taxes | Without Mortgage | With Mortgage |
| Less than $800 | 325 (34.6%) | 0 (0.0%) |
| $800 to $1,499 | 215 (22.9%) | 282 (31.0%) |
| $800 to $1,499 | 304 (32.4%) | 341 (37.5%) |
| Total | 939 (100.0%) | 909 (100.0%) |
Health & Disability in Bloomfield
Health Insurance Coverage by Age in Bloomfield
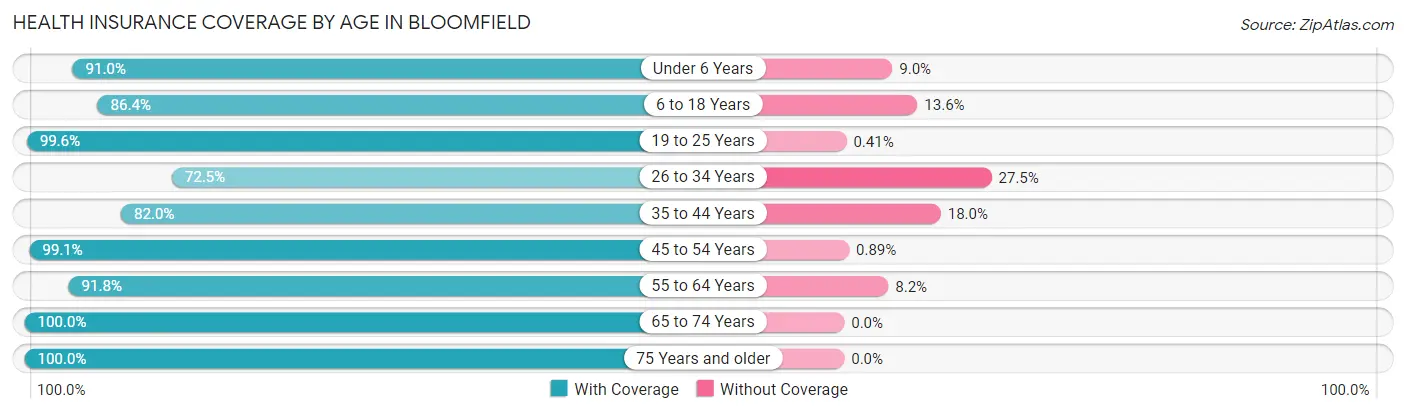
| Age Bracket | With Coverage | Without Coverage |
| Under 6 Years | 772 (91.0%) | 76 (9.0%) |
| 6 to 18 Years | 1,210 (86.4%) | 191 (13.6%) |
| 19 to 25 Years | 731 (99.6%) | 3 (0.4%) |
| 26 to 34 Years | 726 (72.5%) | 275 (27.5%) |
| 35 to 44 Years | 515 (82.0%) | 113 (18.0%) |
| 45 to 54 Years | 780 (99.1%) | 7 (0.9%) |
| 55 to 64 Years | 815 (91.8%) | 73 (8.2%) |
| 65 to 74 Years | 612 (100.0%) | 0 (0.0%) |
| 75 Years and older | 457 (100.0%) | 0 (0.0%) |
| Total | 6,618 (90.0%) | 738 (10.0%) |
Health Insurance Coverage by Citizenship Status in Bloomfield
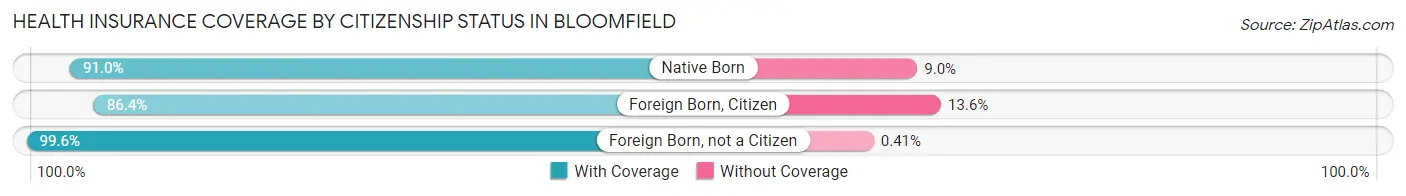
| Citizenship Status | With Coverage | Without Coverage |
| Native Born | 772 (91.0%) | 76 (9.0%) |
| Foreign Born, Citizen | 1,210 (86.4%) | 191 (13.6%) |
| Foreign Born, not a Citizen | 731 (99.6%) | 3 (0.4%) |
Health Insurance Coverage by Household Income in Bloomfield
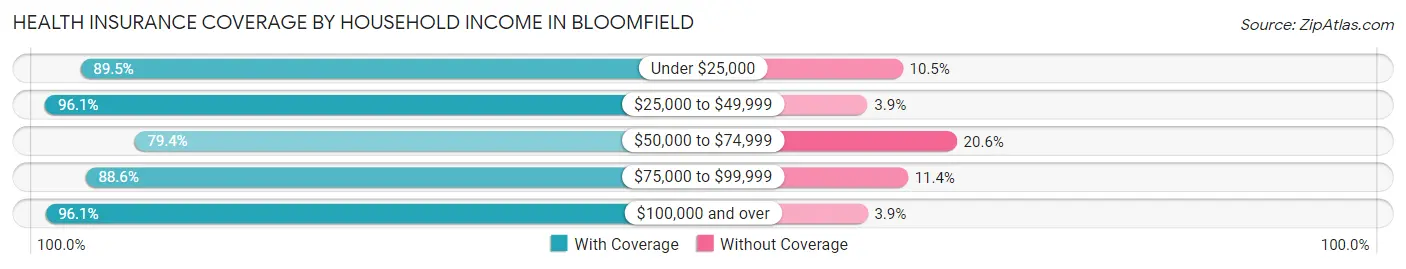
| Household Income | With Coverage | Without Coverage |
| Under $25,000 | 1,515 (89.5%) | 177 (10.5%) |
| $25,000 to $49,999 | 1,471 (96.1%) | 59 (3.9%) |
| $50,000 to $74,999 | 1,243 (79.4%) | 322 (20.6%) |
| $75,000 to $99,999 | 947 (88.6%) | 122 (11.4%) |
| $100,000 and over | 1,441 (96.1%) | 58 (3.9%) |
Public vs Private Health Insurance Coverage by Age in Bloomfield
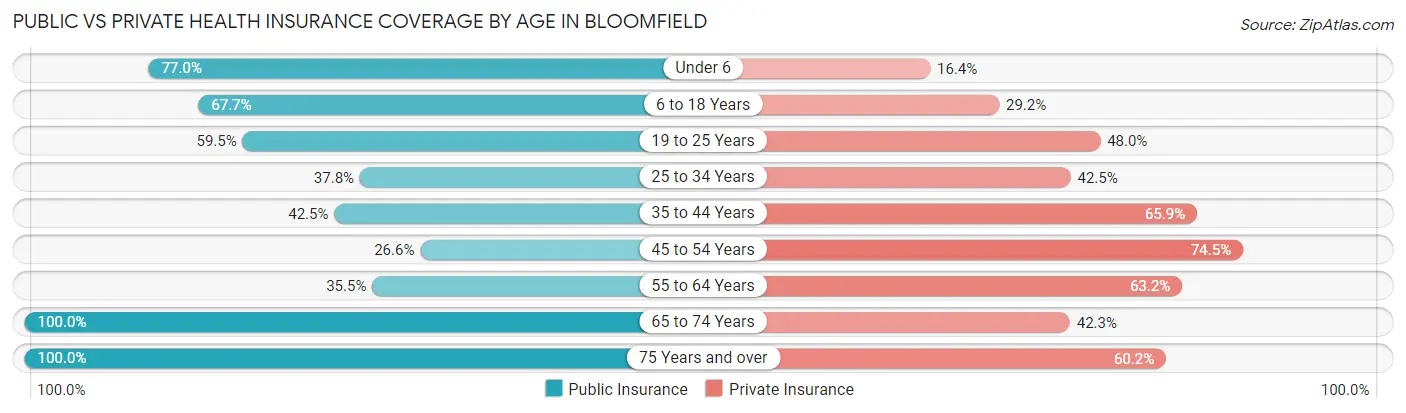
| Age Bracket | Public Insurance | Private Insurance |
| Under 6 | 653 (77.0%) | 139 (16.4%) |
| 6 to 18 Years | 949 (67.7%) | 409 (29.2%) |
| 19 to 25 Years | 437 (59.5%) | 352 (48.0%) |
| 25 to 34 Years | 378 (37.8%) | 425 (42.5%) |
| 35 to 44 Years | 267 (42.5%) | 414 (65.9%) |
| 45 to 54 Years | 209 (26.6%) | 586 (74.5%) |
| 55 to 64 Years | 315 (35.5%) | 561 (63.2%) |
| 65 to 74 Years | 612 (100.0%) | 259 (42.3%) |
| 75 Years and over | 457 (100.0%) | 275 (60.2%) |
| Total | 4,277 (58.1%) | 3,420 (46.5%) |
Disability Status by Sex by Age in Bloomfield
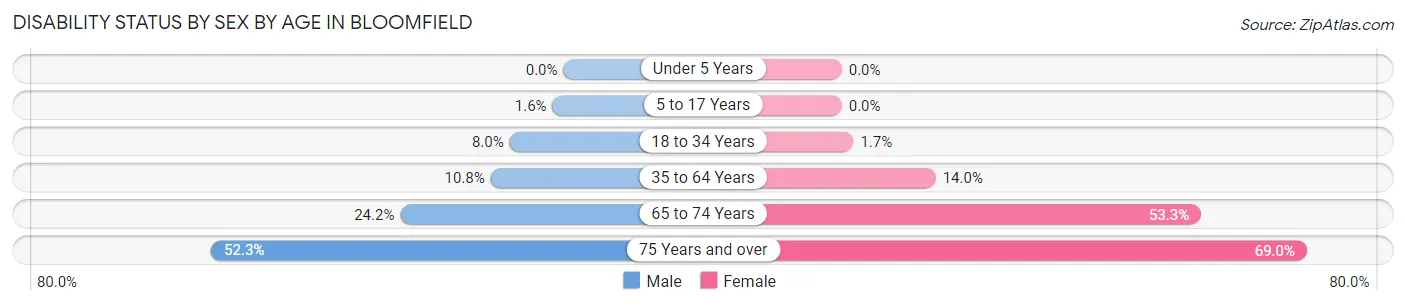
| Age Bracket | Male | Female |
| Under 5 Years | 0 (0.0%) | 0 (0.0%) |
| 5 to 17 Years | 12 (1.6%) | 0 (0.0%) |
| 18 to 34 Years | 66 (8.0%) | 17 (1.7%) |
| 35 to 64 Years | 114 (10.8%) | 174 (14.0%) |
| 65 to 74 Years | 101 (24.2%) | 104 (53.3%) |
| 75 Years and over | 114 (52.3%) | 165 (69.0%) |
Disability Class by Sex by Age in Bloomfield
Disability Class: Hearing Difficulty
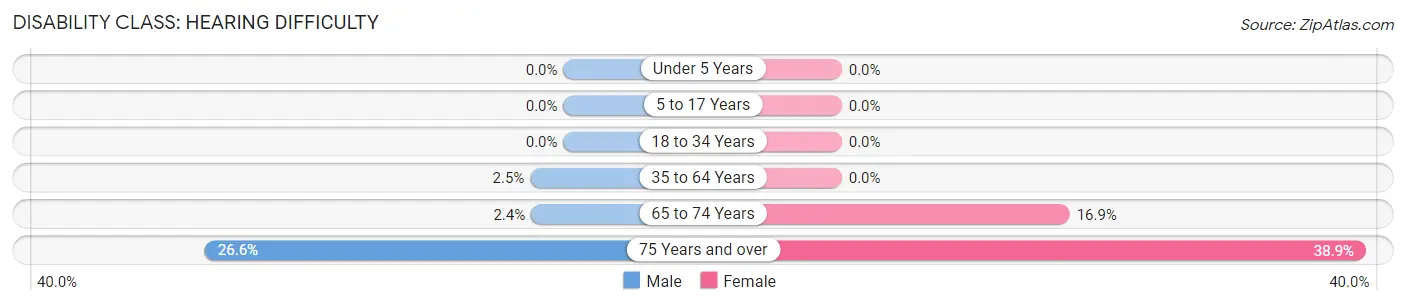
| Age Bracket | Male | Female |
| Under 5 Years | 0 (0.0%) | 0 (0.0%) |
| 5 to 17 Years | 0 (0.0%) | 0 (0.0%) |
| 18 to 34 Years | 0 (0.0%) | 0 (0.0%) |
| 35 to 64 Years | 26 (2.5%) | 0 (0.0%) |
| 65 to 74 Years | 10 (2.4%) | 33 (16.9%) |
| 75 Years and over | 58 (26.6%) | 93 (38.9%) |
Disability Class: Vision Difficulty
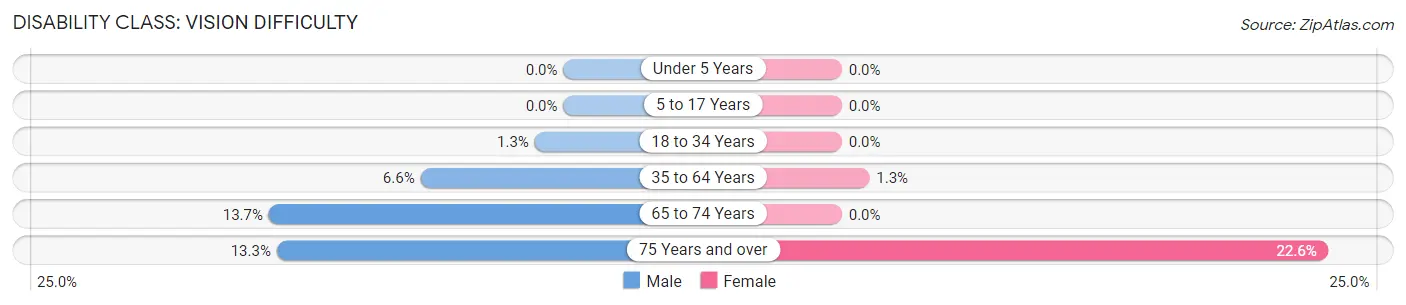
| Age Bracket | Male | Female |
| Under 5 Years | 0 (0.0%) | 0 (0.0%) |
| 5 to 17 Years | 0 (0.0%) | 0 (0.0%) |
| 18 to 34 Years | 11 (1.3%) | 0 (0.0%) |
| 35 to 64 Years | 70 (6.6%) | 16 (1.3%) |
| 65 to 74 Years | 57 (13.7%) | 0 (0.0%) |
| 75 Years and over | 29 (13.3%) | 54 (22.6%) |
Disability Class: Cognitive Difficulty
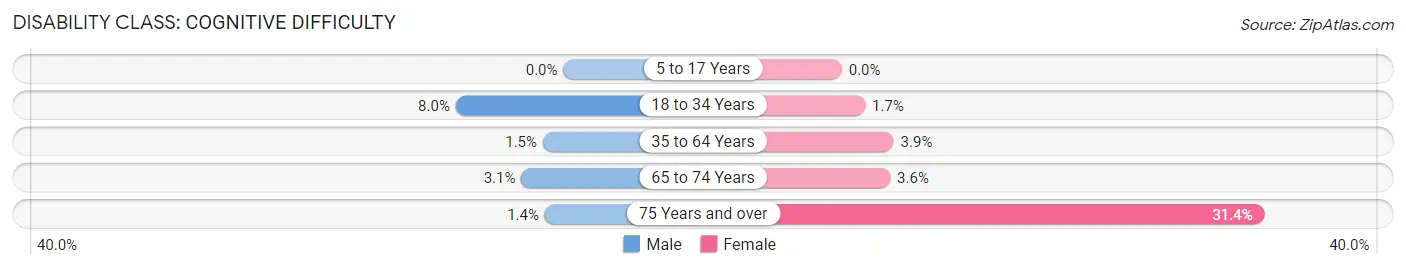
| Age Bracket | Male | Female |
| 5 to 17 Years | 0 (0.0%) | 0 (0.0%) |
| 18 to 34 Years | 66 (8.0%) | 17 (1.7%) |
| 35 to 64 Years | 16 (1.5%) | 48 (3.8%) |
| 65 to 74 Years | 13 (3.1%) | 7 (3.6%) |
| 75 Years and over | 3 (1.4%) | 75 (31.4%) |
Disability Class: Ambulatory Difficulty
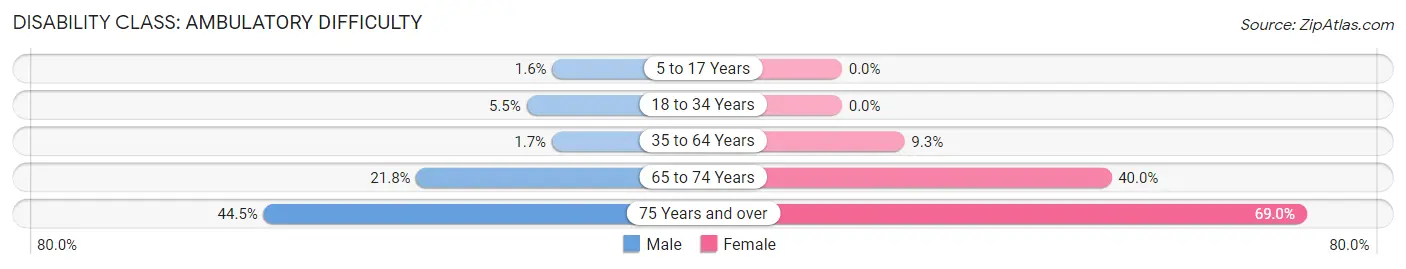
| Age Bracket | Male | Female |
| 5 to 17 Years | 12 (1.6%) | 0 (0.0%) |
| 18 to 34 Years | 45 (5.4%) | 0 (0.0%) |
| 35 to 64 Years | 18 (1.7%) | 116 (9.3%) |
| 65 to 74 Years | 91 (21.8%) | 78 (40.0%) |
| 75 Years and over | 97 (44.5%) | 165 (69.0%) |
Disability Class: Self-Care Difficulty
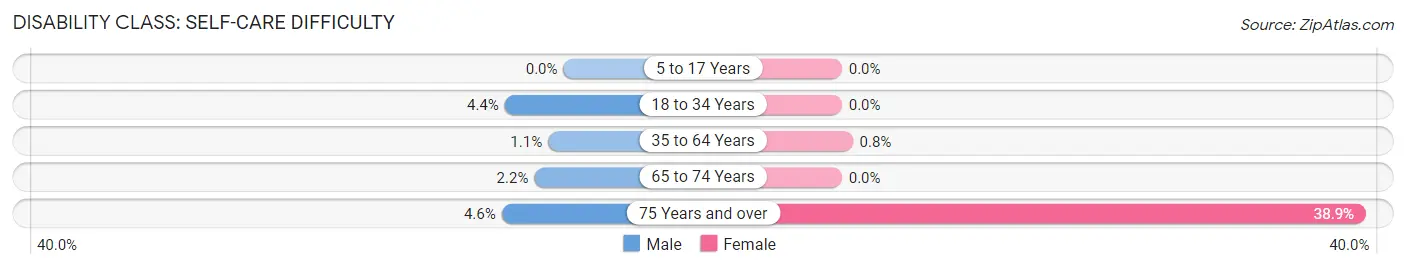
| Age Bracket | Male | Female |
| 5 to 17 Years | 0 (0.0%) | 0 (0.0%) |
| 18 to 34 Years | 36 (4.4%) | 0 (0.0%) |
| 35 to 64 Years | 12 (1.1%) | 10 (0.8%) |
| 65 to 74 Years | 9 (2.2%) | 0 (0.0%) |
| 75 Years and over | 10 (4.6%) | 93 (38.9%) |
Technology Access in Bloomfield
Computing Device Access in Bloomfield
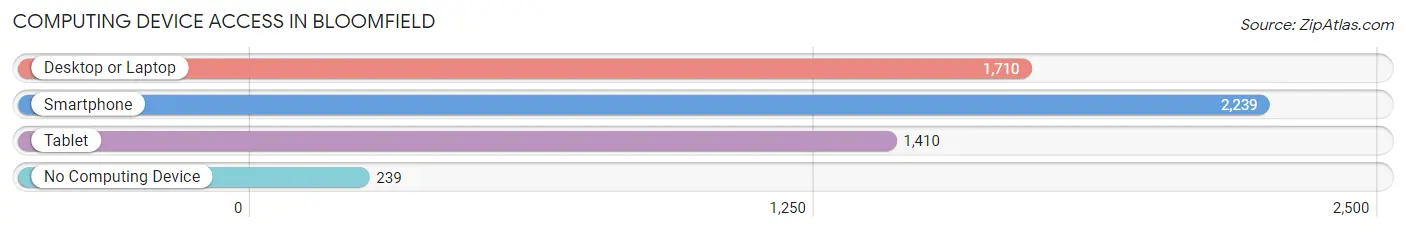
| Device Type | # Households | % Households |
| Desktop or Laptop | 1,710 | 65.6% |
| Smartphone | 2,239 | 86.0% |
| Tablet | 1,410 | 54.1% |
| No Computing Device | 239 | 9.2% |
| Total | 2,605 | 100.0% |
Internet Access in Bloomfield
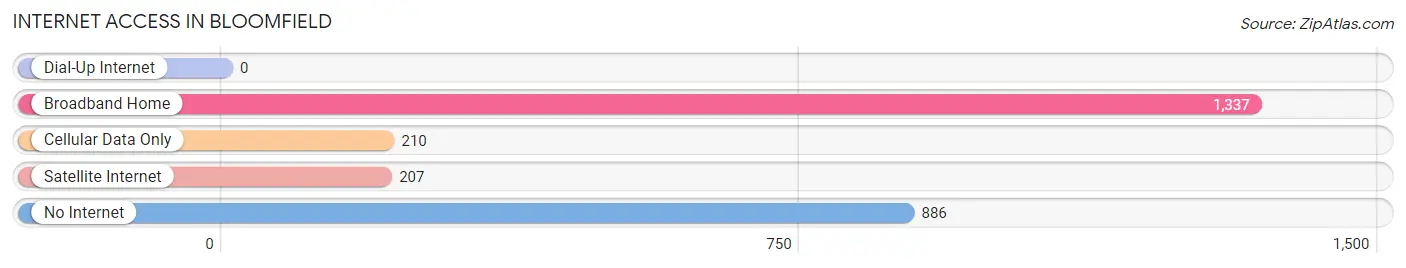
| Internet Type | # Households | % Households |
| Dial-Up Internet | 0 | 0.0% |
| Broadband Home | 1,337 | 51.3% |
| Cellular Data Only | 210 | 8.1% |
| Satellite Internet | 207 | 8.0% |
| No Internet | 886 | 34.0% |
| Total | 2,605 | 100.0% |
Bloomfield Summary
Bloomfield is a city located in San Juan County, New Mexico. It is the county seat and the largest city in the county. The city is located in the Four Corners region of the state, near the intersection of U.S. Route 64 and U.S. Route 550. As of the 2010 census, the population of Bloomfield was 6,611.
Geography
Bloomfield is located at 36°33'25" North, 107°59'17" West (36.556944, -107.988056). It is situated at an elevation of 5,945 feet (1,812 m) above sea level. The city is located in the Four Corners region of the state, near the intersection of U.S. Route 64 and U.S. Route 550.
The city is located in the Chaco Canyon region of the state, which is characterized by its dry climate and rugged terrain. The area is home to a variety of wildlife, including deer, elk, antelope, and wild turkeys. The nearby Navajo Nation Reservation is also home to a variety of wildlife, including bighorn sheep, mountain lions, and black bears.
Climate
Bloomfield has a semi-arid climate, with hot summers and cold winters. The average annual temperature is 54°F (12°C), with an average high of 79°F (26°C) in July and an average low of 28°F (-2°C) in January. The average annual precipitation is 11.5 inches (29 cm).
Demographics
As of the 2010 census, the population of Bloomfield was 6,611. The racial makeup of the city was 68.3% White, 0.9% African American, 19.2% Native American, 0.3% Asian, 0.1% Pacific Islander, 8.2% from other races, and 2.9% from two or more races. Hispanic or Latino of any race were 24.3% of the population.
Economy
The economy of Bloomfield is largely based on agriculture and tourism. The city is home to a variety of farms, ranches, and orchards, which produce a variety of crops, including alfalfa, corn, wheat, and hay. The city is also home to a number of tourist attractions, including the Chaco Culture National Historical Park, the Aztec Ruins National Monument, and the Salmon Ruins.
The city is also home to a number of businesses, including a variety of restaurants, retail stores, and service providers. The city is also home to a number of manufacturing companies, including a furniture manufacturer, a plastics manufacturer, and a metal fabrication company.
The city is served by the Bloomfield Municipal Airport, which offers general aviation services. The city is also served by the Bloomfield-San Juan County Regional Airport, which offers commercial air service.
Education
Bloomfield is served by the Bloomfield School District, which operates four elementary schools, one middle school, and one high school. The city is also home to San Juan College, a two-year community college.
Conclusion
Bloomfield is a city located in San Juan County, New Mexico. It is the county seat and the largest city in the county. The city is located in the Four Corners region of the state, near the intersection of U.S. Route 64 and U.S. Route 550. As of the 2010 census, the population of Bloomfield was 6,611. The city has a semi-arid climate, with hot summers and cold winters. The economy of Bloomfield is largely based on agriculture and tourism. The city is served by the Bloomfield School District, which operates four elementary schools, one middle school, and one high school. The city is also home to San Juan College, a two-year community college.
Common Questions
What is Per Capita Income in Bloomfield?
Per Capita income in Bloomfield is $23,513.
What is the Median Family Income in Bloomfield?
Median Family Income in Bloomfield is $50,355.
What is the Median Household income in Bloomfield?
Median Household Income in Bloomfield is $49,442.
What is Income or Wage Gap in Bloomfield?
Income or Wage Gap in Bloomfield is 48.3%.
Women in Bloomfield earn 51.7 cents for every dollar earned by a man.
What is Inequality or Gini Index in Bloomfield?
Inequality or Gini Index in Bloomfield is 0.47.
What is the Total Population of Bloomfield?
Total Population of Bloomfield is 7,430.
What is the Total Male Population of Bloomfield?
Total Male Population of Bloomfield is 3,742.
What is the Total Female Population of Bloomfield?
Total Female Population of Bloomfield is 3,688.
What is the Ratio of Males per 100 Females in Bloomfield?
There are 101.46 Males per 100 Females in Bloomfield.
What is the Ratio of Females per 100 Males in Bloomfield?
There are 98.56 Females per 100 Males in Bloomfield.
What is the Median Population Age in Bloomfield?
Median Population Age in Bloomfield is 33.0 Years.
What is the Average Family Size in Bloomfield
Average Family Size in Bloomfield is 3.4 People.
What is the Average Household Size in Bloomfield
Average Household Size in Bloomfield is 2.8 People.
How Large is the Labor Force in Bloomfield?
There are 3,121 People in the Labor Forcein in Bloomfield.
What is the Percentage of People in the Labor Force in Bloomfield?
58.0% of People are in the Labor Force in Bloomfield.
What is the Unemployment Rate in Bloomfield?
Unemployment Rate in Bloomfield is 3.0%.