Zip Codes with the Highest Percentage of Population Employed in Architecture & Engineering in Santa Fe, NM
RELATED REPORTS & OPTIONS
Architecture & Engineering
Santa Fe
Compare Zip Codes
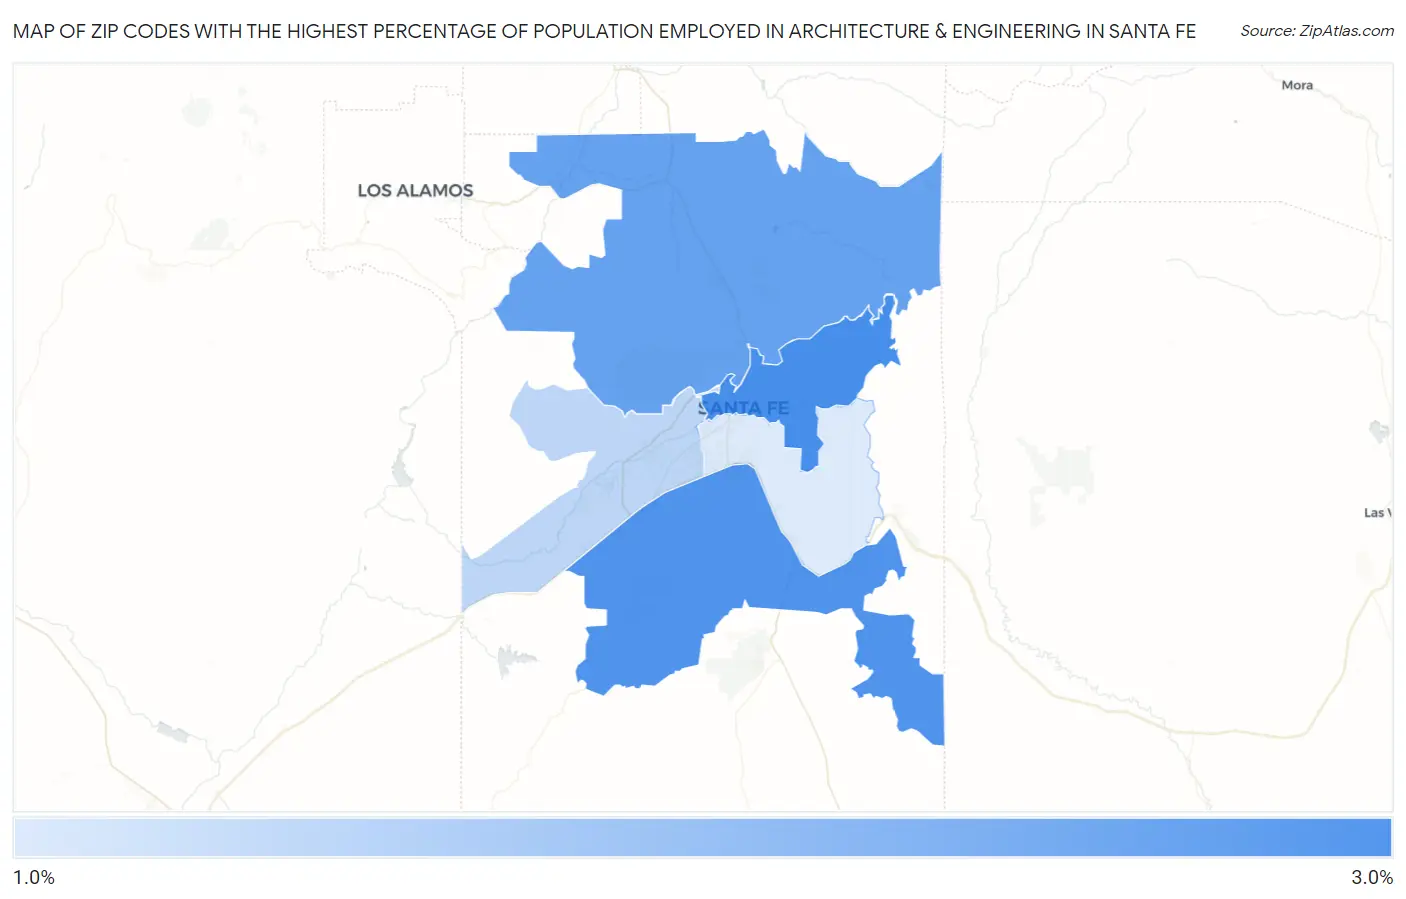
Map of Zip Codes with the Highest Percentage of Population Employed in Architecture & Engineering in Santa Fe
1.3%
2.8%
Zip Codes with the Highest Percentage of Population Employed in Architecture & Engineering in Santa Fe, NM
| Zip Code | % Employed | vs State | vs National | |
| 1. | 87501 | 2.8% | 2.5%(+0.256)#47 | 2.1%(+0.623)#5,894 |
| 2. | 87508 | 2.7% | 2.5%(+0.179)#48 | 2.1%(+0.546)#6,185 |
| 3. | 87506 | 2.5% | 2.5%(-0.033)#53 | 2.1%(+0.335)#7,074 |
| 4. | 87507 | 1.6% | 2.5%(-0.923)#81 | 2.1%(-0.555)#12,228 |
| 5. | 87505 | 1.3% | 2.5%(-1.24)#88 | 2.1%(-0.868)#14,446 |
1
Common Questions
What are the Top 3 Zip Codes with the Highest Percentage of Population Employed in Architecture & Engineering in Santa Fe, NM?
Top 3 Zip Codes with the Highest Percentage of Population Employed in Architecture & Engineering in Santa Fe, NM are:
What zip code has the Highest Percentage of Population Employed in Architecture & Engineering in Santa Fe, NM?
87501 has the Highest Percentage of Population Employed in Architecture & Engineering in Santa Fe, NM with 2.8%.
What is the Percentage of Population Employed in Architecture & Engineering in Santa Fe, NM?
Percentage of Population Employed in Architecture & Engineering in Santa Fe is 1.7%.
What is the Percentage of Population Employed in Architecture & Engineering in New Mexico?
Percentage of Population Employed in Architecture & Engineering in New Mexico is 2.5%.
What is the Percentage of Population Employed in Architecture & Engineering in the United States?
Percentage of Population Employed in Architecture & Engineering in the United States is 2.1%.