Zip Codes with the Highest Percentage of Households with Income Below $10,000 in Indiana
RELATED REPORTS & OPTIONS
Household Income | $0-10k
Indiana
Compare Zip Codes
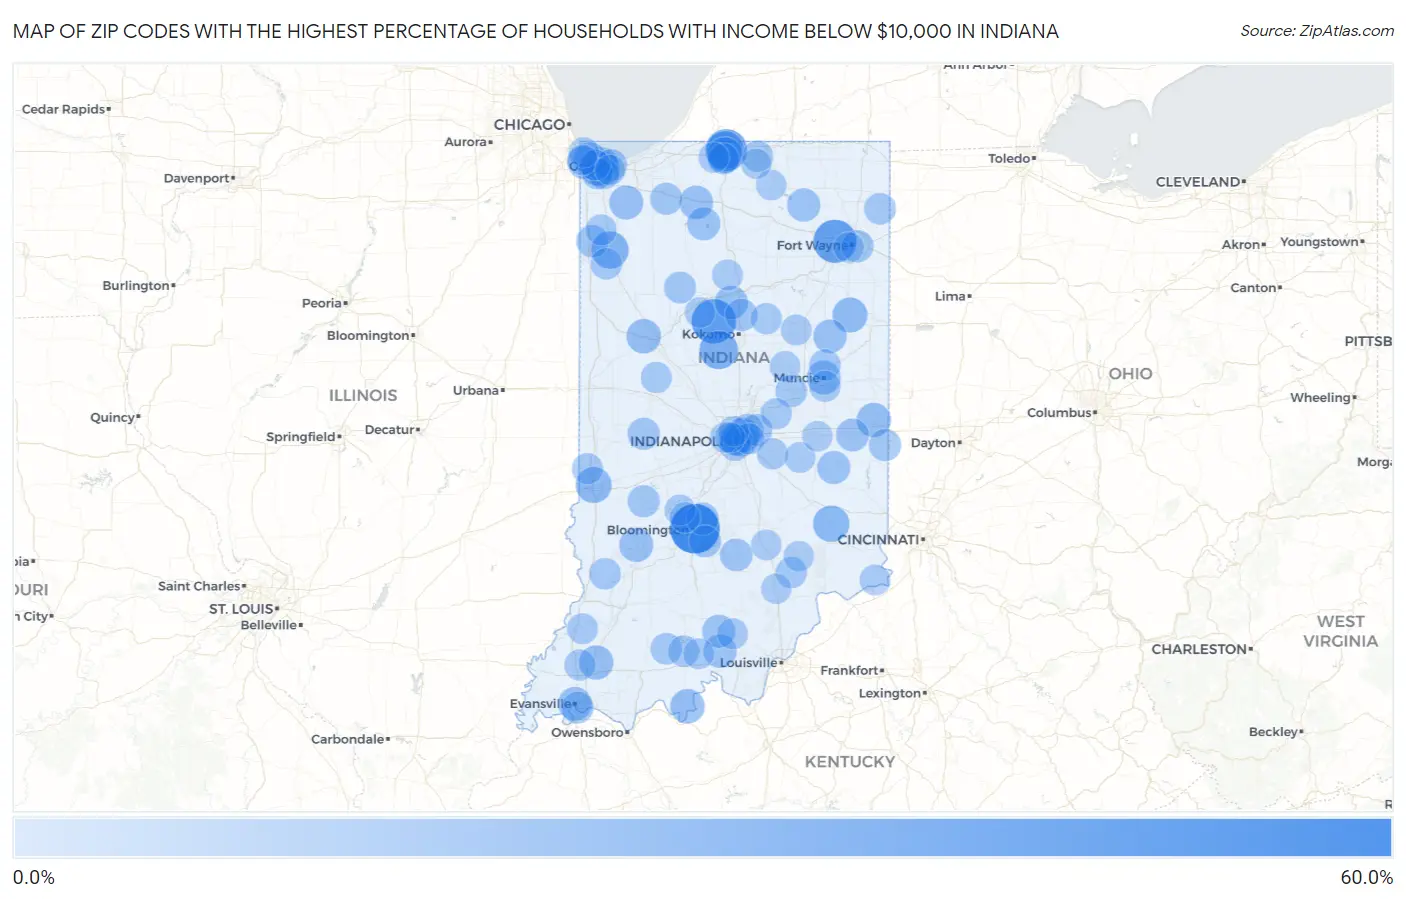
Map of Zip Codes with the Highest Percentage of Households with Income Below $10,000 in Indiana
0.0%
60.0%
Zip Codes with the Highest Percentage of Households with Income Below $10,000 in Indiana
| Zip Code | Households with Income < $10k | vs State | vs National | |
| 1. | 47406 | 53.3% | 5.0%(+48.3)#1 | 4.9%(+48.4)#95 |
| 2. | 46998 | 40.8% | 5.0%(+35.8)#2 | 4.9%(+35.9)#168 |
| 3. | 46704 | 37.9% | 5.0%(+32.9)#3 | 4.9%(+33.0)#191 |
| 4. | 46556 | 34.3% | 5.0%(+29.3)#4 | 4.9%(+29.4)#230 |
| 5. | 46039 | 26.6% | 5.0%(+21.6)#5 | 4.9%(+21.7)#417 |
| 6. | 46624 | 25.0% | 5.0%(+20.0)#6 | 4.9%(+20.1)#490 |
| 7. | 47943 | 24.0% | 5.0%(+19.0)#7 | 4.9%(+19.1)#532 |
| 8. | 47034 | 21.6% | 5.0%(+16.6)#8 | 4.9%(+16.7)#664 |
| 9. | 47807 | 20.5% | 5.0%(+15.5)#9 | 4.9%(+15.6)#743 |
| 10. | 46601 | 20.0% | 5.0%(+15.0)#10 | 4.9%(+15.1)#792 |
| 11. | 46778 | 18.3% | 5.0%(+13.3)#11 | 4.9%(+13.4)#987 |
| 12. | 46407 | 17.9% | 5.0%(+12.9)#12 | 4.9%(+13.0)#1,034 |
| 13. | 47906 | 17.1% | 5.0%(+12.1)#13 | 4.9%(+12.2)#1,135 |
| 14. | 47574 | 16.9% | 5.0%(+11.9)#14 | 4.9%(+12.0)#1,182 |
| 15. | 47392 | 16.7% | 5.0%(+11.7)#15 | 4.9%(+11.8)#1,220 |
| 16. | 47654 | 16.7% | 5.0%(+11.7)#16 | 4.9%(+11.8)#1,228 |
| 17. | 46218 | 16.4% | 5.0%(+11.4)#17 | 4.9%(+11.5)#1,255 |
| 18. | 47305 | 16.1% | 5.0%(+11.1)#18 | 4.9%(+11.2)#1,320 |
| 19. | 47465 | 16.1% | 5.0%(+11.1)#19 | 4.9%(+11.2)#1,332 |
| 20. | 46302 | 16.1% | 5.0%(+11.1)#20 | 4.9%(+11.2)#1,333 |
| 21. | 46404 | 15.9% | 5.0%(+10.9)#21 | 4.9%(+11.0)#1,355 |
| 22. | 47708 | 15.4% | 5.0%(+10.4)#22 | 4.9%(+10.5)#1,446 |
| 23. | 46531 | 15.2% | 5.0%(+10.2)#23 | 4.9%(+10.3)#1,484 |
| 24. | 46402 | 15.1% | 5.0%(+10.1)#24 | 4.9%(+10.2)#1,502 |
| 25. | 46967 | 14.9% | 5.0%(+9.90)#25 | 4.9%(+10.00)#1,558 |
| 26. | 47348 | 14.7% | 5.0%(+9.70)#26 | 4.9%(+9.80)#1,594 |
| 27. | 47145 | 14.3% | 5.0%(+9.30)#27 | 4.9%(+9.40)#1,696 |
| 28. | 46760 | 14.2% | 5.0%(+9.20)#28 | 4.9%(+9.30)#1,726 |
| 29. | 46511 | 14.1% | 5.0%(+9.10)#29 | 4.9%(+9.20)#1,747 |
| 30. | 46133 | 14.1% | 5.0%(+9.10)#30 | 4.9%(+9.20)#1,755 |
| 31. | 47125 | 14.0% | 5.0%(+9.00)#31 | 4.9%(+9.10)#1,771 |
| 32. | 46312 | 13.8% | 5.0%(+8.80)#32 | 4.9%(+8.90)#1,818 |
| 33. | 46201 | 13.5% | 5.0%(+8.50)#33 | 4.9%(+8.60)#1,905 |
| 34. | 47370 | 13.4% | 5.0%(+8.40)#34 | 4.9%(+8.50)#1,972 |
| 35. | 46320 | 13.3% | 5.0%(+8.30)#35 | 4.9%(+8.40)#1,980 |
| 36. | 47235 | 12.9% | 5.0%(+7.90)#36 | 4.9%(+8.00)#2,130 |
| 37. | 46349 | 12.5% | 5.0%(+7.50)#37 | 4.9%(+7.60)#2,260 |
| 38. | 46959 | 12.4% | 5.0%(+7.40)#38 | 4.9%(+7.50)#2,321 |
| 39. | 47408 | 12.2% | 5.0%(+7.20)#39 | 4.9%(+7.30)#2,371 |
| 40. | 46202 | 12.2% | 5.0%(+7.20)#40 | 4.9%(+7.30)#2,372 |
| 41. | 46226 | 11.8% | 5.0%(+6.80)#41 | 4.9%(+6.90)#2,538 |
| 42. | 46340 | 11.8% | 5.0%(+6.80)#42 | 4.9%(+6.90)#2,561 |
| 43. | 47833 | 11.8% | 5.0%(+6.80)#43 | 4.9%(+6.90)#2,564 |
| 44. | 46175 | 11.8% | 5.0%(+6.80)#44 | 4.9%(+6.90)#2,572 |
| 45. | 47324 | 11.7% | 5.0%(+6.70)#45 | 4.9%(+6.80)#2,616 |
| 46. | 46235 | 11.6% | 5.0%(+6.60)#46 | 4.9%(+6.70)#2,622 |
| 47. | 46803 | 11.6% | 5.0%(+6.60)#47 | 4.9%(+6.70)#2,632 |
| 48. | 47401 | 11.5% | 5.0%(+6.50)#48 | 4.9%(+6.60)#2,671 |
| 49. | 47713 | 11.5% | 5.0%(+6.50)#49 | 4.9%(+6.60)#2,680 |
| 50. | 46204 | 11.1% | 5.0%(+6.10)#50 | 4.9%(+6.20)#2,894 |
| 51. | 47950 | 11.1% | 5.0%(+6.10)#51 | 4.9%(+6.20)#2,920 |
| 52. | 46403 | 10.9% | 5.0%(+5.90)#52 | 4.9%(+6.00)#3,012 |
| 53. | 46016 | 10.7% | 5.0%(+5.70)#53 | 4.9%(+5.80)#3,121 |
| 54. | 46225 | 10.7% | 5.0%(+5.70)#54 | 4.9%(+5.80)#3,134 |
| 55. | 46785 | 10.6% | 5.0%(+5.60)#55 | 4.9%(+5.70)#3,200 |
| 56. | 47535 | 10.3% | 5.0%(+5.30)#56 | 4.9%(+5.40)#3,403 |
| 57. | 47964 | 10.3% | 5.0%(+5.30)#57 | 4.9%(+5.40)#3,420 |
| 58. | 47580 | 10.2% | 5.0%(+5.20)#58 | 4.9%(+5.30)#3,485 |
| 59. | 47303 | 10.1% | 5.0%(+5.10)#59 | 4.9%(+5.20)#3,497 |
| 60. | 47227 | 10.0% | 5.0%(+5.00)#60 | 4.9%(+5.10)#3,610 |
| 61. | 47116 | 9.9% | 5.0%(+4.90)#61 | 4.9%(+5.00)#3,698 |
| 62. | 46409 | 9.8% | 5.0%(+4.80)#62 | 4.9%(+4.90)#3,740 |
| 63. | 47302 | 9.7% | 5.0%(+4.70)#63 | 4.9%(+4.80)#3,803 |
| 64. | 47648 | 9.6% | 5.0%(+4.60)#64 | 4.9%(+4.70)#3,902 |
| 65. | 46919 | 9.5% | 5.0%(+4.50)#65 | 4.9%(+4.60)#3,989 |
| 66. | 46613 | 9.4% | 5.0%(+4.40)#66 | 4.9%(+4.50)#4,036 |
| 67. | 46048 | 9.4% | 5.0%(+4.40)#67 | 4.9%(+4.50)#4,054 |
| 68. | 46516 | 9.3% | 5.0%(+4.30)#68 | 4.9%(+4.40)#4,099 |
| 69. | 46408 | 9.3% | 5.0%(+4.30)#69 | 4.9%(+4.40)#4,110 |
| 70. | 47955 | 9.3% | 5.0%(+4.30)#70 | 4.9%(+4.40)#4,173 |
| 71. | 46381 | 9.3% | 5.0%(+4.30)#71 | 4.9%(+4.40)#4,177 |
| 72. | 46219 | 9.2% | 5.0%(+4.20)#72 | 4.9%(+4.30)#4,199 |
| 73. | 46130 | 9.1% | 5.0%(+4.10)#73 | 4.9%(+4.20)#4,347 |
| 74. | 47863 | 9.1% | 5.0%(+4.10)#74 | 4.9%(+4.20)#4,383 |
| 75. | 46406 | 9.0% | 5.0%(+4.00)#75 | 4.9%(+4.10)#4,429 |
| 76. | 46988 | 9.0% | 5.0%(+4.00)#76 | 4.9%(+4.10)#4,468 |
| 77. | 47120 | 8.9% | 5.0%(+3.90)#77 | 4.9%(+4.00)#4,580 |
| 78. | 47464 | 8.8% | 5.0%(+3.80)#78 | 4.9%(+3.90)#4,701 |
| 79. | 46104 | 8.7% | 5.0%(+3.70)#79 | 4.9%(+3.80)#4,787 |
| 80. | 46953 | 8.6% | 5.0%(+3.60)#80 | 4.9%(+3.70)#4,832 |
| 81. | 47640 | 8.6% | 5.0%(+3.60)#81 | 4.9%(+3.70)#4,892 |
| 82. | 47118 | 8.5% | 5.0%(+3.50)#82 | 4.9%(+3.60)#4,961 |
| 83. | 47020 | 8.5% | 5.0%(+3.50)#83 | 4.9%(+3.60)#4,987 |
| 84. | 47404 | 8.4% | 5.0%(+3.40)#84 | 4.9%(+3.50)#5,036 |
| 85. | 46394 | 8.2% | 5.0%(+3.20)#85 | 4.9%(+3.30)#5,315 |
| 86. | 46553 | 8.2% | 5.0%(+3.20)#86 | 4.9%(+3.30)#5,339 |
| 87. | 46917 | 8.1% | 5.0%(+3.10)#87 | 4.9%(+3.20)#5,500 |
| 88. | 47337 | 8.1% | 5.0%(+3.10)#88 | 4.9%(+3.20)#5,533 |
| 89. | 46224 | 8.0% | 5.0%(+3.00)#89 | 4.9%(+3.10)#5,547 |
| 90. | 46208 | 8.0% | 5.0%(+3.00)#90 | 4.9%(+3.10)#5,561 |
| 91. | 46063 | 8.0% | 5.0%(+3.00)#91 | 4.9%(+3.10)#5,651 |
| 92. | 47282 | 8.0% | 5.0%(+3.00)#92 | 4.9%(+3.10)#5,657 |
| 93. | 47247 | 8.0% | 5.0%(+3.00)#93 | 4.9%(+3.10)#5,660 |
| 94. | 46222 | 7.9% | 5.0%(+2.90)#94 | 4.9%(+3.00)#5,672 |
| 95. | 46619 | 7.9% | 5.0%(+2.90)#95 | 4.9%(+3.00)#5,689 |
| 96. | 46327 | 7.9% | 5.0%(+2.90)#96 | 4.9%(+3.00)#5,705 |
| 97. | 46802 | 7.9% | 5.0%(+2.90)#97 | 4.9%(+3.00)#5,707 |
| 98. | 46405 | 7.8% | 5.0%(+2.80)#98 | 4.9%(+2.90)#5,835 |
| 99. | 47102 | 7.8% | 5.0%(+2.80)#99 | 4.9%(+2.90)#5,843 |
| 100. | 46517 | 7.7% | 5.0%(+2.70)#100 | 4.9%(+2.80)#5,939 |
Common Questions
What are the Top 10 Zip Codes with the Highest Percentage of Households with Income Below $10,000 in Indiana?
Top 10 Zip Codes with the Highest Percentage of Households with Income Below $10,000 in Indiana are:
What zip code has the Highest Percentage of Households with Income Below $10,000 in Indiana?
47406 has the Highest Percentage of Households with Income Below $10,000 in Indiana with 53.3%.
What is the Percentage of Households with Income Below $10,000 in the State of Indiana?
Percentage of Households with Income Below $10,000 in Indiana is 5.0%.
What is the Percentage of Households with Income Below $10,000 in the United States?
Percentage of Households with Income Below $10,000 in the United States is 4.9%.