Millersburg, IA Map & Demographics
Millersburg Map
Millersburg Overview
$45,978
PER CAPITA INCOME
$90,893
AVG FAMILY INCOME
$74,531
AVG HOUSEHOLD INCOME
13.5%
WAGE / INCOME GAP [ % ]
86.5¢/ $1
WAGE / INCOME GAP [ $ ]
0.31
INEQUALITY / GINI INDEX
155
TOTAL POPULATION
85
MALE POPULATION
70
FEMALE POPULATION
121.43
MALES / 100 FEMALES
82.35
FEMALES / 100 MALES
57.7
MEDIAN AGE
2.9
AVG FAMILY SIZE
1.8
AVG HOUSEHOLD SIZE
68
LABOR FORCE [ PEOPLE ]
51.5%
PERCENT IN LABOR FORCE
Millersburg Zip Codes
Millersburg Area Codes
Income in Millersburg
Income Overview in Millersburg
Per Capita Income in Millersburg is $45,978, while median incomes of families and households are $90,893 and $74,531 respectively.
| Characteristic | Number | Measure |
| Per Capita Income | 155 | $45,978 |
| Median Family Income | 35 | $90,893 |
| Mean Family Income | 35 | $80,357 |
| Median Household Income | 87 | $74,531 |
| Mean Household Income | 87 | $80,503 |
| Income Deficit | 35 | $0 |
| Wage / Income Gap (%) | 155 | 13.52% |
| Wage / Income Gap ($) | 155 | 86.48¢ per $1 |
| Gini / Inequality Index | 155 | 0.31 |
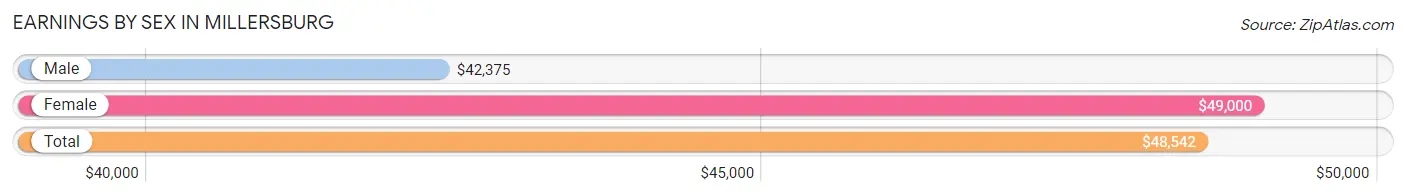
Earnings by Sex in Millersburg
Average Earnings in Millersburg are $48,542, $42,375 for men and $49,000 for women, a difference of 13.5%.
| Sex | Number | Average Earnings |
| Male | 35 (52.2%) | $42,375 |
| Female | 32 (47.8%) | $49,000 |
| Total | 67 (100.0%) | $48,542 |
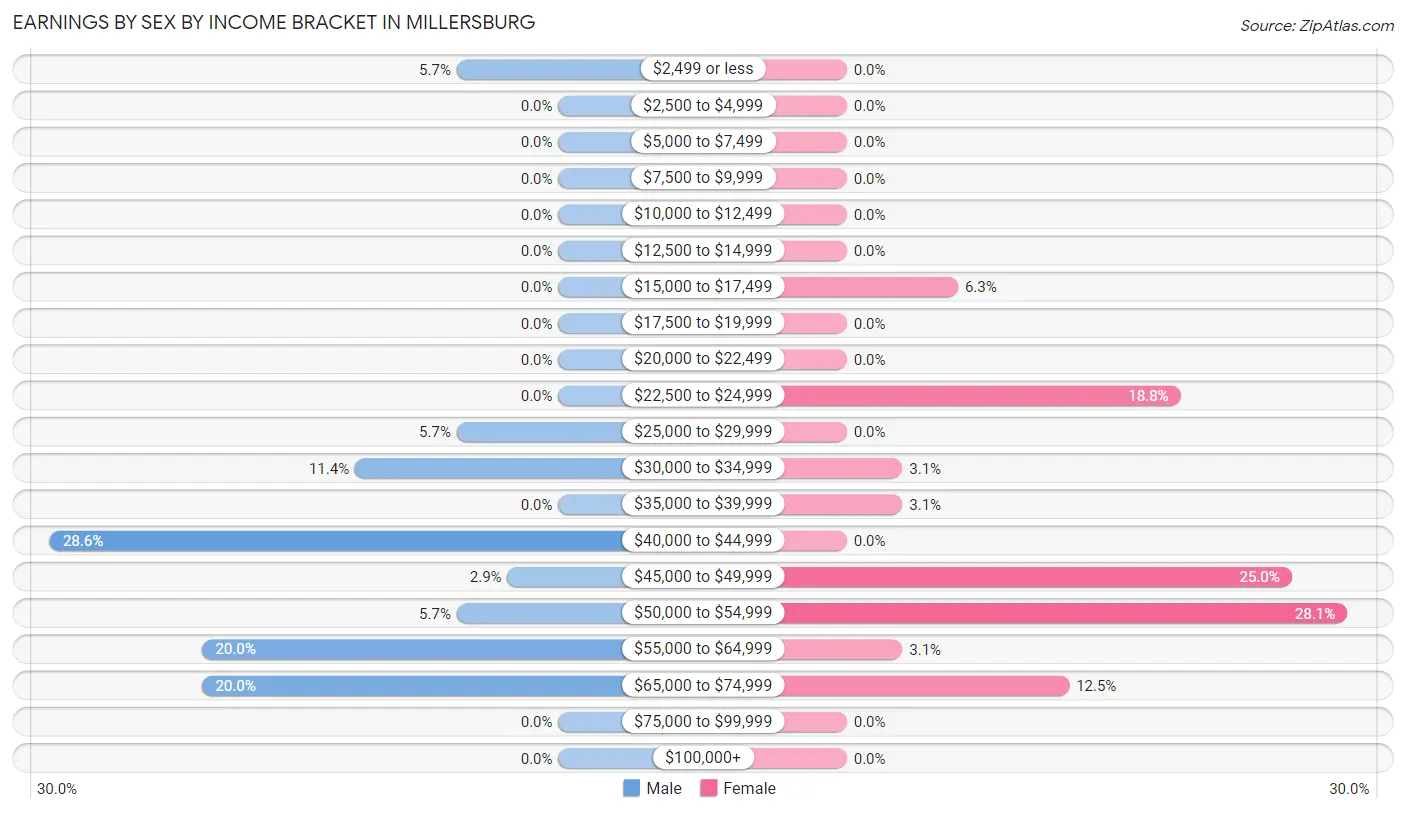
Earnings by Sex by Income Bracket in Millersburg
The most common earnings brackets in Millersburg are $40,000 to $44,999 for men (10 | 28.6%) and $50,000 to $54,999 for women (9 | 28.1%).
| Income | Male | Female |
| $2,499 or less | 2 (5.7%) | 0 (0.0%) |
| $2,500 to $4,999 | 0 (0.0%) | 0 (0.0%) |
| $5,000 to $7,499 | 0 (0.0%) | 0 (0.0%) |
| $7,500 to $9,999 | 0 (0.0%) | 0 (0.0%) |
| $10,000 to $12,499 | 0 (0.0%) | 0 (0.0%) |
| $12,500 to $14,999 | 0 (0.0%) | 0 (0.0%) |
| $15,000 to $17,499 | 0 (0.0%) | 2 (6.2%) |
| $17,500 to $19,999 | 0 (0.0%) | 0 (0.0%) |
| $20,000 to $22,499 | 0 (0.0%) | 0 (0.0%) |
| $22,500 to $24,999 | 0 (0.0%) | 6 (18.8%) |
| $25,000 to $29,999 | 2 (5.7%) | 0 (0.0%) |
| $30,000 to $34,999 | 4 (11.4%) | 1 (3.1%) |
| $35,000 to $39,999 | 0 (0.0%) | 1 (3.1%) |
| $40,000 to $44,999 | 10 (28.6%) | 0 (0.0%) |
| $45,000 to $49,999 | 1 (2.9%) | 8 (25.0%) |
| $50,000 to $54,999 | 2 (5.7%) | 9 (28.1%) |
| $55,000 to $64,999 | 7 (20.0%) | 1 (3.1%) |
| $65,000 to $74,999 | 7 (20.0%) | 4 (12.5%) |
| $75,000 to $99,999 | 0 (0.0%) | 0 (0.0%) |
| $100,000+ | 0 (0.0%) | 0 (0.0%) |
| Total | 35 (100.0%) | 32 (100.0%) |
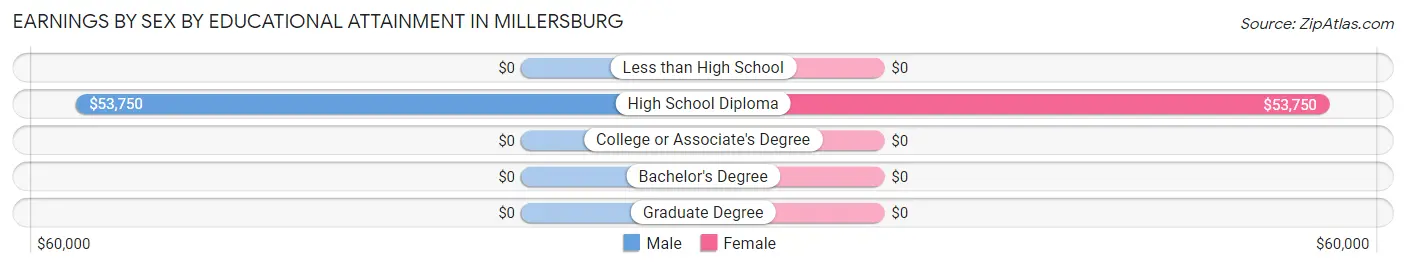
Earnings by Sex by Educational Attainment in Millersburg
Average earnings in Millersburg are $48,750 for men and $47,500 for women, a difference of 2.6%. Men with an educational attainment of high school diploma enjoy the highest average annual earnings of $53,750, while those with high school diploma education earn the least with $53,750. Women with an educational attainment of high school diploma earn the most with the average annual earnings of $53,750, while those with high school diploma education have the smallest earnings of $53,750.
| Educational Attainment | Male Income | Female Income |
| Less than High School | - | - |
| High School Diploma | $53,750 | $53,750 |
| College or Associate's Degree | - | - |
| Bachelor's Degree | - | - |
| Graduate Degree | - | - |
| Total | $48,750 | $47,500 |
Family Income in Millersburg
Family Income Brackets in Millersburg
According to the Millersburg family income data, there are 15 families falling into the $75,000 to $99,999 income range, which is the most common income bracket and makes up 42.9% of all families.
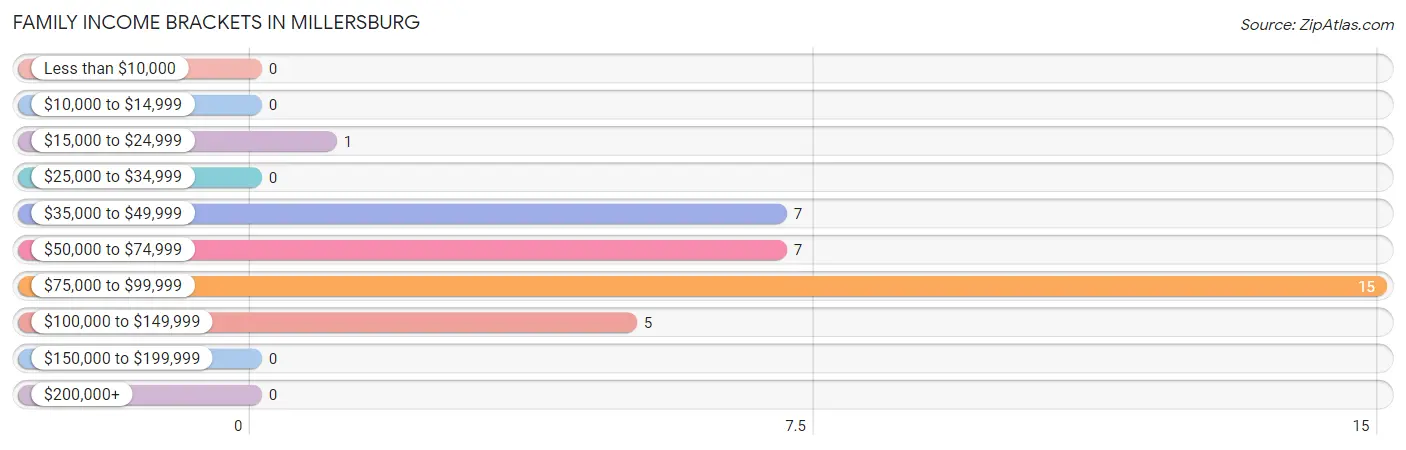
| Income Bracket | # Families | % Families |
| Less than $10,000 | 0 | 0.0% |
| $10,000 to $14,999 | 0 | 0.0% |
| $15,000 to $24,999 | 1 | 2.9% |
| $25,000 to $34,999 | 0 | 0.0% |
| $35,000 to $49,999 | 7 | 20.0% |
| $50,000 to $74,999 | 7 | 20.0% |
| $75,000 to $99,999 | 15 | 42.9% |
| $100,000 to $149,999 | 5 | 14.3% |
| $150,000 to $199,999 | 0 | 0.0% |
| $200,000+ | 0 | 0.0% |
Family Income by Famaliy Size in Millersburg
4-person families (14 | 40.0%) account for the highest median family income in Millersburg with $92,500 per family, while 2-person families (18 | 51.4%) have the highest median income of $36,562 per family member.
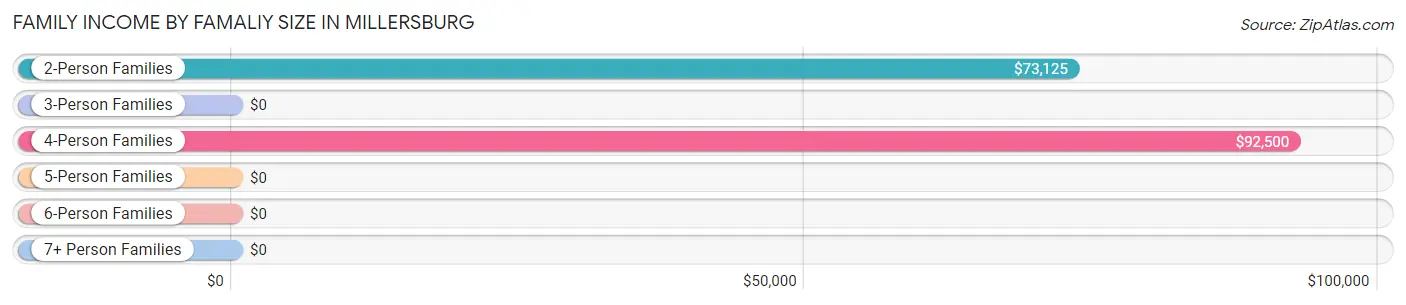
| Income Bracket | # Families | Median Income |
| 2-Person Families | 18 (51.4%) | $73,125 |
| 3-Person Families | 3 (8.6%) | $0 |
| 4-Person Families | 14 (40.0%) | $92,500 |
| 5-Person Families | 0 (0.0%) | $0 |
| 6-Person Families | 0 (0.0%) | $0 |
| 7+ Person Families | 0 (0.0%) | $0 |
| Total | 35 (100.0%) | $90,893 |
Family Income by Number of Earners in Millersburg
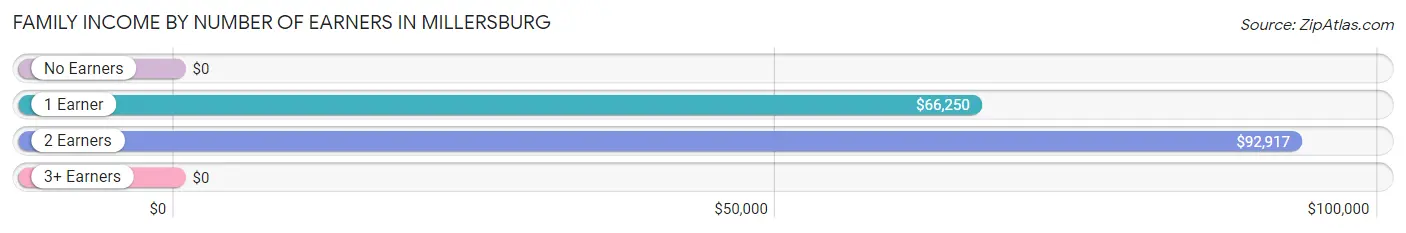
| Number of Earners | # Families | Median Income |
| No Earners | 3 (8.6%) | $0 |
| 1 Earner | 12 (34.3%) | $66,250 |
| 2 Earners | 20 (57.1%) | $92,917 |
| 3+ Earners | 0 (0.0%) | $0 |
| Total | 35 (100.0%) | $90,893 |
Household Income in Millersburg
Household Income Brackets in Millersburg
With 27 households falling in the category, the $100,000 to $149,999 income range is the most frequent in Millersburg, accounting for 31.0% of all households.
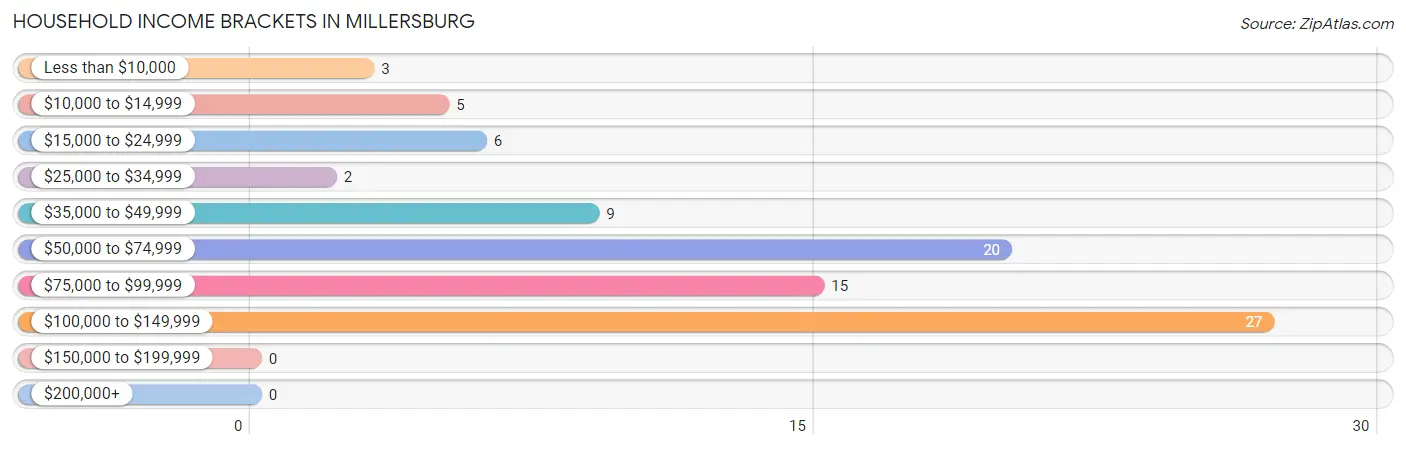
| Income Bracket | # Households | % Households |
| Less than $10,000 | 3 | 3.4% |
| $10,000 to $14,999 | 5 | 5.7% |
| $15,000 to $24,999 | 6 | 6.9% |
| $25,000 to $34,999 | 2 | 2.3% |
| $35,000 to $49,999 | 9 | 10.3% |
| $50,000 to $74,999 | 20 | 23.0% |
| $75,000 to $99,999 | 15 | 17.2% |
| $100,000 to $149,999 | 27 | 31.0% |
| $150,000 to $199,999 | 0 | 0.0% |
| $200,000+ | 0 | 0.0% |
Household Income by Householder Age in Millersburg
The median household income in Millersburg is $74,531, with the highest median household income of $68,750 found in the 45 to 64 years age bracket for the primary householder. A total of 33 households (37.9%) fall into this category. Meanwhile, the 15 to 24 years age bracket for the primary householder has the lowest median household income of $0, with 6 households (6.9%) in this group.
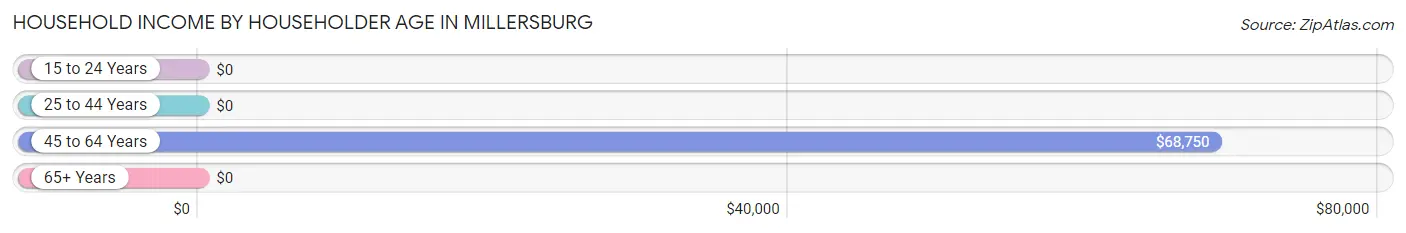
| Income Bracket | # Households | Median Income |
| 15 to 24 Years | 6 (6.9%) | $0 |
| 25 to 44 Years | 7 (8.1%) | $0 |
| 45 to 64 Years | 33 (37.9%) | $68,750 |
| 65+ Years | 41 (47.1%) | $0 |
| Total | 87 (100.0%) | $74,531 |
Poverty in Millersburg
Income Below Poverty by Sex and Age in Millersburg
With 2.4% poverty level for males and 14.3% for females among the residents of Millersburg, 65 to 74 year old males and 75 year old and over females are the most vulnerable to poverty, with 2 males (5.9%) and 3 females (75.0%) in their respective age groups living below the poverty level.
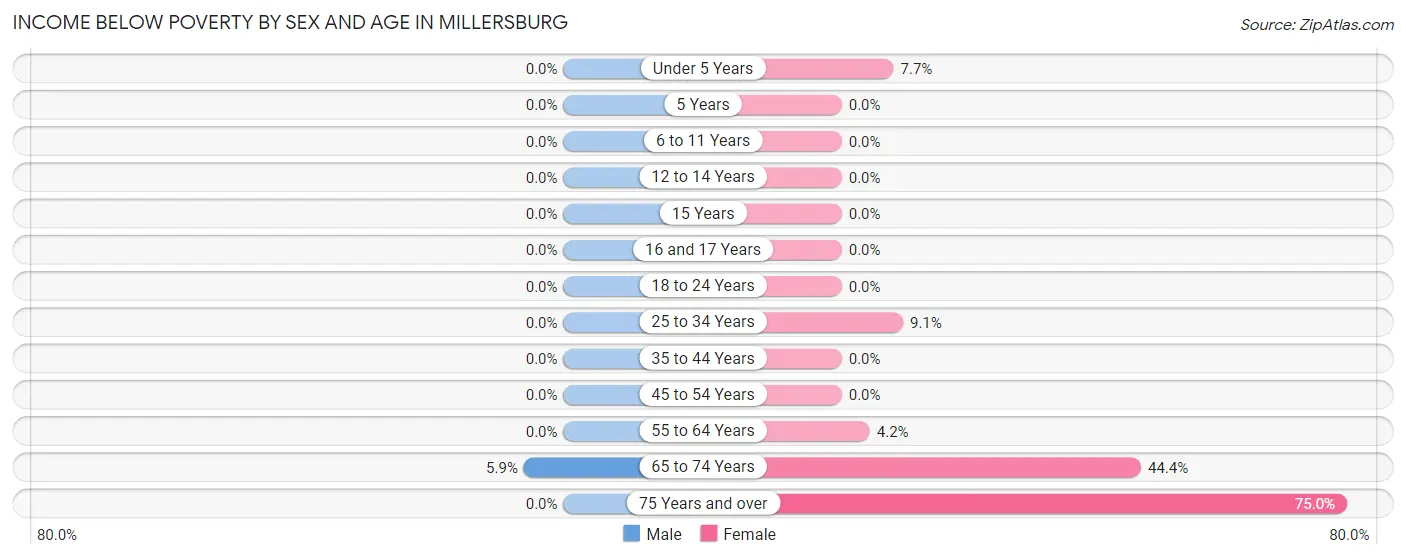
| Age Bracket | Male | Female |
| Under 5 Years | 0 (0.0%) | 1 (7.7%) |
| 5 Years | 0 (0.0%) | 0 (0.0%) |
| 6 to 11 Years | 0 (0.0%) | 0 (0.0%) |
| 12 to 14 Years | 0 (0.0%) | 0 (0.0%) |
| 15 Years | 0 (0.0%) | 0 (0.0%) |
| 16 and 17 Years | 0 (0.0%) | 0 (0.0%) |
| 18 to 24 Years | 0 (0.0%) | 0 (0.0%) |
| 25 to 34 Years | 0 (0.0%) | 1 (9.1%) |
| 35 to 44 Years | 0 (0.0%) | 0 (0.0%) |
| 45 to 54 Years | 0 (0.0%) | 0 (0.0%) |
| 55 to 64 Years | 0 (0.0%) | 1 (4.2%) |
| 65 to 74 Years | 2 (5.9%) | 4 (44.4%) |
| 75 Years and over | 0 (0.0%) | 3 (75.0%) |
| Total | 2 (2.4%) | 10 (14.3%) |
Income Above Poverty by Sex and Age in Millersburg
According to the poverty statistics in Millersburg, males aged under 5 years and females aged 6 to 11 years are the age groups that are most secure financially, with 100.0% of males and 100.0% of females in these age groups living above the poverty line.
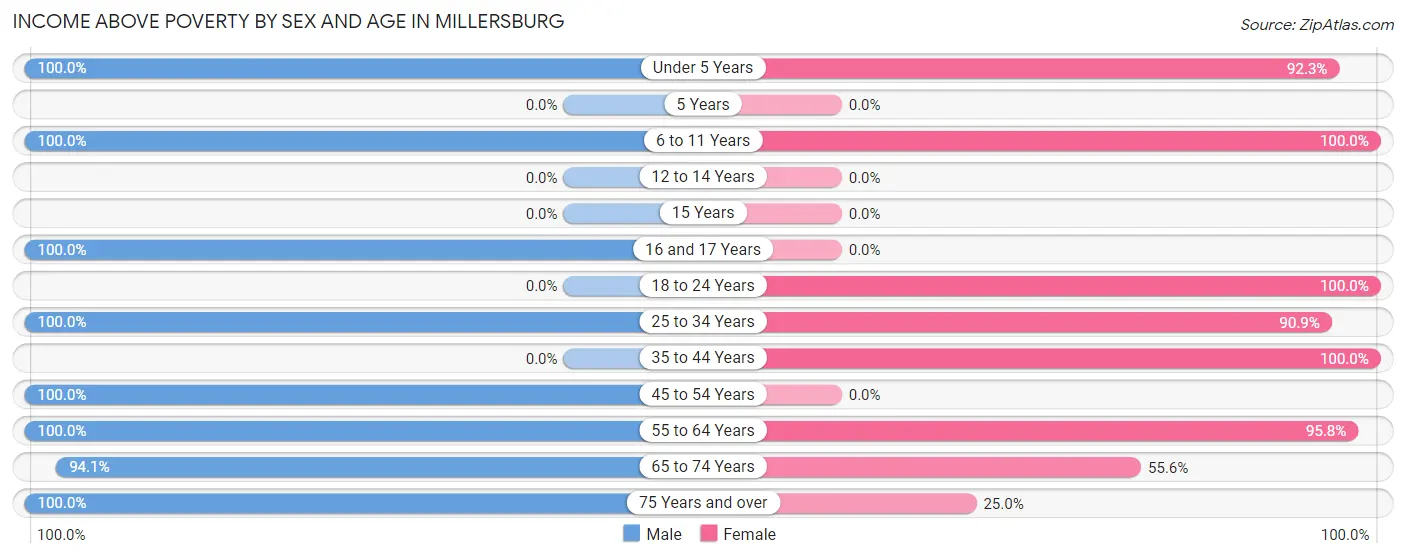
| Age Bracket | Male | Female |
| Under 5 Years | 2 (100.0%) | 12 (92.3%) |
| 5 Years | 0 (0.0%) | 0 (0.0%) |
| 6 to 11 Years | 6 (100.0%) | 2 (100.0%) |
| 12 to 14 Years | 0 (0.0%) | 0 (0.0%) |
| 15 Years | 0 (0.0%) | 0 (0.0%) |
| 16 and 17 Years | 5 (100.0%) | 0 (0.0%) |
| 18 to 24 Years | 0 (0.0%) | 6 (100.0%) |
| 25 to 34 Years | 14 (100.0%) | 10 (90.9%) |
| 35 to 44 Years | 0 (0.0%) | 1 (100.0%) |
| 45 to 54 Years | 1 (100.0%) | 0 (0.0%) |
| 55 to 64 Years | 21 (100.0%) | 23 (95.8%) |
| 65 to 74 Years | 32 (94.1%) | 5 (55.6%) |
| 75 Years and over | 2 (100.0%) | 1 (25.0%) |
| Total | 83 (97.7%) | 60 (85.7%) |
Income Below Poverty Among Married-Couple Families in Millersburg
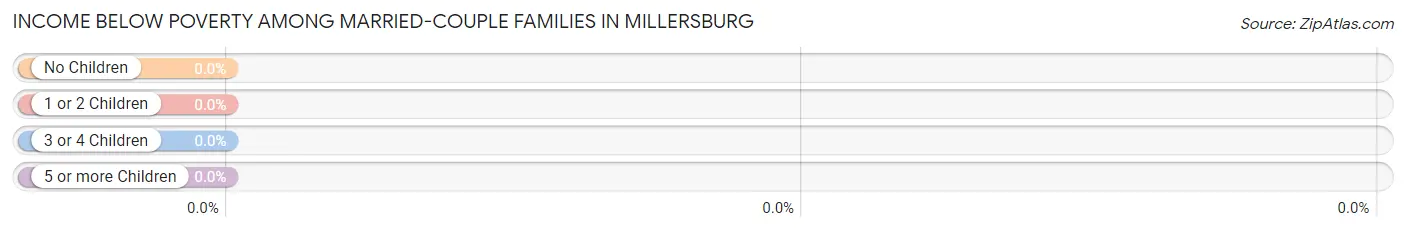
| Children | Above Poverty | Below Poverty |
| No Children | 17 (100.0%) | 0 (0.0%) |
| 1 or 2 Children | 13 (100.0%) | 0 (0.0%) |
| 3 or 4 Children | 0 (0.0%) | 0 (0.0%) |
| 5 or more Children | 0 (0.0%) | 0 (0.0%) |
| Total | 30 (100.0%) | 0 (0.0%) |
Income Below Poverty Among Single-Parent Households in Millersburg
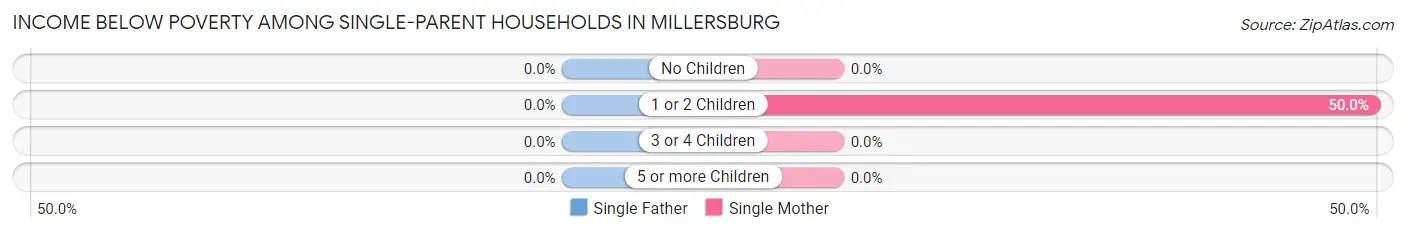
| Children | Single Father | Single Mother |
| No Children | 0 (0.0%) | 0 (0.0%) |
| 1 or 2 Children | 0 (0.0%) | 1 (50.0%) |
| 3 or 4 Children | 0 (0.0%) | 0 (0.0%) |
| 5 or more Children | 0 (0.0%) | 0 (0.0%) |
| Total | 0 (0.0%) | 1 (33.3%) |
Income Below Poverty Among Married-Couple vs Single-Parent Households in Millersburg
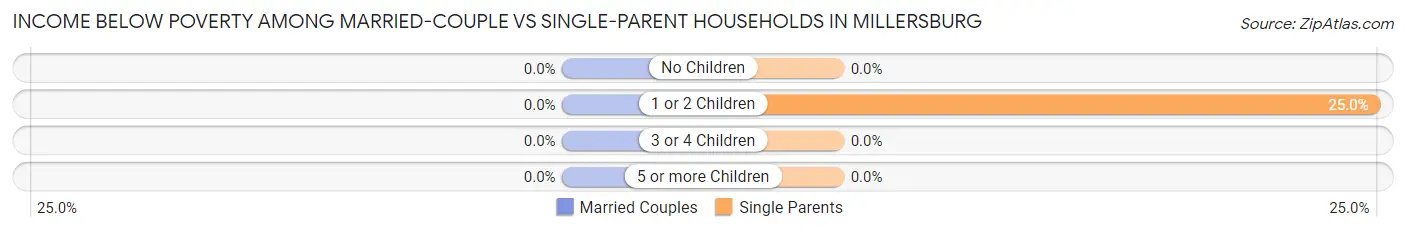
| Children | Married-Couple Families | Single-Parent Households |
| No Children | 0 (0.0%) | 0 (0.0%) |
| 1 or 2 Children | 0 (0.0%) | 1 (25.0%) |
| 3 or 4 Children | 0 (0.0%) | 0 (0.0%) |
| 5 or more Children | 0 (0.0%) | 0 (0.0%) |
| Total | 0 (0.0%) | 1 (20.0%) |
Race in Millersburg
The most populous races in Millersburg are White / Caucasian (149 | 96.1%), Hispanic or Latino (17 | 11.0%), and Two or more Races (4 | 2.6%).
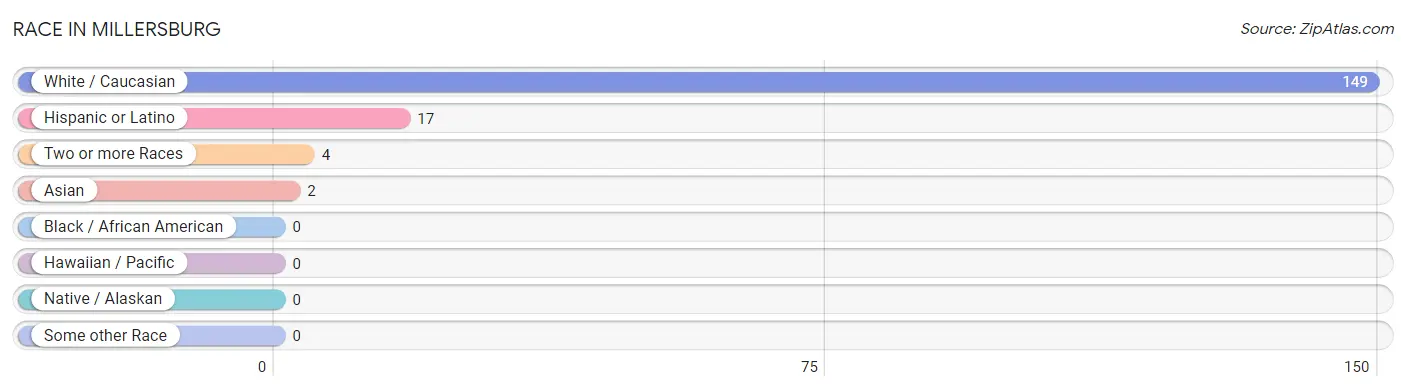
| Race | # Population | % Population |
| Asian | 2 | 1.3% |
| Black / African American | 0 | 0.0% |
| Hawaiian / Pacific | 0 | 0.0% |
| Hispanic or Latino | 17 | 11.0% |
| Native / Alaskan | 0 | 0.0% |
| White / Caucasian | 149 | 96.1% |
| Two or more Races | 4 | 2.6% |
| Some other Race | 0 | 0.0% |
| Total | 155 | 100.0% |
Ancestry in Millersburg
The most populous ancestries reported in Millersburg are German (50 | 32.3%), English (18 | 11.6%), Mexican (17 | 11.0%), Irish (12 | 7.7%), and American (6 | 3.9%), together accounting for 66.4% of all Millersburg residents.
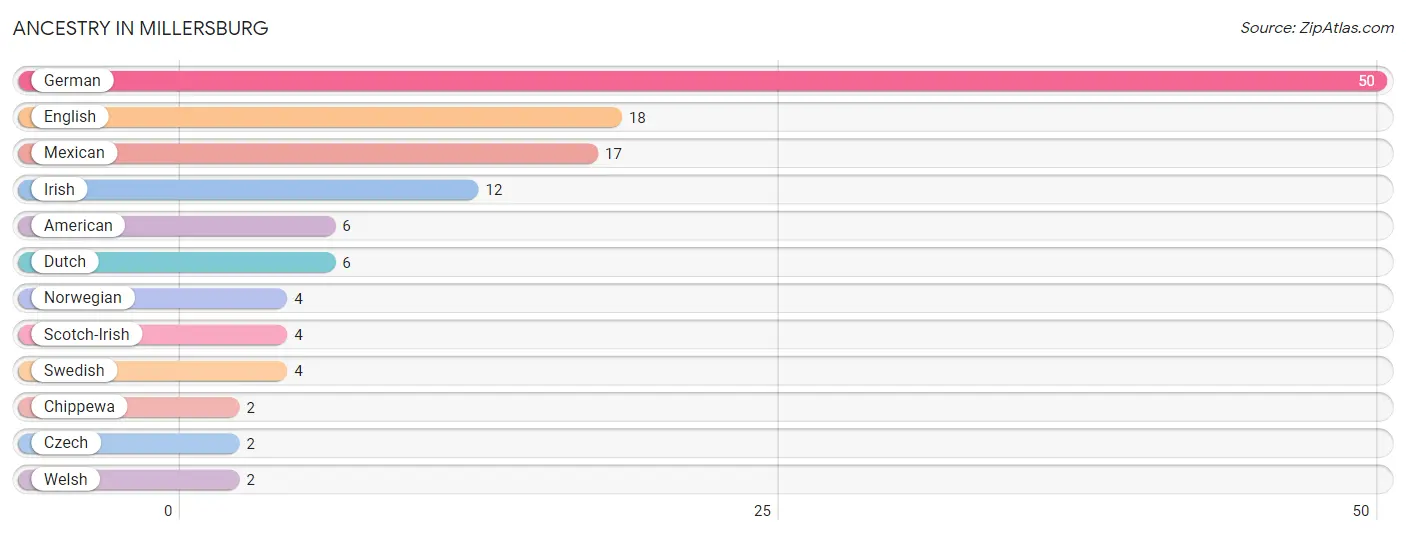
| Ancestry | # Population | % Population |
| American | 6 | 3.9% |
| Chippewa | 2 | 1.3% |
| Czech | 2 | 1.3% |
| Dutch | 6 | 3.9% |
| English | 18 | 11.6% |
| German | 50 | 32.3% |
| Irish | 12 | 7.7% |
| Mexican | 17 | 11.0% |
| Norwegian | 4 | 2.6% |
| Scotch-Irish | 4 | 2.6% |
| Swedish | 4 | 2.6% |
| Welsh | 2 | 1.3% | View All 12 Rows |
Immigrants in Millersburg

| Immigration Origin | # Population | % Population | View All 0 Rows |
Sex and Age in Millersburg
Sex and Age in Millersburg
The most populous age groups in Millersburg are 65 to 69 Years (26 | 30.6%) for men and 55 to 59 Years (16 | 22.9%) for women.
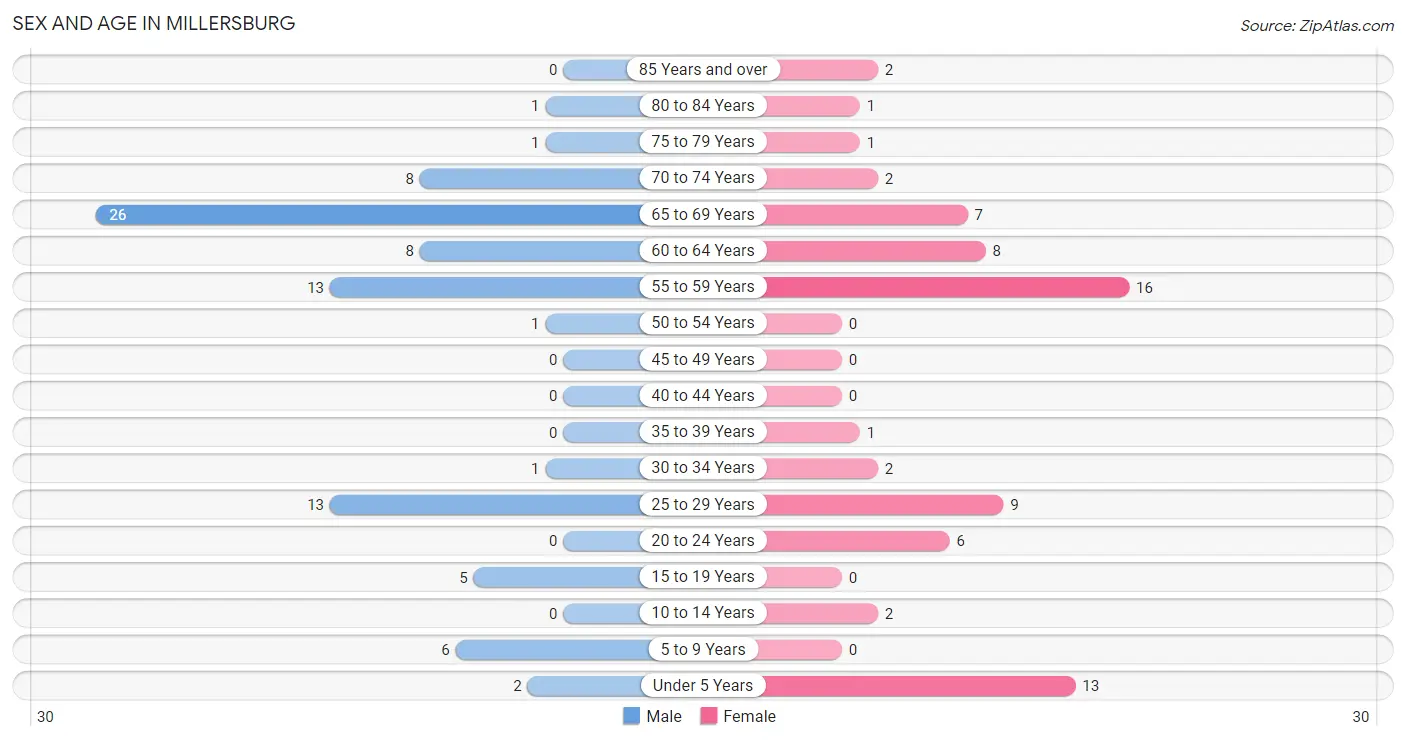
| Age Bracket | Male | Female |
| Under 5 Years | 2 (2.4%) | 13 (18.6%) |
| 5 to 9 Years | 6 (7.1%) | 0 (0.0%) |
| 10 to 14 Years | 0 (0.0%) | 2 (2.9%) |
| 15 to 19 Years | 5 (5.9%) | 0 (0.0%) |
| 20 to 24 Years | 0 (0.0%) | 6 (8.6%) |
| 25 to 29 Years | 13 (15.3%) | 9 (12.9%) |
| 30 to 34 Years | 1 (1.2%) | 2 (2.9%) |
| 35 to 39 Years | 0 (0.0%) | 1 (1.4%) |
| 40 to 44 Years | 0 (0.0%) | 0 (0.0%) |
| 45 to 49 Years | 0 (0.0%) | 0 (0.0%) |
| 50 to 54 Years | 1 (1.2%) | 0 (0.0%) |
| 55 to 59 Years | 13 (15.3%) | 16 (22.9%) |
| 60 to 64 Years | 8 (9.4%) | 8 (11.4%) |
| 65 to 69 Years | 26 (30.6%) | 7 (10.0%) |
| 70 to 74 Years | 8 (9.4%) | 2 (2.9%) |
| 75 to 79 Years | 1 (1.2%) | 1 (1.4%) |
| 80 to 84 Years | 1 (1.2%) | 1 (1.4%) |
| 85 Years and over | 0 (0.0%) | 2 (2.9%) |
| Total | 85 (100.0%) | 70 (100.0%) |
Families and Households in Millersburg
Median Family Size in Millersburg
The median family size in Millersburg is 2.86 persons per family, with single male/father families (2 | 5.7%) accounting for the largest median family size of 3.5 persons per family. On the other hand, single female/mother families (3 | 8.6%) represent the smallest median family size with 2.67 persons per family.
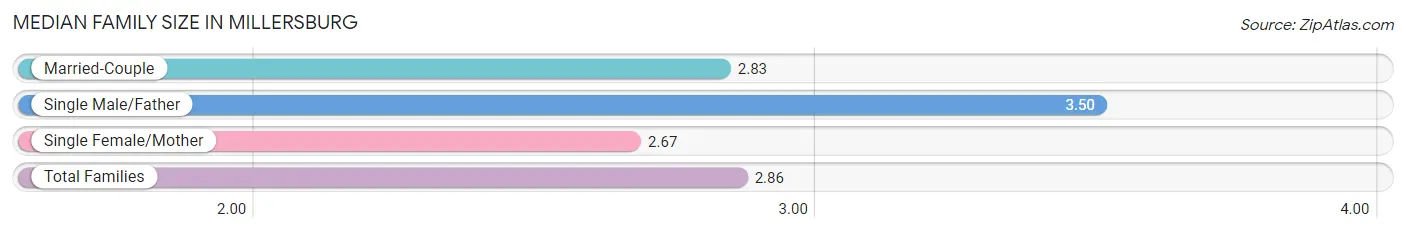
| Family Type | # Families | Family Size |
| Married-Couple | 30 (85.7%) | 2.83 |
| Single Male/Father | 2 (5.7%) | 3.50 |
| Single Female/Mother | 3 (8.6%) | 2.67 |
| Total Families | 35 (100.0%) | 2.86 |
Median Household Size in Millersburg
The median household size in Millersburg is 1.78 persons per household, with single male/father households (2 | 2.3%) accounting for the largest median household size of 3.5 persons per household. non-family households (52 | 59.8%) represent the smallest median household size with 1.02 persons per household.
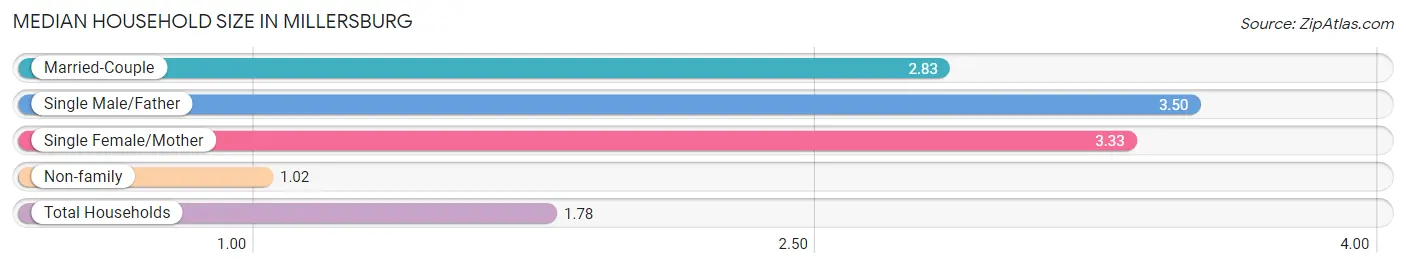
| Household Type | # Households | Household Size |
| Married-Couple | 30 (34.5%) | 2.83 |
| Single Male/Father | 2 (2.3%) | 3.50 |
| Single Female/Mother | 3 (3.5%) | 3.33 |
| Non-family | 52 (59.8%) | 1.02 |
| Total Households | 87 (100.0%) | 1.78 |
Household Size by Marriage Status in Millersburg
Out of a total of 87 households in Millersburg, 35 (40.2%) are family households, while 52 (59.8%) are nonfamily households. The most numerous type of family households are 2-person households, comprising 18, and the most common type of nonfamily households are 1-person households, comprising 51.
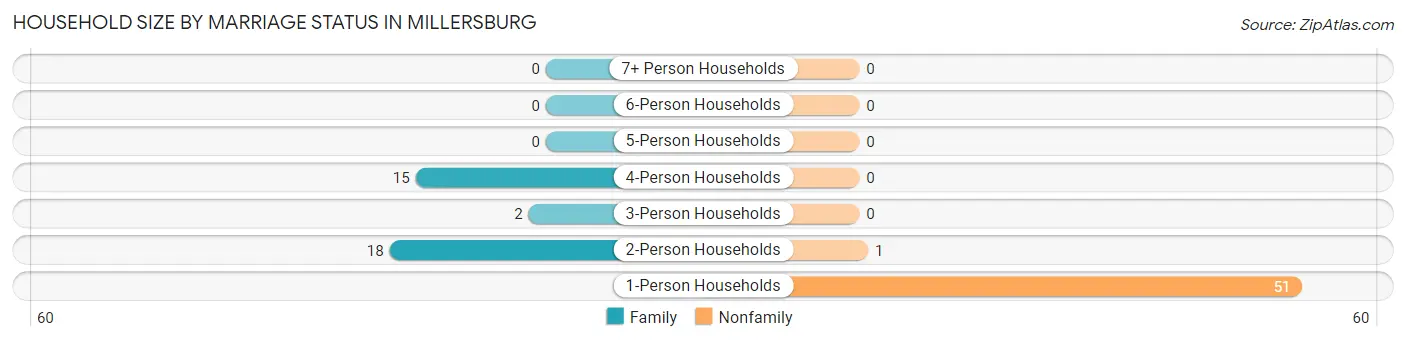
| Household Size | Family Households | Nonfamily Households |
| 1-Person Households | - | 51 (58.6%) |
| 2-Person Households | 18 (20.7%) | 1 (1.1%) |
| 3-Person Households | 2 (2.3%) | 0 (0.0%) |
| 4-Person Households | 15 (17.2%) | 0 (0.0%) |
| 5-Person Households | 0 (0.0%) | 0 (0.0%) |
| 6-Person Households | 0 (0.0%) | 0 (0.0%) |
| 7+ Person Households | 0 (0.0%) | 0 (0.0%) |
| Total | 35 (40.2%) | 52 (59.8%) |
Female Fertility in Millersburg
Fertility by Age in Millersburg
Average fertility rate in Millersburg is 111.0 births per 1,000 women. Women in the age bracket of 20 to 34 years have the highest fertility rate with 118.0 births per 1,000 women. Women in the age bracket of 20 to 34 years acount for 100.0% of all women with births.
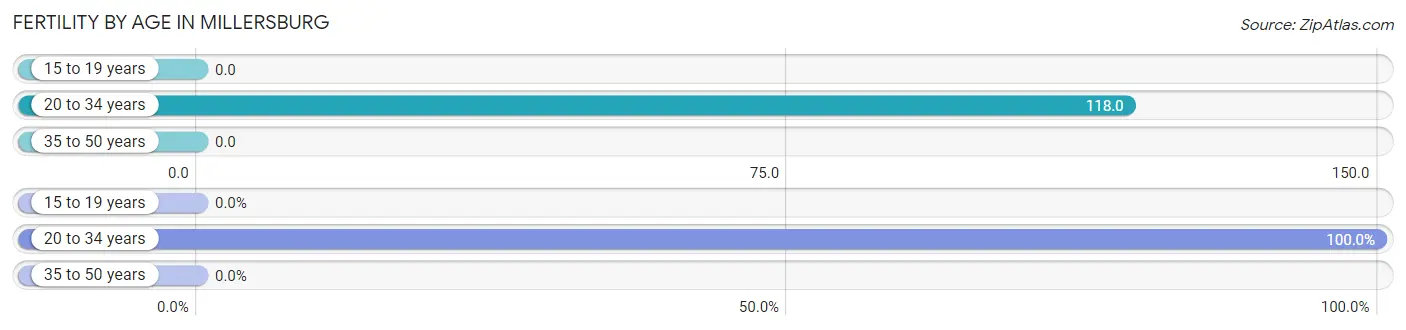
| Age Bracket | Women with Births | Births / 1,000 Women |
| 15 to 19 years | 0 (0.0%) | 0.0 |
| 20 to 34 years | 2 (100.0%) | 118.0 |
| 35 to 50 years | 0 (0.0%) | 0.0 |
| Total | 2 (100.0%) | 111.0 |
Fertility by Age by Marriage Status in Millersburg
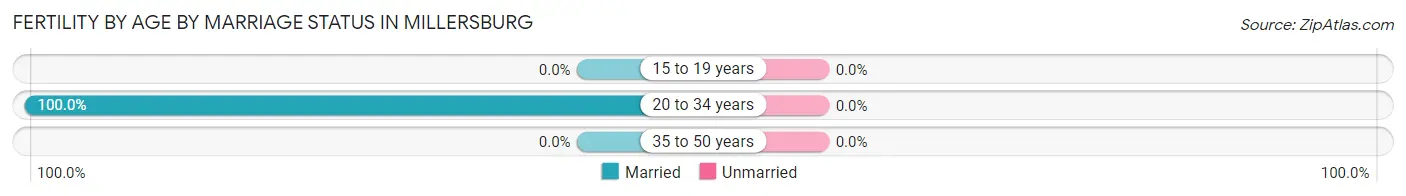
| Age Bracket | Married | Unmarried |
| 15 to 19 years | 0 (0.0%) | 0 (0.0%) |
| 20 to 34 years | 2 (100.0%) | 0 (0.0%) |
| 35 to 50 years | 0 (0.0%) | 0 (0.0%) |
| Total | 2 (100.0%) | 0 (0.0%) |
Fertility by Education in Millersburg
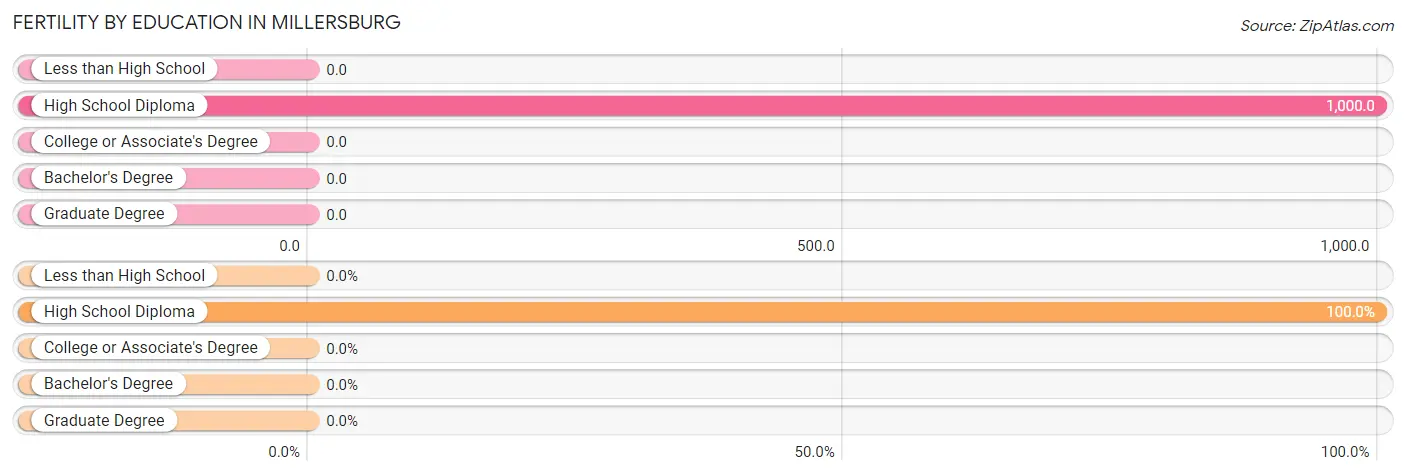
| Educational Attainment | Women with Births | Births / 1,000 Women |
| Less than High School | 0 (0.0%) | 0.0 |
| High School Diploma | 2 (100.0%) | 1,000.0 |
| College or Associate's Degree | 0 (0.0%) | 0.0 |
| Bachelor's Degree | 0 (0.0%) | 0.0 |
| Graduate Degree | 0 (0.0%) | 0.0 |
| Total | 2 (100.0%) | 111.0 |
Fertility by Education by Marriage Status in Millersburg
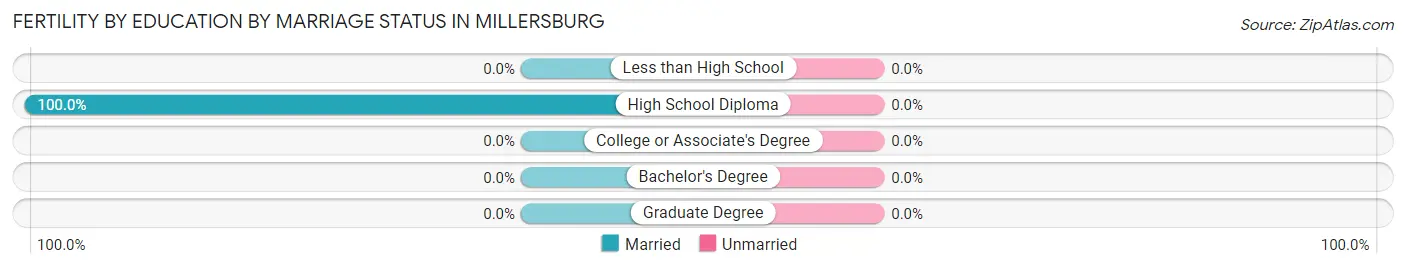
| Educational Attainment | Married | Unmarried |
| Less than High School | 0 (0.0%) | 0 (0.0%) |
| High School Diploma | 2 (100.0%) | 0 (0.0%) |
| College or Associate's Degree | 0 (0.0%) | 0 (0.0%) |
| Bachelor's Degree | 0 (0.0%) | 0 (0.0%) |
| Graduate Degree | 0 (0.0%) | 0 (0.0%) |
| Total | 2 (100.0%) | 0 (0.0%) |
Employment Characteristics in Millersburg
Employment by Class of Employer in Millersburg
Among the 62 employed individuals in Millersburg, private company employees (46 | 74.2%), state government employees (7 | 11.3%), and self-employed (incorporated) (4 | 6.5%) make up the most common classes of employment.
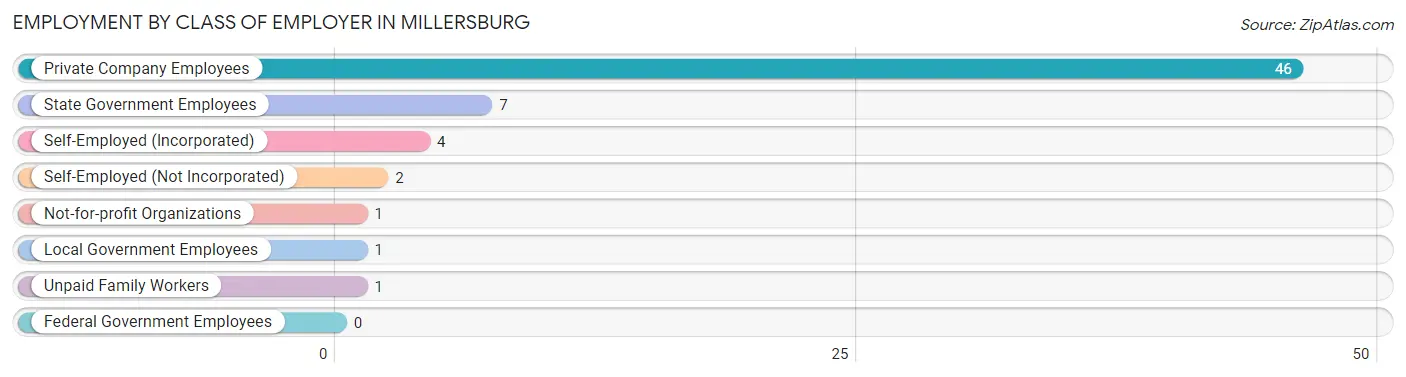
| Employer Class | # Employees | % Employees |
| Private Company Employees | 46 | 74.2% |
| Self-Employed (Incorporated) | 4 | 6.5% |
| Self-Employed (Not Incorporated) | 2 | 3.2% |
| Not-for-profit Organizations | 1 | 1.6% |
| Local Government Employees | 1 | 1.6% |
| State Government Employees | 7 | 11.3% |
| Federal Government Employees | 0 | 0.0% |
| Unpaid Family Workers | 1 | 1.6% |
| Total | 62 | 100.0% |
Employment Status by Age in Millersburg
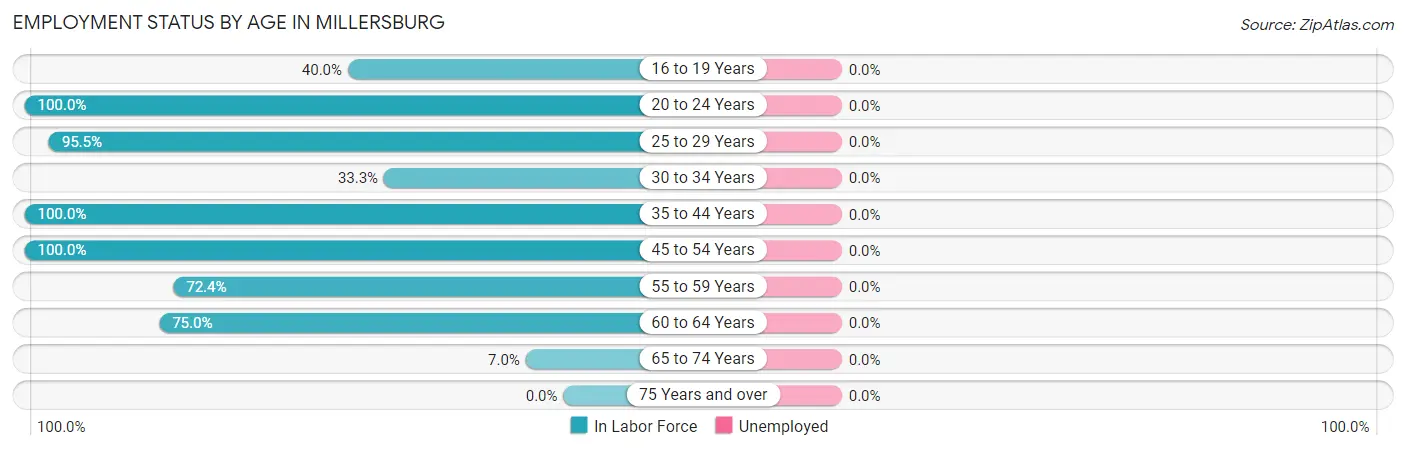
| Age Bracket | In Labor Force | Unemployed |
| 16 to 19 Years | 2 (40.0%) | 0 (0.0%) |
| 20 to 24 Years | 6 (100.0%) | 0 (0.0%) |
| 25 to 29 Years | 21 (95.5%) | 0 (0.0%) |
| 30 to 34 Years | 1 (33.3%) | 0 (0.0%) |
| 35 to 44 Years | 1 (100.0%) | 0 (0.0%) |
| 45 to 54 Years | 1 (100.0%) | 0 (0.0%) |
| 55 to 59 Years | 21 (72.4%) | 0 (0.0%) |
| 60 to 64 Years | 12 (75.0%) | 0 (0.0%) |
| 65 to 74 Years | 3 (7.0%) | 0 (0.0%) |
| 75 Years and over | 0 (0.0%) | 0 (0.0%) |
| Total | 68 (51.5%) | 0 (0.0%) |
Employment Status by Educational Attainment in Millersburg
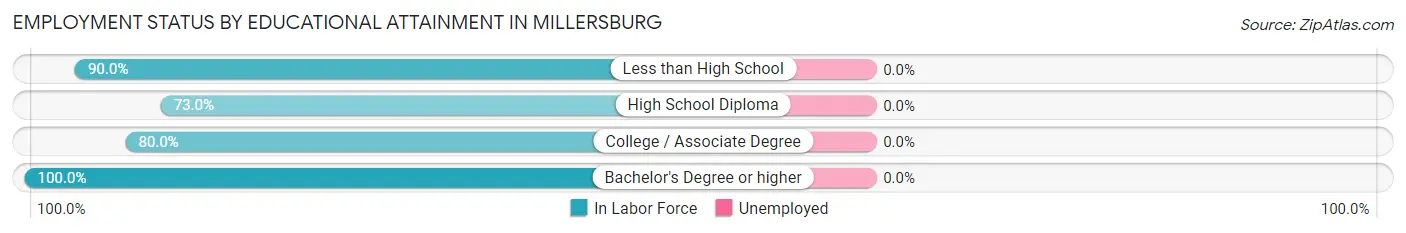
| Educational Attainment | In Labor Force | Unemployed |
| Less than High School | 9 (90.0%) | 0 (0.0%) |
| High School Diploma | 27 (73.0%) | 0 (0.0%) |
| College / Associate Degree | 16 (80.0%) | 0 (0.0%) |
| Bachelor's Degree or higher | 5 (100.0%) | 0 (0.0%) |
| Total | 57 (79.2%) | 0 (0.0%) |
Employment Occupations by Sex in Millersburg
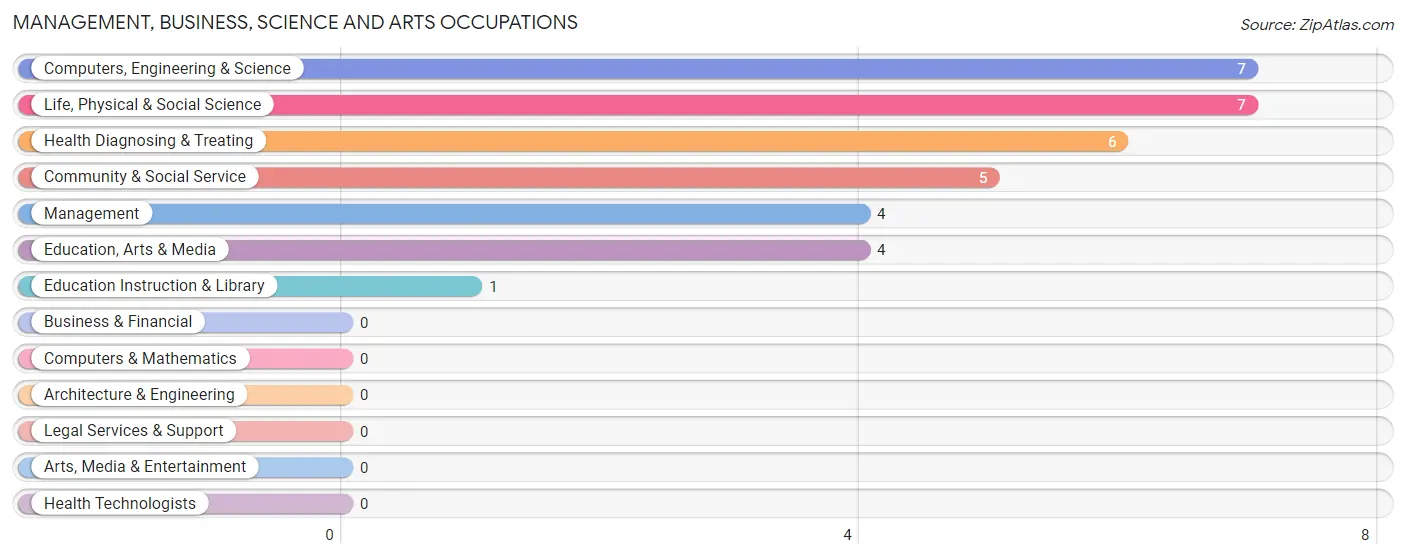
Management, Business, Science and Arts Occupations
The most common Management, Business, Science and Arts occupations in Millersburg are Computers, Engineering & Science (7 | 10.3%), Life, Physical & Social Science (7 | 10.3%), Health Diagnosing & Treating (6 | 8.8%), Community & Social Service (5 | 7.3%), and Management (4 | 5.9%).
Management, Business, Science and Arts Occupations by Sex
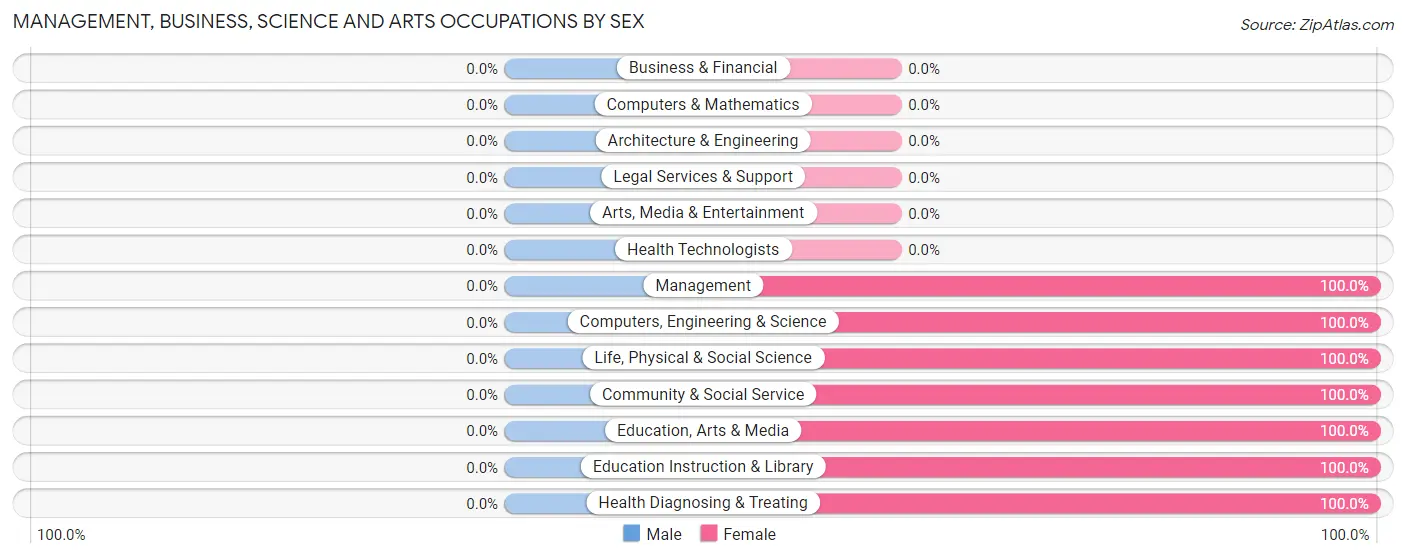
| Occupation | Male | Female |
| Management | 0 (0.0%) | 4 (100.0%) |
| Business & Financial | 0 (0.0%) | 0 (0.0%) |
| Computers, Engineering & Science | 0 (0.0%) | 7 (100.0%) |
| Computers & Mathematics | 0 (0.0%) | 0 (0.0%) |
| Architecture & Engineering | 0 (0.0%) | 0 (0.0%) |
| Life, Physical & Social Science | 0 (0.0%) | 7 (100.0%) |
| Community & Social Service | 0 (0.0%) | 5 (100.0%) |
| Education, Arts & Media | 0 (0.0%) | 4 (100.0%) |
| Legal Services & Support | 0 (0.0%) | 0 (0.0%) |
| Education Instruction & Library | 0 (0.0%) | 1 (100.0%) |
| Arts, Media & Entertainment | 0 (0.0%) | 0 (0.0%) |
| Health Diagnosing & Treating | 0 (0.0%) | 6 (100.0%) |
| Health Technologists | 0 (0.0%) | 0 (0.0%) |
| Total (Category) | 0 (0.0%) | 22 (100.0%) |
| Total (Overall) | 36 (52.9%) | 32 (47.1%) |
Services Occupations
The most common Services occupations in Millersburg are Cleaning & Maintenance (4 | 5.9%), Healthcare Support (1 | 1.5%), Security & Protection (1 | 1.5%), Firefighting & Prevention (1 | 1.5%), and Food Preparation & Serving (1 | 1.5%).
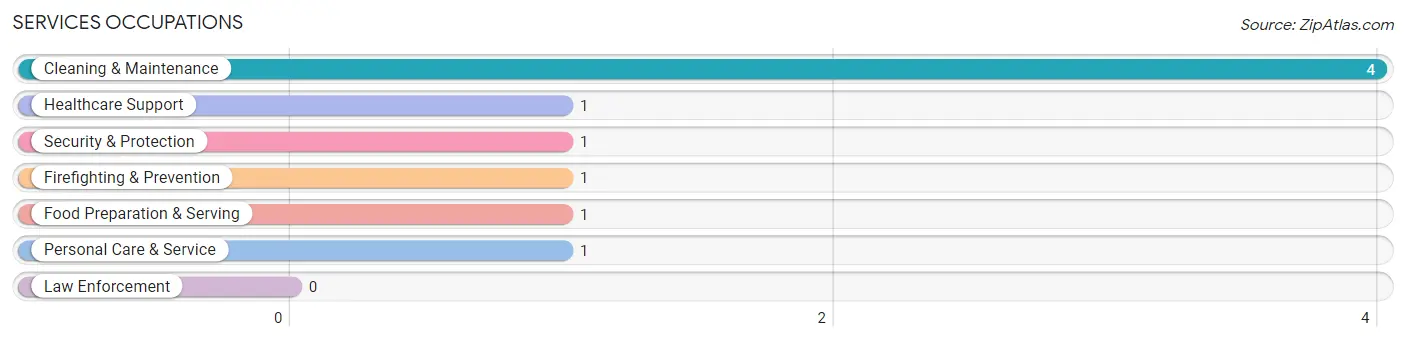
Services Occupations by Sex
Within the Services occupations in Millersburg, the most male-oriented occupations are Security & Protection (100.0%), Firefighting & Prevention (100.0%), and Food Preparation & Serving (100.0%), while the most female-oriented occupations are Healthcare Support (100.0%), Personal Care & Service (100.0%), and Cleaning & Maintenance (50.0%).
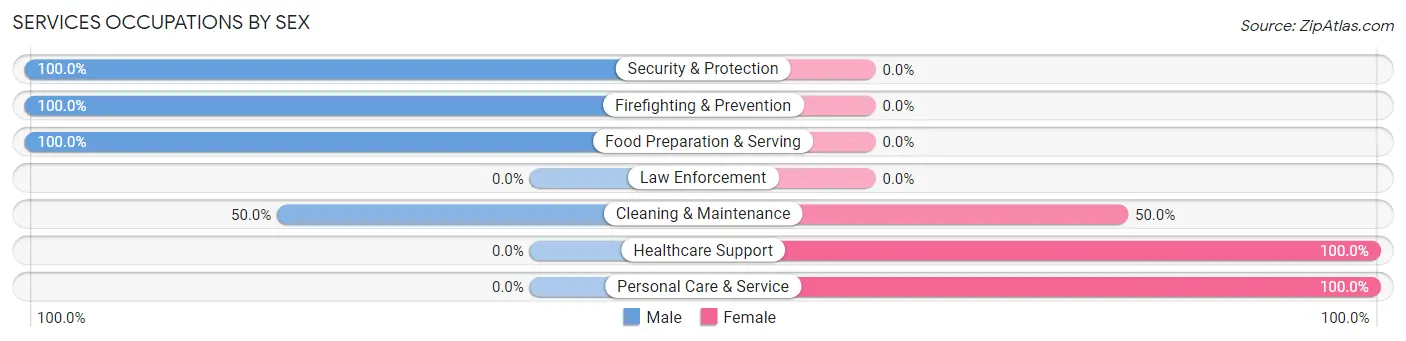
| Occupation | Male | Female |
| Healthcare Support | 0 (0.0%) | 1 (100.0%) |
| Security & Protection | 1 (100.0%) | 0 (0.0%) |
| Firefighting & Prevention | 1 (100.0%) | 0 (0.0%) |
| Law Enforcement | 0 (0.0%) | 0 (0.0%) |
| Food Preparation & Serving | 1 (100.0%) | 0 (0.0%) |
| Cleaning & Maintenance | 2 (50.0%) | 2 (50.0%) |
| Personal Care & Service | 0 (0.0%) | 1 (100.0%) |
| Total (Category) | 4 (50.0%) | 4 (50.0%) |
| Total (Overall) | 36 (52.9%) | 32 (47.1%) |
Sales and Office Occupations
The most common Sales and Office occupations in Millersburg are Sales & Related (6 | 8.8%), and Office & Administration (1 | 1.5%).
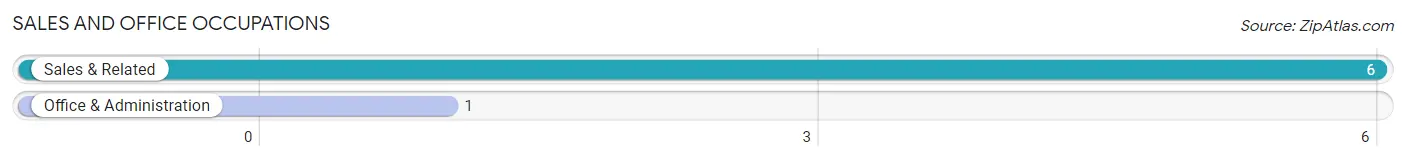
Sales and Office Occupations by Sex

| Occupation | Male | Female |
| Sales & Related | 5 (83.3%) | 1 (16.7%) |
| Office & Administration | 0 (0.0%) | 1 (100.0%) |
| Total (Category) | 5 (71.4%) | 2 (28.6%) |
| Total (Overall) | 36 (52.9%) | 32 (47.1%) |
Natural Resources, Construction and Maintenance Occupations
The most common Natural Resources, Construction and Maintenance occupations in Millersburg are Farming, Fishing & Forestry (9 | 13.2%), Construction & Extraction (6 | 8.8%), and Installation, Maintenance & Repair (2 | 2.9%).
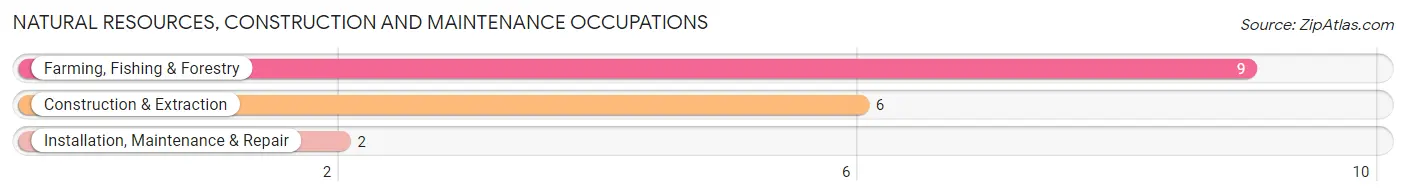
Natural Resources, Construction and Maintenance Occupations by Sex
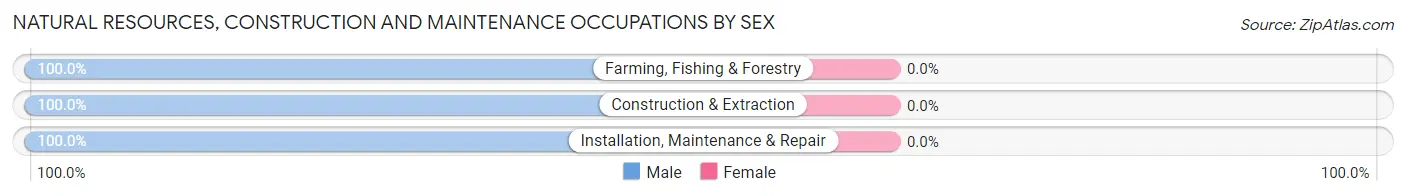
| Occupation | Male | Female |
| Farming, Fishing & Forestry | 9 (100.0%) | 0 (0.0%) |
| Construction & Extraction | 6 (100.0%) | 0 (0.0%) |
| Installation, Maintenance & Repair | 2 (100.0%) | 0 (0.0%) |
| Total (Category) | 17 (100.0%) | 0 (0.0%) |
| Total (Overall) | 36 (52.9%) | 32 (47.1%) |
Production, Transportation and Moving Occupations
The most common Production, Transportation and Moving occupations in Millersburg are Transportation (9 | 13.2%), Material Moving (4 | 5.9%), and Production (1 | 1.5%).
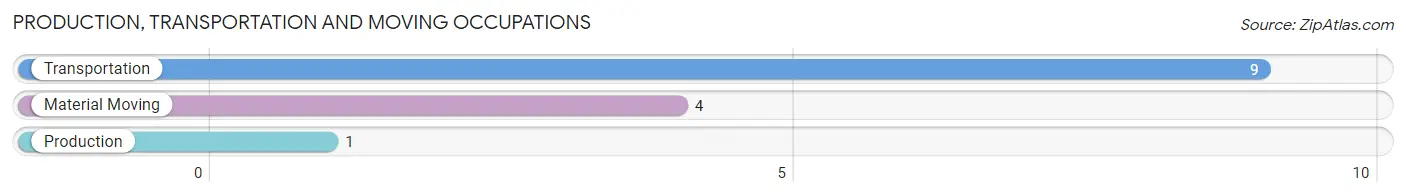
Production, Transportation and Moving Occupations by Sex
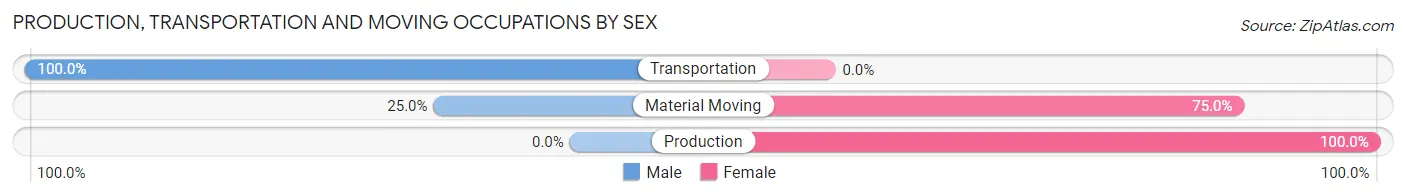
| Occupation | Male | Female |
| Production | 0 (0.0%) | 1 (100.0%) |
| Transportation | 9 (100.0%) | 0 (0.0%) |
| Material Moving | 1 (25.0%) | 3 (75.0%) |
| Total (Category) | 10 (71.4%) | 4 (28.6%) |
| Total (Overall) | 36 (52.9%) | 32 (47.1%) |
Employment Industries by Sex in Millersburg
Employment Industries in Millersburg
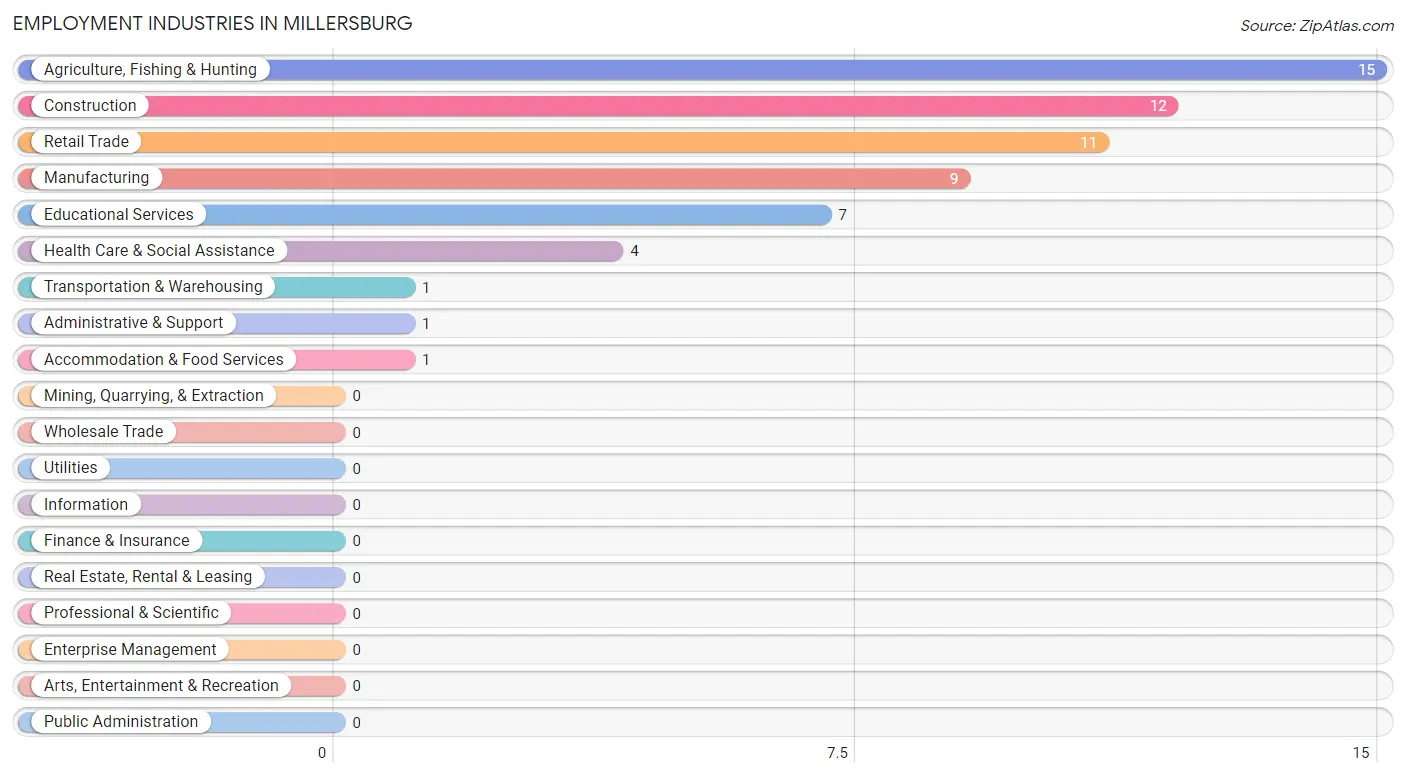
The major employment industries in Millersburg include Agriculture, Fishing & Hunting (15 | 22.1%), Construction (12 | 17.6%), Retail Trade (11 | 16.2%), Manufacturing (9 | 13.2%), and Educational Services (7 | 10.3%).
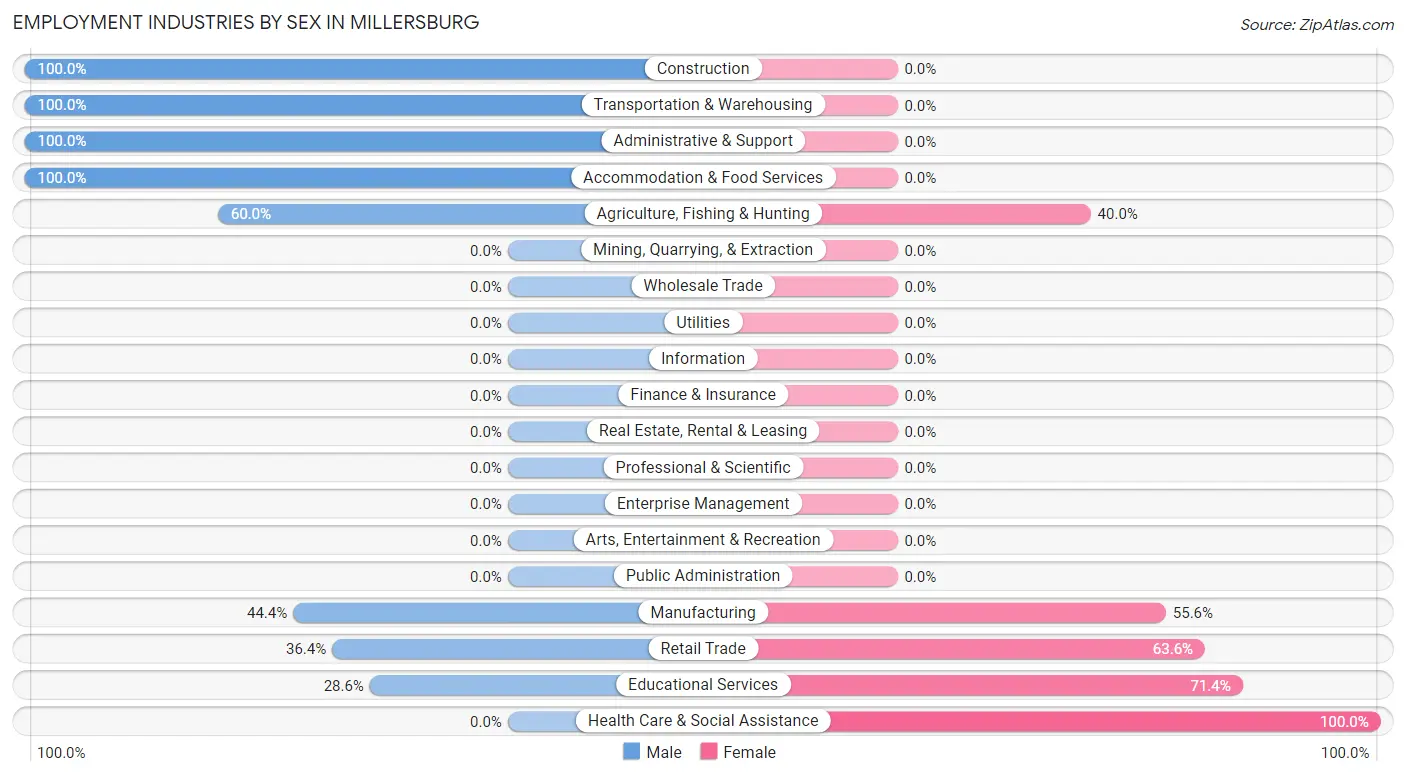
Employment Industries by Sex in Millersburg
The Millersburg industries that see more men than women are Construction (100.0%), Transportation & Warehousing (100.0%), and Administrative & Support (100.0%), whereas the industries that tend to have a higher number of women are Health Care & Social Assistance (100.0%), Educational Services (71.4%), and Retail Trade (63.6%).
| Industry | Male | Female |
| Agriculture, Fishing & Hunting | 9 (60.0%) | 6 (40.0%) |
| Mining, Quarrying, & Extraction | 0 (0.0%) | 0 (0.0%) |
| Construction | 12 (100.0%) | 0 (0.0%) |
| Manufacturing | 4 (44.4%) | 5 (55.6%) |
| Wholesale Trade | 0 (0.0%) | 0 (0.0%) |
| Retail Trade | 4 (36.4%) | 7 (63.6%) |
| Transportation & Warehousing | 1 (100.0%) | 0 (0.0%) |
| Utilities | 0 (0.0%) | 0 (0.0%) |
| Information | 0 (0.0%) | 0 (0.0%) |
| Finance & Insurance | 0 (0.0%) | 0 (0.0%) |
| Real Estate, Rental & Leasing | 0 (0.0%) | 0 (0.0%) |
| Professional & Scientific | 0 (0.0%) | 0 (0.0%) |
| Enterprise Management | 0 (0.0%) | 0 (0.0%) |
| Administrative & Support | 1 (100.0%) | 0 (0.0%) |
| Educational Services | 2 (28.6%) | 5 (71.4%) |
| Health Care & Social Assistance | 0 (0.0%) | 4 (100.0%) |
| Arts, Entertainment & Recreation | 0 (0.0%) | 0 (0.0%) |
| Accommodation & Food Services | 1 (100.0%) | 0 (0.0%) |
| Public Administration | 0 (0.0%) | 0 (0.0%) |
| Total | 36 (52.9%) | 32 (47.1%) |
Education in Millersburg
School Enrollment in Millersburg
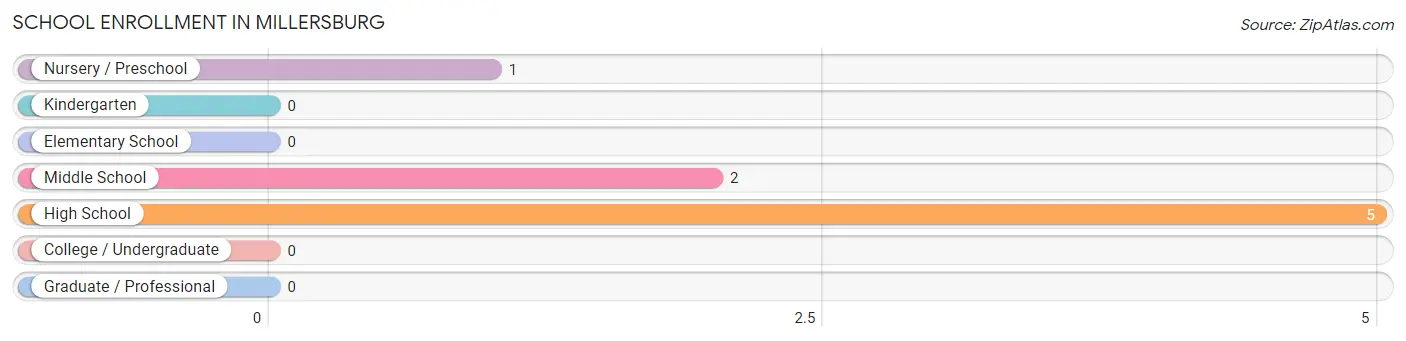
The most common levels of schooling among the 8 students in Millersburg are high school (5 | 62.5%), middle school (2 | 25.0%), and nursery / preschool (1 | 12.5%).
| School Level | # Students | % Students |
| Nursery / Preschool | 1 | 12.5% |
| Kindergarten | 0 | 0.0% |
| Elementary School | 0 | 0.0% |
| Middle School | 2 | 25.0% |
| High School | 5 | 62.5% |
| College / Undergraduate | 0 | 0.0% |
| Graduate / Professional | 0 | 0.0% |
| Total | 8 | 100.0% |
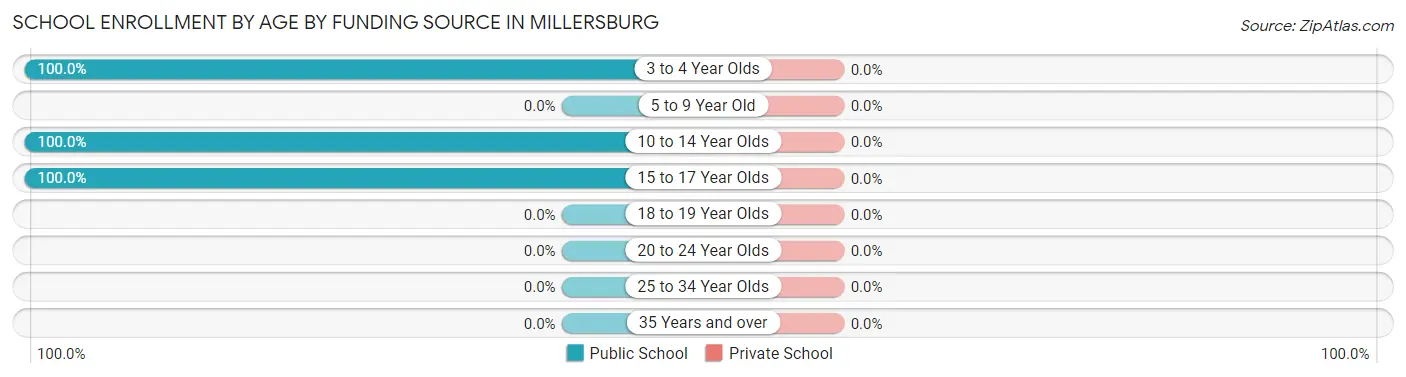
School Enrollment by Age by Funding Source in Millersburg
| Age Bracket | Public School | Private School |
| 3 to 4 Year Olds | 1 (100.0%) | 0 (0.0%) |
| 5 to 9 Year Old | 0 (0.0%) | 0 (0.0%) |
| 10 to 14 Year Olds | 2 (100.0%) | 0 (0.0%) |
| 15 to 17 Year Olds | 5 (100.0%) | 0 (0.0%) |
| 18 to 19 Year Olds | 0 (0.0%) | 0 (0.0%) |
| 20 to 24 Year Olds | 0 (0.0%) | 0 (0.0%) |
| 25 to 34 Year Olds | 0 (0.0%) | 0 (0.0%) |
| 35 Years and over | 0 (0.0%) | 0 (0.0%) |
| Total | 8 (100.0%) | 0 (0.0%) |
Educational Attainment by Field of Study in Millersburg
Social sciences (22 | 59.5%), engineering (4 | 10.8%), science & technology (4 | 10.8%), communications (4 | 10.8%), and bio, nature & agricultural (2 | 5.4%) are the most common fields of study among 37 individuals in Millersburg who have obtained a bachelor's degree or higher.
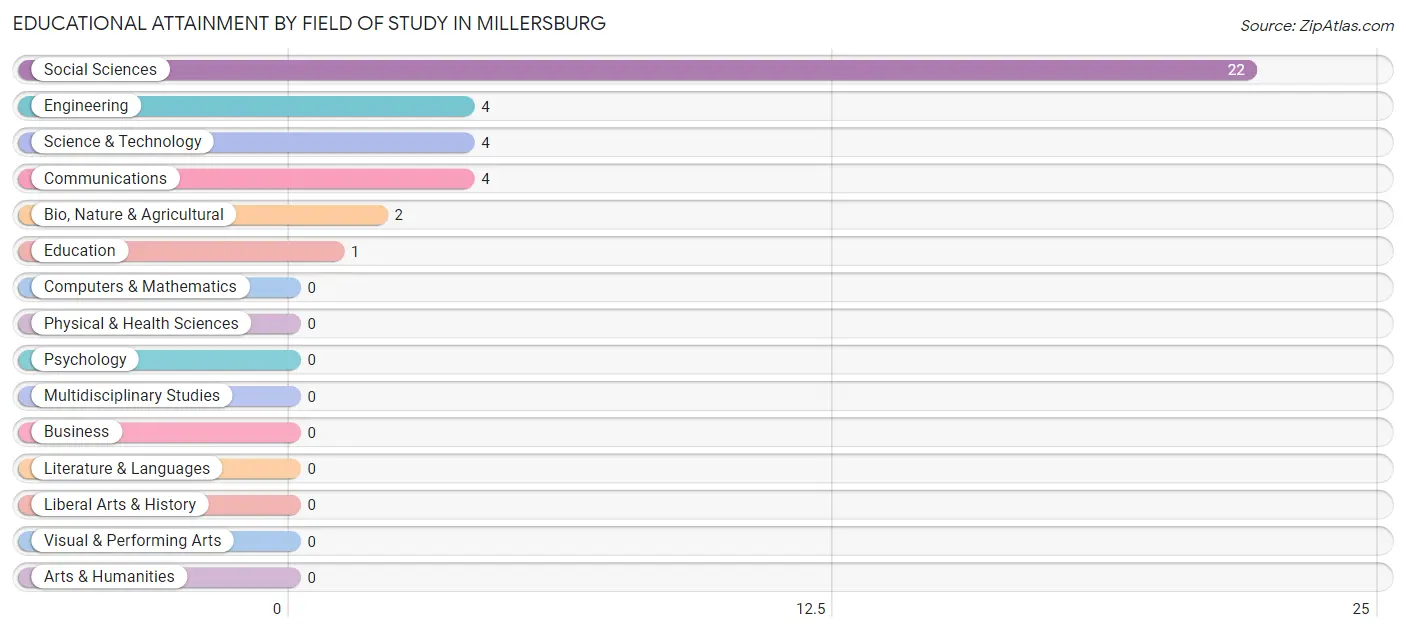
| Field of Study | # Graduates | % Graduates |
| Computers & Mathematics | 0 | 0.0% |
| Bio, Nature & Agricultural | 2 | 5.4% |
| Physical & Health Sciences | 0 | 0.0% |
| Psychology | 0 | 0.0% |
| Social Sciences | 22 | 59.5% |
| Engineering | 4 | 10.8% |
| Multidisciplinary Studies | 0 | 0.0% |
| Science & Technology | 4 | 10.8% |
| Business | 0 | 0.0% |
| Education | 1 | 2.7% |
| Literature & Languages | 0 | 0.0% |
| Liberal Arts & History | 0 | 0.0% |
| Visual & Performing Arts | 0 | 0.0% |
| Communications | 4 | 10.8% |
| Arts & Humanities | 0 | 0.0% |
| Total | 37 | 100.0% |
Transportation & Commute in Millersburg
Vehicle Availability by Sex in Millersburg
The most prevalent vehicle ownership categories in Millersburg are males with 3 vehicles (18, accounting for 56.2%) and females with 3 vehicles (17, making up 60.0%).
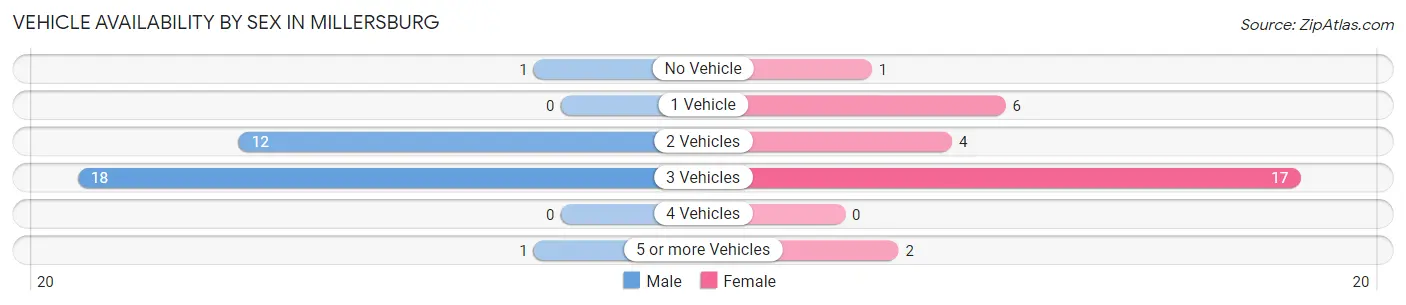
| Vehicles Available | Male | Female |
| No Vehicle | 1 (3.1%) | 1 (3.3%) |
| 1 Vehicle | 0 (0.0%) | 6 (20.0%) |
| 2 Vehicles | 12 (37.5%) | 4 (13.3%) |
| 3 Vehicles | 18 (56.2%) | 17 (56.7%) |
| 4 Vehicles | 0 (0.0%) | 0 (0.0%) |
| 5 or more Vehicles | 1 (3.1%) | 2 (6.7%) |
| Total | 32 (100.0%) | 30 (100.0%) |
Commute Time in Millersburg
The most frequently occuring commute durations in Millersburg are 30 to 34 minutes (22 commuters, 36.7%), 45 to 59 minutes (15 commuters, 25.0%), and 20 to 24 minutes (8 commuters, 13.3%).
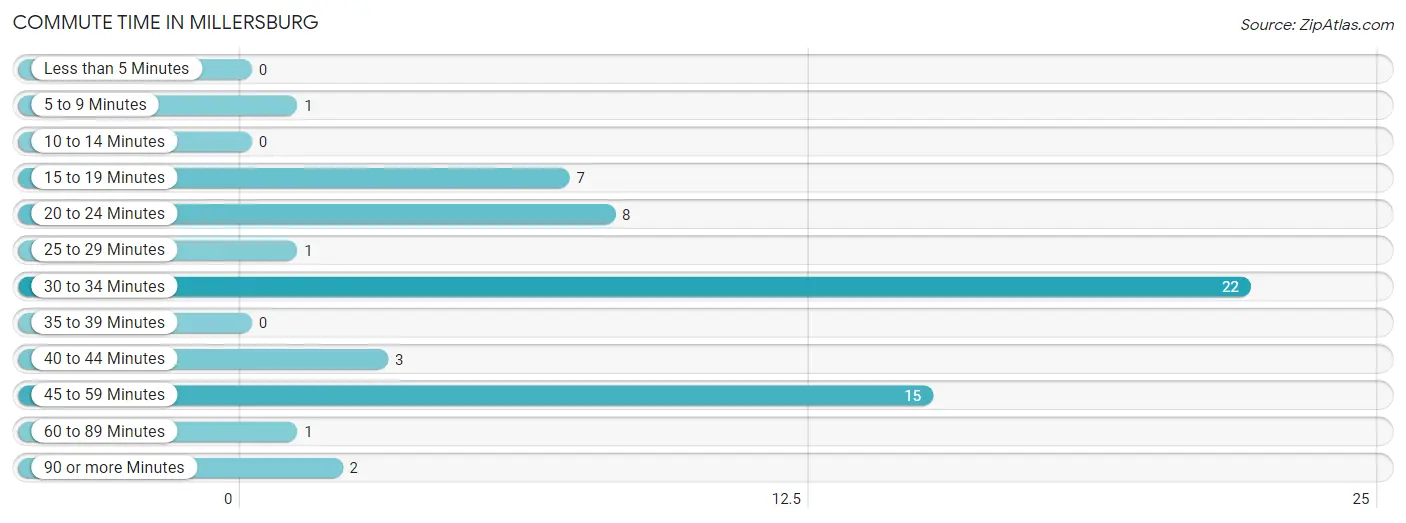
| Commute Time | # Commuters | % Commuters |
| Less than 5 Minutes | 0 | 0.0% |
| 5 to 9 Minutes | 1 | 1.7% |
| 10 to 14 Minutes | 0 | 0.0% |
| 15 to 19 Minutes | 7 | 11.7% |
| 20 to 24 Minutes | 8 | 13.3% |
| 25 to 29 Minutes | 1 | 1.7% |
| 30 to 34 Minutes | 22 | 36.7% |
| 35 to 39 Minutes | 0 | 0.0% |
| 40 to 44 Minutes | 3 | 5.0% |
| 45 to 59 Minutes | 15 | 25.0% |
| 60 to 89 Minutes | 1 | 1.7% |
| 90 or more Minutes | 2 | 3.3% |
Commute Time by Sex in Millersburg
The most common commute times in Millersburg are 30 to 34 minutes (12 commuters, 38.7%) for males and 30 to 34 minutes (10 commuters, 34.5%) for females.
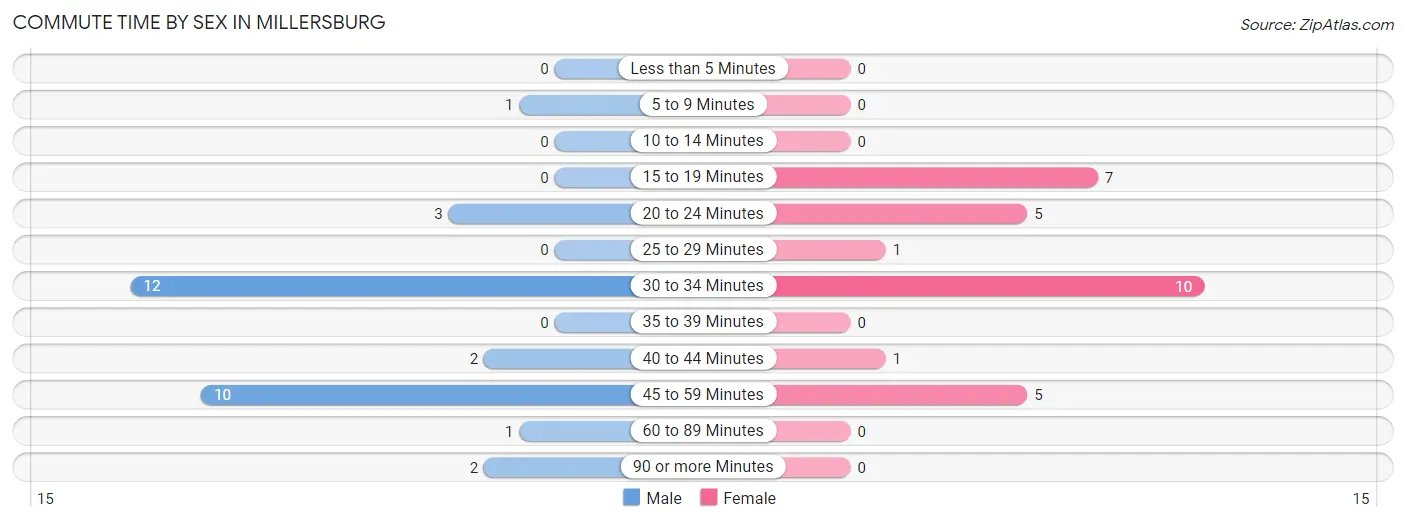
| Commute Time | Male | Female |
| Less than 5 Minutes | 0 (0.0%) | 0 (0.0%) |
| 5 to 9 Minutes | 1 (3.2%) | 0 (0.0%) |
| 10 to 14 Minutes | 0 (0.0%) | 0 (0.0%) |
| 15 to 19 Minutes | 0 (0.0%) | 7 (24.1%) |
| 20 to 24 Minutes | 3 (9.7%) | 5 (17.2%) |
| 25 to 29 Minutes | 0 (0.0%) | 1 (3.5%) |
| 30 to 34 Minutes | 12 (38.7%) | 10 (34.5%) |
| 35 to 39 Minutes | 0 (0.0%) | 0 (0.0%) |
| 40 to 44 Minutes | 2 (6.5%) | 1 (3.5%) |
| 45 to 59 Minutes | 10 (32.3%) | 5 (17.2%) |
| 60 to 89 Minutes | 1 (3.2%) | 0 (0.0%) |
| 90 or more Minutes | 2 (6.5%) | 0 (0.0%) |
Time of Departure to Work by Sex in Millersburg
The most frequent times of departure to work in Millersburg are 6:00 AM to 6:29 AM (20, 64.5%) for males and 6:00 AM to 6:29 AM (7, 24.1%) for females.
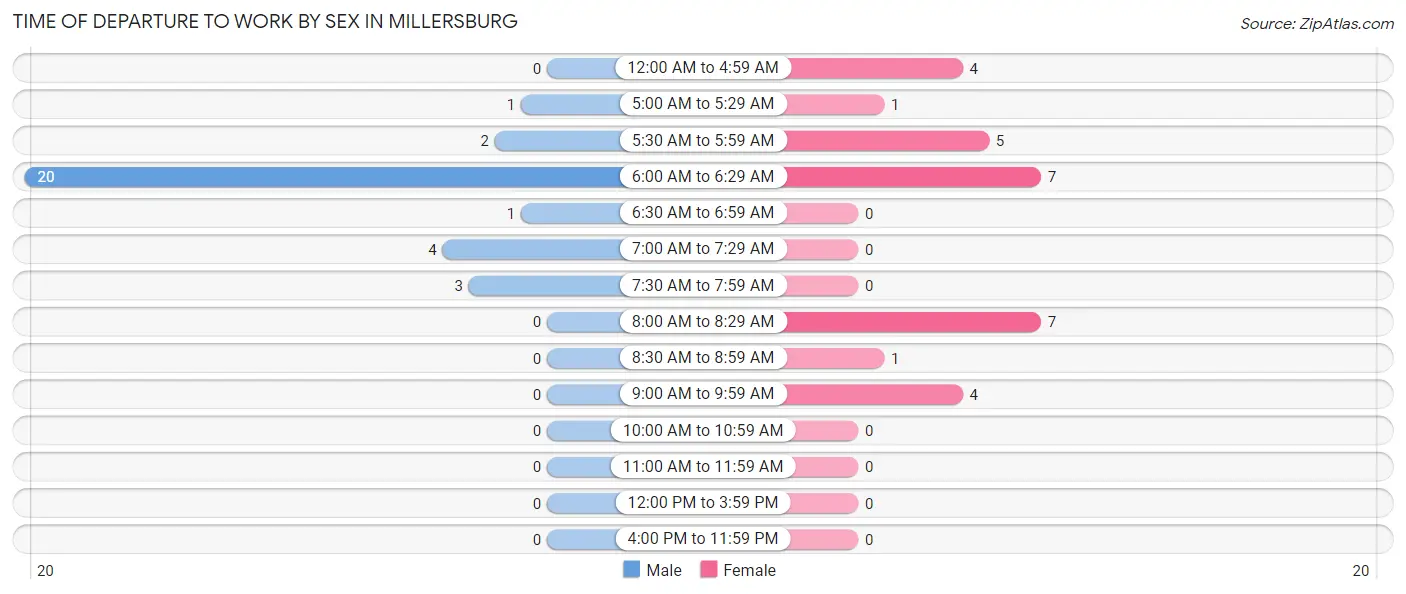
| Time of Departure | Male | Female |
| 12:00 AM to 4:59 AM | 0 (0.0%) | 4 (13.8%) |
| 5:00 AM to 5:29 AM | 1 (3.2%) | 1 (3.5%) |
| 5:30 AM to 5:59 AM | 2 (6.5%) | 5 (17.2%) |
| 6:00 AM to 6:29 AM | 20 (64.5%) | 7 (24.1%) |
| 6:30 AM to 6:59 AM | 1 (3.2%) | 0 (0.0%) |
| 7:00 AM to 7:29 AM | 4 (12.9%) | 0 (0.0%) |
| 7:30 AM to 7:59 AM | 3 (9.7%) | 0 (0.0%) |
| 8:00 AM to 8:29 AM | 0 (0.0%) | 7 (24.1%) |
| 8:30 AM to 8:59 AM | 0 (0.0%) | 1 (3.5%) |
| 9:00 AM to 9:59 AM | 0 (0.0%) | 4 (13.8%) |
| 10:00 AM to 10:59 AM | 0 (0.0%) | 0 (0.0%) |
| 11:00 AM to 11:59 AM | 0 (0.0%) | 0 (0.0%) |
| 12:00 PM to 3:59 PM | 0 (0.0%) | 0 (0.0%) |
| 4:00 PM to 11:59 PM | 0 (0.0%) | 0 (0.0%) |
| Total | 31 (100.0%) | 29 (100.0%) |
Housing Occupancy in Millersburg
Occupancy by Ownership in Millersburg
Of the total 87 dwellings in Millersburg, owner-occupied units account for 74 (85.1%), while renter-occupied units make up 13 (14.9%).
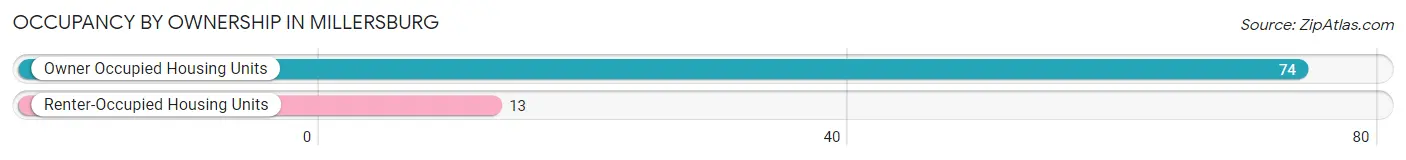
| Occupancy | # Housing Units | % Housing Units |
| Owner Occupied Housing Units | 74 | 85.1% |
| Renter-Occupied Housing Units | 13 | 14.9% |
| Total Occupied Housing Units | 87 | 100.0% |
Occupancy by Household Size in Millersburg
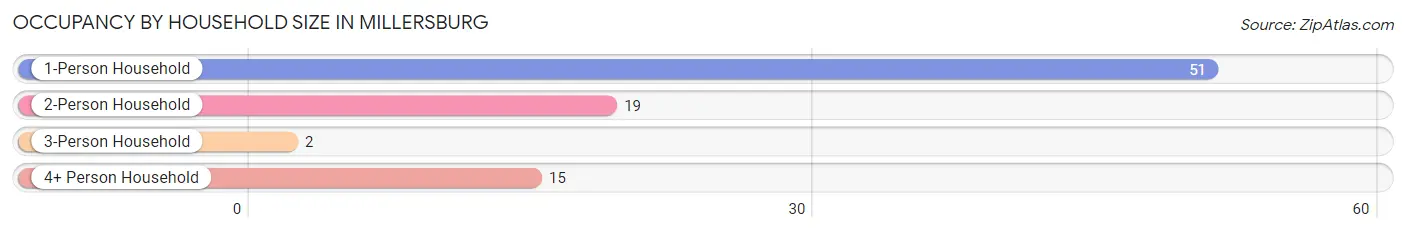
| Household Size | # Housing Units | % Housing Units |
| 1-Person Household | 51 | 58.6% |
| 2-Person Household | 19 | 21.8% |
| 3-Person Household | 2 | 2.3% |
| 4+ Person Household | 15 | 17.2% |
| Total Housing Units | 87 | 100.0% |
Occupancy by Ownership by Household Size in Millersburg
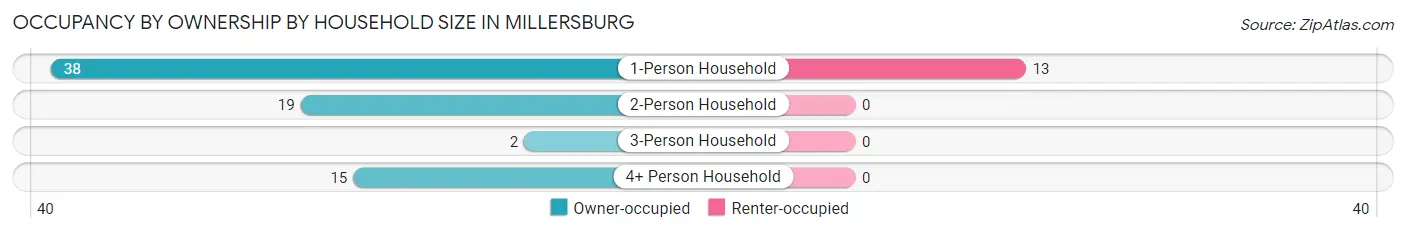
| Household Size | Owner-occupied | Renter-occupied |
| 1-Person Household | 38 (74.5%) | 13 (25.5%) |
| 2-Person Household | 19 (100.0%) | 0 (0.0%) |
| 3-Person Household | 2 (100.0%) | 0 (0.0%) |
| 4+ Person Household | 15 (100.0%) | 0 (0.0%) |
| Total Housing Units | 74 (85.1%) | 13 (14.9%) |
Occupancy by Educational Attainment in Millersburg
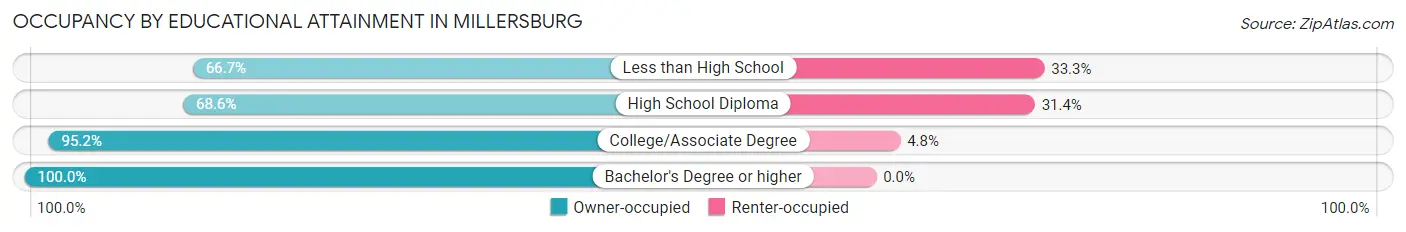
| Household Size | Owner-occupied | Renter-occupied |
| Less than High School | 2 (66.7%) | 1 (33.3%) |
| High School Diploma | 24 (68.6%) | 11 (31.4%) |
| College/Associate Degree | 20 (95.2%) | 1 (4.8%) |
| Bachelor's Degree or higher | 28 (100.0%) | 0 (0.0%) |
Occupancy by Age of Householder in Millersburg
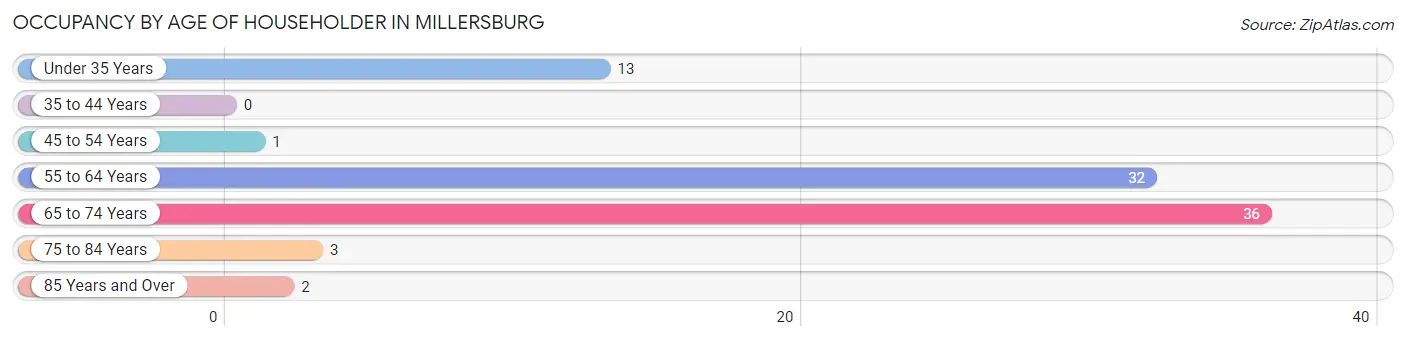
| Age Bracket | # Households | % Households |
| Under 35 Years | 13 | 14.9% |
| 35 to 44 Years | 0 | 0.0% |
| 45 to 54 Years | 1 | 1.1% |
| 55 to 64 Years | 32 | 36.8% |
| 65 to 74 Years | 36 | 41.4% |
| 75 to 84 Years | 3 | 3.5% |
| 85 Years and Over | 2 | 2.3% |
| Total | 87 | 100.0% |
Housing Finances in Millersburg
Median Income by Occupancy in Millersburg
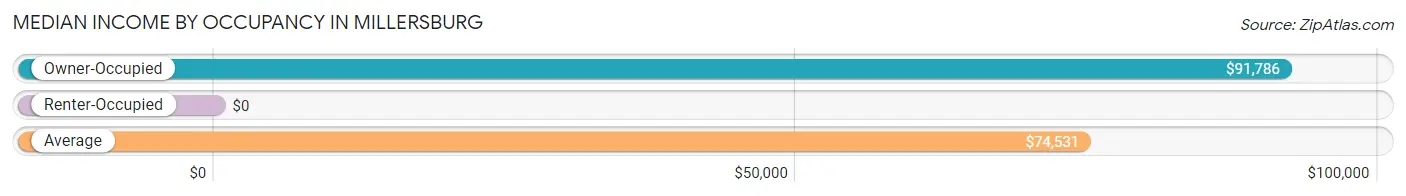
| Occupancy Type | # Households | Median Income |
| Owner-Occupied | 74 (85.1%) | $91,786 |
| Renter-Occupied | 13 (14.9%) | $0 |
| Average | 87 (100.0%) | $74,531 |
Occupancy by Householder Income Bracket in Millersburg
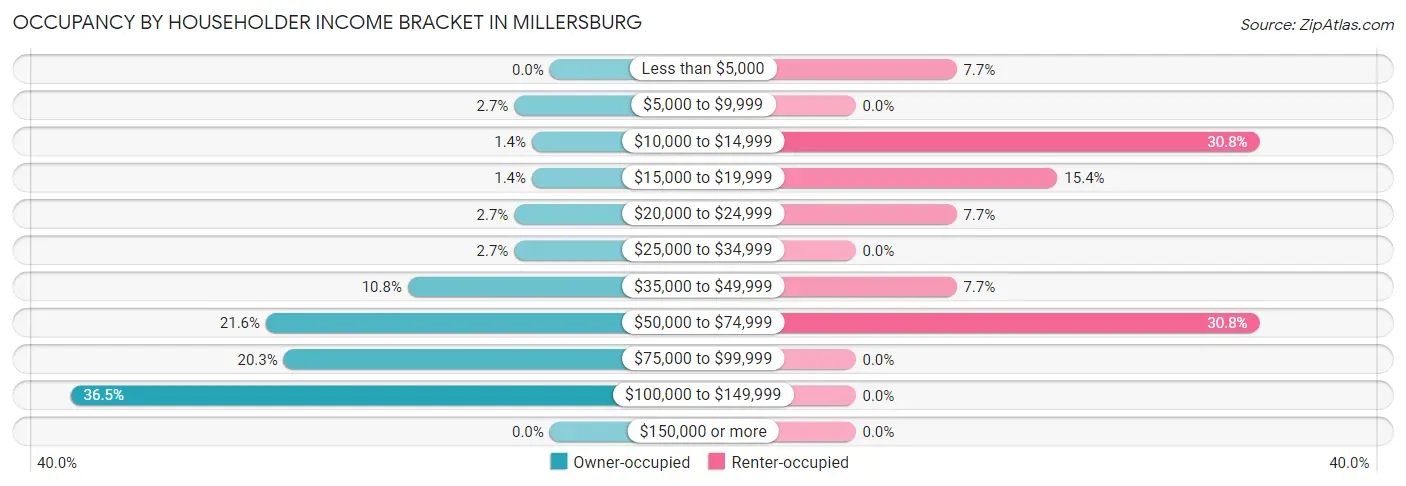
| Income Bracket | Owner-occupied | Renter-occupied |
| Less than $5,000 | 0 (0.0%) | 1 (7.7%) |
| $5,000 to $9,999 | 2 (2.7%) | 0 (0.0%) |
| $10,000 to $14,999 | 1 (1.3%) | 4 (30.8%) |
| $15,000 to $19,999 | 1 (1.3%) | 2 (15.4%) |
| $20,000 to $24,999 | 2 (2.7%) | 1 (7.7%) |
| $25,000 to $34,999 | 2 (2.7%) | 0 (0.0%) |
| $35,000 to $49,999 | 8 (10.8%) | 1 (7.7%) |
| $50,000 to $74,999 | 16 (21.6%) | 4 (30.8%) |
| $75,000 to $99,999 | 15 (20.3%) | 0 (0.0%) |
| $100,000 to $149,999 | 27 (36.5%) | 0 (0.0%) |
| $150,000 or more | 0 (0.0%) | 0 (0.0%) |
| Total | 74 (100.0%) | 13 (100.0%) |
Monthly Housing Cost Tiers in Millersburg
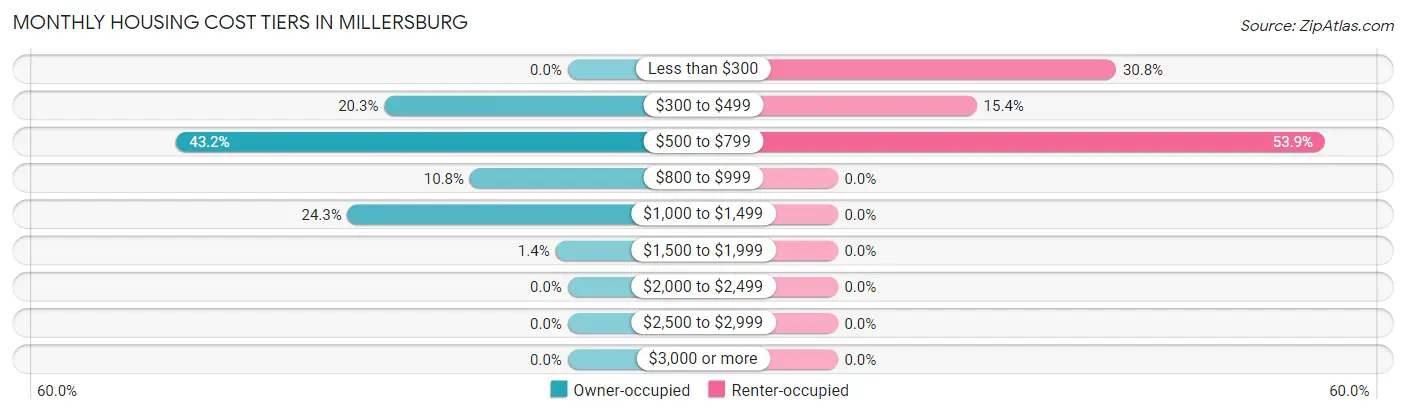
| Monthly Cost | Owner-occupied | Renter-occupied |
| Less than $300 | 0 (0.0%) | 4 (30.8%) |
| $300 to $499 | 15 (20.3%) | 2 (15.4%) |
| $500 to $799 | 32 (43.2%) | 7 (53.8%) |
| $800 to $999 | 8 (10.8%) | 0 (0.0%) |
| $1,000 to $1,499 | 18 (24.3%) | 0 (0.0%) |
| $1,500 to $1,999 | 1 (1.3%) | 0 (0.0%) |
| $2,000 to $2,499 | 0 (0.0%) | 0 (0.0%) |
| $2,500 to $2,999 | 0 (0.0%) | 0 (0.0%) |
| $3,000 or more | 0 (0.0%) | 0 (0.0%) |
| Total | 74 (100.0%) | 13 (100.0%) |
Physical Housing Characteristics in Millersburg
Housing Structures in Millersburg
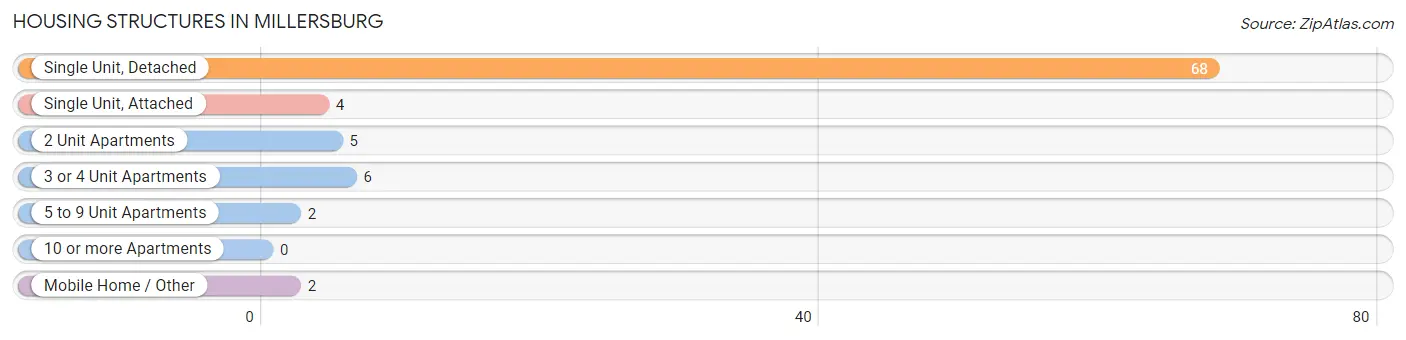
| Structure Type | # Housing Units | % Housing Units |
| Single Unit, Detached | 68 | 78.2% |
| Single Unit, Attached | 4 | 4.6% |
| 2 Unit Apartments | 5 | 5.8% |
| 3 or 4 Unit Apartments | 6 | 6.9% |
| 5 to 9 Unit Apartments | 2 | 2.3% |
| 10 or more Apartments | 0 | 0.0% |
| Mobile Home / Other | 2 | 2.3% |
| Total | 87 | 100.0% |
Housing Structures by Occupancy in Millersburg
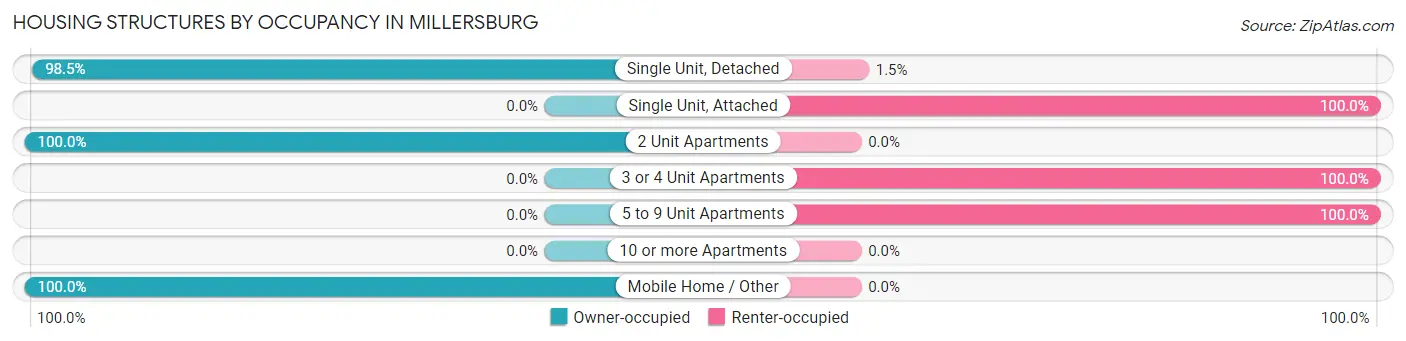
| Structure Type | Owner-occupied | Renter-occupied |
| Single Unit, Detached | 67 (98.5%) | 1 (1.5%) |
| Single Unit, Attached | 0 (0.0%) | 4 (100.0%) |
| 2 Unit Apartments | 5 (100.0%) | 0 (0.0%) |
| 3 or 4 Unit Apartments | 0 (0.0%) | 6 (100.0%) |
| 5 to 9 Unit Apartments | 0 (0.0%) | 2 (100.0%) |
| 10 or more Apartments | 0 (0.0%) | 0 (0.0%) |
| Mobile Home / Other | 2 (100.0%) | 0 (0.0%) |
| Total | 74 (85.1%) | 13 (14.9%) |
Housing Structures by Number of Rooms in Millersburg
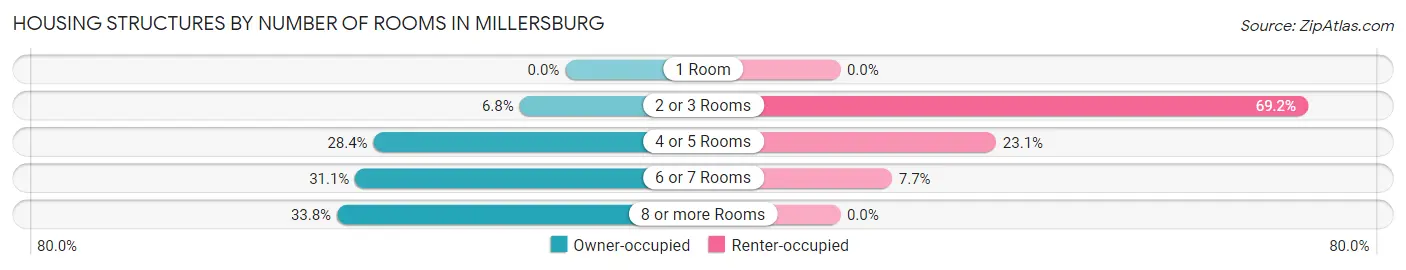
| Number of Rooms | Owner-occupied | Renter-occupied |
| 1 Room | 0 (0.0%) | 0 (0.0%) |
| 2 or 3 Rooms | 5 (6.8%) | 9 (69.2%) |
| 4 or 5 Rooms | 21 (28.4%) | 3 (23.1%) |
| 6 or 7 Rooms | 23 (31.1%) | 1 (7.7%) |
| 8 or more Rooms | 25 (33.8%) | 0 (0.0%) |
| Total | 74 (100.0%) | 13 (100.0%) |
Housing Structure by Heating Type in Millersburg
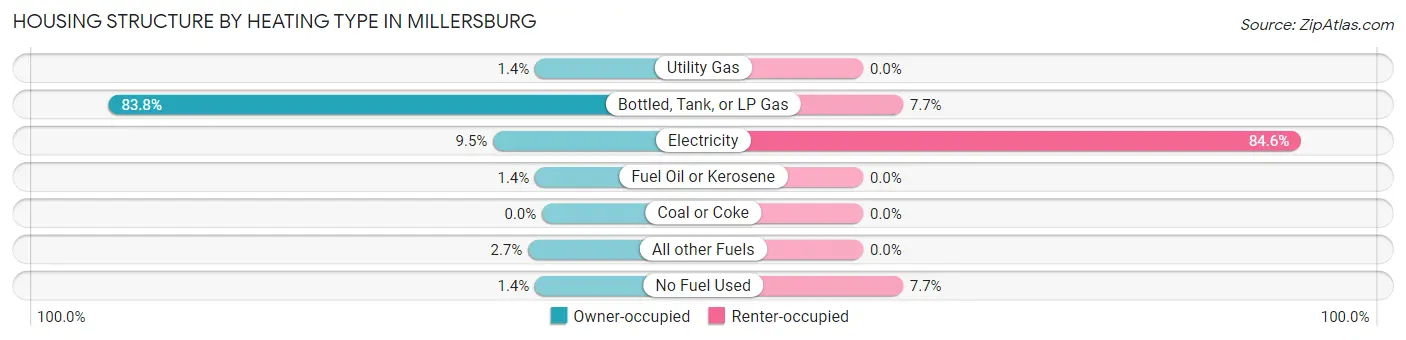
| Heating Type | Owner-occupied | Renter-occupied |
| Utility Gas | 1 (1.3%) | 0 (0.0%) |
| Bottled, Tank, or LP Gas | 62 (83.8%) | 1 (7.7%) |
| Electricity | 7 (9.5%) | 11 (84.6%) |
| Fuel Oil or Kerosene | 1 (1.3%) | 0 (0.0%) |
| Coal or Coke | 0 (0.0%) | 0 (0.0%) |
| All other Fuels | 2 (2.7%) | 0 (0.0%) |
| No Fuel Used | 1 (1.3%) | 1 (7.7%) |
| Total | 74 (100.0%) | 13 (100.0%) |
Household Vehicle Usage in Millersburg
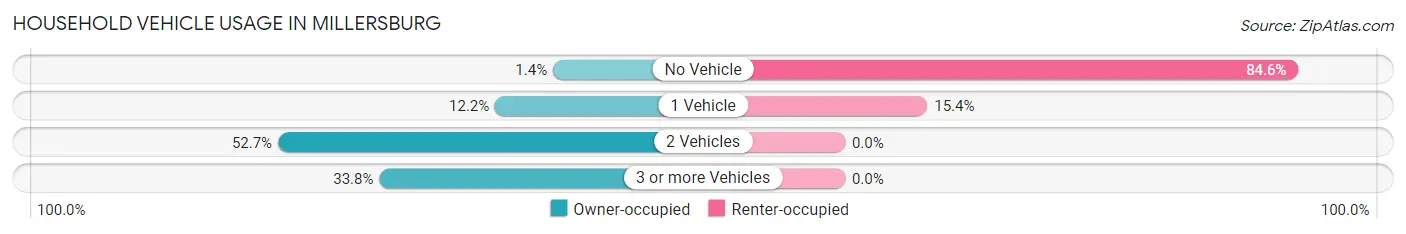
| Vehicles per Household | Owner-occupied | Renter-occupied |
| No Vehicle | 1 (1.3%) | 11 (84.6%) |
| 1 Vehicle | 9 (12.2%) | 2 (15.4%) |
| 2 Vehicles | 39 (52.7%) | 0 (0.0%) |
| 3 or more Vehicles | 25 (33.8%) | 0 (0.0%) |
| Total | 74 (100.0%) | 13 (100.0%) |
Real Estate & Mortgages in Millersburg
Real Estate and Mortgage Overview in Millersburg
| Characteristic | Without Mortgage | With Mortgage |
| Housing Units | 53 | 21 |
| Median Property Value | $100,500 | $97,900 |
| Median Household Income | $102,917 | $0 |
| Monthly Housing Costs | $646 | $0 |
| Real Estate Taxes | $1,644 | $1 |
Property Value by Mortgage Status in Millersburg
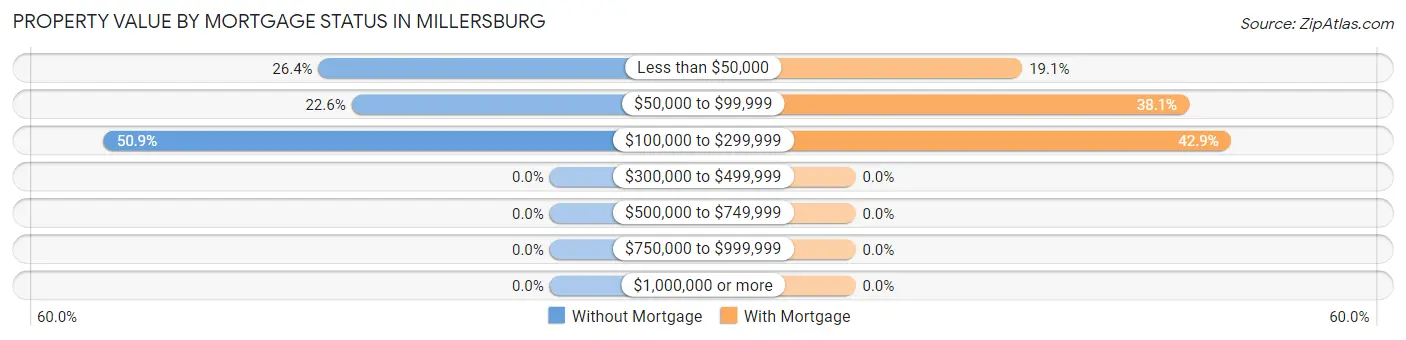
| Property Value | Without Mortgage | With Mortgage |
| Less than $50,000 | 14 (26.4%) | 4 (19.1%) |
| $50,000 to $99,999 | 12 (22.6%) | 8 (38.1%) |
| $100,000 to $299,999 | 27 (50.9%) | 9 (42.9%) |
| $300,000 to $499,999 | 0 (0.0%) | 0 (0.0%) |
| $500,000 to $749,999 | 0 (0.0%) | 0 (0.0%) |
| $750,000 to $999,999 | 0 (0.0%) | 0 (0.0%) |
| $1,000,000 or more | 0 (0.0%) | 0 (0.0%) |
| Total | 53 (100.0%) | 21 (100.0%) |
Household Income by Mortgage Status in Millersburg
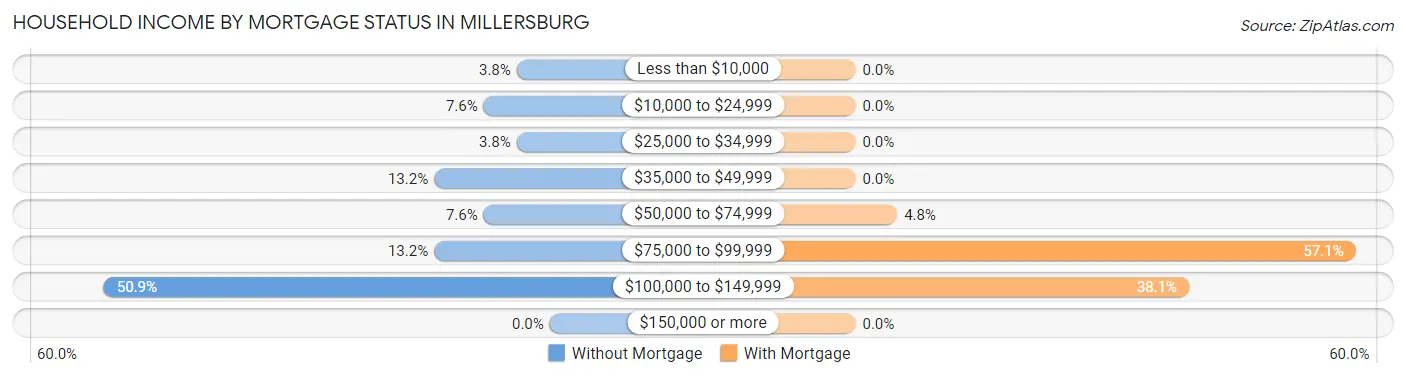
| Household Income | Without Mortgage | With Mortgage |
| Less than $10,000 | 2 (3.8%) | 0 (0.0%) |
| $10,000 to $24,999 | 4 (7.5%) | 0 (0.0%) |
| $25,000 to $34,999 | 2 (3.8%) | 0 (0.0%) |
| $35,000 to $49,999 | 7 (13.2%) | 0 (0.0%) |
| $50,000 to $74,999 | 4 (7.5%) | 1 (4.8%) |
| $75,000 to $99,999 | 7 (13.2%) | 12 (57.1%) |
| $100,000 to $149,999 | 27 (50.9%) | 8 (38.1%) |
| $150,000 or more | 0 (0.0%) | 0 (0.0%) |
| Total | 53 (100.0%) | 21 (100.0%) |
Property Value to Household Income Ratio in Millersburg
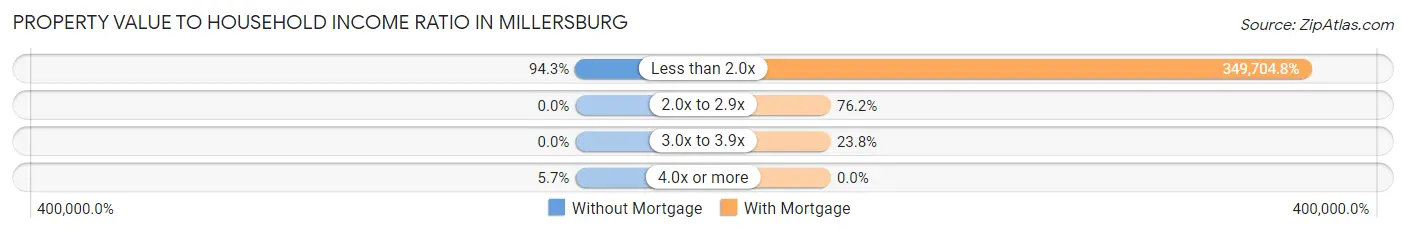
| Value-to-Income Ratio | Without Mortgage | With Mortgage |
| Less than 2.0x | 50 (94.3%) | 73,438 (349,704.8%) |
| 2.0x to 2.9x | 0 (0.0%) | 16 (76.2%) |
| 3.0x to 3.9x | 0 (0.0%) | 5 (23.8%) |
| 4.0x or more | 3 (5.7%) | 0 (0.0%) |
| Total | 53 (100.0%) | 21 (100.0%) |
Real Estate Taxes by Mortgage Status in Millersburg
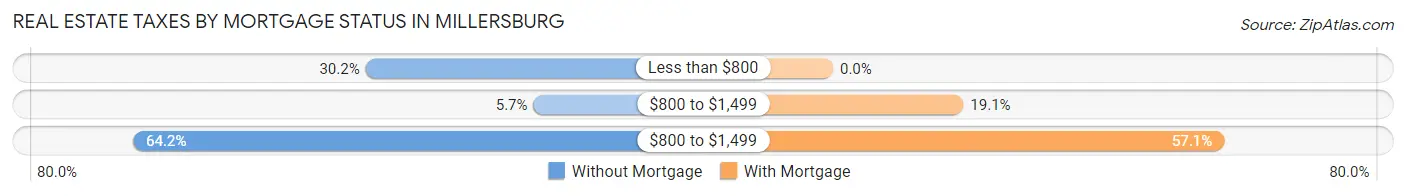
| Property Taxes | Without Mortgage | With Mortgage |
| Less than $800 | 16 (30.2%) | 0 (0.0%) |
| $800 to $1,499 | 3 (5.7%) | 4 (19.1%) |
| $800 to $1,499 | 34 (64.1%) | 12 (57.1%) |
| Total | 53 (100.0%) | 21 (100.0%) |
Health & Disability in Millersburg
Health Insurance Coverage by Age in Millersburg
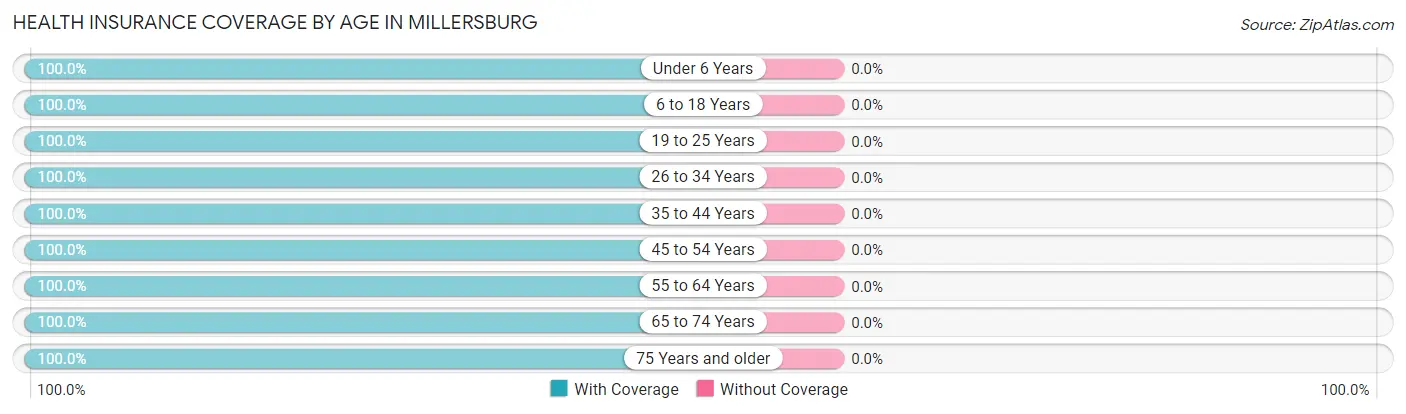
| Age Bracket | With Coverage | Without Coverage |
| Under 6 Years | 15 (100.0%) | 0 (0.0%) |
| 6 to 18 Years | 13 (100.0%) | 0 (0.0%) |
| 19 to 25 Years | 6 (100.0%) | 0 (0.0%) |
| 26 to 34 Years | 25 (100.0%) | 0 (0.0%) |
| 35 to 44 Years | 1 (100.0%) | 0 (0.0%) |
| 45 to 54 Years | 1 (100.0%) | 0 (0.0%) |
| 55 to 64 Years | 45 (100.0%) | 0 (0.0%) |
| 65 to 74 Years | 43 (100.0%) | 0 (0.0%) |
| 75 Years and older | 6 (100.0%) | 0 (0.0%) |
| Total | 155 (100.0%) | 0 (0.0%) |
Health Insurance Coverage by Citizenship Status in Millersburg
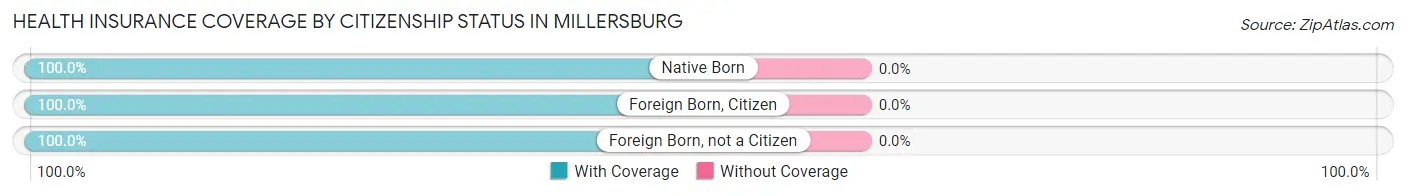
| Citizenship Status | With Coverage | Without Coverage |
| Native Born | 15 (100.0%) | 0 (0.0%) |
| Foreign Born, Citizen | 13 (100.0%) | 0 (0.0%) |
| Foreign Born, not a Citizen | 6 (100.0%) | 0 (0.0%) |
Health Insurance Coverage by Household Income in Millersburg
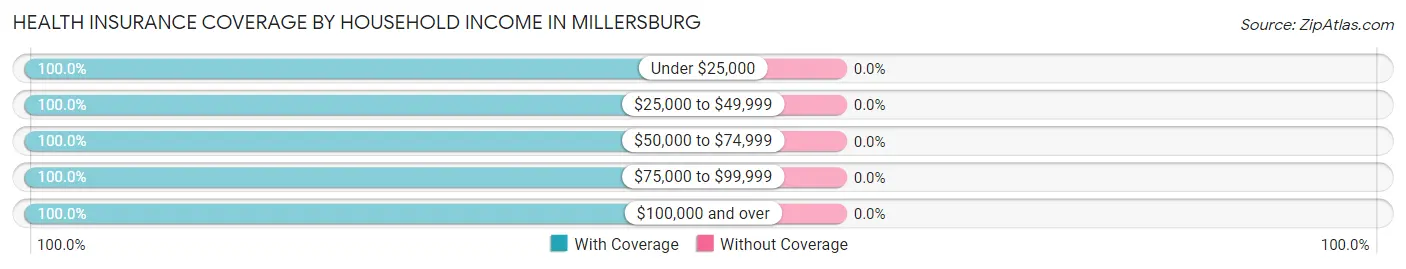
| Household Income | With Coverage | Without Coverage |
| Under $25,000 | 15 (100.0%) | 0 (0.0%) |
| $25,000 to $49,999 | 24 (100.0%) | 0 (0.0%) |
| $50,000 to $74,999 | 29 (100.0%) | 0 (0.0%) |
| $75,000 to $99,999 | 51 (100.0%) | 0 (0.0%) |
| $100,000 and over | 36 (100.0%) | 0 (0.0%) |
Public vs Private Health Insurance Coverage by Age in Millersburg
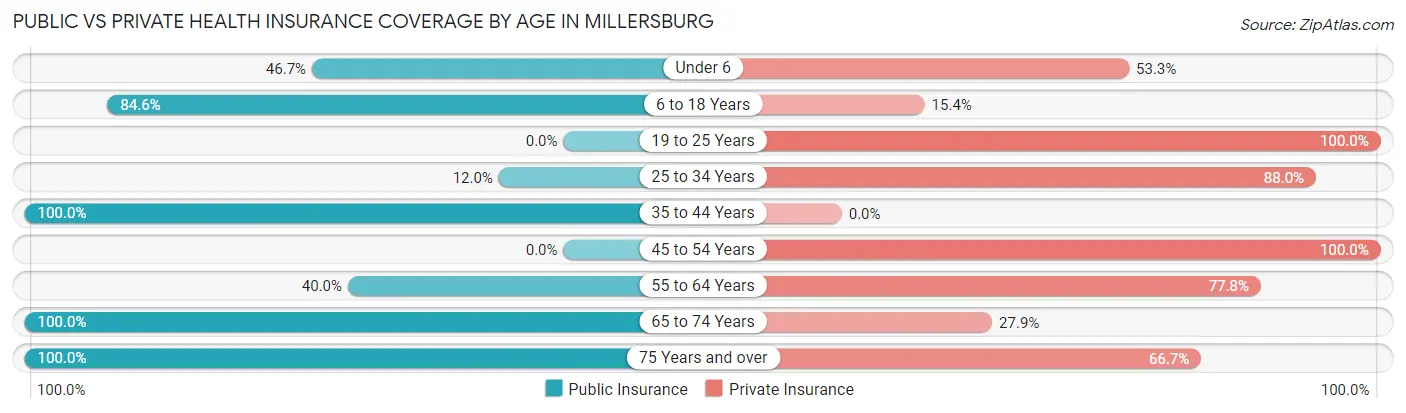
| Age Bracket | Public Insurance | Private Insurance |
| Under 6 | 7 (46.7%) | 8 (53.3%) |
| 6 to 18 Years | 11 (84.6%) | 2 (15.4%) |
| 19 to 25 Years | 0 (0.0%) | 6 (100.0%) |
| 25 to 34 Years | 3 (12.0%) | 22 (88.0%) |
| 35 to 44 Years | 1 (100.0%) | 0 (0.0%) |
| 45 to 54 Years | 0 (0.0%) | 1 (100.0%) |
| 55 to 64 Years | 18 (40.0%) | 35 (77.8%) |
| 65 to 74 Years | 43 (100.0%) | 12 (27.9%) |
| 75 Years and over | 6 (100.0%) | 4 (66.7%) |
| Total | 89 (57.4%) | 90 (58.1%) |
Disability Status by Sex by Age in Millersburg
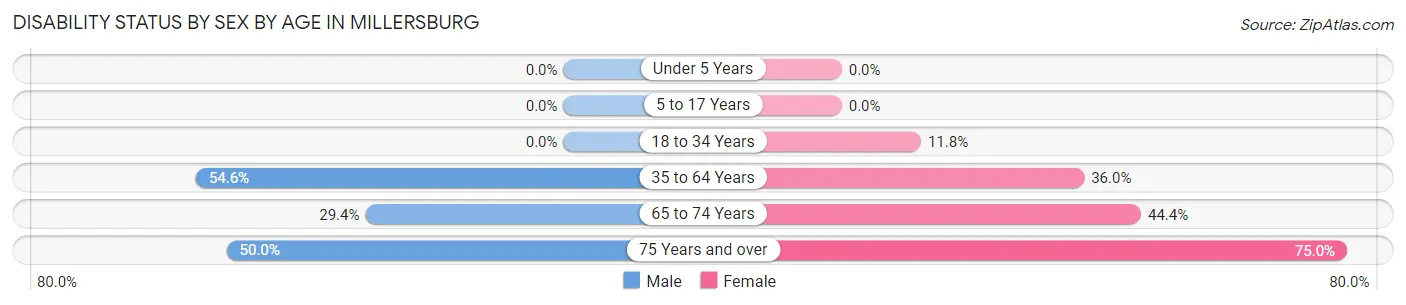
| Age Bracket | Male | Female |
| Under 5 Years | 0 (0.0%) | 0 (0.0%) |
| 5 to 17 Years | 0 (0.0%) | 0 (0.0%) |
| 18 to 34 Years | 0 (0.0%) | 2 (11.8%) |
| 35 to 64 Years | 12 (54.5%) | 9 (36.0%) |
| 65 to 74 Years | 10 (29.4%) | 4 (44.4%) |
| 75 Years and over | 1 (50.0%) | 3 (75.0%) |
Disability Class by Sex by Age in Millersburg
Disability Class: Hearing Difficulty
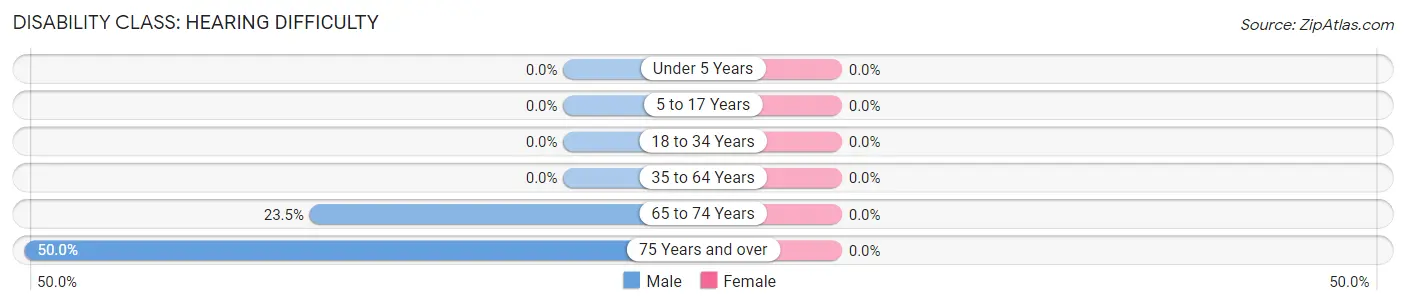
| Age Bracket | Male | Female |
| Under 5 Years | 0 (0.0%) | 0 (0.0%) |
| 5 to 17 Years | 0 (0.0%) | 0 (0.0%) |
| 18 to 34 Years | 0 (0.0%) | 0 (0.0%) |
| 35 to 64 Years | 0 (0.0%) | 0 (0.0%) |
| 65 to 74 Years | 8 (23.5%) | 0 (0.0%) |
| 75 Years and over | 1 (50.0%) | 0 (0.0%) |
Disability Class: Vision Difficulty
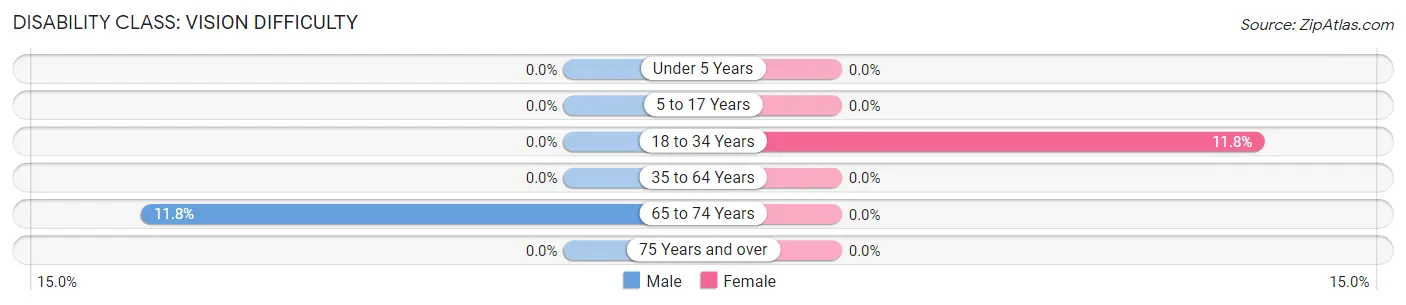
| Age Bracket | Male | Female |
| Under 5 Years | 0 (0.0%) | 0 (0.0%) |
| 5 to 17 Years | 0 (0.0%) | 0 (0.0%) |
| 18 to 34 Years | 0 (0.0%) | 2 (11.8%) |
| 35 to 64 Years | 0 (0.0%) | 0 (0.0%) |
| 65 to 74 Years | 4 (11.8%) | 0 (0.0%) |
| 75 Years and over | 0 (0.0%) | 0 (0.0%) |
Disability Class: Cognitive Difficulty
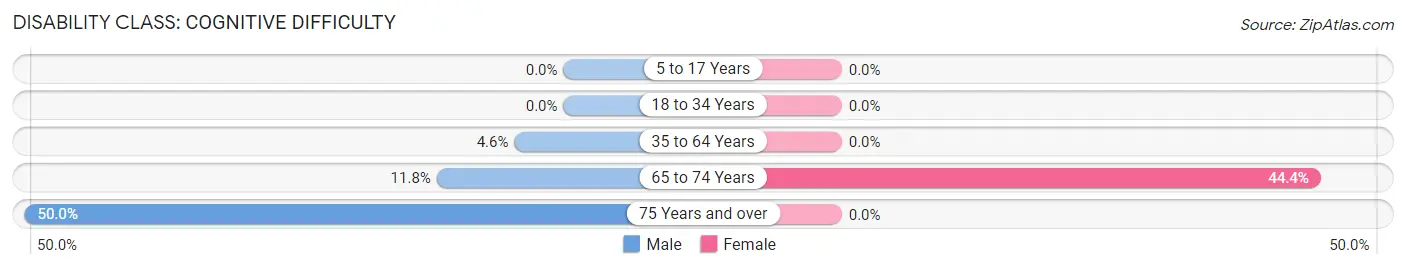
| Age Bracket | Male | Female |
| 5 to 17 Years | 0 (0.0%) | 0 (0.0%) |
| 18 to 34 Years | 0 (0.0%) | 0 (0.0%) |
| 35 to 64 Years | 1 (4.5%) | 0 (0.0%) |
| 65 to 74 Years | 4 (11.8%) | 4 (44.4%) |
| 75 Years and over | 1 (50.0%) | 0 (0.0%) |
Disability Class: Ambulatory Difficulty
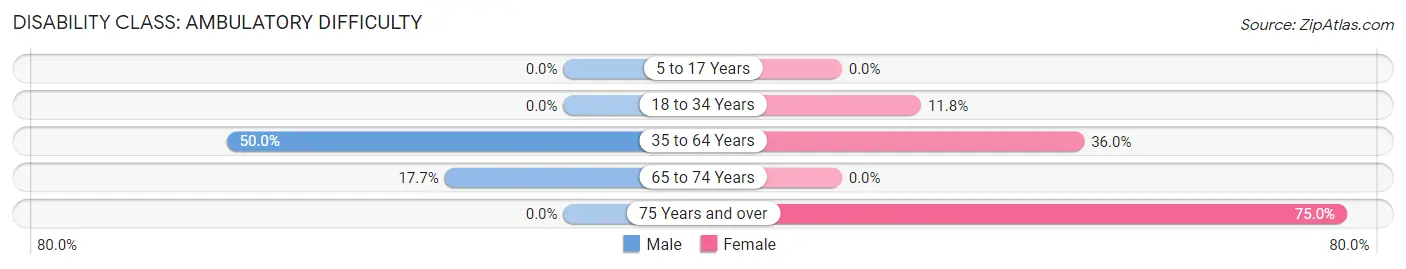
| Age Bracket | Male | Female |
| 5 to 17 Years | 0 (0.0%) | 0 (0.0%) |
| 18 to 34 Years | 0 (0.0%) | 2 (11.8%) |
| 35 to 64 Years | 11 (50.0%) | 9 (36.0%) |
| 65 to 74 Years | 6 (17.6%) | 0 (0.0%) |
| 75 Years and over | 0 (0.0%) | 3 (75.0%) |
Disability Class: Self-Care Difficulty
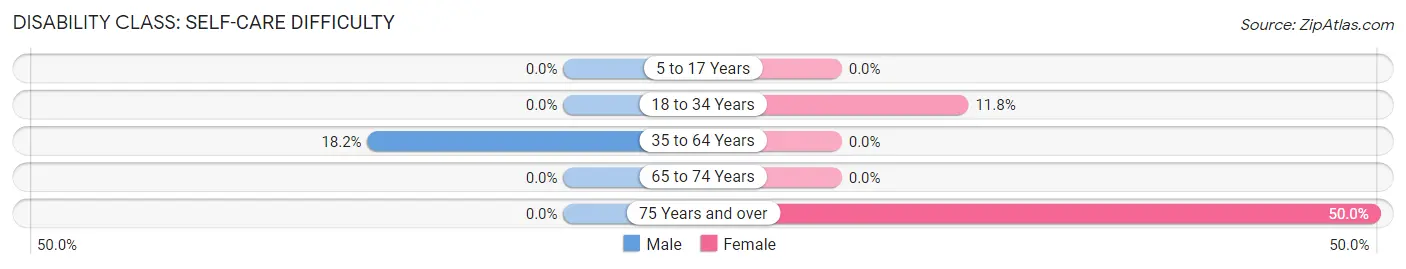
| Age Bracket | Male | Female |
| 5 to 17 Years | 0 (0.0%) | 0 (0.0%) |
| 18 to 34 Years | 0 (0.0%) | 2 (11.8%) |
| 35 to 64 Years | 4 (18.2%) | 0 (0.0%) |
| 65 to 74 Years | 0 (0.0%) | 0 (0.0%) |
| 75 Years and over | 0 (0.0%) | 2 (50.0%) |
Technology Access in Millersburg
Computing Device Access in Millersburg
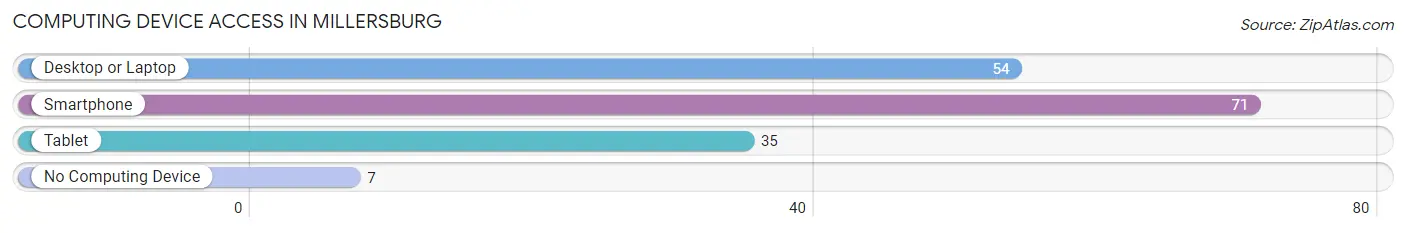
| Device Type | # Households | % Households |
| Desktop or Laptop | 54 | 62.1% |
| Smartphone | 71 | 81.6% |
| Tablet | 35 | 40.2% |
| No Computing Device | 7 | 8.1% |
| Total | 87 | 100.0% |
Internet Access in Millersburg
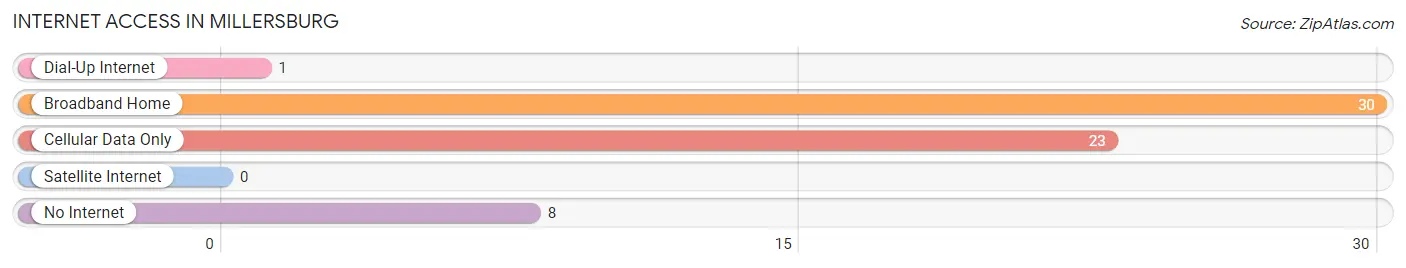
| Internet Type | # Households | % Households |
| Dial-Up Internet | 1 | 1.1% |
| Broadband Home | 30 | 34.5% |
| Cellular Data Only | 23 | 26.4% |
| Satellite Internet | 0 | 0.0% |
| No Internet | 8 | 9.2% |
| Total | 87 | 100.0% |
Millersburg Summary
Millerburg, Iowa is a small town located in the northeastern corner of Iowa, in the heart of the Midwest. It is situated in the rolling hills of the Upper Iowa River Valley, and is surrounded by lush farmland and wooded areas. Millerburg is a rural community with a population of just over 1,000 people, and is the county seat of Chickasaw County.
History
Millerburg was founded in 1856 by a group of settlers from Pennsylvania. The town was named after the Miller family, who were among the first settlers. The town was originally a farming community, and the first settlers built a sawmill and gristmill to process the lumber and grain they harvested from the surrounding land.
In the late 19th century, Millerburg began to grow and develop. The railroad arrived in 1881, and the town was incorporated in 1883. The railroad brought new businesses and industries to the area, and the town began to thrive.
In the early 20th century, Millerburg was a bustling small town. It had a variety of businesses, including a bank, a hotel, a newspaper, a movie theater, and several churches. The town also had a variety of recreational activities, including a baseball team, a golf course, and a swimming pool.
Geography
Millerburg is located in the Upper Iowa River Valley, in the northeastern corner of Iowa. The town is situated on the banks of the Upper Iowa River, and is surrounded by rolling hills and lush farmland. The town is located about 30 miles from the Mississippi River, and is about an hour and a half drive from the state capital of Des Moines.
The climate in Millerburg is typical of the Midwest, with hot summers and cold winters. The average temperature in the summer is around 75 degrees Fahrenheit, and the average temperature in the winter is around 25 degrees Fahrenheit. The town receives an average of 36 inches of precipitation each year.
Economy
Millerburg’s economy is largely based on agriculture. The town is surrounded by fertile farmland, and the majority of the population is employed in the agricultural industry. The town also has a variety of small businesses, including restaurants, retail stores, and service providers.
The town is also home to a number of manufacturing companies, including a furniture factory, a plastics factory, and a metal fabrication plant. The town also has a variety of service-based businesses, including a hospital, a nursing home, and a variety of professional services.
Demographics
As of the 2010 census, Millerburg had a population of 1,072 people. The population is predominantly white, with a small percentage of African Americans, Hispanics, and Asians. The median household income is $41,000, and the median age is 43.
Millerburg is a small, rural community with a strong sense of community and a rich history. The town is surrounded by beautiful countryside, and is a great place to live and work. The town is a great place to raise a family, and offers a variety of recreational activities and cultural attractions.
Common Questions
What is Per Capita Income in Millersburg?
Per Capita income in Millersburg is $45,978.
What is the Median Family Income in Millersburg?
Median Family Income in Millersburg is $90,893.
What is the Median Household income in Millersburg?
Median Household Income in Millersburg is $74,531.
What is Income or Wage Gap in Millersburg?
Income or Wage Gap in Millersburg is 13.5%.
Women in Millersburg earn 86.5 cents for every dollar earned by a man.
What is Inequality or Gini Index in Millersburg?
Inequality or Gini Index in Millersburg is 0.31.
What is the Total Population of Millersburg?
Total Population of Millersburg is 155.
What is the Total Male Population of Millersburg?
Total Male Population of Millersburg is 85.
What is the Total Female Population of Millersburg?
Total Female Population of Millersburg is 70.
What is the Ratio of Males per 100 Females in Millersburg?
There are 121.43 Males per 100 Females in Millersburg.
What is the Ratio of Females per 100 Males in Millersburg?
There are 82.35 Females per 100 Males in Millersburg.
What is the Median Population Age in Millersburg?
Median Population Age in Millersburg is 57.7 Years.
What is the Average Family Size in Millersburg
Average Family Size in Millersburg is 2.9 People.
What is the Average Household Size in Millersburg
Average Household Size in Millersburg is 1.8 People.
How Large is the Labor Force in Millersburg?
There are 68 People in the Labor Forcein in Millersburg.
What is the Percentage of People in the Labor Force in Millersburg?
51.5% of People are in the Labor Force in Millersburg.