Hartley, IA Map & Demographics
Hartley Map
Hartley Overview
$28,853
PER CAPITA INCOME
$67,386
AVG FAMILY INCOME
$48,088
AVG HOUSEHOLD INCOME
49.7%
WAGE / INCOME GAP [ % ]
50.3¢/ $1
WAGE / INCOME GAP [ $ ]
$8,185
FAMILY INCOME DEFICIT
0.42
INEQUALITY / GINI INDEX
1,536
TOTAL POPULATION
720
MALE POPULATION
816
FEMALE POPULATION
88.24
MALES / 100 FEMALES
113.33
FEMALES / 100 MALES
47.2
MEDIAN AGE
2.9
AVG FAMILY SIZE
2.1
AVG HOUSEHOLD SIZE
717
LABOR FORCE [ PEOPLE ]
55.5%
PERCENT IN LABOR FORCE
3.2%
UNEMPLOYMENT RATE
Hartley Zip Codes
Hartley Area Codes
Income in Hartley
Income Overview in Hartley
Per Capita Income in Hartley is $28,853, while median incomes of families and households are $67,386 and $48,088 respectively.
| Characteristic | Number | Measure |
| Per Capita Income | 1,536 | $28,853 |
| Median Family Income | 373 | $67,386 |
| Mean Family Income | 373 | $78,572 |
| Median Household Income | 682 | $48,088 |
| Mean Household Income | 682 | $60,095 |
| Income Deficit | 373 | $8,185 |
| Wage / Income Gap (%) | 1,536 | 49.67% |
| Wage / Income Gap ($) | 1,536 | 50.33¢ per $1 |
| Gini / Inequality Index | 1,536 | 0.42 |
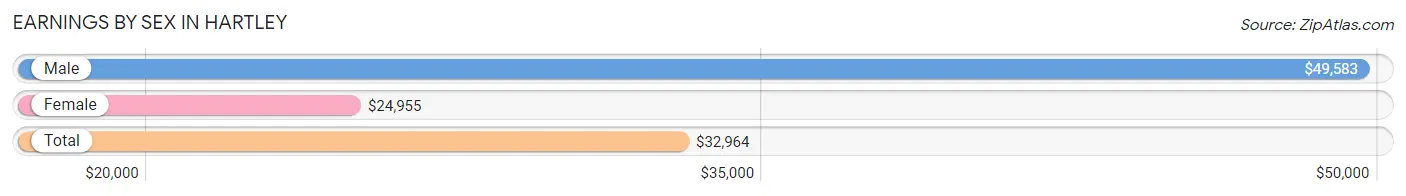
Earnings by Sex in Hartley
Average Earnings in Hartley are $32,964, $49,583 for men and $24,955 for women, a difference of 49.7%.
| Sex | Number | Average Earnings |
| Male | 368 (49.7%) | $49,583 |
| Female | 373 (50.3%) | $24,955 |
| Total | 741 (100.0%) | $32,964 |
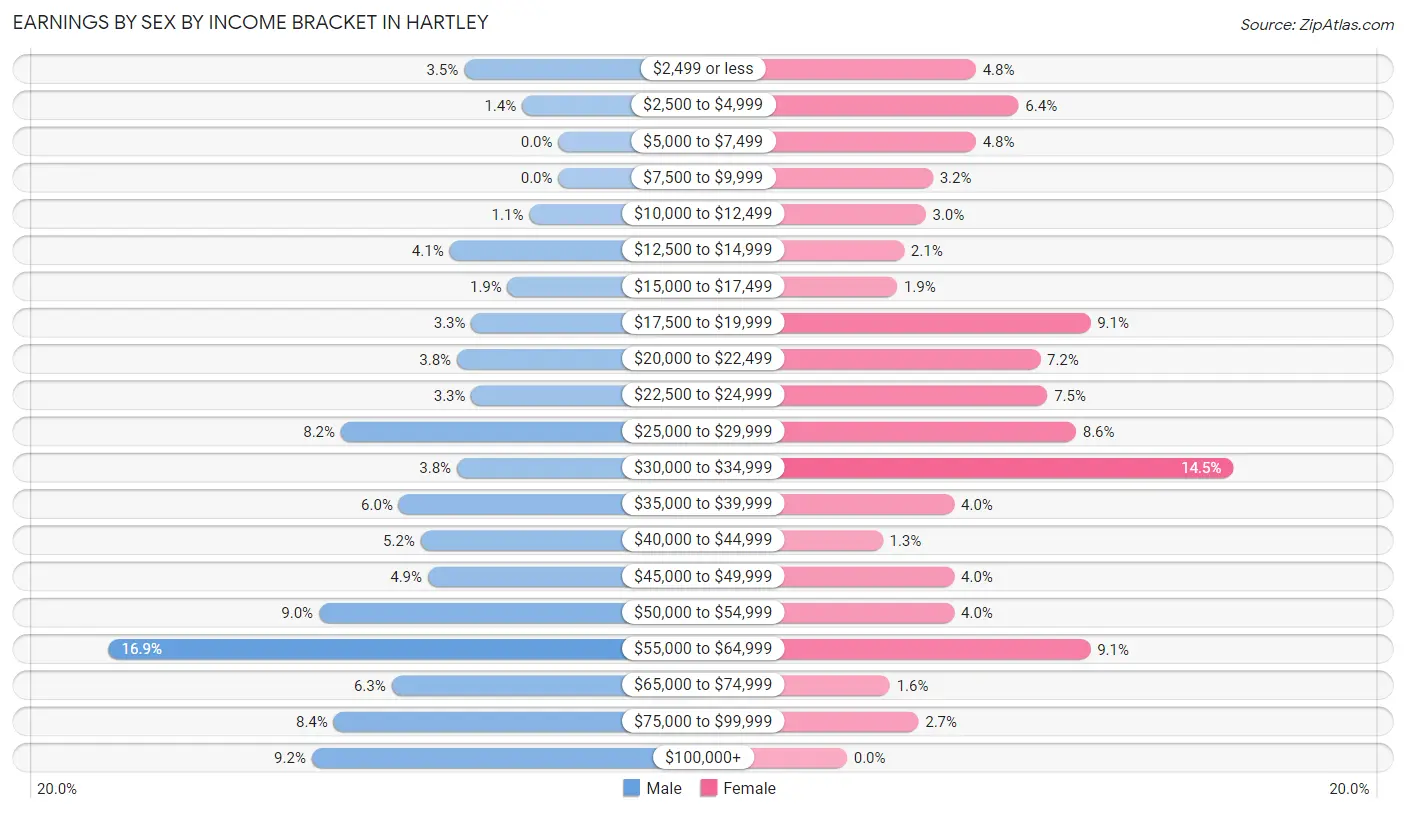
Earnings by Sex by Income Bracket in Hartley
The most common earnings brackets in Hartley are $55,000 to $64,999 for men (62 | 16.9%) and $30,000 to $34,999 for women (54 | 14.5%).
| Income | Male | Female |
| $2,499 or less | 13 (3.5%) | 18 (4.8%) |
| $2,500 to $4,999 | 5 (1.4%) | 24 (6.4%) |
| $5,000 to $7,499 | 0 (0.0%) | 18 (4.8%) |
| $7,500 to $9,999 | 0 (0.0%) | 12 (3.2%) |
| $10,000 to $12,499 | 4 (1.1%) | 11 (2.9%) |
| $12,500 to $14,999 | 15 (4.1%) | 8 (2.1%) |
| $15,000 to $17,499 | 7 (1.9%) | 7 (1.9%) |
| $17,500 to $19,999 | 12 (3.3%) | 34 (9.1%) |
| $20,000 to $22,499 | 14 (3.8%) | 27 (7.2%) |
| $22,500 to $24,999 | 12 (3.3%) | 28 (7.5%) |
| $25,000 to $29,999 | 30 (8.2%) | 32 (8.6%) |
| $30,000 to $34,999 | 14 (3.8%) | 54 (14.5%) |
| $35,000 to $39,999 | 22 (6.0%) | 15 (4.0%) |
| $40,000 to $44,999 | 19 (5.2%) | 5 (1.3%) |
| $45,000 to $49,999 | 18 (4.9%) | 15 (4.0%) |
| $50,000 to $54,999 | 33 (9.0%) | 15 (4.0%) |
| $55,000 to $64,999 | 62 (16.9%) | 34 (9.1%) |
| $65,000 to $74,999 | 23 (6.2%) | 6 (1.6%) |
| $75,000 to $99,999 | 31 (8.4%) | 10 (2.7%) |
| $100,000+ | 34 (9.2%) | 0 (0.0%) |
| Total | 368 (100.0%) | 373 (100.0%) |
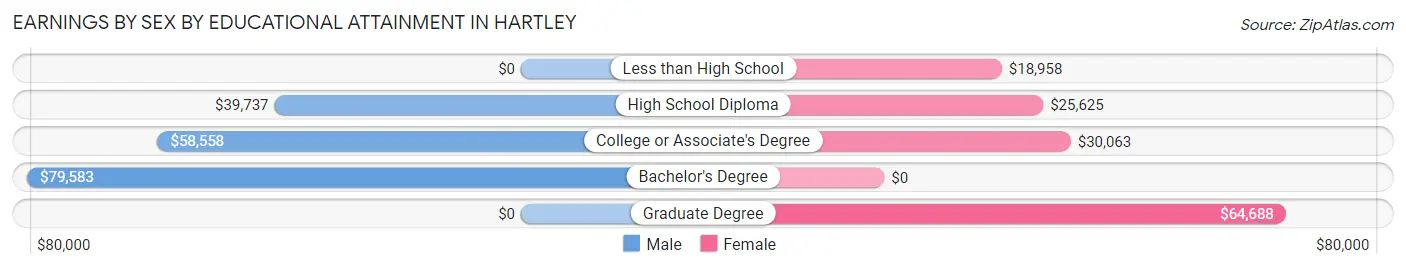
Earnings by Sex by Educational Attainment in Hartley
Average earnings in Hartley are $52,721 for men and $27,708 for women, a difference of 47.4%. Men with an educational attainment of bachelor's degree enjoy the highest average annual earnings of $79,583, while those with high school diploma education earn the least with $39,737. Women with an educational attainment of graduate degree earn the most with the average annual earnings of $64,688, while those with less than high school education have the smallest earnings of $18,958.
| Educational Attainment | Male Income | Female Income |
| Less than High School | - | - |
| High School Diploma | $39,737 | $25,625 |
| College or Associate's Degree | $58,558 | $30,063 |
| Bachelor's Degree | $79,583 | $0 |
| Graduate Degree | - | - |
| Total | $52,721 | $27,708 |
Family Income in Hartley
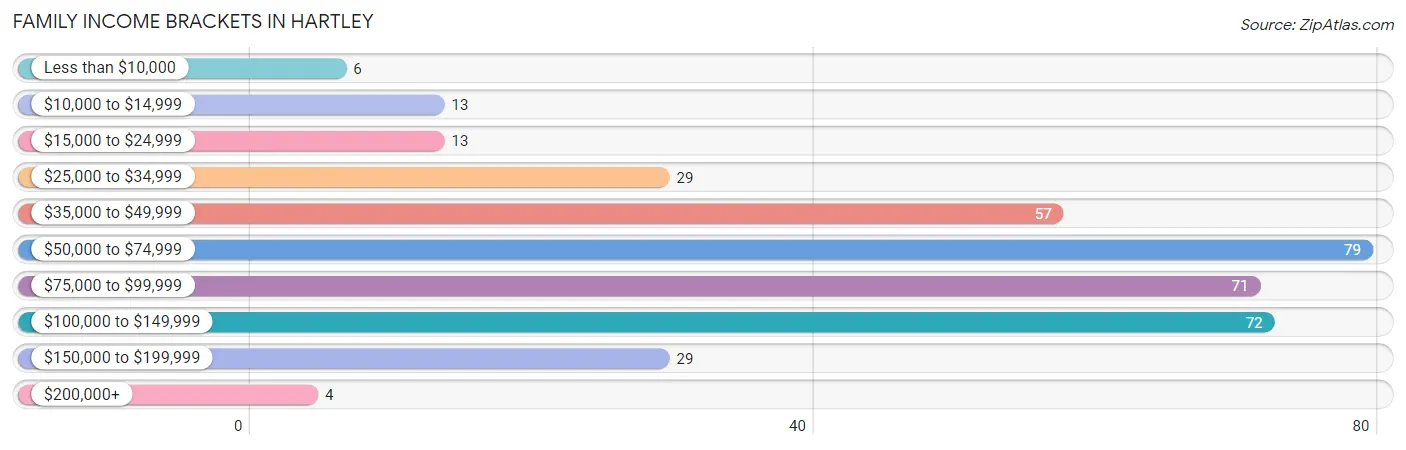
Family Income Brackets in Hartley
According to the Hartley family income data, there are 79 families falling into the $50,000 to $74,999 income range, which is the most common income bracket and makes up 21.2% of all families. Conversely, the $200,000+ income bracket is the least frequent group with only 4 families (1.1%) belonging to this category.
| Income Bracket | # Families | % Families |
| Less than $10,000 | 6 | 1.6% |
| $10,000 to $14,999 | 13 | 3.5% |
| $15,000 to $24,999 | 13 | 3.5% |
| $25,000 to $34,999 | 29 | 7.8% |
| $35,000 to $49,999 | 57 | 15.3% |
| $50,000 to $74,999 | 79 | 21.2% |
| $75,000 to $99,999 | 71 | 19.0% |
| $100,000 to $149,999 | 72 | 19.3% |
| $150,000 to $199,999 | 29 | 7.8% |
| $200,000+ | 4 | 1.1% |
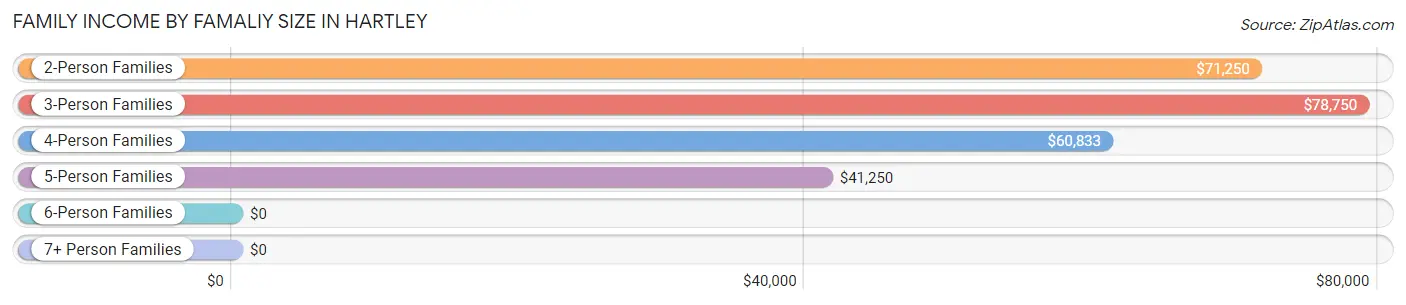
Family Income by Famaliy Size in Hartley
3-person families (78 | 20.9%) account for the highest median family income in Hartley with $78,750 per family, while 2-person families (244 | 65.4%) have the highest median income of $35,625 per family member.
| Income Bracket | # Families | Median Income |
| 2-Person Families | 244 (65.4%) | $71,250 |
| 3-Person Families | 78 (20.9%) | $78,750 |
| 4-Person Families | 34 (9.1%) | $60,833 |
| 5-Person Families | 16 (4.3%) | $41,250 |
| 6-Person Families | 0 (0.0%) | $0 |
| 7+ Person Families | 1 (0.3%) | $0 |
| Total | 373 (100.0%) | $67,386 |
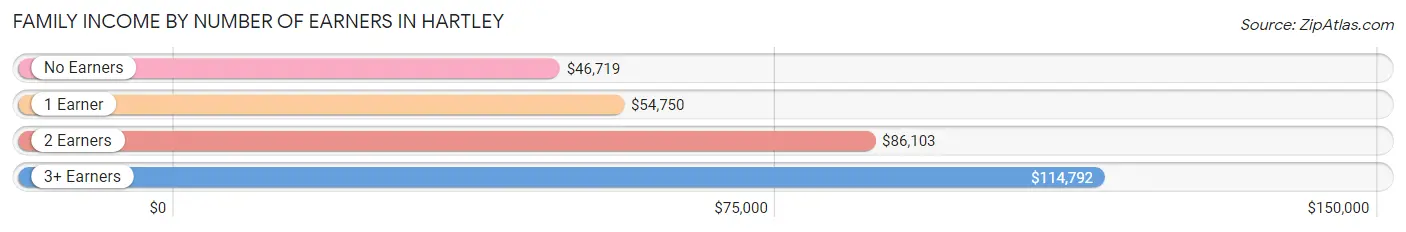
Family Income by Number of Earners in Hartley
The median family income in Hartley is $67,386, with families comprising 3+ earners (15) having the highest median family income of $114,792, while families with no earners (75) have the lowest median family income of $46,719, accounting for 4.0% and 20.1% of families, respectively.
| Number of Earners | # Families | Median Income |
| No Earners | 75 (20.1%) | $46,719 |
| 1 Earner | 106 (28.4%) | $54,750 |
| 2 Earners | 177 (47.4%) | $86,103 |
| 3+ Earners | 15 (4.0%) | $114,792 |
| Total | 373 (100.0%) | $67,386 |
Household Income in Hartley
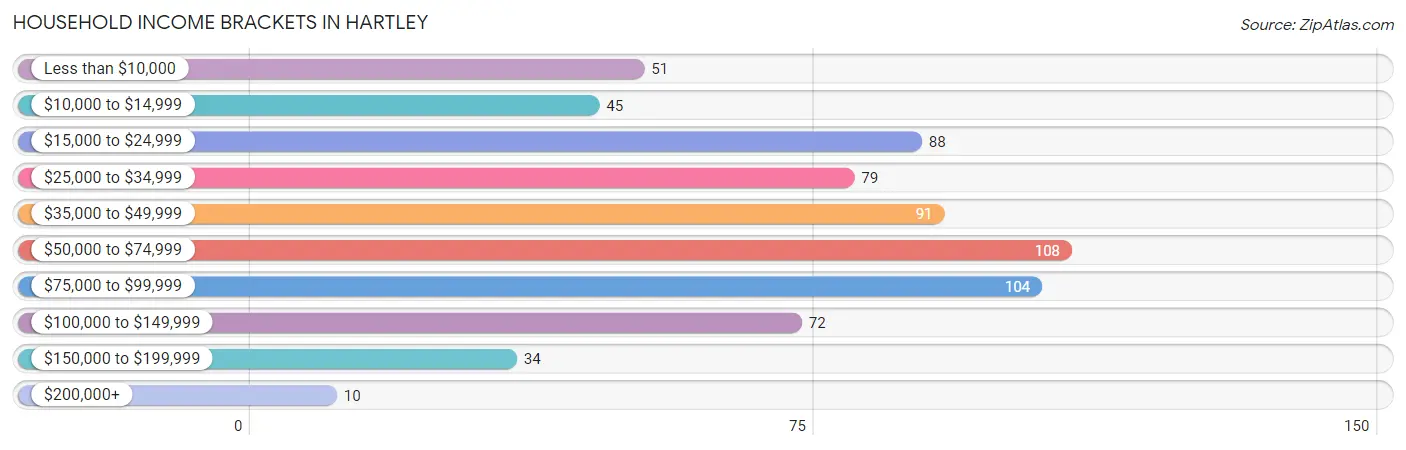
Household Income Brackets in Hartley
With 108 households falling in the category, the $50,000 to $74,999 income range is the most frequent in Hartley, accounting for 15.8% of all households. In contrast, only 10 households (1.5%) fall into the $200,000+ income bracket, making it the least populous group.
| Income Bracket | # Households | % Households |
| Less than $10,000 | 51 | 7.5% |
| $10,000 to $14,999 | 45 | 6.6% |
| $15,000 to $24,999 | 88 | 12.9% |
| $25,000 to $34,999 | 79 | 11.6% |
| $35,000 to $49,999 | 91 | 13.3% |
| $50,000 to $74,999 | 108 | 15.8% |
| $75,000 to $99,999 | 104 | 15.2% |
| $100,000 to $149,999 | 72 | 10.6% |
| $150,000 to $199,999 | 34 | 5.0% |
| $200,000+ | 10 | 1.5% |
Household Income by Householder Age in Hartley
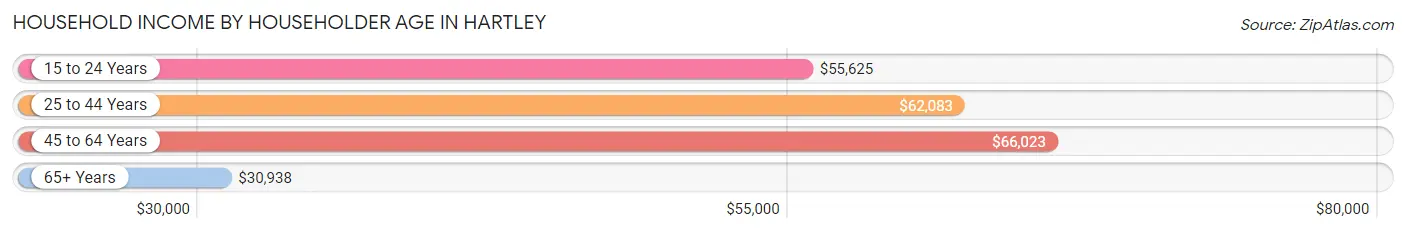
The median household income in Hartley is $48,088, with the highest median household income of $66,023 found in the 45 to 64 years age bracket for the primary householder. A total of 235 households (34.5%) fall into this category. Meanwhile, the 65+ years age bracket for the primary householder has the lowest median household income of $30,938, with 271 households (39.7%) in this group.
| Income Bracket | # Households | Median Income |
| 15 to 24 Years | 37 (5.4%) | $55,625 |
| 25 to 44 Years | 139 (20.4%) | $62,083 |
| 45 to 64 Years | 235 (34.5%) | $66,023 |
| 65+ Years | 271 (39.7%) | $30,938 |
| Total | 682 (100.0%) | $48,088 |
Poverty in Hartley
Income Below Poverty by Sex and Age in Hartley
With 11.5% poverty level for males and 16.6% for females among the residents of Hartley, 16 and 17 year old males and 15 year old females are the most vulnerable to poverty, with 3 males (100.0%) and 2 females (100.0%) in their respective age groups living below the poverty level.
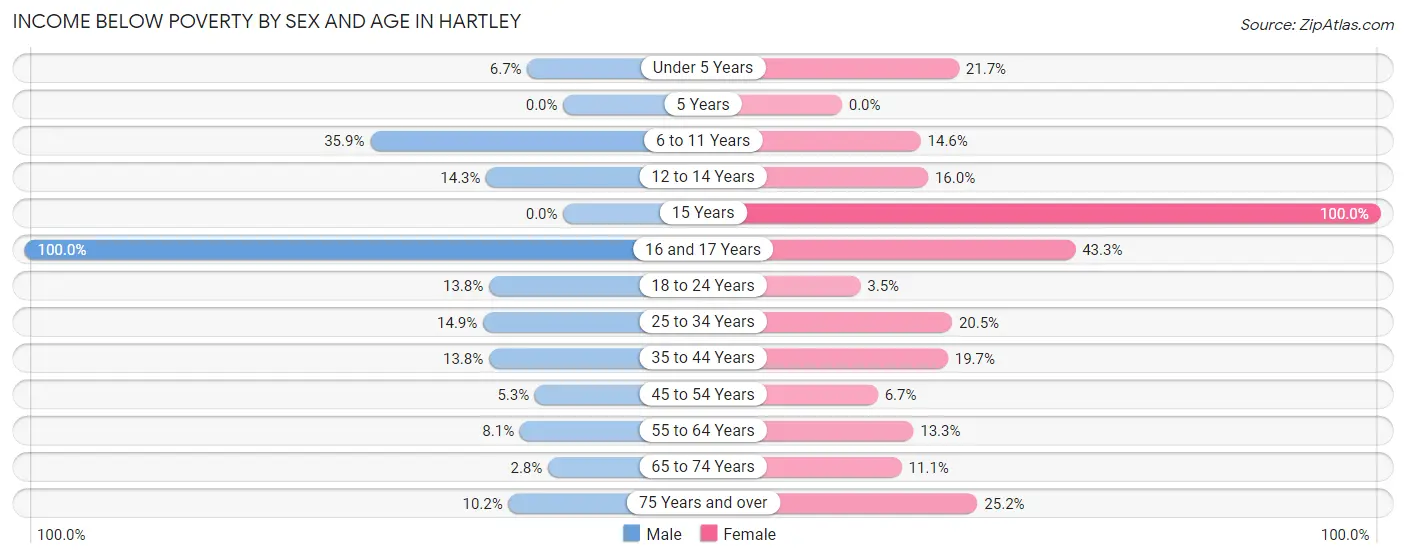
| Age Bracket | Male | Female |
| Under 5 Years | 3 (6.7%) | 5 (21.7%) |
| 5 Years | 0 (0.0%) | 0 (0.0%) |
| 6 to 11 Years | 19 (35.8%) | 6 (14.6%) |
| 12 to 14 Years | 2 (14.3%) | 4 (16.0%) |
| 15 Years | 0 (0.0%) | 2 (100.0%) |
| 16 and 17 Years | 3 (100.0%) | 13 (43.3%) |
| 18 to 24 Years | 12 (13.8%) | 2 (3.5%) |
| 25 to 34 Years | 14 (14.9%) | 18 (20.4%) |
| 35 to 44 Years | 8 (13.8%) | 12 (19.7%) |
| 45 to 54 Years | 4 (5.3%) | 7 (6.7%) |
| 55 to 64 Years | 7 (8.1%) | 13 (13.3%) |
| 65 to 74 Years | 3 (2.8%) | 7 (11.1%) |
| 75 Years and over | 6 (10.2%) | 37 (25.2%) |
| Total | 81 (11.5%) | 126 (16.6%) |
Income Above Poverty by Sex and Age in Hartley
According to the poverty statistics in Hartley, males aged 5 years and females aged 5 years are the age groups that are most secure financially, with 100.0% of males and 100.0% of females in these age groups living above the poverty line.
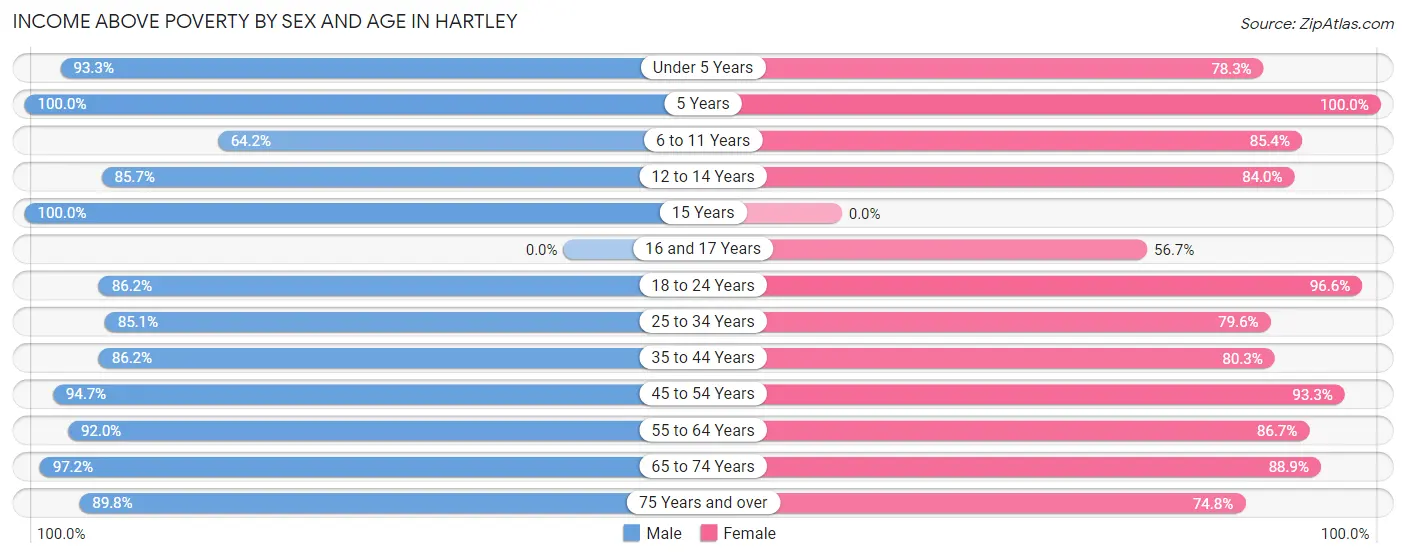
| Age Bracket | Male | Female |
| Under 5 Years | 42 (93.3%) | 18 (78.3%) |
| 5 Years | 15 (100.0%) | 18 (100.0%) |
| 6 to 11 Years | 34 (64.1%) | 35 (85.4%) |
| 12 to 14 Years | 12 (85.7%) | 21 (84.0%) |
| 15 Years | 8 (100.0%) | 0 (0.0%) |
| 16 and 17 Years | 0 (0.0%) | 17 (56.7%) |
| 18 to 24 Years | 75 (86.2%) | 56 (96.6%) |
| 25 to 34 Years | 80 (85.1%) | 70 (79.5%) |
| 35 to 44 Years | 50 (86.2%) | 49 (80.3%) |
| 45 to 54 Years | 72 (94.7%) | 98 (93.3%) |
| 55 to 64 Years | 80 (91.9%) | 85 (86.7%) |
| 65 to 74 Years | 103 (97.2%) | 56 (88.9%) |
| 75 Years and over | 53 (89.8%) | 110 (74.8%) |
| Total | 624 (88.5%) | 633 (83.4%) |
Income Below Poverty Among Married-Couple Families in Hartley
The poverty statistics for married-couple families in Hartley show that 6.9% or 20 of the total 288 families live below the poverty line. Families with 3 or 4 children have the highest poverty rate of 50.0%, comprising of 8 families. On the other hand, families with no children have the lowest poverty rate of 2.7%, which includes 6 families.
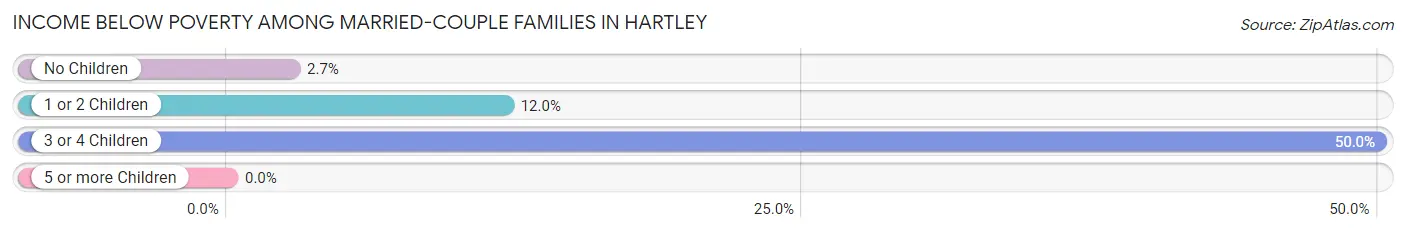
| Children | Above Poverty | Below Poverty |
| No Children | 216 (97.3%) | 6 (2.7%) |
| 1 or 2 Children | 44 (88.0%) | 6 (12.0%) |
| 3 or 4 Children | 8 (50.0%) | 8 (50.0%) |
| 5 or more Children | 0 (0.0%) | 0 (0.0%) |
| Total | 268 (93.1%) | 20 (6.9%) |
Income Below Poverty Among Single-Parent Households in Hartley
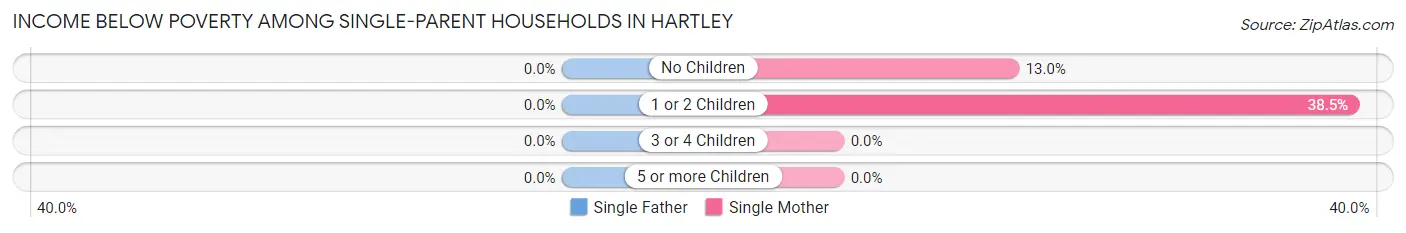
| Children | Single Father | Single Mother |
| No Children | 0 (0.0%) | 3 (13.0%) |
| 1 or 2 Children | 0 (0.0%) | 10 (38.5%) |
| 3 or 4 Children | 0 (0.0%) | 0 (0.0%) |
| 5 or more Children | 0 (0.0%) | 0 (0.0%) |
| Total | 0 (0.0%) | 13 (26.5%) |
Income Below Poverty Among Married-Couple vs Single-Parent Households in Hartley
The poverty data for Hartley shows that 20 of the married-couple family households (6.9%) and 13 of the single-parent households (15.3%) are living below the poverty level. Within the married-couple family households, those with 3 or 4 children have the highest poverty rate, with 8 households (50.0%) falling below the poverty line. Among the single-parent households, those with 1 or 2 children have the highest poverty rate, with 10 household (19.2%) living below poverty.
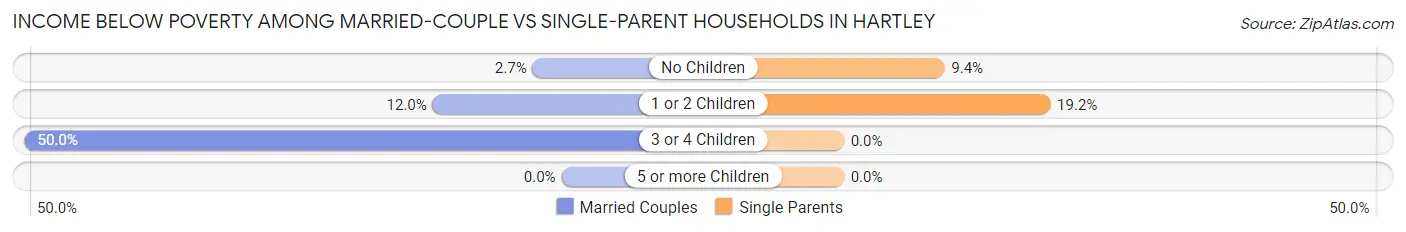
| Children | Married-Couple Families | Single-Parent Households |
| No Children | 6 (2.7%) | 3 (9.4%) |
| 1 or 2 Children | 6 (12.0%) | 10 (19.2%) |
| 3 or 4 Children | 8 (50.0%) | 0 (0.0%) |
| 5 or more Children | 0 (0.0%) | 0 (0.0%) |
| Total | 20 (6.9%) | 13 (15.3%) |
Race in Hartley
The most populous races in Hartley are White / Caucasian (1,447 | 94.2%), Hispanic or Latino (89 | 5.8%), and Some other Race (41 | 2.7%).
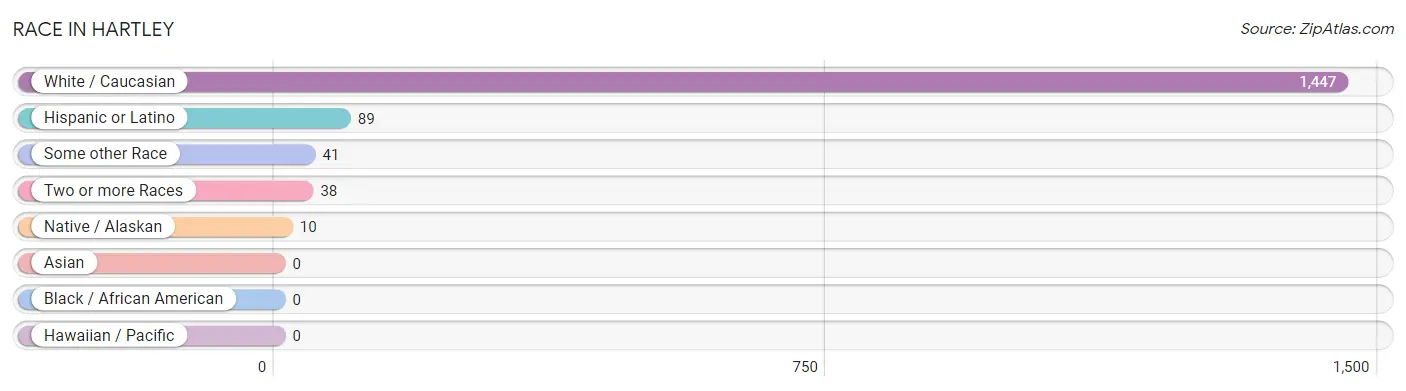
| Race | # Population | % Population |
| Asian | 0 | 0.0% |
| Black / African American | 0 | 0.0% |
| Hawaiian / Pacific | 0 | 0.0% |
| Hispanic or Latino | 89 | 5.8% |
| Native / Alaskan | 10 | 0.6% |
| White / Caucasian | 1,447 | 94.2% |
| Two or more Races | 38 | 2.5% |
| Some other Race | 41 | 2.7% |
| Total | 1,536 | 100.0% |
Ancestry in Hartley
The most populous ancestries reported in Hartley are German (564 | 36.7%), Dutch (175 | 11.4%), Irish (134 | 8.7%), English (118 | 7.7%), and Mexican (87 | 5.7%), together accounting for 70.2% of all Hartley residents.
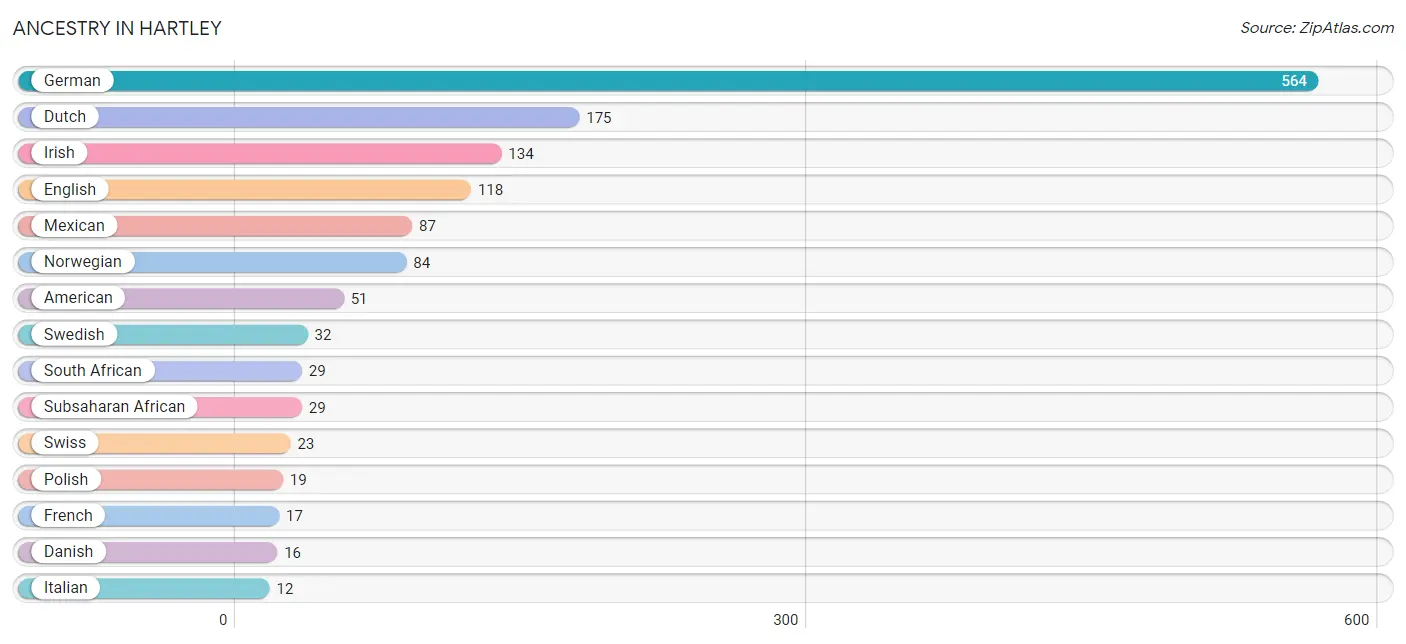
| Ancestry | # Population | % Population |
| American | 51 | 3.3% |
| Austrian | 3 | 0.2% |
| British | 5 | 0.3% |
| Central American Indian | 1 | 0.1% |
| Cheyenne | 3 | 0.2% |
| Czech | 4 | 0.3% |
| Danish | 16 | 1.0% |
| Dutch | 175 | 11.4% |
| English | 118 | 7.7% |
| European | 8 | 0.5% |
| French | 17 | 1.1% |
| German | 564 | 36.7% |
| Greek | 3 | 0.2% |
| Irish | 134 | 8.7% |
| Italian | 12 | 0.8% |
| Mexican | 87 | 5.7% |
| Mexican American Indian | 9 | 0.6% |
| Norwegian | 84 | 5.5% |
| Pennsylvania German | 5 | 0.3% |
| Polish | 19 | 1.2% |
| Russian | 8 | 0.5% |
| Scandinavian | 10 | 0.6% |
| Scotch-Irish | 3 | 0.2% |
| Scottish | 4 | 0.3% |
| South African | 29 | 1.9% |
| Spaniard | 2 | 0.1% |
| Sri Lankan | 6 | 0.4% |
| Subsaharan African | 29 | 1.9% |
| Swedish | 32 | 2.1% |
| Swiss | 23 | 1.5% | View All 30 Rows |
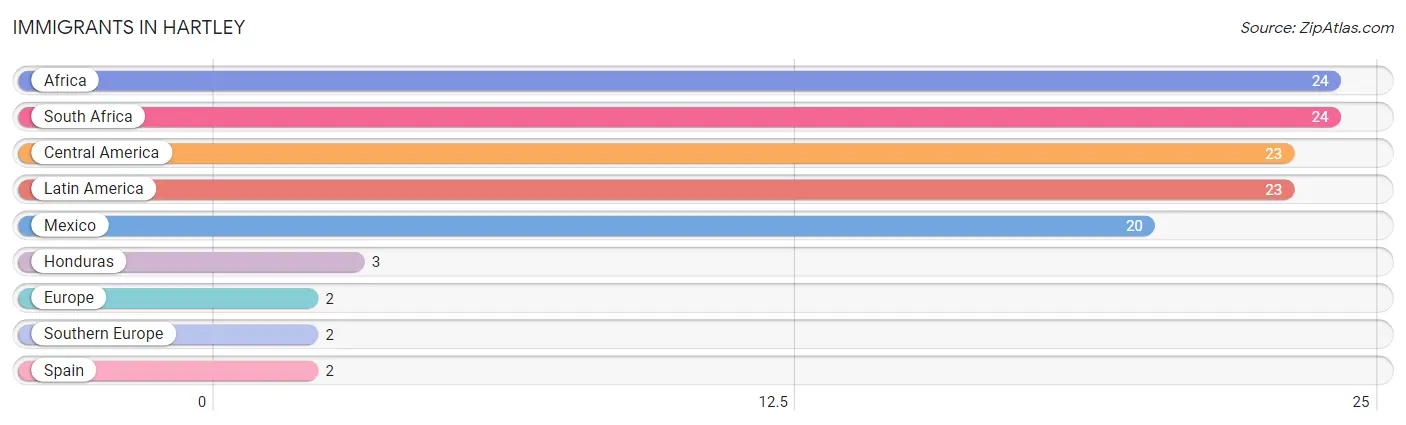
Immigrants in Hartley
The most numerous immigrant groups reported in Hartley came from Africa (24 | 1.6%), South Africa (24 | 1.6%), Central America (23 | 1.5%), Latin America (23 | 1.5%), and Mexico (20 | 1.3%), together accounting for 7.4% of all Hartley residents.
| Immigration Origin | # Population | % Population |
| Africa | 24 | 1.6% |
| Central America | 23 | 1.5% |
| Europe | 2 | 0.1% |
| Honduras | 3 | 0.2% |
| Latin America | 23 | 1.5% |
| Mexico | 20 | 1.3% |
| South Africa | 24 | 1.6% |
| Southern Europe | 2 | 0.1% |
| Spain | 2 | 0.1% | View All 9 Rows |
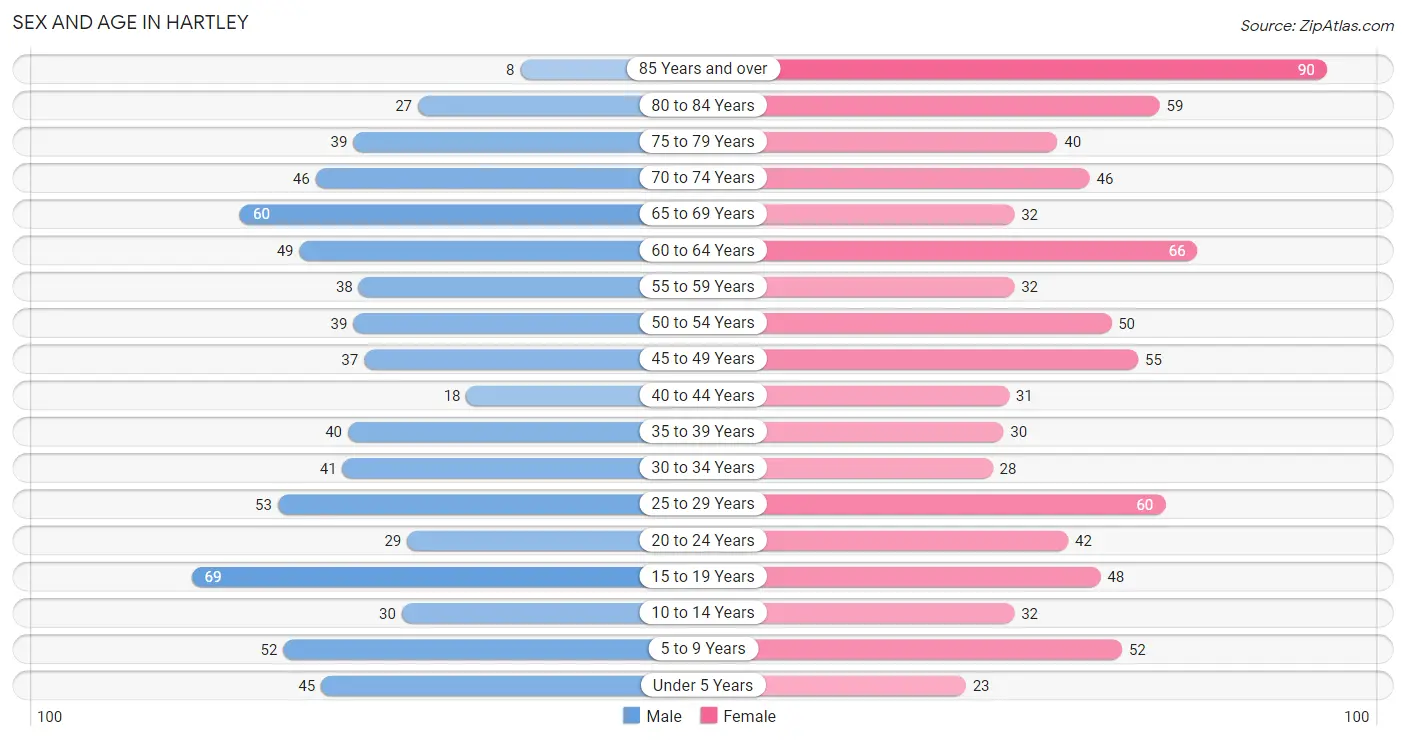
Sex and Age in Hartley
Sex and Age in Hartley
The most populous age groups in Hartley are 15 to 19 Years (69 | 9.6%) for men and 85 Years and over (90 | 11.0%) for women.
| Age Bracket | Male | Female |
| Under 5 Years | 45 (6.2%) | 23 (2.8%) |
| 5 to 9 Years | 52 (7.2%) | 52 (6.4%) |
| 10 to 14 Years | 30 (4.2%) | 32 (3.9%) |
| 15 to 19 Years | 69 (9.6%) | 48 (5.9%) |
| 20 to 24 Years | 29 (4.0%) | 42 (5.1%) |
| 25 to 29 Years | 53 (7.4%) | 60 (7.3%) |
| 30 to 34 Years | 41 (5.7%) | 28 (3.4%) |
| 35 to 39 Years | 40 (5.6%) | 30 (3.7%) |
| 40 to 44 Years | 18 (2.5%) | 31 (3.8%) |
| 45 to 49 Years | 37 (5.1%) | 55 (6.7%) |
| 50 to 54 Years | 39 (5.4%) | 50 (6.1%) |
| 55 to 59 Years | 38 (5.3%) | 32 (3.9%) |
| 60 to 64 Years | 49 (6.8%) | 66 (8.1%) |
| 65 to 69 Years | 60 (8.3%) | 32 (3.9%) |
| 70 to 74 Years | 46 (6.4%) | 46 (5.6%) |
| 75 to 79 Years | 39 (5.4%) | 40 (4.9%) |
| 80 to 84 Years | 27 (3.7%) | 59 (7.2%) |
| 85 Years and over | 8 (1.1%) | 90 (11.0%) |
| Total | 720 (100.0%) | 816 (100.0%) |
Families and Households in Hartley
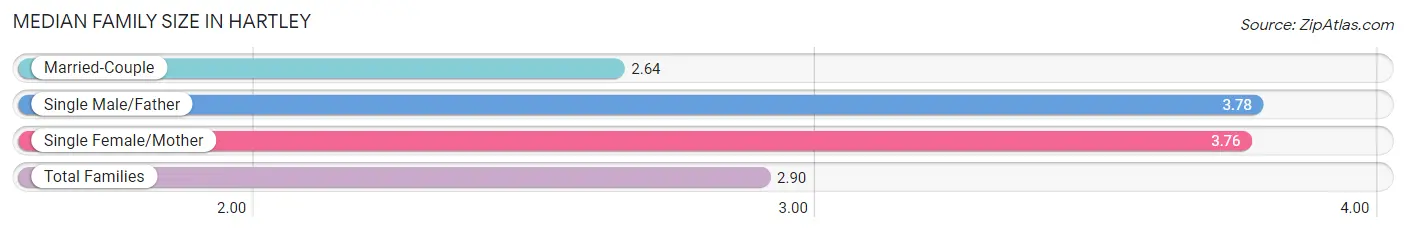
Median Family Size in Hartley
The median family size in Hartley is 2.90 persons per family, with single male/father families (36 | 9.7%) accounting for the largest median family size of 3.78 persons per family. On the other hand, married-couple families (288 | 77.2%) represent the smallest median family size with 2.64 persons per family.
| Family Type | # Families | Family Size |
| Married-Couple | 288 (77.2%) | 2.64 |
| Single Male/Father | 36 (9.7%) | 3.78 |
| Single Female/Mother | 49 (13.1%) | 3.76 |
| Total Families | 373 (100.0%) | 2.90 |
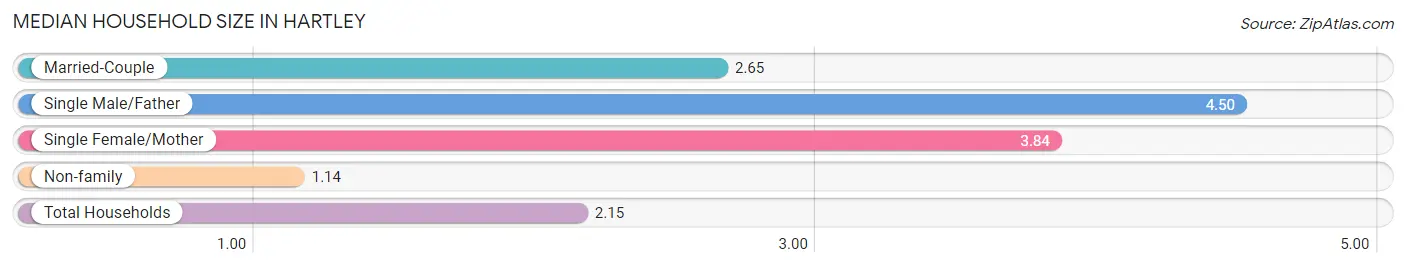
Median Household Size in Hartley
The median household size in Hartley is 2.15 persons per household, with single male/father households (36 | 5.3%) accounting for the largest median household size of 4.5 persons per household. non-family households (309 | 45.3%) represent the smallest median household size with 1.14 persons per household.
| Household Type | # Households | Household Size |
| Married-Couple | 288 (42.2%) | 2.65 |
| Single Male/Father | 36 (5.3%) | 4.50 |
| Single Female/Mother | 49 (7.2%) | 3.84 |
| Non-family | 309 (45.3%) | 1.14 |
| Total Households | 682 (100.0%) | 2.15 |
Household Size by Marriage Status in Hartley
Out of a total of 682 households in Hartley, 373 (54.7%) are family households, while 309 (45.3%) are nonfamily households. The most numerous type of family households are 2-person households, comprising 234, and the most common type of nonfamily households are 1-person households, comprising 278.
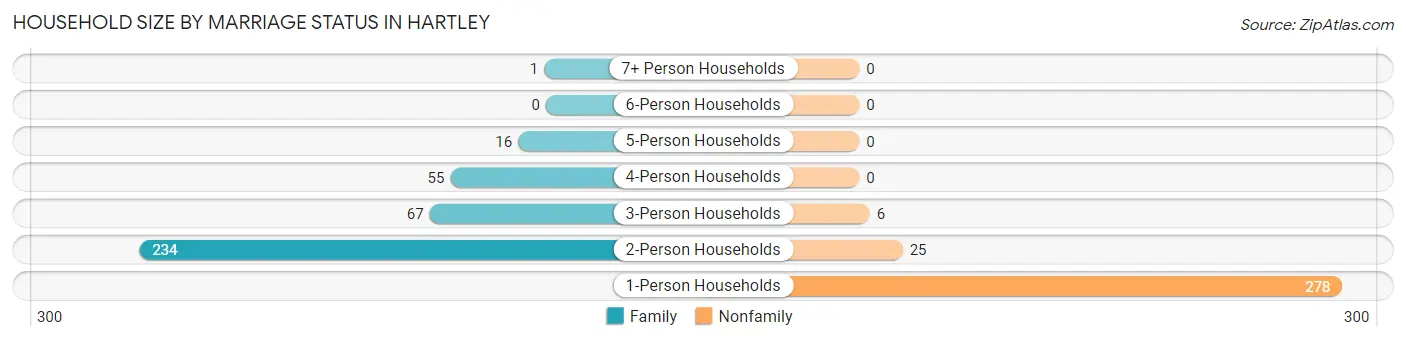
| Household Size | Family Households | Nonfamily Households |
| 1-Person Households | - | 278 (40.8%) |
| 2-Person Households | 234 (34.3%) | 25 (3.7%) |
| 3-Person Households | 67 (9.8%) | 6 (0.9%) |
| 4-Person Households | 55 (8.1%) | 0 (0.0%) |
| 5-Person Households | 16 (2.4%) | 0 (0.0%) |
| 6-Person Households | 0 (0.0%) | 0 (0.0%) |
| 7+ Person Households | 1 (0.2%) | 0 (0.0%) |
| Total | 373 (54.7%) | 309 (45.3%) |
Female Fertility in Hartley
Fertility by Age in Hartley
Average fertility rate in Hartley is 64.0 births per 1,000 women. Women in the age bracket of 20 to 34 years have the highest fertility rate with 146.0 births per 1,000 women. Women in the age bracket of 20 to 34 years acount for 100.0% of all women with births.
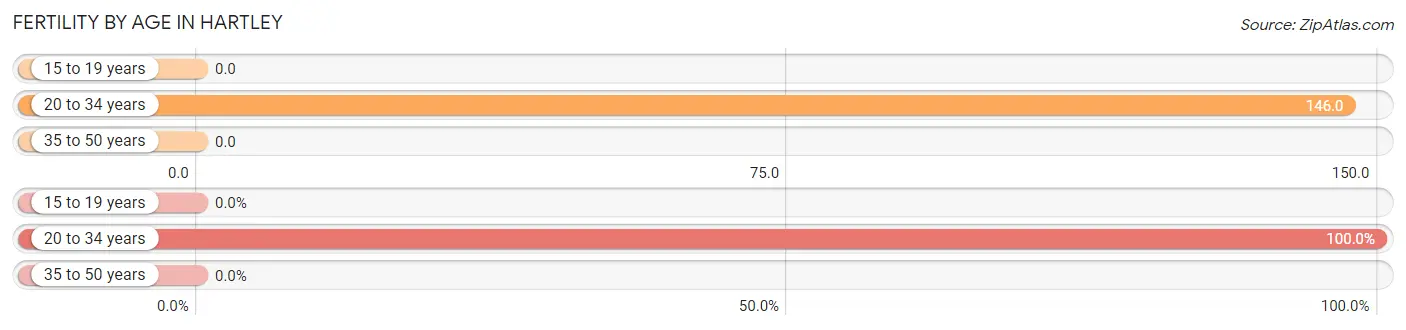
| Age Bracket | Women with Births | Births / 1,000 Women |
| 15 to 19 years | 0 (0.0%) | 0.0 |
| 20 to 34 years | 19 (100.0%) | 146.0 |
| 35 to 50 years | 0 (0.0%) | 0.0 |
| Total | 19 (100.0%) | 64.0 |
Fertility by Age by Marriage Status in Hartley
78.9% of women with births (19) in Hartley are married. The highest percentage of unmarried women with births falls into 20 to 34 years age bracket with 21.0% of them unmarried at the time of birth, while the lowest percentage of unmarried women with births belong to 20 to 34 years age bracket with 21.1% of them unmarried.
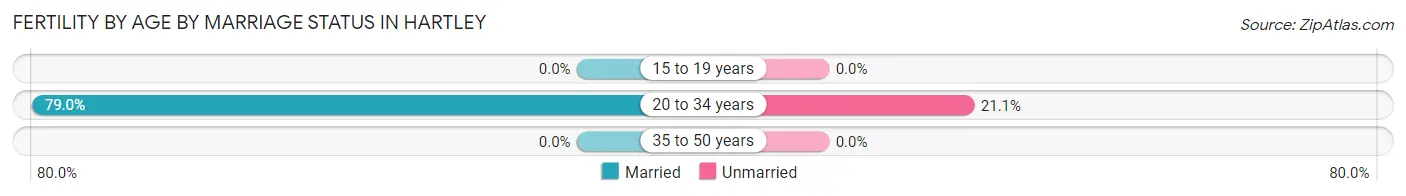
| Age Bracket | Married | Unmarried |
| 15 to 19 years | 0 (0.0%) | 0 (0.0%) |
| 20 to 34 years | 15 (78.9%) | 4 (21.0%) |
| 35 to 50 years | 0 (0.0%) | 0 (0.0%) |
| Total | 15 (78.9%) | 4 (21.0%) |
Fertility by Education in Hartley
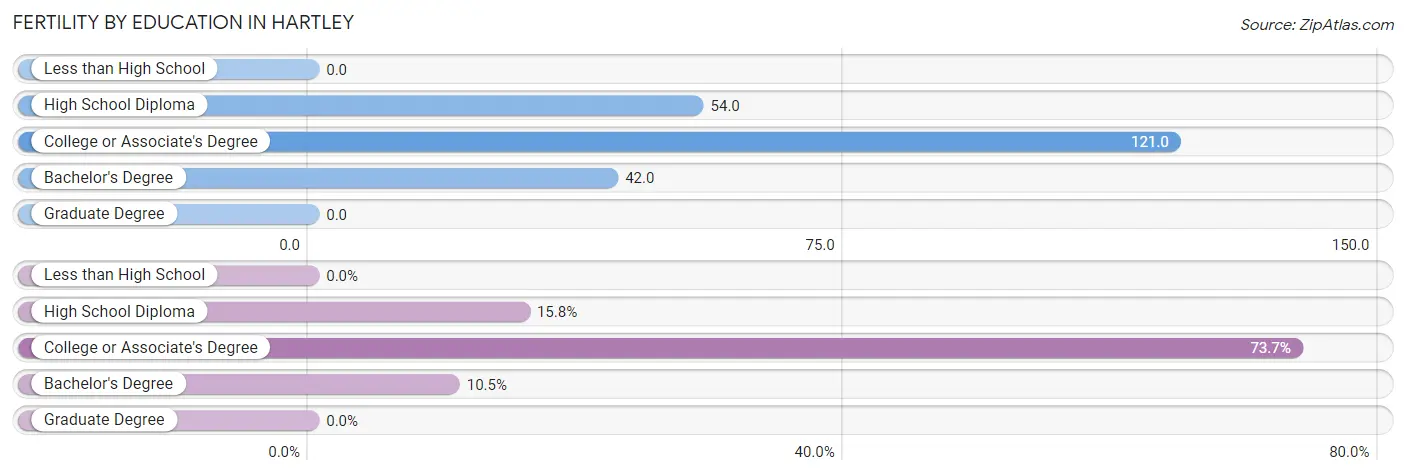
| Educational Attainment | Women with Births | Births / 1,000 Women |
| Less than High School | 0 (0.0%) | 0.0 |
| High School Diploma | 3 (15.8%) | 54.0 |
| College or Associate's Degree | 14 (73.7%) | 121.0 |
| Bachelor's Degree | 2 (10.5%) | 42.0 |
| Graduate Degree | 0 (0.0%) | 0.0 |
| Total | 19 (100.0%) | 64.0 |
Fertility by Education by Marriage Status in Hartley
21.0% of women with births in Hartley are unmarried. Women with the educational attainment of bachelor's degree are most likely to be married with 100.0% of them married at childbirth, while women with the educational attainment of high school diploma are least likely to be married with 100.0% of them unmarried at childbirth.
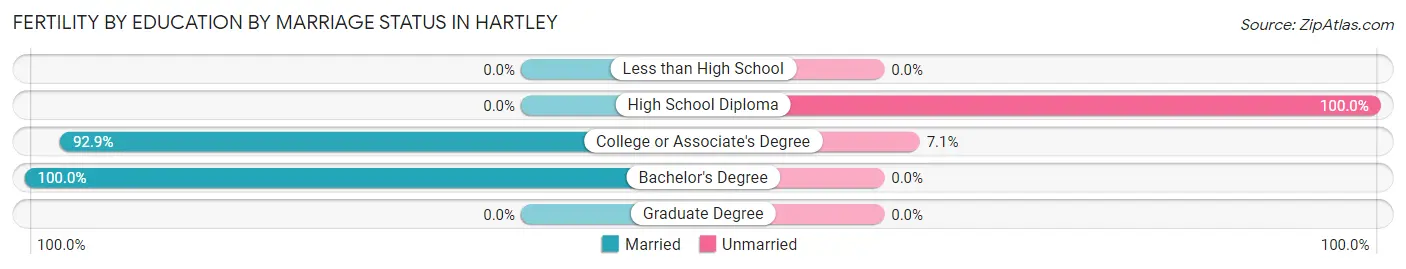
| Educational Attainment | Married | Unmarried |
| Less than High School | 0 (0.0%) | 0 (0.0%) |
| High School Diploma | 0 (0.0%) | 3 (100.0%) |
| College or Associate's Degree | 13 (92.9%) | 1 (7.1%) |
| Bachelor's Degree | 2 (100.0%) | 0 (0.0%) |
| Graduate Degree | 0 (0.0%) | 0 (0.0%) |
| Total | 15 (78.9%) | 4 (21.0%) |
Employment Characteristics in Hartley
Employment by Class of Employer in Hartley
Among the 685 employed individuals in Hartley, private company employees (478 | 69.8%), not-for-profit organizations (85 | 12.4%), and self-employed (incorporated) (42 | 6.1%) make up the most common classes of employment.
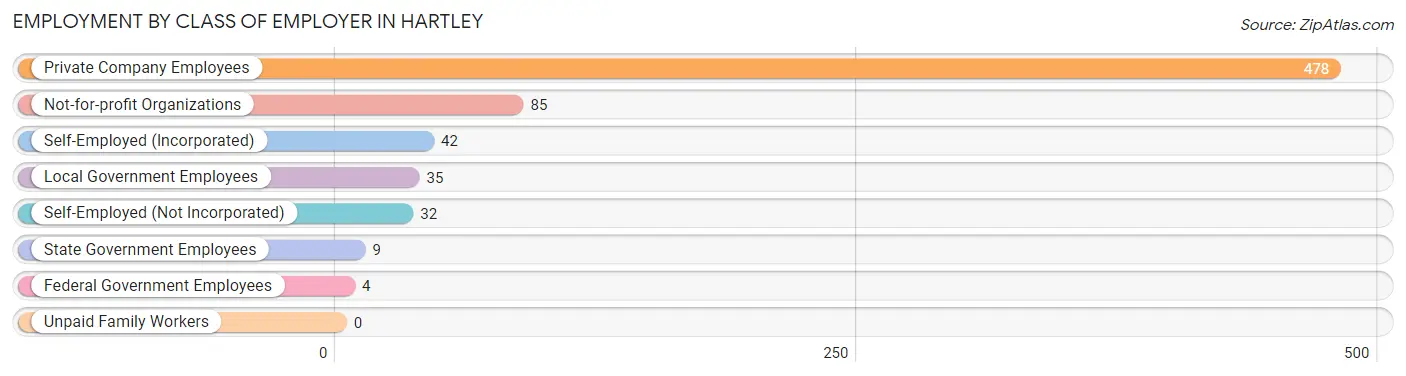
| Employer Class | # Employees | % Employees |
| Private Company Employees | 478 | 69.8% |
| Self-Employed (Incorporated) | 42 | 6.1% |
| Self-Employed (Not Incorporated) | 32 | 4.7% |
| Not-for-profit Organizations | 85 | 12.4% |
| Local Government Employees | 35 | 5.1% |
| State Government Employees | 9 | 1.3% |
| Federal Government Employees | 4 | 0.6% |
| Unpaid Family Workers | 0 | 0.0% |
| Total | 685 | 100.0% |
Employment Status by Age in Hartley
According to the labor force statistics for Hartley, out of the total population over 16 years of age (1,292), 55.5% or 717 individuals are in the labor force, with 3.2% or 23 of them unemployed. The age group with the highest labor force participation rate is 25 to 29 years, with 92.0% or 104 individuals in the labor force. Within the labor force, the 20 to 24 years age range has the highest percentage of unemployed individuals, with 7.8% or 5 of them being unemployed.
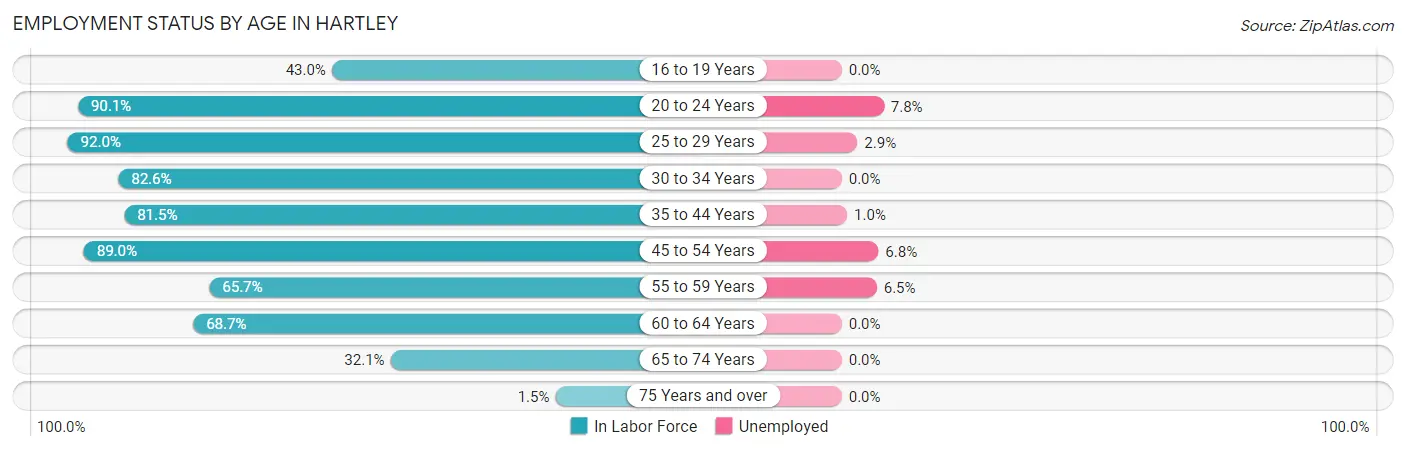
| Age Bracket | In Labor Force | Unemployed |
| 16 to 19 Years | 46 (43.0%) | 0 (0.0%) |
| 20 to 24 Years | 64 (90.1%) | 5 (7.8%) |
| 25 to 29 Years | 104 (92.0%) | 3 (2.9%) |
| 30 to 34 Years | 57 (82.6%) | 0 (0.0%) |
| 35 to 44 Years | 97 (81.5%) | 1 (1.0%) |
| 45 to 54 Years | 161 (89.0%) | 11 (6.8%) |
| 55 to 59 Years | 46 (65.7%) | 3 (6.5%) |
| 60 to 64 Years | 79 (68.7%) | 0 (0.0%) |
| 65 to 74 Years | 59 (32.1%) | 0 (0.0%) |
| 75 Years and over | 4 (1.5%) | 0 (0.0%) |
| Total | 717 (55.5%) | 23 (3.2%) |
Employment Status by Educational Attainment in Hartley
According to labor force statistics for Hartley, 81.6% of individuals (544) out of the total population between 25 and 64 years of age (667) are in the labor force, with 3.3% or 18 of them being unemployed. The group with the highest labor force participation rate are those with the educational attainment of college / associate degree, with 87.6% or 268 individuals in the labor force. Within the labor force, individuals with college / associate degree education have the highest percentage of unemployment, with 4.1% or 11 of them being unemployed.
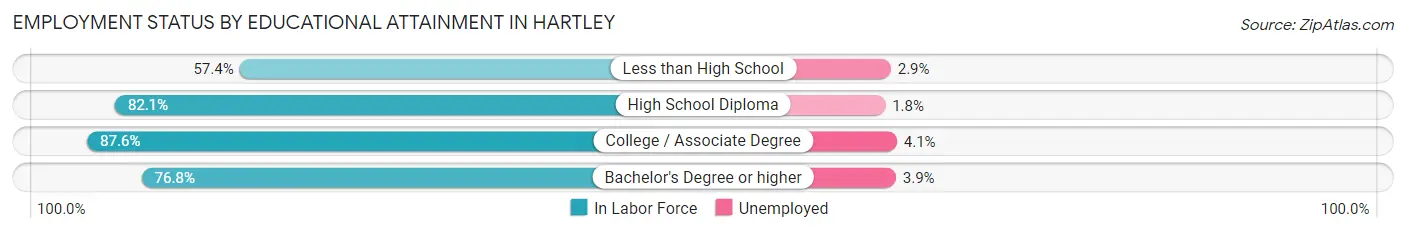
| Educational Attainment | In Labor Force | Unemployed |
| Less than High School | 35 (57.4%) | 2 (2.9%) |
| High School Diploma | 165 (82.1%) | 4 (1.8%) |
| College / Associate Degree | 268 (87.6%) | 13 (4.1%) |
| Bachelor's Degree or higher | 76 (76.8%) | 4 (3.9%) |
| Total | 544 (81.6%) | 22 (3.3%) |
Employment Occupations by Sex in Hartley
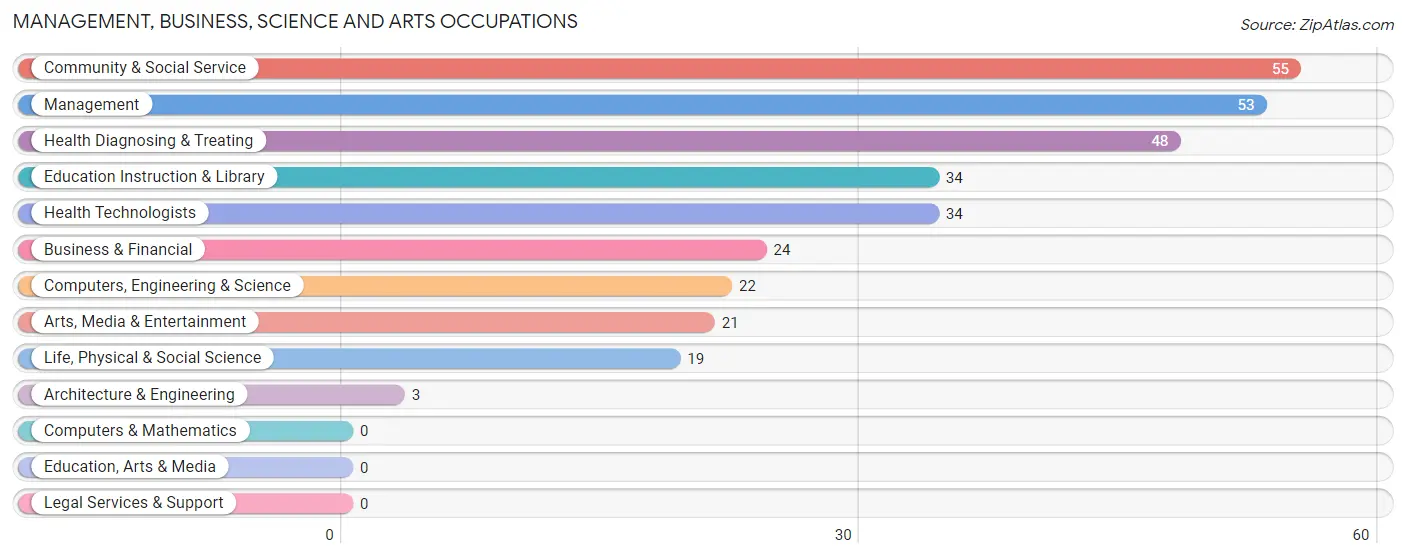
Management, Business, Science and Arts Occupations
The most common Management, Business, Science and Arts occupations in Hartley are Community & Social Service (55 | 7.9%), Management (53 | 7.6%), Health Diagnosing & Treating (48 | 6.9%), Education Instruction & Library (34 | 4.9%), and Health Technologists (34 | 4.9%).
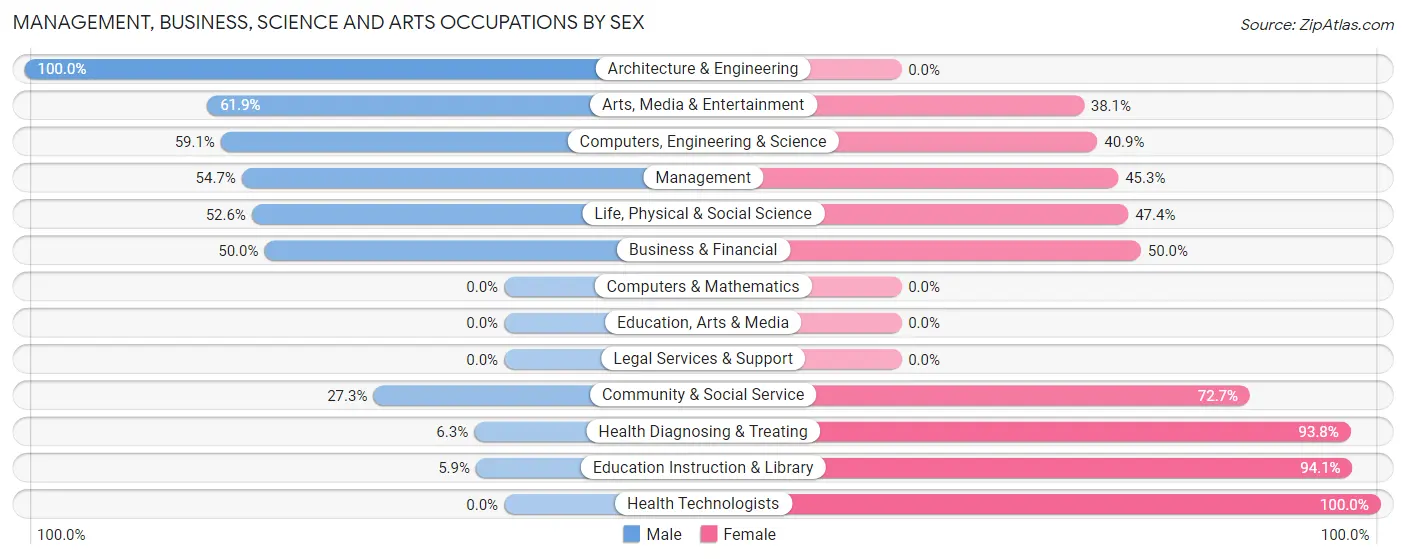
Management, Business, Science and Arts Occupations by Sex
Within the Management, Business, Science and Arts occupations in Hartley, the most male-oriented occupations are Architecture & Engineering (100.0%), Arts, Media & Entertainment (61.9%), and Computers, Engineering & Science (59.1%), while the most female-oriented occupations are Health Technologists (100.0%), Education Instruction & Library (94.1%), and Health Diagnosing & Treating (93.8%).
| Occupation | Male | Female |
| Management | 29 (54.7%) | 24 (45.3%) |
| Business & Financial | 12 (50.0%) | 12 (50.0%) |
| Computers, Engineering & Science | 13 (59.1%) | 9 (40.9%) |
| Computers & Mathematics | 0 (0.0%) | 0 (0.0%) |
| Architecture & Engineering | 3 (100.0%) | 0 (0.0%) |
| Life, Physical & Social Science | 10 (52.6%) | 9 (47.4%) |
| Community & Social Service | 15 (27.3%) | 40 (72.7%) |
| Education, Arts & Media | 0 (0.0%) | 0 (0.0%) |
| Legal Services & Support | 0 (0.0%) | 0 (0.0%) |
| Education Instruction & Library | 2 (5.9%) | 32 (94.1%) |
| Arts, Media & Entertainment | 13 (61.9%) | 8 (38.1%) |
| Health Diagnosing & Treating | 3 (6.2%) | 45 (93.8%) |
| Health Technologists | 0 (0.0%) | 34 (100.0%) |
| Total (Category) | 72 (35.6%) | 130 (64.4%) |
| Total (Overall) | 353 (50.9%) | 341 (49.1%) |
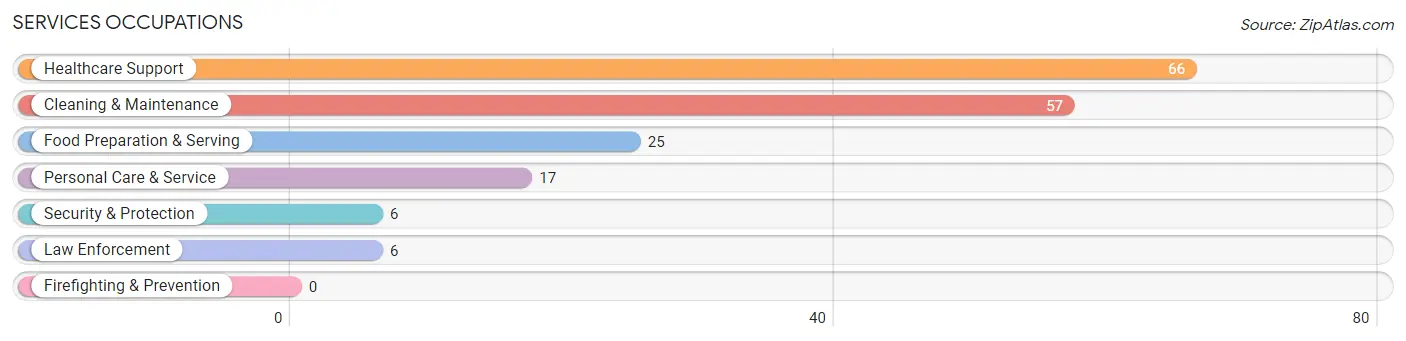
Services Occupations
The most common Services occupations in Hartley are Healthcare Support (66 | 9.5%), Cleaning & Maintenance (57 | 8.2%), Food Preparation & Serving (25 | 3.6%), Personal Care & Service (17 | 2.5%), and Security & Protection (6 | 0.9%).
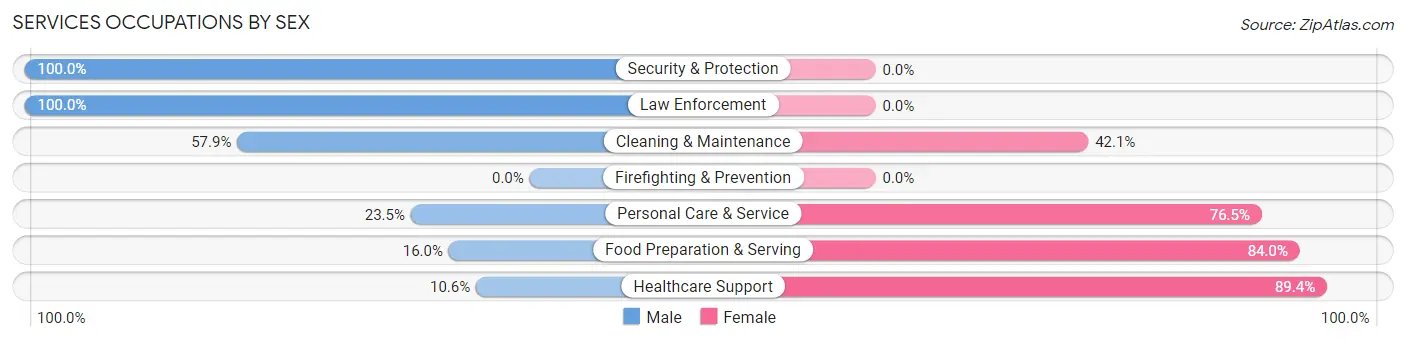
Services Occupations by Sex
Within the Services occupations in Hartley, the most male-oriented occupations are Security & Protection (100.0%), Law Enforcement (100.0%), and Cleaning & Maintenance (57.9%), while the most female-oriented occupations are Healthcare Support (89.4%), Food Preparation & Serving (84.0%), and Personal Care & Service (76.5%).
| Occupation | Male | Female |
| Healthcare Support | 7 (10.6%) | 59 (89.4%) |
| Security & Protection | 6 (100.0%) | 0 (0.0%) |
| Firefighting & Prevention | 0 (0.0%) | 0 (0.0%) |
| Law Enforcement | 6 (100.0%) | 0 (0.0%) |
| Food Preparation & Serving | 4 (16.0%) | 21 (84.0%) |
| Cleaning & Maintenance | 33 (57.9%) | 24 (42.1%) |
| Personal Care & Service | 4 (23.5%) | 13 (76.5%) |
| Total (Category) | 54 (31.6%) | 117 (68.4%) |
| Total (Overall) | 353 (50.9%) | 341 (49.1%) |
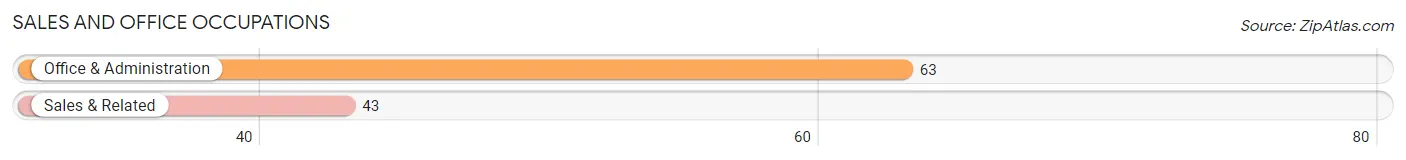
Sales and Office Occupations
The most common Sales and Office occupations in Hartley are Office & Administration (63 | 9.1%), and Sales & Related (43 | 6.2%).
Sales and Office Occupations by Sex
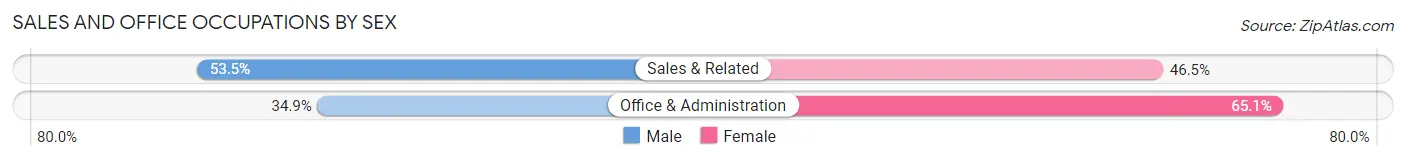
| Occupation | Male | Female |
| Sales & Related | 23 (53.5%) | 20 (46.5%) |
| Office & Administration | 22 (34.9%) | 41 (65.1%) |
| Total (Category) | 45 (42.4%) | 61 (57.6%) |
| Total (Overall) | 353 (50.9%) | 341 (49.1%) |
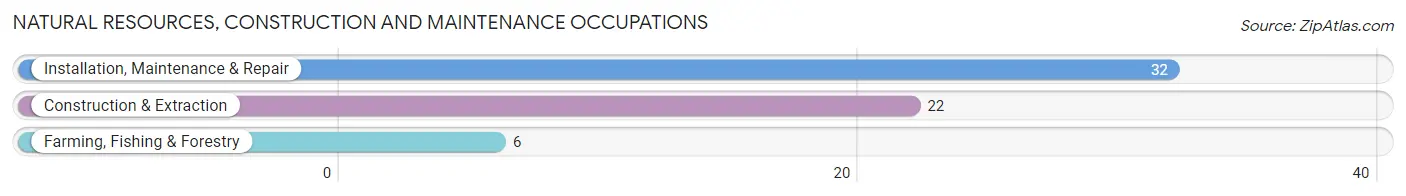
Natural Resources, Construction and Maintenance Occupations
The most common Natural Resources, Construction and Maintenance occupations in Hartley are Installation, Maintenance & Repair (32 | 4.6%), Construction & Extraction (22 | 3.2%), and Farming, Fishing & Forestry (6 | 0.9%).
Natural Resources, Construction and Maintenance Occupations by Sex
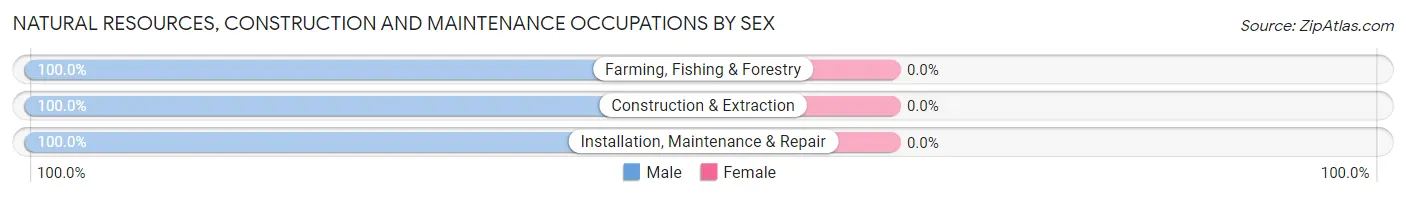
| Occupation | Male | Female |
| Farming, Fishing & Forestry | 6 (100.0%) | 0 (0.0%) |
| Construction & Extraction | 22 (100.0%) | 0 (0.0%) |
| Installation, Maintenance & Repair | 32 (100.0%) | 0 (0.0%) |
| Total (Category) | 60 (100.0%) | 0 (0.0%) |
| Total (Overall) | 353 (50.9%) | 341 (49.1%) |
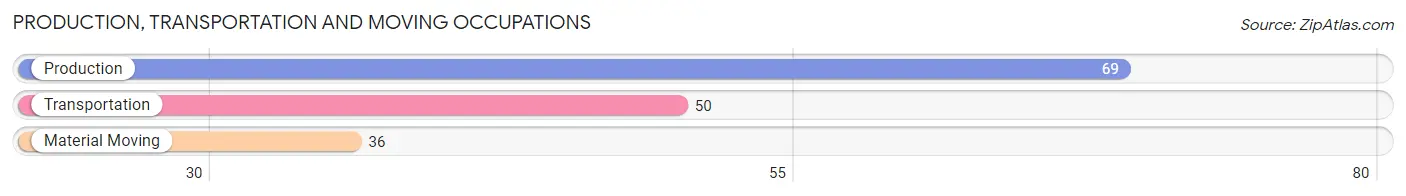
Production, Transportation and Moving Occupations
The most common Production, Transportation and Moving occupations in Hartley are Production (69 | 9.9%), Transportation (50 | 7.2%), and Material Moving (36 | 5.2%).
Production, Transportation and Moving Occupations by Sex
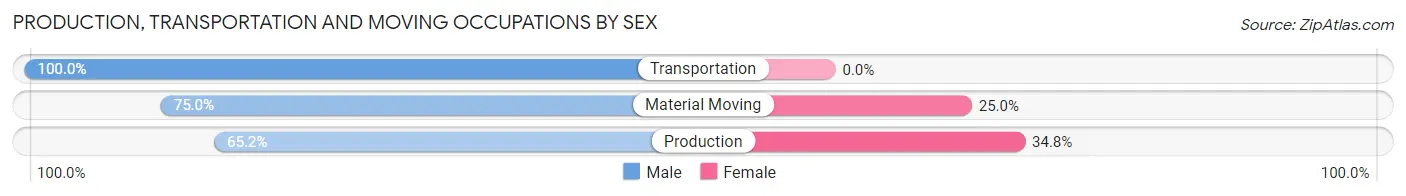
| Occupation | Male | Female |
| Production | 45 (65.2%) | 24 (34.8%) |
| Transportation | 50 (100.0%) | 0 (0.0%) |
| Material Moving | 27 (75.0%) | 9 (25.0%) |
| Total (Category) | 122 (78.7%) | 33 (21.3%) |
| Total (Overall) | 353 (50.9%) | 341 (49.1%) |
Employment Industries by Sex in Hartley
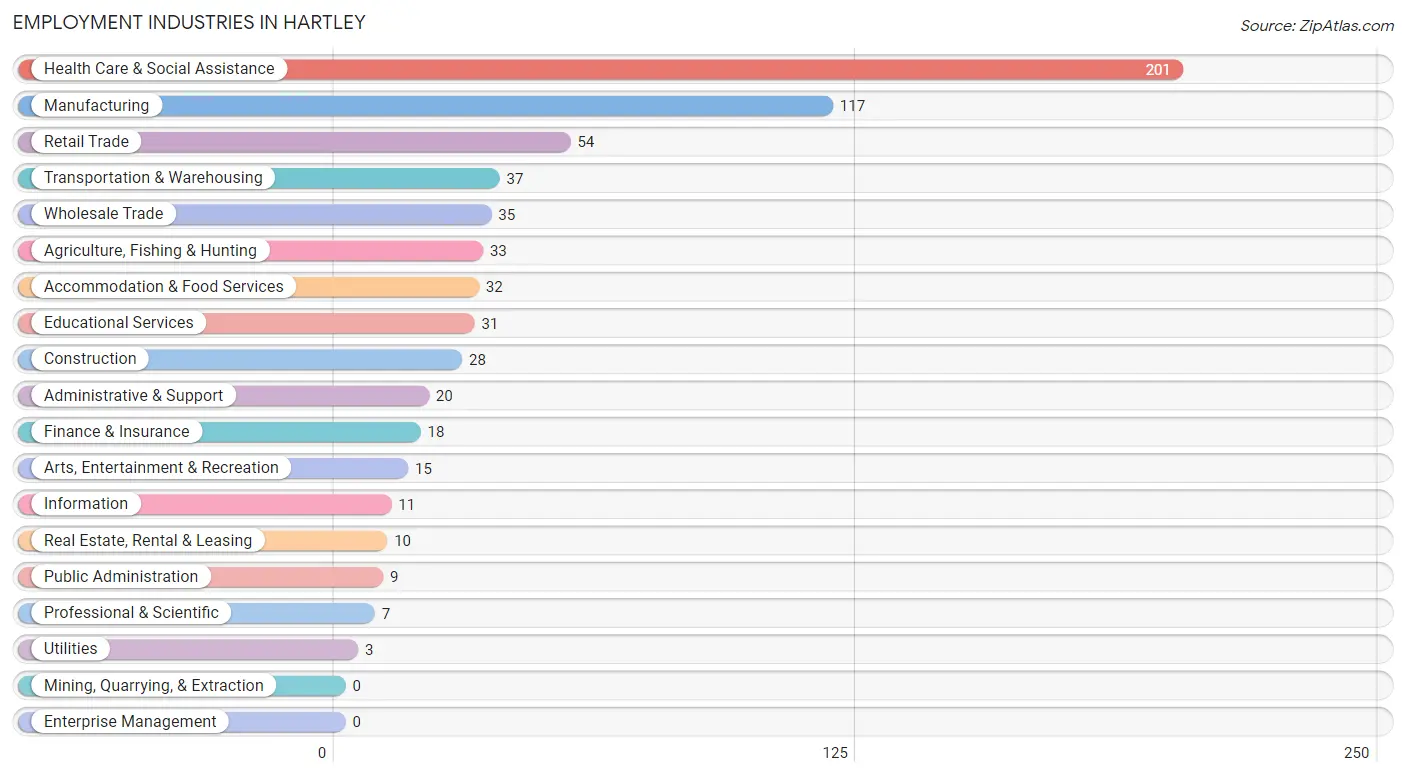
Employment Industries in Hartley
The major employment industries in Hartley include Health Care & Social Assistance (201 | 29.0%), Manufacturing (117 | 16.9%), Retail Trade (54 | 7.8%), Transportation & Warehousing (37 | 5.3%), and Wholesale Trade (35 | 5.0%).
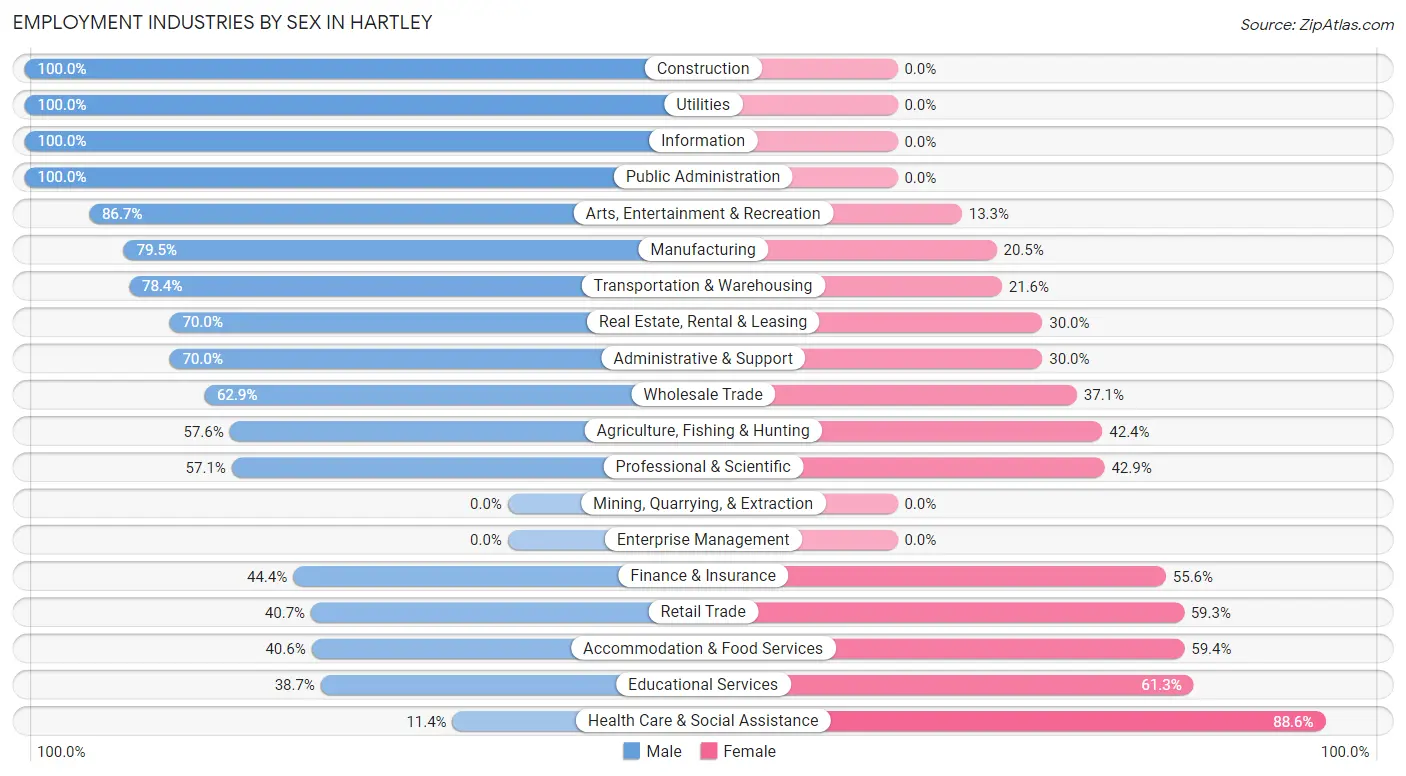
Employment Industries by Sex in Hartley
The Hartley industries that see more men than women are Construction (100.0%), Utilities (100.0%), and Information (100.0%), whereas the industries that tend to have a higher number of women are Health Care & Social Assistance (88.6%), Educational Services (61.3%), and Accommodation & Food Services (59.4%).
| Industry | Male | Female |
| Agriculture, Fishing & Hunting | 19 (57.6%) | 14 (42.4%) |
| Mining, Quarrying, & Extraction | 0 (0.0%) | 0 (0.0%) |
| Construction | 28 (100.0%) | 0 (0.0%) |
| Manufacturing | 93 (79.5%) | 24 (20.5%) |
| Wholesale Trade | 22 (62.9%) | 13 (37.1%) |
| Retail Trade | 22 (40.7%) | 32 (59.3%) |
| Transportation & Warehousing | 29 (78.4%) | 8 (21.6%) |
| Utilities | 3 (100.0%) | 0 (0.0%) |
| Information | 11 (100.0%) | 0 (0.0%) |
| Finance & Insurance | 8 (44.4%) | 10 (55.6%) |
| Real Estate, Rental & Leasing | 7 (70.0%) | 3 (30.0%) |
| Professional & Scientific | 4 (57.1%) | 3 (42.9%) |
| Enterprise Management | 0 (0.0%) | 0 (0.0%) |
| Administrative & Support | 14 (70.0%) | 6 (30.0%) |
| Educational Services | 12 (38.7%) | 19 (61.3%) |
| Health Care & Social Assistance | 23 (11.4%) | 178 (88.6%) |
| Arts, Entertainment & Recreation | 13 (86.7%) | 2 (13.3%) |
| Accommodation & Food Services | 13 (40.6%) | 19 (59.4%) |
| Public Administration | 9 (100.0%) | 0 (0.0%) |
| Total | 353 (50.9%) | 341 (49.1%) |
Education in Hartley
School Enrollment in Hartley
The most common levels of schooling among the 328 students in Hartley are high school (79 | 24.1%), elementary school (70 | 21.3%), and college / undergraduate (69 | 21.0%).
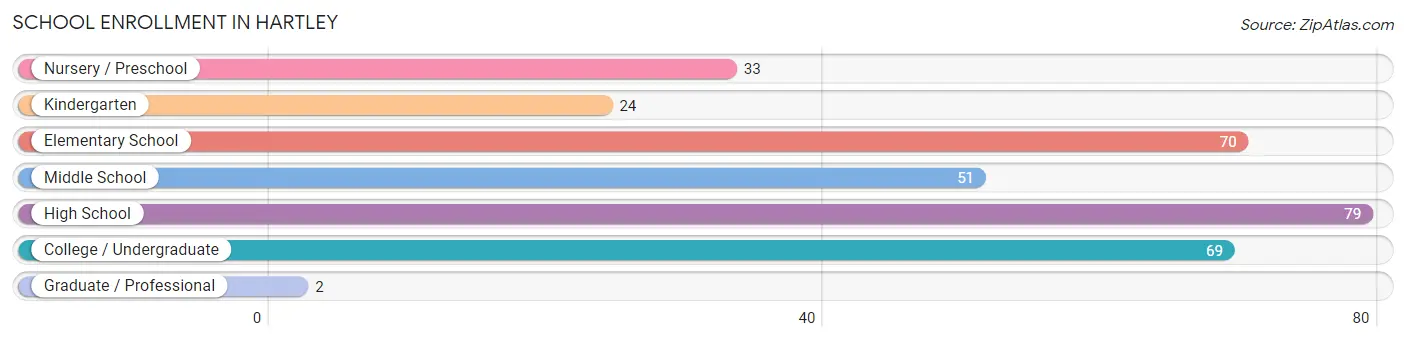
| School Level | # Students | % Students |
| Nursery / Preschool | 33 | 10.1% |
| Kindergarten | 24 | 7.3% |
| Elementary School | 70 | 21.3% |
| Middle School | 51 | 15.5% |
| High School | 79 | 24.1% |
| College / Undergraduate | 69 | 21.0% |
| Graduate / Professional | 2 | 0.6% |
| Total | 328 | 100.0% |
School Enrollment by Age by Funding Source in Hartley
Out of a total of 328 students who are enrolled in schools in Hartley, 13 (4.0%) attend a private institution, while the remaining 315 (96.0%) are enrolled in public schools. The age group of 35 years and over has the highest likelihood of being enrolled in private schools, with 7 (100.0% in the age bracket) enrolled. Conversely, the age group of 5 to 9 year old has the lowest likelihood of being enrolled in a private school, with 104 (100.0% in the age bracket) attending a public institution.
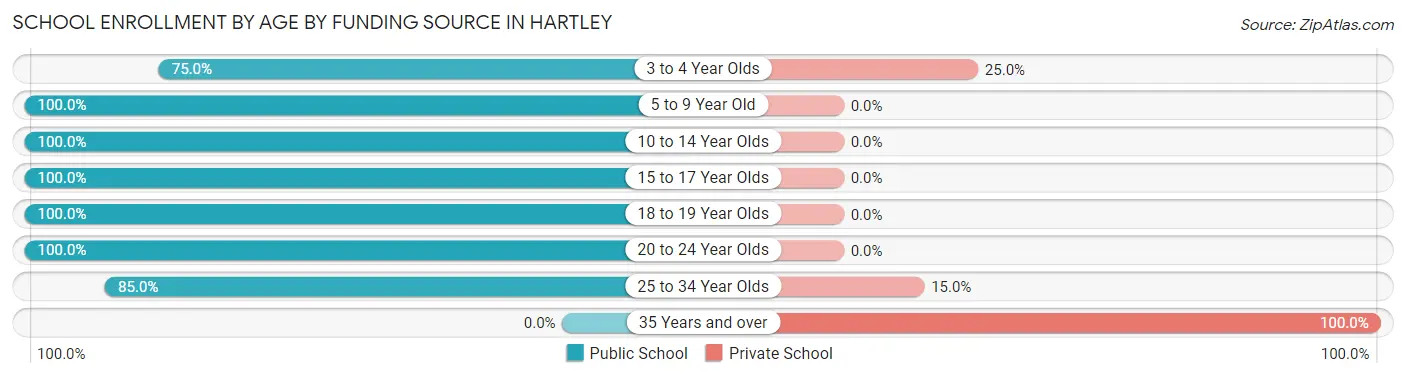
| Age Bracket | Public School | Private School |
| 3 to 4 Year Olds | 9 (75.0%) | 3 (25.0%) |
| 5 to 9 Year Old | 104 (100.0%) | 0 (0.0%) |
| 10 to 14 Year Olds | 62 (100.0%) | 0 (0.0%) |
| 15 to 17 Year Olds | 41 (100.0%) | 0 (0.0%) |
| 18 to 19 Year Olds | 47 (100.0%) | 0 (0.0%) |
| 20 to 24 Year Olds | 35 (100.0%) | 0 (0.0%) |
| 25 to 34 Year Olds | 17 (85.0%) | 3 (15.0%) |
| 35 Years and over | 0 (0.0%) | 7 (100.0%) |
| Total | 315 (96.0%) | 13 (4.0%) |
Educational Attainment by Field of Study in Hartley
Education (68 | 39.5%), business (28 | 16.3%), bio, nature & agricultural (19 | 11.1%), science & technology (16 | 9.3%), and psychology (14 | 8.1%) are the most common fields of study among 172 individuals in Hartley who have obtained a bachelor's degree or higher.
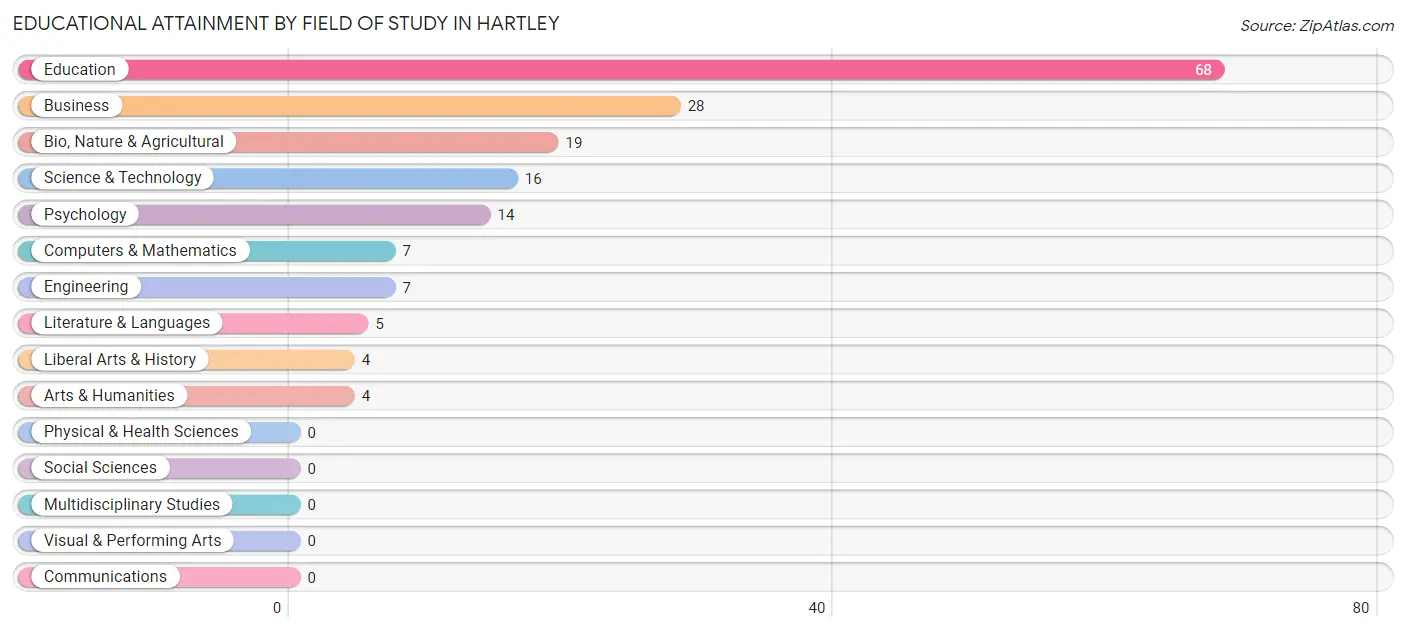
| Field of Study | # Graduates | % Graduates |
| Computers & Mathematics | 7 | 4.1% |
| Bio, Nature & Agricultural | 19 | 11.1% |
| Physical & Health Sciences | 0 | 0.0% |
| Psychology | 14 | 8.1% |
| Social Sciences | 0 | 0.0% |
| Engineering | 7 | 4.1% |
| Multidisciplinary Studies | 0 | 0.0% |
| Science & Technology | 16 | 9.3% |
| Business | 28 | 16.3% |
| Education | 68 | 39.5% |
| Literature & Languages | 5 | 2.9% |
| Liberal Arts & History | 4 | 2.3% |
| Visual & Performing Arts | 0 | 0.0% |
| Communications | 0 | 0.0% |
| Arts & Humanities | 4 | 2.3% |
| Total | 172 | 100.0% |
Transportation & Commute in Hartley
Vehicle Availability by Sex in Hartley
The most prevalent vehicle ownership categories in Hartley are males with 2 vehicles (190, accounting for 54.9%) and females with 2 vehicles (169, making up 56.0%).
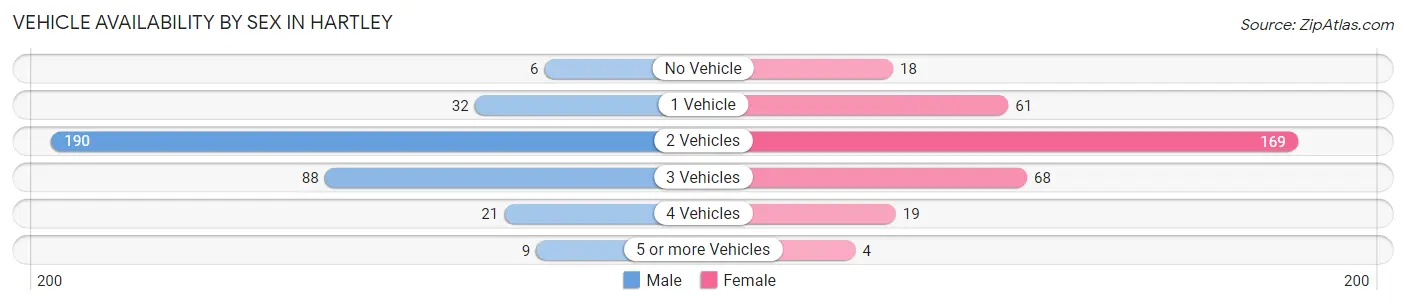
| Vehicles Available | Male | Female |
| No Vehicle | 6 (1.7%) | 18 (5.3%) |
| 1 Vehicle | 32 (9.2%) | 61 (18.0%) |
| 2 Vehicles | 190 (54.9%) | 169 (49.8%) |
| 3 Vehicles | 88 (25.4%) | 68 (20.1%) |
| 4 Vehicles | 21 (6.1%) | 19 (5.6%) |
| 5 or more Vehicles | 9 (2.6%) | 4 (1.2%) |
| Total | 346 (100.0%) | 339 (100.0%) |
Commute Time in Hartley
The most frequently occuring commute durations in Hartley are 5 to 9 minutes (119 commuters, 18.2%), less than 5 minutes (106 commuters, 16.2%), and 30 to 34 minutes (105 commuters, 16.0%).
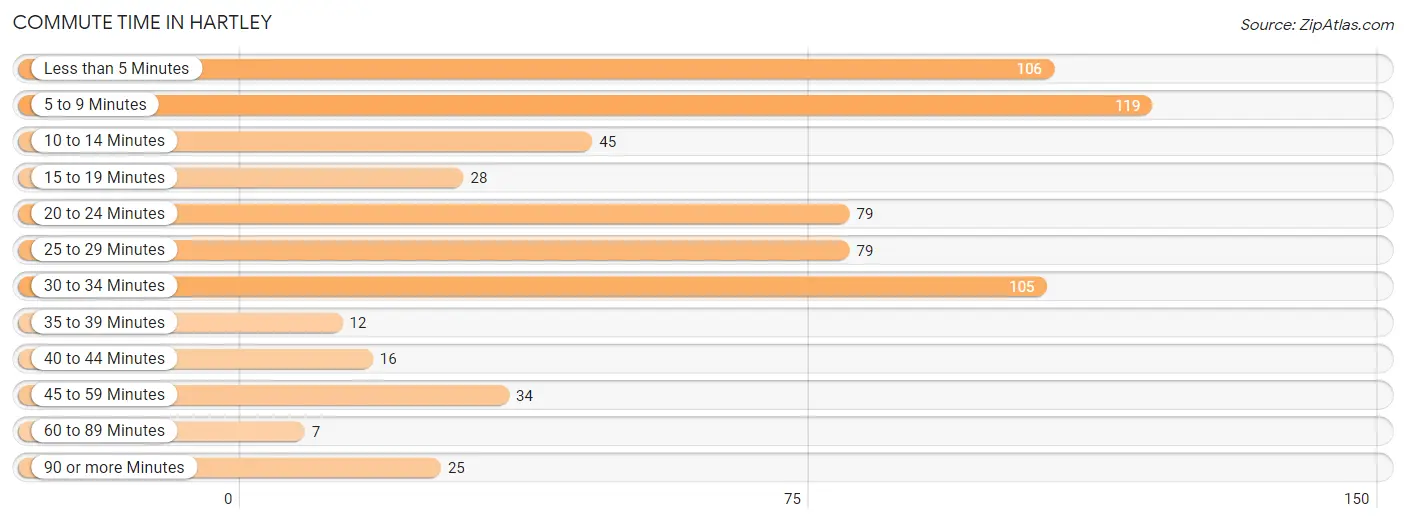
| Commute Time | # Commuters | % Commuters |
| Less than 5 Minutes | 106 | 16.2% |
| 5 to 9 Minutes | 119 | 18.2% |
| 10 to 14 Minutes | 45 | 6.9% |
| 15 to 19 Minutes | 28 | 4.3% |
| 20 to 24 Minutes | 79 | 12.1% |
| 25 to 29 Minutes | 79 | 12.1% |
| 30 to 34 Minutes | 105 | 16.0% |
| 35 to 39 Minutes | 12 | 1.8% |
| 40 to 44 Minutes | 16 | 2.4% |
| 45 to 59 Minutes | 34 | 5.2% |
| 60 to 89 Minutes | 7 | 1.1% |
| 90 or more Minutes | 25 | 3.8% |
Commute Time by Sex in Hartley
The most common commute times in Hartley are 30 to 34 minutes (69 commuters, 20.8%) for males and 5 to 9 minutes (61 commuters, 18.9%) for females.
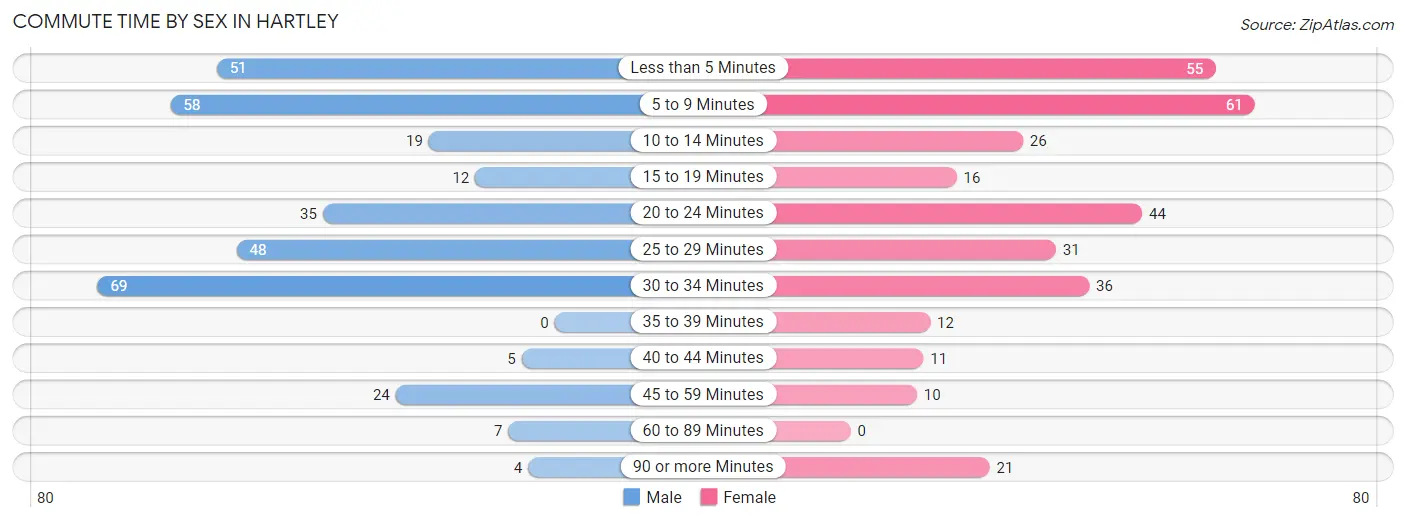
| Commute Time | Male | Female |
| Less than 5 Minutes | 51 (15.4%) | 55 (17.0%) |
| 5 to 9 Minutes | 58 (17.5%) | 61 (18.9%) |
| 10 to 14 Minutes | 19 (5.7%) | 26 (8.1%) |
| 15 to 19 Minutes | 12 (3.6%) | 16 (5.0%) |
| 20 to 24 Minutes | 35 (10.5%) | 44 (13.6%) |
| 25 to 29 Minutes | 48 (14.5%) | 31 (9.6%) |
| 30 to 34 Minutes | 69 (20.8%) | 36 (11.2%) |
| 35 to 39 Minutes | 0 (0.0%) | 12 (3.7%) |
| 40 to 44 Minutes | 5 (1.5%) | 11 (3.4%) |
| 45 to 59 Minutes | 24 (7.2%) | 10 (3.1%) |
| 60 to 89 Minutes | 7 (2.1%) | 0 (0.0%) |
| 90 or more Minutes | 4 (1.2%) | 21 (6.5%) |
Time of Departure to Work by Sex in Hartley
The most frequent times of departure to work in Hartley are 7:00 AM to 7:29 AM (100, 30.1%) for males and 12:00 AM to 4:59 AM (46, 14.2%) for females.
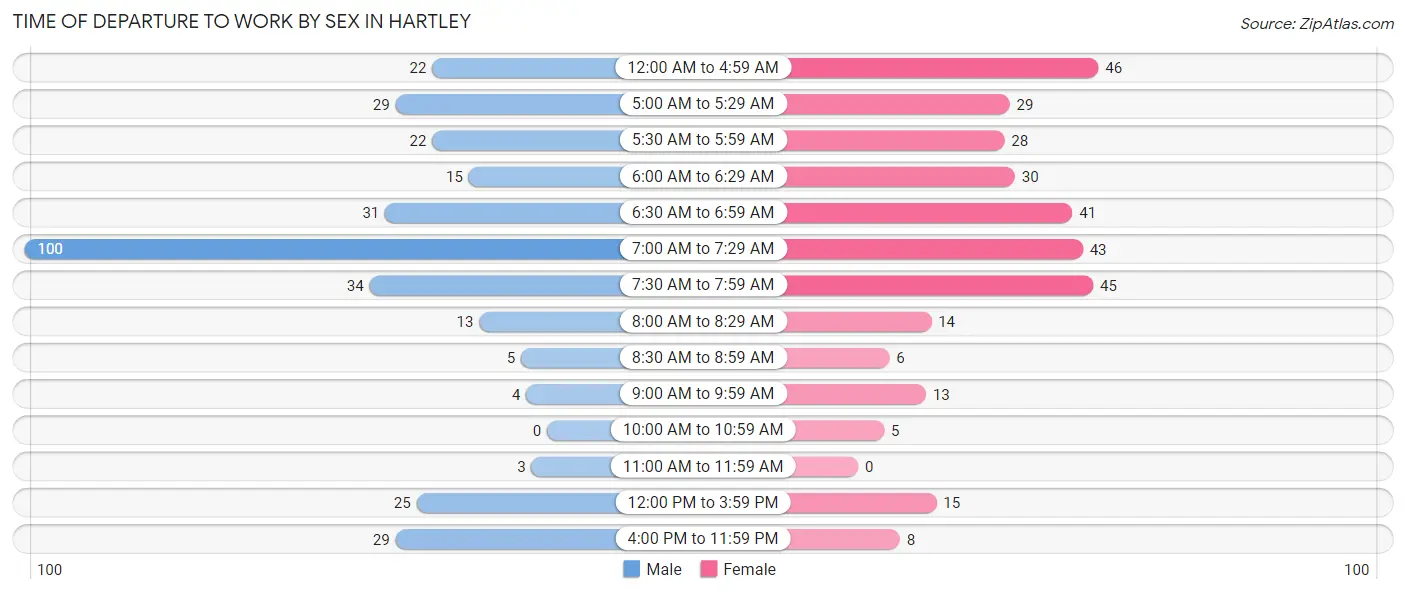
| Time of Departure | Male | Female |
| 12:00 AM to 4:59 AM | 22 (6.6%) | 46 (14.2%) |
| 5:00 AM to 5:29 AM | 29 (8.7%) | 29 (9.0%) |
| 5:30 AM to 5:59 AM | 22 (6.6%) | 28 (8.7%) |
| 6:00 AM to 6:29 AM | 15 (4.5%) | 30 (9.3%) |
| 6:30 AM to 6:59 AM | 31 (9.3%) | 41 (12.7%) |
| 7:00 AM to 7:29 AM | 100 (30.1%) | 43 (13.3%) |
| 7:30 AM to 7:59 AM | 34 (10.2%) | 45 (13.9%) |
| 8:00 AM to 8:29 AM | 13 (3.9%) | 14 (4.3%) |
| 8:30 AM to 8:59 AM | 5 (1.5%) | 6 (1.9%) |
| 9:00 AM to 9:59 AM | 4 (1.2%) | 13 (4.0%) |
| 10:00 AM to 10:59 AM | 0 (0.0%) | 5 (1.5%) |
| 11:00 AM to 11:59 AM | 3 (0.9%) | 0 (0.0%) |
| 12:00 PM to 3:59 PM | 25 (7.5%) | 15 (4.6%) |
| 4:00 PM to 11:59 PM | 29 (8.7%) | 8 (2.5%) |
| Total | 332 (100.0%) | 323 (100.0%) |
Housing Occupancy in Hartley
Occupancy by Ownership in Hartley
Of the total 682 dwellings in Hartley, owner-occupied units account for 508 (74.5%), while renter-occupied units make up 174 (25.5%).
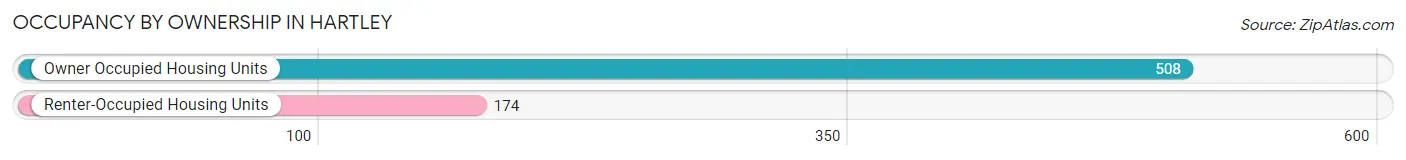
| Occupancy | # Housing Units | % Housing Units |
| Owner Occupied Housing Units | 508 | 74.5% |
| Renter-Occupied Housing Units | 174 | 25.5% |
| Total Occupied Housing Units | 682 | 100.0% |
Occupancy by Household Size in Hartley
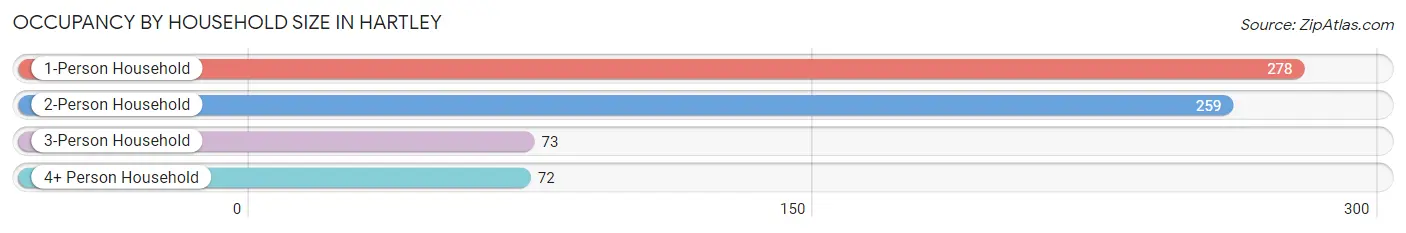
| Household Size | # Housing Units | % Housing Units |
| 1-Person Household | 278 | 40.8% |
| 2-Person Household | 259 | 38.0% |
| 3-Person Household | 73 | 10.7% |
| 4+ Person Household | 72 | 10.6% |
| Total Housing Units | 682 | 100.0% |
Occupancy by Ownership by Household Size in Hartley
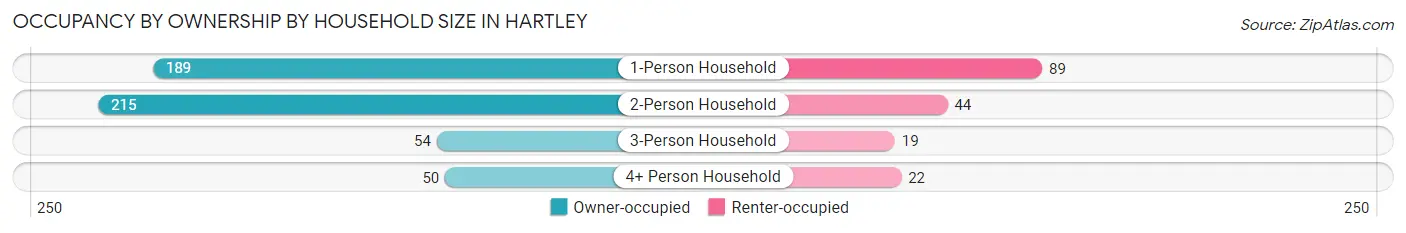
| Household Size | Owner-occupied | Renter-occupied |
| 1-Person Household | 189 (68.0%) | 89 (32.0%) |
| 2-Person Household | 215 (83.0%) | 44 (17.0%) |
| 3-Person Household | 54 (74.0%) | 19 (26.0%) |
| 4+ Person Household | 50 (69.4%) | 22 (30.6%) |
| Total Housing Units | 508 (74.5%) | 174 (25.5%) |
Occupancy by Educational Attainment in Hartley
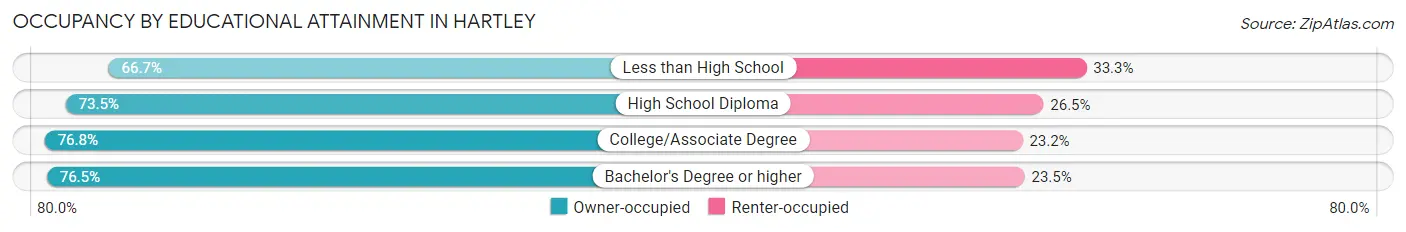
| Household Size | Owner-occupied | Renter-occupied |
| Less than High School | 44 (66.7%) | 22 (33.3%) |
| High School Diploma | 194 (73.5%) | 70 (26.5%) |
| College/Associate Degree | 192 (76.8%) | 58 (23.2%) |
| Bachelor's Degree or higher | 78 (76.5%) | 24 (23.5%) |
Occupancy by Age of Householder in Hartley
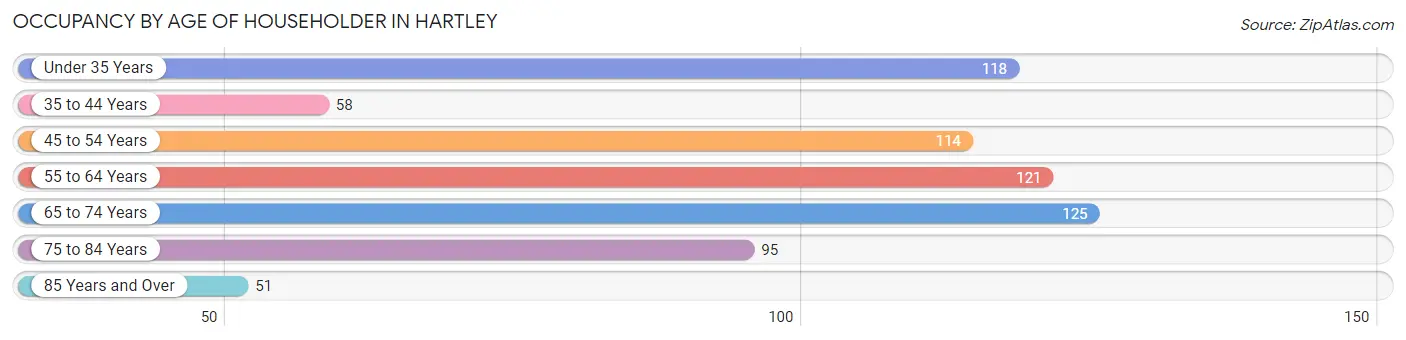
| Age Bracket | # Households | % Households |
| Under 35 Years | 118 | 17.3% |
| 35 to 44 Years | 58 | 8.5% |
| 45 to 54 Years | 114 | 16.7% |
| 55 to 64 Years | 121 | 17.7% |
| 65 to 74 Years | 125 | 18.3% |
| 75 to 84 Years | 95 | 13.9% |
| 85 Years and Over | 51 | 7.5% |
| Total | 682 | 100.0% |
Housing Finances in Hartley
Median Income by Occupancy in Hartley
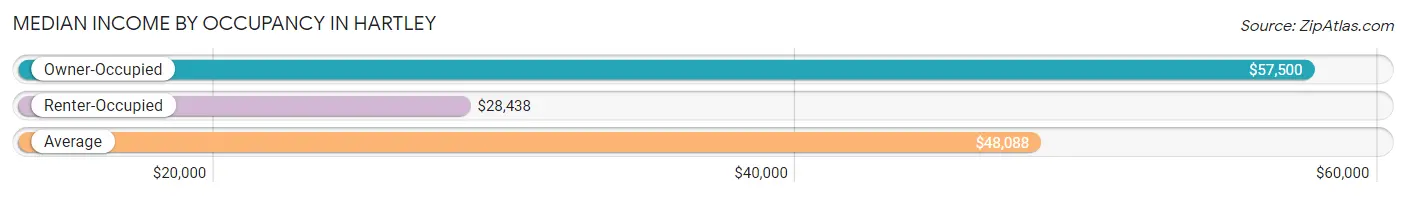
| Occupancy Type | # Households | Median Income |
| Owner-Occupied | 508 (74.5%) | $57,500 |
| Renter-Occupied | 174 (25.5%) | $28,438 |
| Average | 682 (100.0%) | $48,088 |
Occupancy by Householder Income Bracket in Hartley
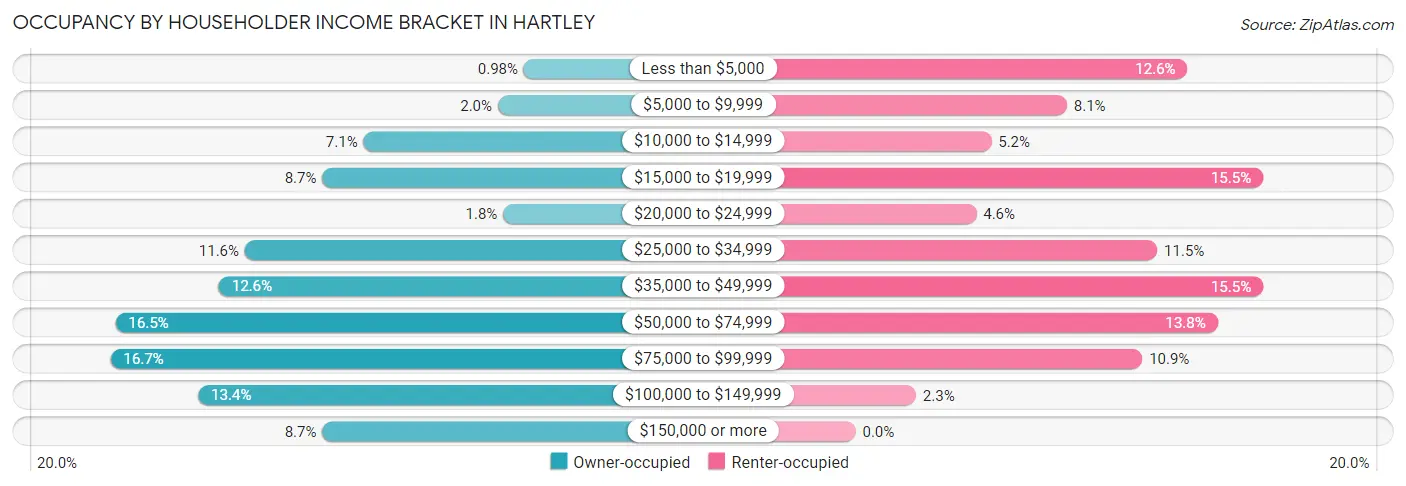
| Income Bracket | Owner-occupied | Renter-occupied |
| Less than $5,000 | 5 (1.0%) | 22 (12.6%) |
| $5,000 to $9,999 | 10 (2.0%) | 14 (8.1%) |
| $10,000 to $14,999 | 36 (7.1%) | 9 (5.2%) |
| $15,000 to $19,999 | 44 (8.7%) | 27 (15.5%) |
| $20,000 to $24,999 | 9 (1.8%) | 8 (4.6%) |
| $25,000 to $34,999 | 59 (11.6%) | 20 (11.5%) |
| $35,000 to $49,999 | 64 (12.6%) | 27 (15.5%) |
| $50,000 to $74,999 | 84 (16.5%) | 24 (13.8%) |
| $75,000 to $99,999 | 85 (16.7%) | 19 (10.9%) |
| $100,000 to $149,999 | 68 (13.4%) | 4 (2.3%) |
| $150,000 or more | 44 (8.7%) | 0 (0.0%) |
| Total | 508 (100.0%) | 174 (100.0%) |
Monthly Housing Cost Tiers in Hartley
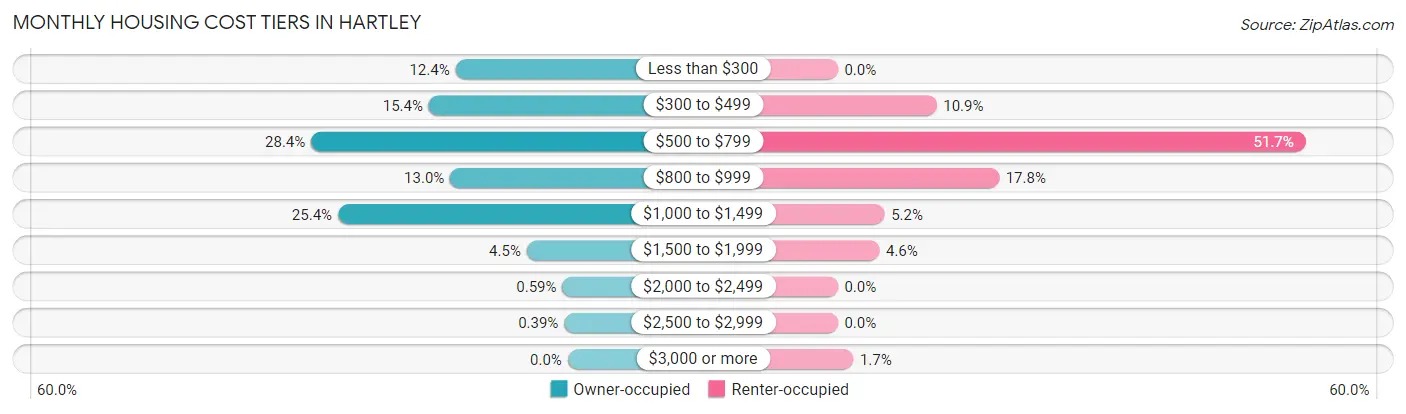
| Monthly Cost | Owner-occupied | Renter-occupied |
| Less than $300 | 63 (12.4%) | 0 (0.0%) |
| $300 to $499 | 78 (15.3%) | 19 (10.9%) |
| $500 to $799 | 144 (28.3%) | 90 (51.7%) |
| $800 to $999 | 66 (13.0%) | 31 (17.8%) |
| $1,000 to $1,499 | 129 (25.4%) | 9 (5.2%) |
| $1,500 to $1,999 | 23 (4.5%) | 8 (4.6%) |
| $2,000 to $2,499 | 3 (0.6%) | 0 (0.0%) |
| $2,500 to $2,999 | 2 (0.4%) | 0 (0.0%) |
| $3,000 or more | 0 (0.0%) | 3 (1.7%) |
| Total | 508 (100.0%) | 174 (100.0%) |
Physical Housing Characteristics in Hartley
Housing Structures in Hartley
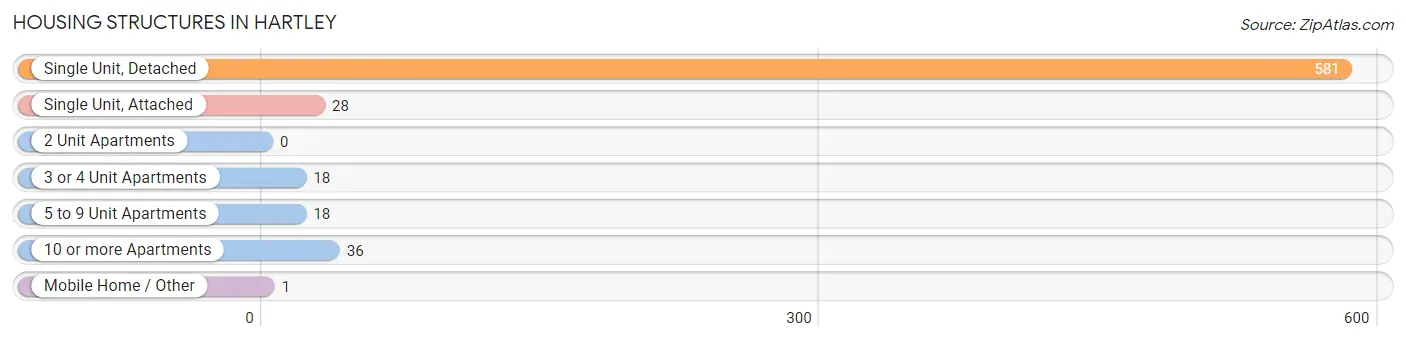
| Structure Type | # Housing Units | % Housing Units |
| Single Unit, Detached | 581 | 85.2% |
| Single Unit, Attached | 28 | 4.1% |
| 2 Unit Apartments | 0 | 0.0% |
| 3 or 4 Unit Apartments | 18 | 2.6% |
| 5 to 9 Unit Apartments | 18 | 2.6% |
| 10 or more Apartments | 36 | 5.3% |
| Mobile Home / Other | 1 | 0.2% |
| Total | 682 | 100.0% |
Housing Structures by Occupancy in Hartley
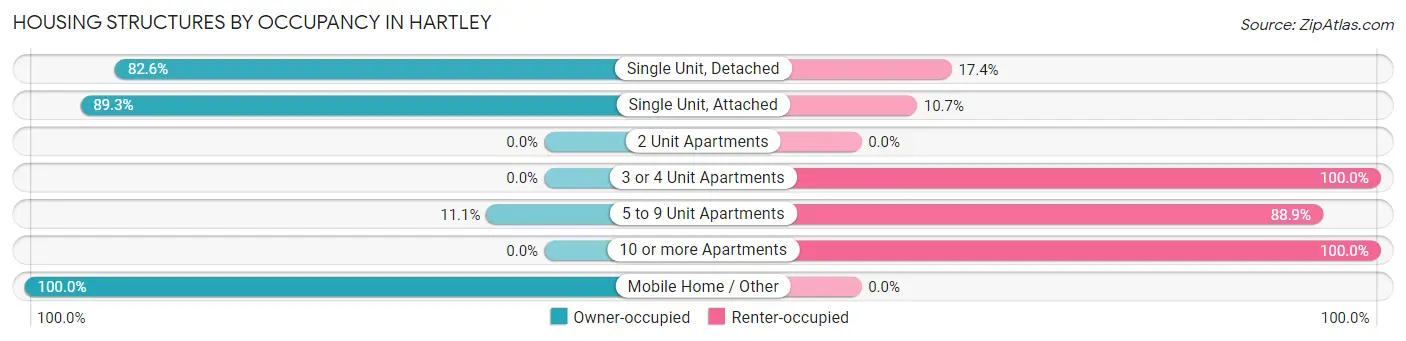
| Structure Type | Owner-occupied | Renter-occupied |
| Single Unit, Detached | 480 (82.6%) | 101 (17.4%) |
| Single Unit, Attached | 25 (89.3%) | 3 (10.7%) |
| 2 Unit Apartments | 0 (0.0%) | 0 (0.0%) |
| 3 or 4 Unit Apartments | 0 (0.0%) | 18 (100.0%) |
| 5 to 9 Unit Apartments | 2 (11.1%) | 16 (88.9%) |
| 10 or more Apartments | 0 (0.0%) | 36 (100.0%) |
| Mobile Home / Other | 1 (100.0%) | 0 (0.0%) |
| Total | 508 (74.5%) | 174 (25.5%) |
Housing Structures by Number of Rooms in Hartley
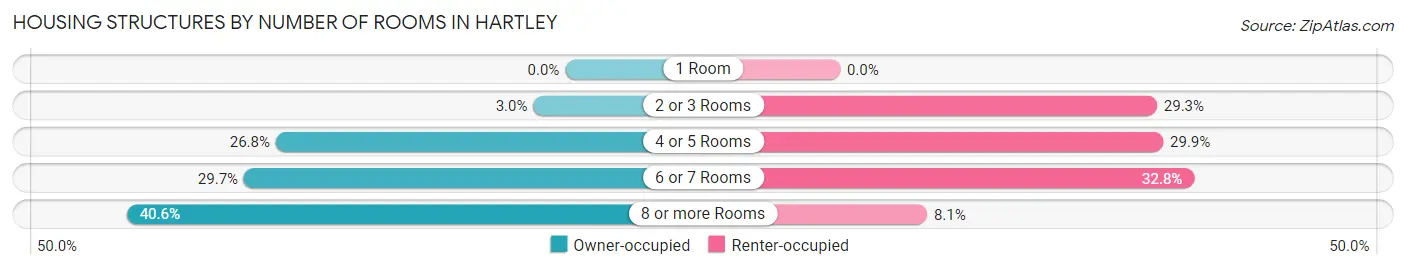
| Number of Rooms | Owner-occupied | Renter-occupied |
| 1 Room | 0 (0.0%) | 0 (0.0%) |
| 2 or 3 Rooms | 15 (2.9%) | 51 (29.3%) |
| 4 or 5 Rooms | 136 (26.8%) | 52 (29.9%) |
| 6 or 7 Rooms | 151 (29.7%) | 57 (32.8%) |
| 8 or more Rooms | 206 (40.6%) | 14 (8.1%) |
| Total | 508 (100.0%) | 174 (100.0%) |
Housing Structure by Heating Type in Hartley
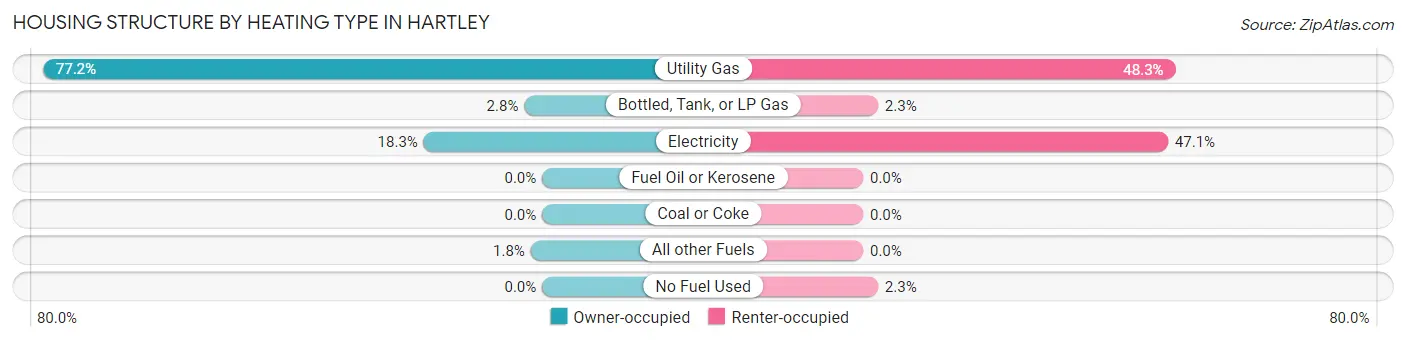
| Heating Type | Owner-occupied | Renter-occupied |
| Utility Gas | 392 (77.2%) | 84 (48.3%) |
| Bottled, Tank, or LP Gas | 14 (2.8%) | 4 (2.3%) |
| Electricity | 93 (18.3%) | 82 (47.1%) |
| Fuel Oil or Kerosene | 0 (0.0%) | 0 (0.0%) |
| Coal or Coke | 0 (0.0%) | 0 (0.0%) |
| All other Fuels | 9 (1.8%) | 0 (0.0%) |
| No Fuel Used | 0 (0.0%) | 4 (2.3%) |
| Total | 508 (100.0%) | 174 (100.0%) |
Household Vehicle Usage in Hartley
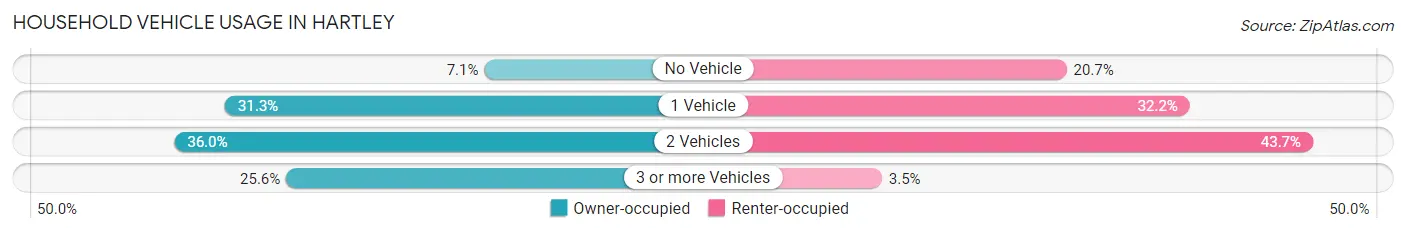
| Vehicles per Household | Owner-occupied | Renter-occupied |
| No Vehicle | 36 (7.1%) | 36 (20.7%) |
| 1 Vehicle | 159 (31.3%) | 56 (32.2%) |
| 2 Vehicles | 183 (36.0%) | 76 (43.7%) |
| 3 or more Vehicles | 130 (25.6%) | 6 (3.5%) |
| Total | 508 (100.0%) | 174 (100.0%) |
Real Estate & Mortgages in Hartley
Real Estate and Mortgage Overview in Hartley
| Characteristic | Without Mortgage | With Mortgage |
| Housing Units | 236 | 272 |
| Median Property Value | $89,400 | $98,900 |
| Median Household Income | $41,818 | $21 |
| Monthly Housing Costs | $463 | $0 |
| Real Estate Taxes | $1,067 | $0 |
Property Value by Mortgage Status in Hartley
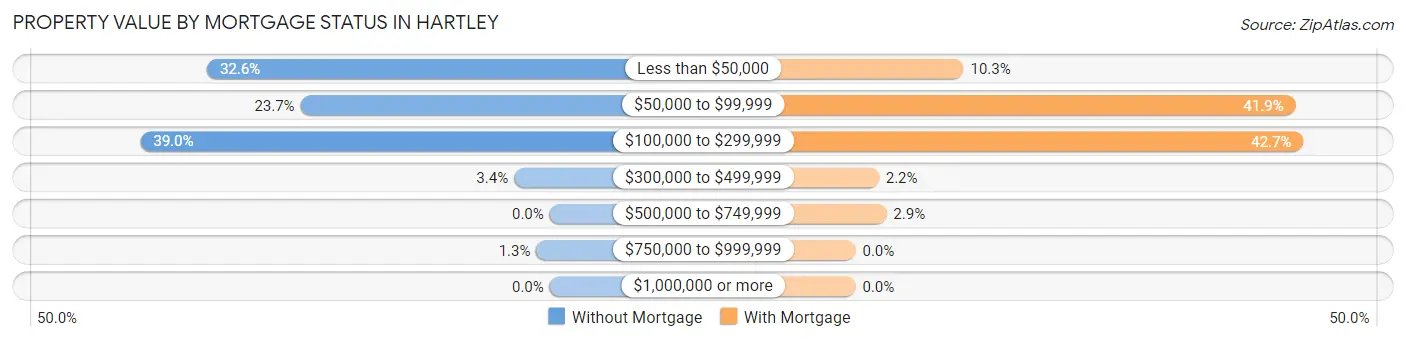
| Property Value | Without Mortgage | With Mortgage |
| Less than $50,000 | 77 (32.6%) | 28 (10.3%) |
| $50,000 to $99,999 | 56 (23.7%) | 114 (41.9%) |
| $100,000 to $299,999 | 92 (39.0%) | 116 (42.6%) |
| $300,000 to $499,999 | 8 (3.4%) | 6 (2.2%) |
| $500,000 to $749,999 | 0 (0.0%) | 8 (2.9%) |
| $750,000 to $999,999 | 3 (1.3%) | 0 (0.0%) |
| $1,000,000 or more | 0 (0.0%) | 0 (0.0%) |
| Total | 236 (100.0%) | 272 (100.0%) |
Household Income by Mortgage Status in Hartley
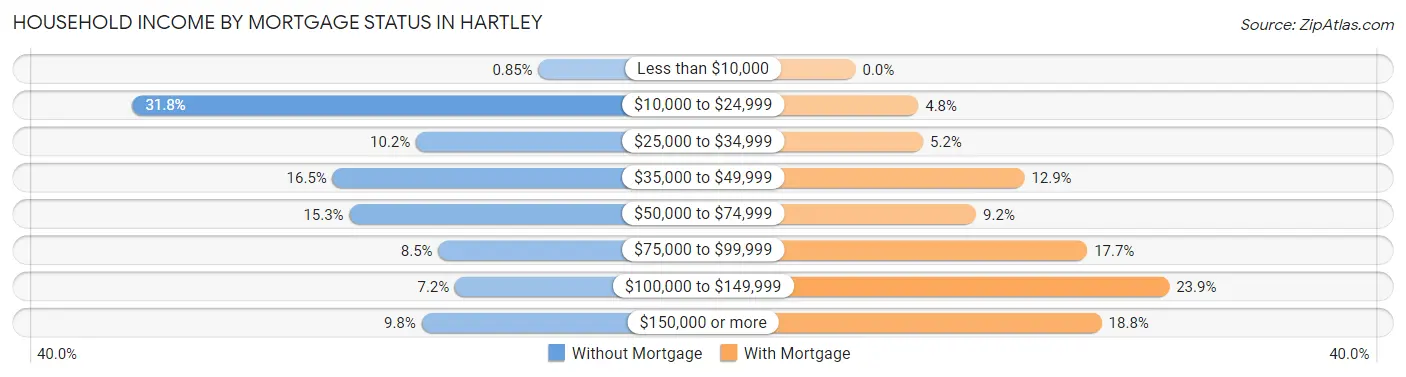
| Household Income | Without Mortgage | With Mortgage |
| Less than $10,000 | 2 (0.9%) | 0 (0.0%) |
| $10,000 to $24,999 | 75 (31.8%) | 13 (4.8%) |
| $25,000 to $34,999 | 24 (10.2%) | 14 (5.1%) |
| $35,000 to $49,999 | 39 (16.5%) | 35 (12.9%) |
| $50,000 to $74,999 | 36 (15.2%) | 25 (9.2%) |
| $75,000 to $99,999 | 20 (8.5%) | 48 (17.6%) |
| $100,000 to $149,999 | 17 (7.2%) | 65 (23.9%) |
| $150,000 or more | 23 (9.8%) | 51 (18.8%) |
| Total | 236 (100.0%) | 272 (100.0%) |
Property Value to Household Income Ratio in Hartley
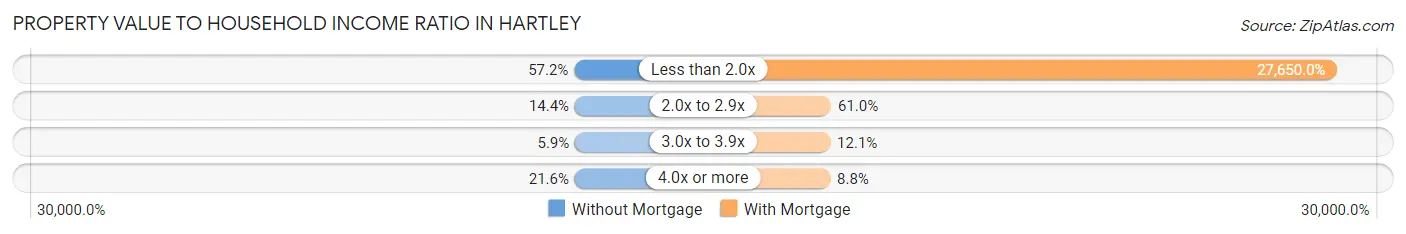
| Value-to-Income Ratio | Without Mortgage | With Mortgage |
| Less than 2.0x | 135 (57.2%) | 75,208 (27,650.0%) |
| 2.0x to 2.9x | 34 (14.4%) | 166 (61.0%) |
| 3.0x to 3.9x | 14 (5.9%) | 33 (12.1%) |
| 4.0x or more | 51 (21.6%) | 24 (8.8%) |
| Total | 236 (100.0%) | 272 (100.0%) |
Real Estate Taxes by Mortgage Status in Hartley
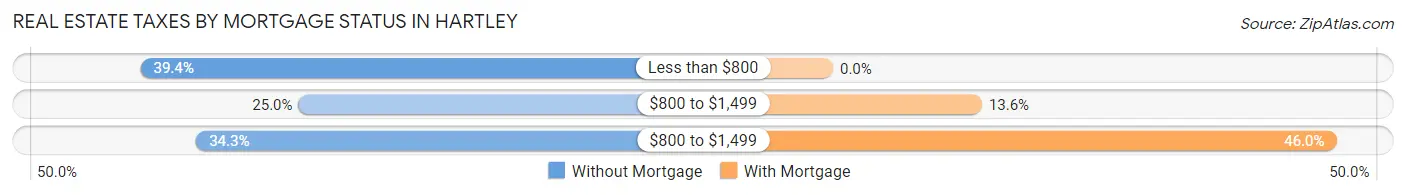
| Property Taxes | Without Mortgage | With Mortgage |
| Less than $800 | 93 (39.4%) | 0 (0.0%) |
| $800 to $1,499 | 59 (25.0%) | 37 (13.6%) |
| $800 to $1,499 | 81 (34.3%) | 125 (46.0%) |
| Total | 236 (100.0%) | 272 (100.0%) |
Health & Disability in Hartley
Health Insurance Coverage by Age in Hartley
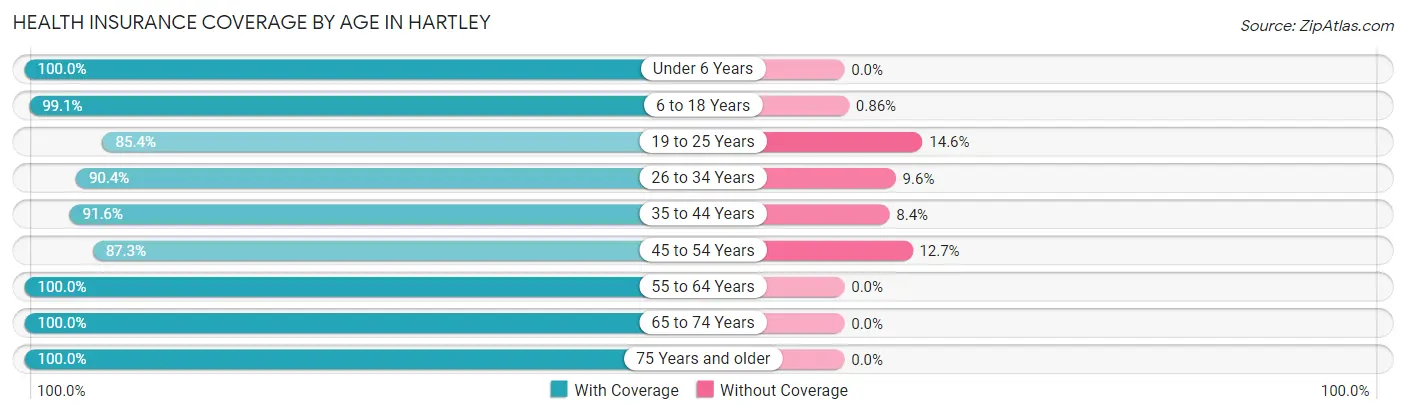
| Age Bracket | With Coverage | Without Coverage |
| Under 6 Years | 101 (100.0%) | 0 (0.0%) |
| 6 to 18 Years | 231 (99.1%) | 2 (0.9%) |
| 19 to 25 Years | 88 (85.4%) | 15 (14.6%) |
| 26 to 34 Years | 151 (90.4%) | 16 (9.6%) |
| 35 to 44 Years | 109 (91.6%) | 10 (8.4%) |
| 45 to 54 Years | 158 (87.3%) | 23 (12.7%) |
| 55 to 64 Years | 185 (100.0%) | 0 (0.0%) |
| 65 to 74 Years | 169 (100.0%) | 0 (0.0%) |
| 75 Years and older | 206 (100.0%) | 0 (0.0%) |
| Total | 1,398 (95.5%) | 66 (4.5%) |
Health Insurance Coverage by Citizenship Status in Hartley
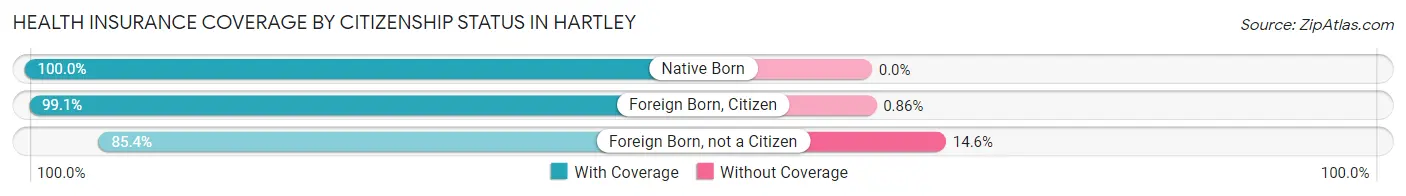
| Citizenship Status | With Coverage | Without Coverage |
| Native Born | 101 (100.0%) | 0 (0.0%) |
| Foreign Born, Citizen | 231 (99.1%) | 2 (0.9%) |
| Foreign Born, not a Citizen | 88 (85.4%) | 15 (14.6%) |
Health Insurance Coverage by Household Income in Hartley
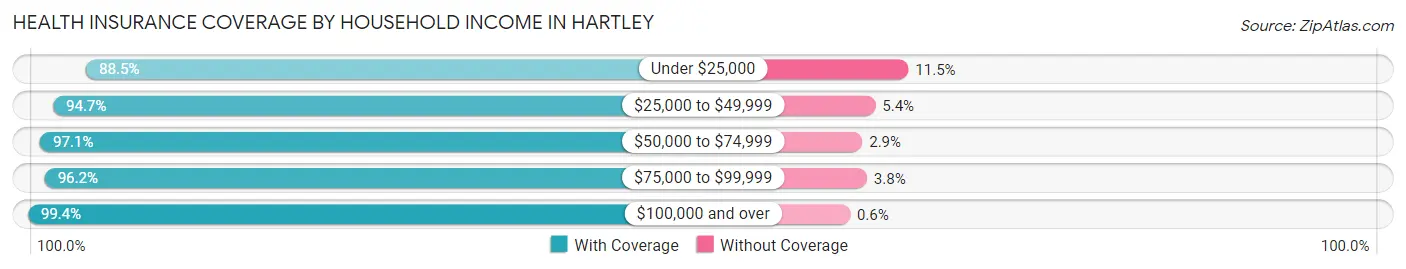
| Household Income | With Coverage | Without Coverage |
| Under $25,000 | 207 (88.5%) | 27 (11.5%) |
| $25,000 to $49,999 | 336 (94.7%) | 19 (5.3%) |
| $50,000 to $74,999 | 268 (97.1%) | 8 (2.9%) |
| $75,000 to $99,999 | 255 (96.2%) | 10 (3.8%) |
| $100,000 and over | 332 (99.4%) | 2 (0.6%) |
Public vs Private Health Insurance Coverage by Age in Hartley
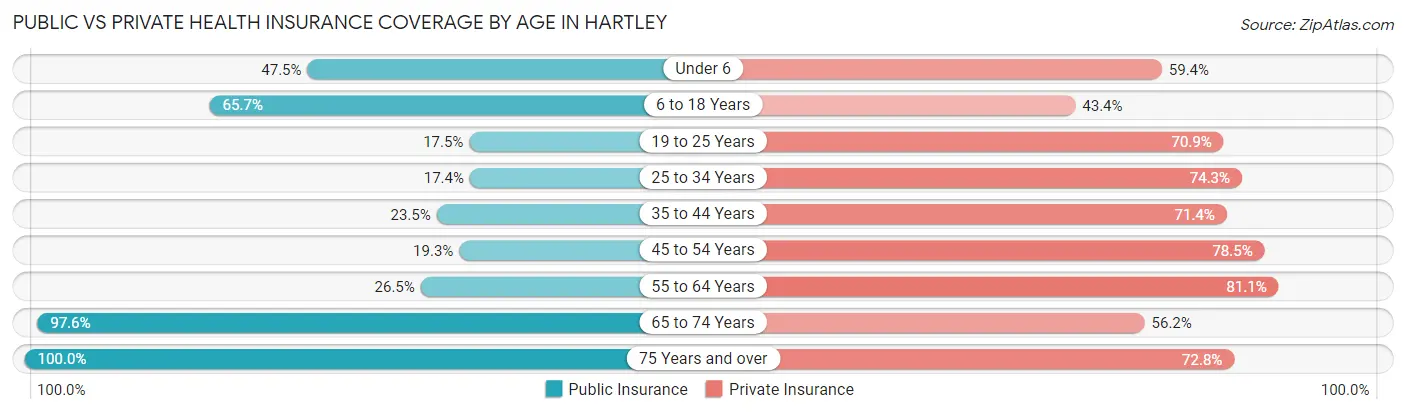
| Age Bracket | Public Insurance | Private Insurance |
| Under 6 | 48 (47.5%) | 60 (59.4%) |
| 6 to 18 Years | 153 (65.7%) | 101 (43.3%) |
| 19 to 25 Years | 18 (17.5%) | 73 (70.9%) |
| 25 to 34 Years | 29 (17.4%) | 124 (74.3%) |
| 35 to 44 Years | 28 (23.5%) | 85 (71.4%) |
| 45 to 54 Years | 35 (19.3%) | 142 (78.4%) |
| 55 to 64 Years | 49 (26.5%) | 150 (81.1%) |
| 65 to 74 Years | 165 (97.6%) | 95 (56.2%) |
| 75 Years and over | 206 (100.0%) | 150 (72.8%) |
| Total | 731 (49.9%) | 980 (66.9%) |
Disability Status by Sex by Age in Hartley
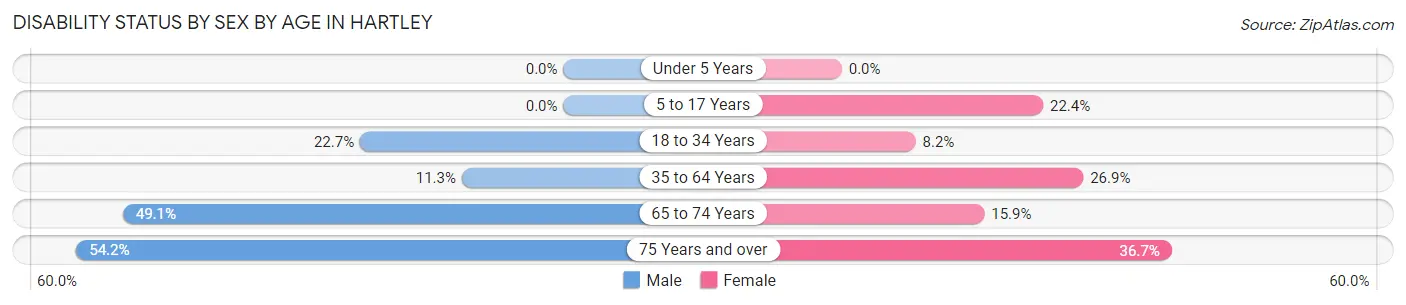
| Age Bracket | Male | Female |
| Under 5 Years | 0 (0.0%) | 0 (0.0%) |
| 5 to 17 Years | 0 (0.0%) | 26 (22.4%) |
| 18 to 34 Years | 41 (22.7%) | 12 (8.2%) |
| 35 to 64 Years | 25 (11.3%) | 71 (26.9%) |
| 65 to 74 Years | 52 (49.1%) | 10 (15.9%) |
| 75 Years and over | 32 (54.2%) | 54 (36.7%) |
Disability Class by Sex by Age in Hartley
Disability Class: Hearing Difficulty
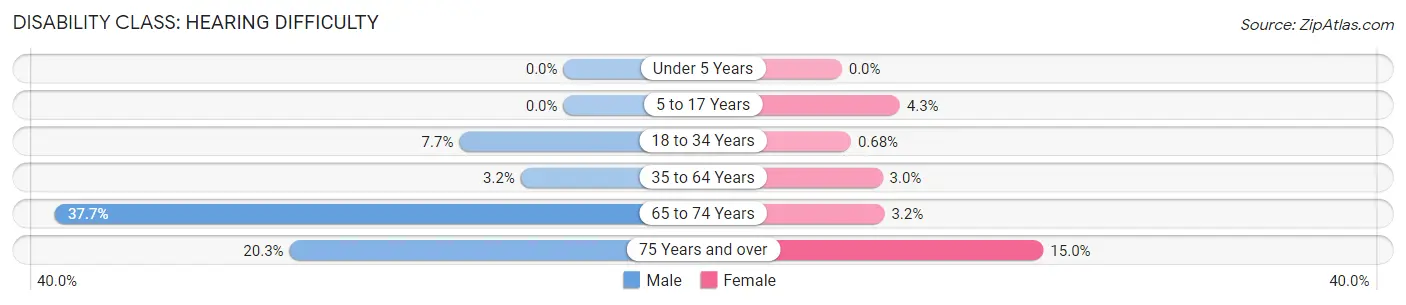
| Age Bracket | Male | Female |
| Under 5 Years | 0 (0.0%) | 0 (0.0%) |
| 5 to 17 Years | 0 (0.0%) | 5 (4.3%) |
| 18 to 34 Years | 14 (7.7%) | 1 (0.7%) |
| 35 to 64 Years | 7 (3.2%) | 8 (3.0%) |
| 65 to 74 Years | 40 (37.7%) | 2 (3.2%) |
| 75 Years and over | 12 (20.3%) | 22 (15.0%) |
Disability Class: Vision Difficulty
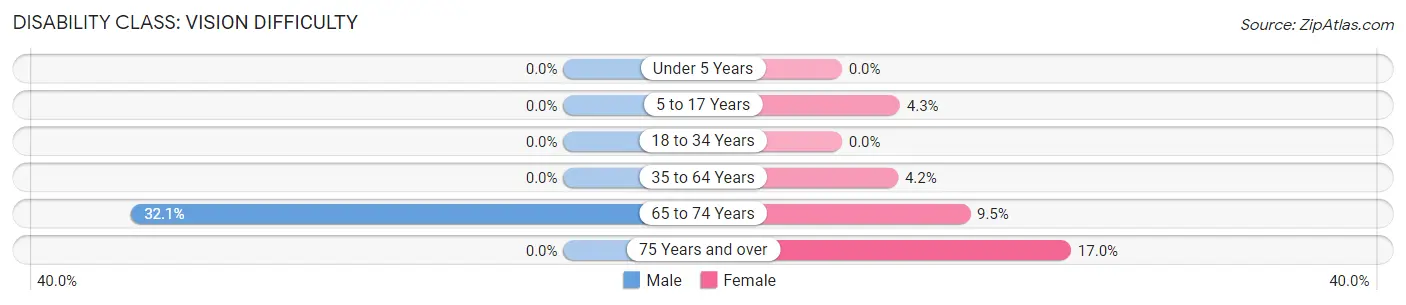
| Age Bracket | Male | Female |
| Under 5 Years | 0 (0.0%) | 0 (0.0%) |
| 5 to 17 Years | 0 (0.0%) | 5 (4.3%) |
| 18 to 34 Years | 0 (0.0%) | 0 (0.0%) |
| 35 to 64 Years | 0 (0.0%) | 11 (4.2%) |
| 65 to 74 Years | 34 (32.1%) | 6 (9.5%) |
| 75 Years and over | 0 (0.0%) | 25 (17.0%) |
Disability Class: Cognitive Difficulty
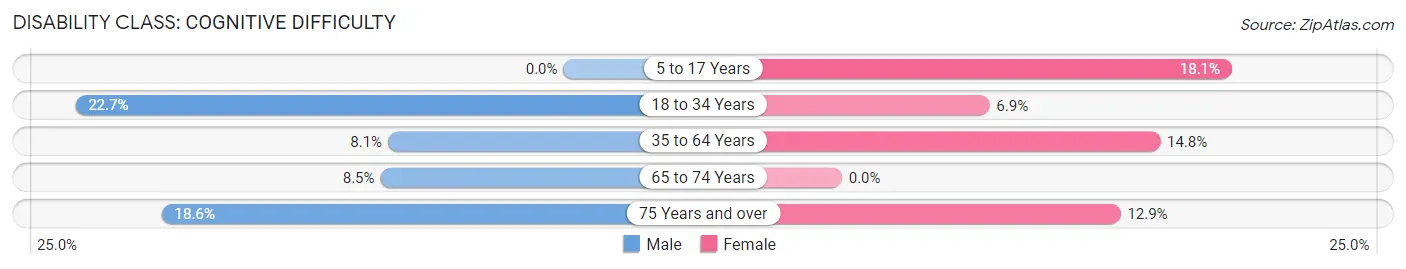
| Age Bracket | Male | Female |
| 5 to 17 Years | 0 (0.0%) | 21 (18.1%) |
| 18 to 34 Years | 41 (22.7%) | 10 (6.9%) |
| 35 to 64 Years | 18 (8.1%) | 39 (14.8%) |
| 65 to 74 Years | 9 (8.5%) | 0 (0.0%) |
| 75 Years and over | 11 (18.6%) | 19 (12.9%) |
Disability Class: Ambulatory Difficulty
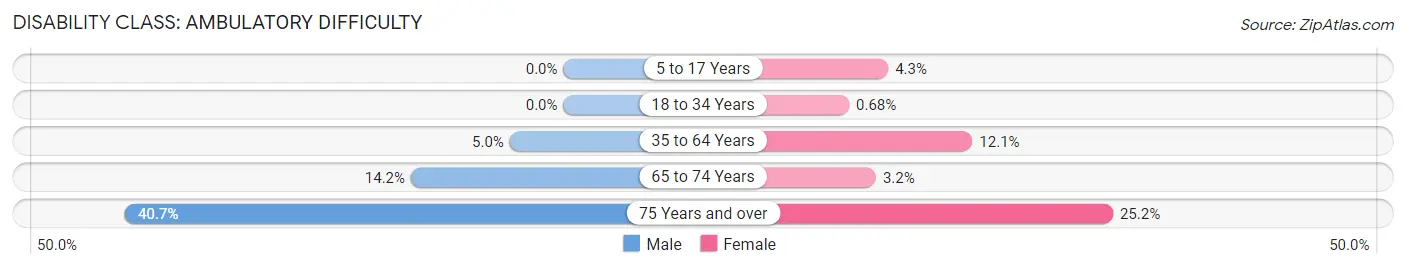
| Age Bracket | Male | Female |
| 5 to 17 Years | 0 (0.0%) | 5 (4.3%) |
| 18 to 34 Years | 0 (0.0%) | 1 (0.7%) |
| 35 to 64 Years | 11 (5.0%) | 32 (12.1%) |
| 65 to 74 Years | 15 (14.1%) | 2 (3.2%) |
| 75 Years and over | 24 (40.7%) | 37 (25.2%) |
Disability Class: Self-Care Difficulty
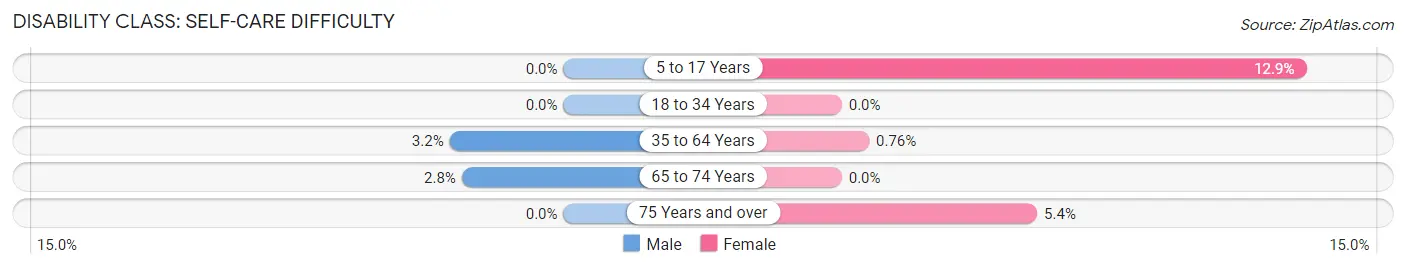
| Age Bracket | Male | Female |
| 5 to 17 Years | 0 (0.0%) | 15 (12.9%) |
| 18 to 34 Years | 0 (0.0%) | 0 (0.0%) |
| 35 to 64 Years | 7 (3.2%) | 2 (0.8%) |
| 65 to 74 Years | 3 (2.8%) | 0 (0.0%) |
| 75 Years and over | 0 (0.0%) | 8 (5.4%) |
Technology Access in Hartley
Computing Device Access in Hartley
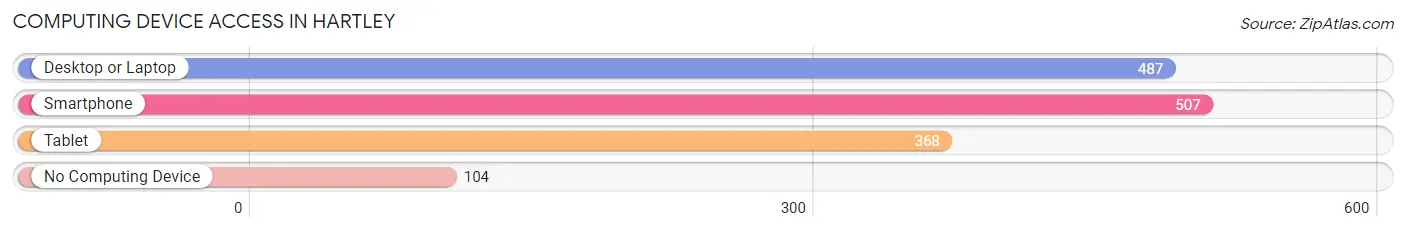
| Device Type | # Households | % Households |
| Desktop or Laptop | 487 | 71.4% |
| Smartphone | 507 | 74.3% |
| Tablet | 368 | 54.0% |
| No Computing Device | 104 | 15.2% |
| Total | 682 | 100.0% |
Internet Access in Hartley
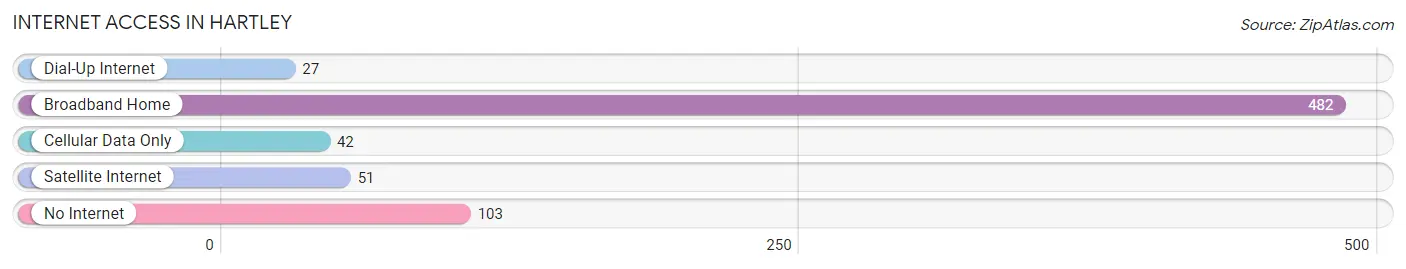
| Internet Type | # Households | % Households |
| Dial-Up Internet | 27 | 4.0% |
| Broadband Home | 482 | 70.7% |
| Cellular Data Only | 42 | 6.2% |
| Satellite Internet | 51 | 7.5% |
| No Internet | 103 | 15.1% |
| Total | 682 | 100.0% |
Hartley Summary
Hartley, Iowa is a small city located in the northwest corner of the state, in O’Brien County. It is situated on the Little Sioux River, and is the county seat. The city has a population of 1,845 people, according to the 2010 census.
History
Hartley was founded in 1881, when the Chicago, St. Paul, Minneapolis and Omaha Railway (CStPM&O) was built through the area. The town was named after the railroad’s president, William Hartley. The first settlers arrived in 1882, and the town was incorporated in 1883.
The town grew quickly, and by the turn of the century, it had become a thriving agricultural center. The town was home to several businesses, including a bank, a newspaper, a hotel, a creamery, and a lumberyard.
In the early 1900s, the town was hit hard by a series of floods. The worst of these was the Great Flood of 1903, which caused extensive damage to the town. Despite this, the town was able to rebuild and continue to grow.
In the 1920s, the town was connected to the rest of the state by the Lincoln Highway, which ran through the town. This helped to spur economic growth, and the town continued to grow throughout the 20th century.
Geography
Hartley is located in the northwest corner of Iowa, in O’Brien County. It is situated on the Little Sioux River, and is the county seat. The city has a total area of 1.3 square miles, all of which is land.
The city is located in the Loess Hills region of Iowa, and is surrounded by rolling hills and farmland. The city is located about 30 miles from the Minnesota border, and about 50 miles from the South Dakota border.
Economy
The economy of Hartley is largely based on agriculture. The town is home to several large farms, and the surrounding area is home to many smaller farms. The town is also home to several businesses, including a bank, a newspaper, a hotel, a creamery, and a lumberyard.
The town is also home to several manufacturing companies, including a furniture factory, a plastics factory, and a metal fabrication plant. The town is also home to several retail stores, including a grocery store, a hardware store, and a clothing store.
Demographics
According to the 2010 census, the population of Hartley was 1,845 people. The racial makeup of the town was 97.3% White, 0.3% African American, 0.2% Native American, 0.3% Asian, 0.1% Pacific Islander, 0.7% from other races, and 1.1% from two or more races. Hispanic or Latino of any race were 2.2% of the population.
The median household income in Hartley was $41,250, and the median family income was $50,000. The per capita income for the town was $19,845. About 8.3% of families and 10.2% of the population were below the poverty line, including 13.2% of those under age 18 and 8.2% of those age 65 or over.
Common Questions
What is Per Capita Income in Hartley?
Per Capita income in Hartley is $28,853.
What is the Median Family Income in Hartley?
Median Family Income in Hartley is $67,386.
What is the Median Household income in Hartley?
Median Household Income in Hartley is $48,088.
What is Income or Wage Gap in Hartley?
Income or Wage Gap in Hartley is 49.7%.
Women in Hartley earn 50.3 cents for every dollar earned by a man.
What is Family Income Deficit in Hartley?
Family Income Deficit in Hartley is $8,185.
Families that are below poverty line in Hartley earn $8,185 less on average than the poverty threshold level.
What is Inequality or Gini Index in Hartley?
Inequality or Gini Index in Hartley is 0.42.
What is the Total Population of Hartley?
Total Population of Hartley is 1,536.
What is the Total Male Population of Hartley?
Total Male Population of Hartley is 720.
What is the Total Female Population of Hartley?
Total Female Population of Hartley is 816.
What is the Ratio of Males per 100 Females in Hartley?
There are 88.24 Males per 100 Females in Hartley.
What is the Ratio of Females per 100 Males in Hartley?
There are 113.33 Females per 100 Males in Hartley.
What is the Median Population Age in Hartley?
Median Population Age in Hartley is 47.2 Years.
What is the Average Family Size in Hartley
Average Family Size in Hartley is 2.9 People.
What is the Average Household Size in Hartley
Average Household Size in Hartley is 2.1 People.
How Large is the Labor Force in Hartley?
There are 717 People in the Labor Forcein in Hartley.
What is the Percentage of People in the Labor Force in Hartley?
55.5% of People are in the Labor Force in Hartley.
What is the Unemployment Rate in Hartley?
Unemployment Rate in Hartley is 3.2%.