Zip Codes with the Highest Percentage of Population Employed in Life, Physical & Social Science in Iowa
RELATED REPORTS & OPTIONS
Life, Physical & Social Science
Iowa
Compare Zip Codes
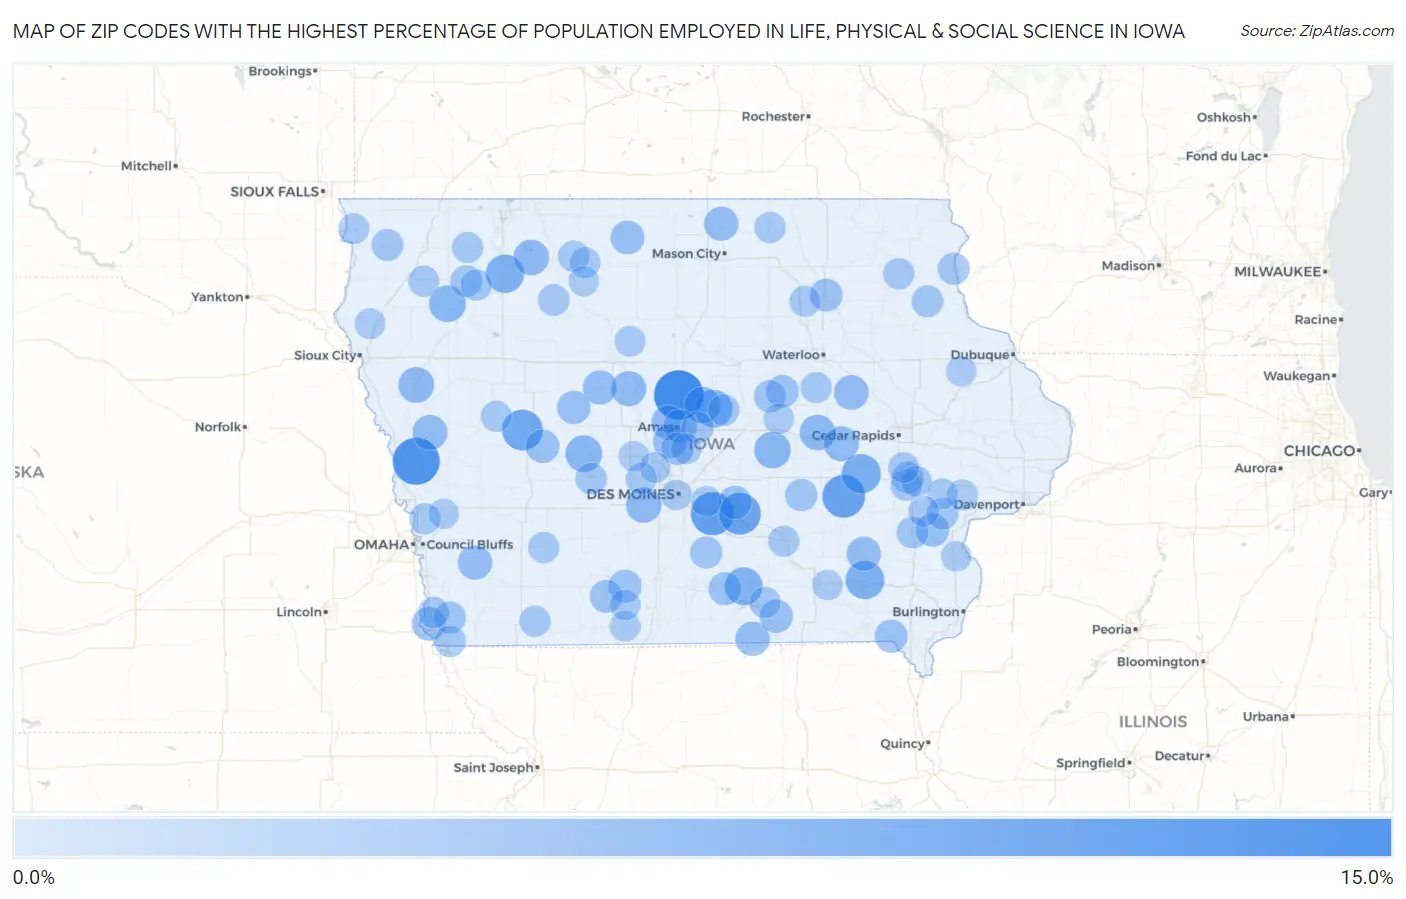
Map of Zip Codes with the Highest Percentage of Population Employed in Life, Physical & Social Science in Iowa
0.0%
15.0%
Zip Codes with the Highest Percentage of Population Employed in Life, Physical & Social Science in Iowa
| Zip Code | % Employed | vs State | vs National | |
| 1. | 50231 | 14.9% | 0.95%(+13.9)#1 | 1.1%(+13.8)#103 |
| 2. | 51564 | 13.2% | 0.95%(+12.2)#2 | 1.1%(+12.1)#129 |
| 3. | 50252 | 10.5% | 0.95%(+9.58)#3 | 1.1%(+9.44)#192 |
| 4. | 52308 | 10.3% | 0.95%(+9.35)#4 | 1.1%(+9.20)#202 |
| 5. | 50214 | 9.6% | 0.95%(+8.66)#5 | 1.1%(+8.52)#223 |
| 6. | 51444 | 9.0% | 0.95%(+8.01)#6 | 1.1%(+7.86)#261 |
| 7. | 52220 | 7.9% | 0.95%(+6.95)#7 | 1.1%(+6.80)#331 |
| 8. | 52557 | 7.5% | 0.95%(+6.53)#8 | 1.1%(+6.39)#365 |
| 9. | 51343 | 7.3% | 0.95%(+6.31)#9 | 1.1%(+6.17)#384 |
| 10. | 52569 | 7.0% | 0.95%(+6.01)#10 | 1.1%(+5.86)#414 |
| 11. | 50278 | 6.8% | 0.95%(+5.87)#11 | 1.1%(+5.72)#426 |
| 12. | 50026 | 6.2% | 0.95%(+5.30)#12 | 1.1%(+5.16)#510 |
| 13. | 51037 | 6.2% | 0.95%(+5.30)#13 | 1.1%(+5.16)#511 |
| 14. | 50106 | 6.1% | 0.95%(+5.18)#14 | 1.1%(+5.04)#529 |
| 15. | 50154 | 6.0% | 0.95%(+5.07)#15 | 1.1%(+4.92)#549 |
| 16. | 51044 | 5.6% | 0.95%(+4.61)#16 | 1.1%(+4.46)#614 |
| 17. | 52348 | 5.6% | 0.95%(+4.61)#17 | 1.1%(+4.46)#615 |
| 18. | 51358 | 5.5% | 0.95%(+4.56)#18 | 1.1%(+4.42)#626 |
| 19. | 50038 | 5.4% | 0.95%(+4.46)#19 | 1.1%(+4.31)#651 |
| 20. | 50530 | 5.1% | 0.95%(+4.19)#20 | 1.1%(+4.04)#725 |
| 21. | 51572 | 5.1% | 0.95%(+4.17)#21 | 1.1%(+4.03)#732 |
| 22. | 52257 | 5.0% | 0.95%(+4.09)#22 | 1.1%(+3.95)#754 |
| 23. | 52313 | 4.9% | 0.95%(+3.99)#23 | 1.1%(+3.84)#779 |
| 24. | 50014 | 4.8% | 0.95%(+3.86)#24 | 1.1%(+3.71)#817 |
| 25. | 51541 | 4.6% | 0.95%(+3.69)#25 | 1.1%(+3.55)#871 |
| 26. | 52549 | 4.6% | 0.95%(+3.66)#26 | 1.1%(+3.52)#879 |
| 27. | 52585 | 4.6% | 0.95%(+3.64)#27 | 1.1%(+3.50)#890 |
| 28. | 50448 | 4.6% | 0.95%(+3.62)#28 | 1.1%(+3.47)#899 |
| 29. | 50543 | 4.5% | 0.95%(+3.55)#29 | 1.1%(+3.40)#930 |
| 30. | 50134 | 4.4% | 0.95%(+3.45)#30 | 1.1%(+3.30)#967 |
| 31. | 51648 | 4.3% | 0.95%(+3.37)#31 | 1.1%(+3.22)#999 |
| 32. | 50480 | 4.2% | 0.95%(+3.30)#32 | 1.1%(+3.16)#1,025 |
| 33. | 50010 | 4.2% | 0.95%(+3.28)#33 | 1.1%(+3.14)#1,037 |
| 34. | 52739 | 4.1% | 0.95%(+3.20)#34 | 1.1%(+3.05)#1,076 |
| 35. | 52593 | 4.1% | 0.95%(+3.14)#35 | 1.1%(+2.99)#1,108 |
| 36. | 51440 | 4.1% | 0.95%(+3.11)#36 | 1.1%(+2.96)#1,120 |
| 37. | 50050 | 4.0% | 0.95%(+3.10)#37 | 1.1%(+2.96)#1,121 |
| 38. | 50170 | 4.0% | 0.95%(+3.10)#38 | 1.1%(+2.96)#1,125 |
| 39. | 50254 | 3.8% | 0.95%(+2.90)#39 | 1.1%(+2.76)#1,235 |
| 40. | 50238 | 3.8% | 0.95%(+2.89)#40 | 1.1%(+2.75)#1,239 |
| 41. | 52626 | 3.7% | 0.95%(+2.78)#41 | 1.1%(+2.63)#1,301 |
| 42. | 50861 | 3.7% | 0.95%(+2.76)#42 | 1.1%(+2.61)#1,312 |
| 43. | 50631 | 3.6% | 0.95%(+2.70)#43 | 1.1%(+2.56)#1,346 |
| 44. | 50652 | 3.6% | 0.95%(+2.69)#44 | 1.1%(+2.55)#1,351 |
| 45. | 50124 | 3.5% | 0.95%(+2.54)#45 | 1.1%(+2.39)#1,435 |
| 46. | 50609 | 3.3% | 0.95%(+2.38)#46 | 1.1%(+2.23)#1,558 |
| 47. | 50171 | 3.3% | 0.95%(+2.38)#47 | 1.1%(+2.23)#1,559 |
| 48. | 50139 | 3.2% | 0.95%(+2.29)#48 | 1.1%(+2.14)#1,641 |
| 49. | 51652 | 3.1% | 0.95%(+2.18)#49 | 1.1%(+2.03)#1,732 |
| 50. | 52158 | 3.1% | 0.95%(+2.16)#50 | 1.1%(+2.01)#1,752 |
| 51. | 50201 | 3.1% | 0.95%(+2.16)#51 | 1.1%(+2.01)#1,756 |
| 52. | 52766 | 3.0% | 0.95%(+2.10)#52 | 1.1%(+1.96)#1,821 |
| 53. | 51239 | 3.0% | 0.95%(+2.09)#53 | 1.1%(+1.94)#1,837 |
| 54. | 52043 | 3.0% | 0.95%(+2.09)#54 | 1.1%(+1.94)#1,840 |
| 55. | 52241 | 3.0% | 0.95%(+2.06)#55 | 1.1%(+1.91)#1,874 |
| 56. | 52201 | 3.0% | 0.95%(+2.03)#56 | 1.1%(+1.88)#1,911 |
| 57. | 51058 | 2.9% | 0.95%(+2.00)#57 | 1.1%(+1.86)#1,941 |
| 58. | 50546 | 2.9% | 0.95%(+1.95)#58 | 1.1%(+1.80)#2,005 |
| 59. | 50216 | 2.8% | 0.95%(+1.89)#59 | 1.1%(+1.75)#2,067 |
| 60. | 50239 | 2.8% | 0.95%(+1.87)#60 | 1.1%(+1.73)#2,100 |
| 61. | 52246 | 2.8% | 0.95%(+1.85)#61 | 1.1%(+1.71)#2,121 |
| 62. | 51047 | 2.7% | 0.95%(+1.80)#62 | 1.1%(+1.66)#2,181 |
| 63. | 51640 | 2.7% | 0.95%(+1.79)#63 | 1.1%(+1.65)#2,189 |
| 64. | 52135 | 2.7% | 0.95%(+1.79)#64 | 1.1%(+1.64)#2,202 |
| 65. | 51654 | 2.7% | 0.95%(+1.74)#65 | 1.1%(+1.59)#2,266 |
| 66. | 50853 | 2.7% | 0.95%(+1.71)#66 | 1.1%(+1.57)#2,299 |
| 67. | 50612 | 2.6% | 0.95%(+1.70)#67 | 1.1%(+1.56)#2,317 |
| 68. | 50461 | 2.6% | 0.95%(+1.69)#68 | 1.1%(+1.55)#2,329 |
| 69. | 50528 | 2.6% | 0.95%(+1.69)#69 | 1.1%(+1.54)#2,348 |
| 70. | 50063 | 2.6% | 0.95%(+1.68)#70 | 1.1%(+1.54)#2,354 |
| 71. | 52571 | 2.6% | 0.95%(+1.66)#71 | 1.1%(+1.52)#2,372 |
| 72. | 51542 | 2.6% | 0.95%(+1.66)#72 | 1.1%(+1.51)#2,383 |
| 73. | 50666 | 2.6% | 0.95%(+1.66)#73 | 1.1%(+1.51)#2,393 |
| 74. | 52534 | 2.6% | 0.95%(+1.65)#74 | 1.1%(+1.51)#2,399 |
| 75. | 51346 | 2.6% | 0.95%(+1.64)#75 | 1.1%(+1.50)#2,422 |
| 76. | 51646 | 2.6% | 0.95%(+1.63)#76 | 1.1%(+1.48)#2,446 |
| 77. | 51465 | 2.5% | 0.95%(+1.55)#77 | 1.1%(+1.41)#2,574 |
| 78. | 51022 | 2.4% | 0.95%(+1.50)#78 | 1.1%(+1.36)#2,664 |
| 79. | 52245 | 2.4% | 0.95%(+1.50)#79 | 1.1%(+1.36)#2,665 |
| 80. | 51240 | 2.4% | 0.95%(+1.48)#80 | 1.1%(+1.33)#2,709 |
| 81. | 52760 | 2.4% | 0.95%(+1.45)#81 | 1.1%(+1.31)#2,763 |
| 82. | 52776 | 2.4% | 0.95%(+1.45)#82 | 1.1%(+1.30)#2,765 |
| 83. | 52317 | 2.4% | 0.95%(+1.45)#83 | 1.1%(+1.30)#2,773 |
| 84. | 52755 | 2.4% | 0.95%(+1.43)#84 | 1.1%(+1.28)#2,807 |
| 85. | 50598 | 2.4% | 0.95%(+1.43)#85 | 1.1%(+1.28)#2,809 |
| 86. | 50109 | 2.3% | 0.95%(+1.38)#86 | 1.1%(+1.23)#2,888 |
| 87. | 50594 | 2.3% | 0.95%(+1.36)#87 | 1.1%(+1.22)#2,945 |
| 88. | 51038 | 2.3% | 0.95%(+1.35)#88 | 1.1%(+1.21)#2,970 |
| 89. | 50237 | 2.3% | 0.95%(+1.32)#89 | 1.1%(+1.17)#3,034 |
| 90. | 50046 | 2.3% | 0.95%(+1.31)#90 | 1.1%(+1.17)#3,043 |
| 91. | 50133 | 2.3% | 0.95%(+1.31)#91 | 1.1%(+1.16)#3,051 |
| 92. | 50074 | 2.2% | 0.95%(+1.30)#92 | 1.1%(+1.16)#3,070 |
| 93. | 50039 | 2.2% | 0.95%(+1.22)#93 | 1.1%(+1.08)#3,264 |
| 94. | 52530 | 2.1% | 0.95%(+1.20)#94 | 1.1%(+1.06)#3,311 |
| 95. | 50309 | 2.1% | 0.95%(+1.18)#95 | 1.1%(+1.04)#3,347 |
| 96. | 50597 | 2.1% | 0.95%(+1.18)#96 | 1.1%(+1.03)#3,358 |
| 97. | 50632 | 2.1% | 0.95%(+1.18)#97 | 1.1%(+1.03)#3,364 |
| 98. | 51559 | 2.1% | 0.95%(+1.14)#98 | 1.1%(+0.998)#3,449 |
| 99. | 52078 | 2.1% | 0.95%(+1.12)#99 | 1.1%(+0.973)#3,505 |
| 100. | 52653 | 2.0% | 0.95%(+1.10)#100 | 1.1%(+0.956)#3,551 |
Common Questions
What are the Top 10 Zip Codes with the Highest Percentage of Population Employed in Life, Physical & Social Science in Iowa?
Top 10 Zip Codes with the Highest Percentage of Population Employed in Life, Physical & Social Science in Iowa are:
What zip code has the Highest Percentage of Population Employed in Life, Physical & Social Science in Iowa?
50231 has the Highest Percentage of Population Employed in Life, Physical & Social Science in Iowa with 14.9%.
What is the Percentage of Population Employed in Life, Physical & Social Science in the State of Iowa?
Percentage of Population Employed in Life, Physical & Social Science in Iowa is 0.95%.
What is the Percentage of Population Employed in Life, Physical & Social Science in the United States?
Percentage of Population Employed in Life, Physical & Social Science in the United States is 1.1%.